Abstract
Clustering techniques can group genes based on similarity in biological functions. However, the drawback of using clustering techniques is the inability to identify an optimal number of potential clusters beforehand. Several existing optimization techniques can address the issue. Besides, clustering validation can predict the possible number of potential clusters and hence increase the chances of identifying biologically informative genes. This paper reviews and provides examples of existing methods for clustering genes, optimization of the objective function, and clustering validation. Clustering techniques can be categorized into partitioning, hierarchical, grid-based, and density-based techniques. We also highlight the advantages and the disadvantages of each category. To optimize the objective function, here we introduce the swarm intelligence technique and compare the performances of other methods. Moreover, we discuss the differences of measurements between internal and external criteria to validate a cluster quality. We also investigate the performance of several clustering techniques by applying them on a leukemia dataset. The results show that grid-based clustering techniques provide better classification accuracy; however, partitioning clustering techniques are superior in identifying prognostic markers of leukemia. Therefore, this review suggests combining clustering techniques such as CLIQUE and k-means to yield high-quality gene clusters.
1. Introduction
Analysis of gene expression levels is essential in studying and detecting genes functions. According to Chandra and Tripathi [1], genes that have similar gene expression levels are likely to involve similar biological functions. The authors showed that the clustering process was quite useful to identify co-expressed genes in a group of genes and, in addition, to detect unique genes in different groups. Therefore, clustering can be quite helpful to extract valuable knowledge from a large amount of biological data [2], which could lead to prevention, prognosis, and treatment in biomedical research.
Cai et al. [3] developed a random walk-based technique to cluster similar genes. The authors show that the proposed method was useful in strengthening the interaction between genes by considering the types of interactions that exist in the same group of genes. Many previous random walk-based methods managed to extract local information from a large graph without knowledge of the whole graph data [4]. In a random walk-based method, a gene is important if it interacts with many other genes [5,6,7,8]. As illustrated in Figure 1, gene 1 has a higher degree than gene 2 (two outgoing links) compared to one outgoing link from gene 3 to gene 4. In this case, gene 1 is the most important gene among the four genes shown in the hypothetical gene network.
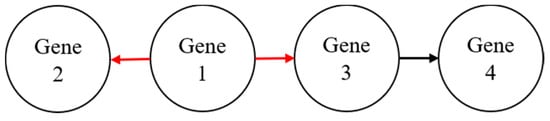
Figure 1.
A hypothetical gene network to illustrate the importance of genes in a random walk.
Several previous studies have noted the importance of clustering to identify co-expressed genes in a cluster and inactive genes in another cluster [1,9]. Clustering can also discover the fundamental hidden structure of biomedical data, which can be used for diagnosis and treatments [9]. In addition, clustering is extremely vital for identifying cancer subtyping and the detection of the tumor.
Researchers typically focus on clustering by assuming the number of clusters beforehand, which can be seen in [10,11]. This problem can lead to the inability of the clustering techniques to obtain an optimal number of centroids and hence results in poor quality of clusters [11,12]. In previous studies, several proposed approaches managed to discover the optimal number of clusters by simply tuning and optimizing the parameters of the clustering method. This can be done by repeating the process of analyzing the eigenvalues of the affinity matrix, which are equal to the number of desired clusters [13]. In addition, rotating normalized eigenvectors and squared-loss mutual information (SMI) can be employed in the clustering process to obtain an optimal number of clusters [14,15]. Besides, the elbow method and the average silhouette method are the other examples to identify the optimal number of clusters in previous studies [15,16]. The elbow method identifies the optimal number of clusters by calculating sum of squared error for each number of clusters (k) from a range of k values. The average silhouette method computes the average silhouette values of genes for different values of k (number of clusters). Then, this method selects the optimal number of clusters that has the maximum average silhouette values from the range of k values. Optimization of the objective function and validation of clustering can improve the quality of clusters [11]. The optimization for the objective function of clustering can identify the best solution among a set of solutions. On the other hand, clustering validation is used to determine clusters in the data using an appropriate measurement [17]. Clustering validation can also evaluate the goodness of the clustering structure based on the given class labels [18]. Thus, validation is an essential step because it assists in the identification of which cluster is more informative compared to other clusters [19].
This paper focuses on reviewing existing computational methods on genes clustering using the notion of optimizing the objective function and validation.
2. Gene Network Clustering Techniques
In general, clustering can be categorized into partitioning, hierarchical, grid-based, and density-based techniques [11,17,20,21,22]. In Table 1, we show differences among categories of clustering techniques. The table also provides some information such as time complexity, computing efficiency, convergence rate, scalability, and initialization of cluster number. Partitioning clustering assigns the data objects into a number of clusters fixed beforehand. This technique identifies the number of centroids and assigns the objects to the nearest centroid. Hierarchical clustering groups the data based on the distance of the objects to form clusters. This technique can be either started with large data and aggregated into a small group or started from a small group of data and merged until all the data are in one large group. Grid-based clustering divides each dimension of data space to form a grid structure. Density-based clustering separates the data according to the density of the objects. Traditionally, hierarchical, grid-based, and density-based techniques do not require cluster number as an input parameter [20,23]. In the view of Jain [17], hierarchical clustering is more versatile than partitioning clustering. With the discovery of clusters with good robustness and flexibility, grid-based and density-based techniques have been particularly useful [24]. They are also helpful for dealing with large spatial data and the proper use of expert knowledge. Grid-based and density-based techniques also aim to identify data densities and to split the data space into grid structures when looking for groupings [25]. Grid-based clustering techniques are more efficient compared to density-based clustering techniques; however, the use of summarized information makes these techniques lose effectiveness in cases where the number of dimensions increases [26].

Table 1.
Differences among categories of clustering techniques.
In Table 2, we present several examples of clustering techniques done by previous researchers. The table also summarizes the advantages and the disadvantages of the techniques. From this table, k-means clustering is the most popular technique, even though k-means suffers from the shortcoming of identifying the number of potential clusters before the clustering setup.
Table 2.
Examples of popular clustering techniques along with their advantages and disadvantages.
According to the reviewed clustering techniques in Table 2, this experimental work aims to investigate which category of clustering techniques would perform better in clustering genes. Gene expression data from the leukemia microarray study by Golub et al. [49] are used in this study. These data consist of 3051 genes, 38 tumor mRNA samples [27 acute lymphoblastic leukemia (ALL) and 11 acute myeloid leukemia (AML)] [50]. The clustering techniques investigated in this experimental work are k-means clustering (partitioning), agglomerative nesting (AGNES) (hierarchical), clustering in quest (CLIQUE) (grid-based), and density-based spatial clustering of applications with noise (DBSCAN) (density-based). The results in terms of percentage of accuracy are shown in Table 3. The experimental work was carried out using stratified ten-fold cross-validation and a support vector machine as a classifier. The selected clusters in Table 3 were validated based on silhouette width. According to Table 3, the CLIQUE was able to achieve the highest classification accuracy when applied on the leukemia dataset compared to other clustering techniques. In addition, Table 3 also shows several genes were biologically validated as prognostic markers for leukemia when PubMed text mining was used. Prognostic marker was commonly used to differentiate between good or poor disease outcomes [51]. This validation was done to show the relationship between genes and prognostic markers of leukemia [52]. Although CLIQUE achieved the best classification accuracy, the technique identified 67 genes as prognostic markers of leukemia out of 919 genes in the selected cluster. On the other hand, k-means had the best performance in identifying prognostic markers of leukemia (8%). The remaining techniques were able to achieve between 6% and 8% in determining the prognostic markers of leukemia over the number of genes in the selected clusters.
Table 3.
Comparative results of the clustering technique applied on leukemia gene expression data.
2.1. Category 1: Partitioning Clustering
Detection of clusters using partitioning clustering has low time complexity and high computational cost [53]. However, there are specific problems related to this technique. One of these problems is detecting clusters inappropriate for non-convex data. This could be because clustering techniques cannot spatially separate the data [54]. Other disadvantages are the need to initialize the number of clusters beforehand, and that the clustering result is sensitive to the intended number of possible clusters. Fuzzy C Means (FCM), k-means clustering, Partitioning Around Medoids (PAM), and Self-Organizing Maps (SOM) are all examples of partitioning clustering [9,10,11,12,27,28,29,30,31,32,33,34,35,36,37,38]. PAM is a variation of k-means clustering [55], and it is more robust in terms of accuracy compared to k-means clustering, for instance, when applied to classify cancer types [56,57].
2.2. Category 2: Hierarchical Clustering
Hierarchical clustering’s scalability is relatively high in cluster detection [53]. One benefit of the method is that it can detect the hierarchical relationship among clusters easily. However, the major drawback associated with hierarchical clustering is the high computational cost. Agglomerative (bottom-up) and divisive (top-down) are the categories of hierarchical clustering [2,35,58]. The way of merging clusters and identification of the node levels can differentiate between agglomerative and divisive hierarchical clustering [58]. Agglomerative hierarchical clustering (AHC) combines the most adjacent pair of clusters, forming a group from bottom to top [59]. Several strategies of AHC are used to identify the distance between clusters, which are single linkage, complete linkage, centroid linkage, average linkage, Ward’s method, and the probability-based method [25,58,59]. On the other hand, divisive hierarchical clustering is useful to identify clusters with different densities and shapes [58,59]. The method starts from all samples in a group and then splits the samples into two sub-clusters, which are then divided into further sub-clusters and so on [58]. For AHC, node-level is the diameter of a new cluster formed at the splitting step. The node-level of divisive methods is to divide the groups based on their diameters. Agglomerative nesting (AGNES), EISEN clustering, and divisive analysis (DIANA) are examples of hierarchical clustering [19,34]. Garzón and González [19] used these clustering techniques to group similar genes before the step of the gene selection.
2.3. Category 3: Grid-Based Clustering
The design of grid-based clustering divides the entire data space into multiple, non-overlapping grid structures [24,59]. This method performs faster than density-based clustering. Grid-based clustering can benefit from dividing the data space into grids to reduce its time complexity [22,60]. CLIQUE, grid-clustering technique for high-dimensional very large spatial databases (GCHL), and statistical information grid (STING) are examples of grid-based clustering [39,40,41,42,43]. The GCHL technique can discover concave (deeper) and convex (higher) regions when applied in medical and geographical fields and by using the average eight direction (AED) technique [26,41]. However, both techniques struggle to identify complex clusters from high dimensional data. CLIQUE partitions the data space into cells and searches subspaces by counting the number of points in each cell [61]. Searching a suitable set of dimensions for each cluster can form the candidate subspace for the centroid of the cluster. Different groups of points are clustered in different subspaces [62].
2.4. Category 4: Density-Based Clustering
Usually, the regions contain points with high density in the data space, which makes density-based clustering mistake them as clusters [59]. Mechanisms of aggregation in density can characterize the clustering [45]. A significant advantage of density-based clustering is that it can discover differently shaped clusters and noise from data [22,24,63]. However, density-based clustering has a high runtime analysis to detect clusters [64]. DBSCAN, random walk, and Relative Core Merge (RECOME) are examples of density-based clustering [44,45,46,47,48]. Historically, a random walk uses the theory of Markov chain [48,65]. In most studies, the random walk has been used to infer and to optimize the structural properties of networks [65,66]. Much of the current literature on the random walk is on ranking the genes concerning their specific probabilities from high to low [67,68]. In literature, a random walk mostly uses the topological similarity in networks to identify genes with a similar disease.
3. Optimization for Objective Function of Partitioning Clustering Techniques
Optimization for objective function can improve the efficiency of partitioning clustering techniques during initialization of the intended cluster number [11,33]. Swarm intelligence is widely used as the objective function for a clustering problem. The number of intended clusters can be predicted based on the typical search of the patterns [69,70]. Swarm intelligence can also be applied through maximizing or minimizing the objective function of clustering [69,71,72]. In most studies, swarm intelligence has been mostly used in the field of optimization [73,74].
Swarm intelligence refers to the collective behavior of decentralized, self-organized systems of living creatures. The swarm intelligence systems consist typically of a population of simple agents or boids interacting locally with one another and with their environment. The inspiration often comes from nature, especially biological systems [75,76].
For modeling the behavior of a swarm, the techniques are made up of animals and insects, such as bees, ants, birds, fishes, and so on [74,77]. Most recent studies used swarm intelligence to solve problematic real-world problems such as networking, traffic routing, robotics, economics, industry, games, etc. [73,74]. Hence, clustering techniques can benefit from swarm intelligence [74].
Swarm intelligence can optimize the objective function of clustering based on population and evolution strategies [11,33]. This function is usually used to determine the fitness of each particle since the community has a set of particles (known as a swarm), and each particle represents a solution. Table 4 compares the use of optimization in population and evolution strategies. Both optimization strategies are designed to imitate the best features in nature and produce a better quality of solution efficiently [78,79]. Previous studies have explored the use of optimization in a generation with more than 1000 populations before the convergence step, but it was not computationally efficient [80].
Table 4.
Comparison of the use of optimization between population and evolution strategies.
Table 5 summarizes existing techniques of swarm intelligence based on the strategies together with their usages. Xu et al. [81] found particle swarm optimization (PSO) is faster than both artificial bee colony (ABC) and genetic algorithm (GA) because PSO can perform without any complicated evolution. Previous studies have also shown some drawbacks of ABC, which are the limited ability of exploitation, slow convergence speed, and low-quality solutions [82]. In the review of GA and PSO algorithms, Gandomi et al. [79] identified the main purposes of these techniques, which solved significant problems faster.
Table 5.
Summary of existing techniques of swarm intelligence.
3.1. Strategy 1: Population-Based Optimization
Population-based optimization is performed in terms of exploration and exploitation [69,100]. Exploration is the technique able to reach the best solution within the search space, while exploitation expresses the ability of the technique to reach a global optimum solution. Metaheuristic search can apply in this optimization for global optimal solutions using informative parameters. However, the optimization still has difficultly avoiding the problems of local minima and early convergence [11,33,101]. Several examples of population-based optimization are reviewed, which are ant colony optimization (ACO), ant lion optimization (ALO), firefly algorithm (FA), and particle swarm optimization (PSO) [11,33,70,71,77,81,83,86,89].
In the literature related to PSO, most previous studies used PSO because it does not have any complex evolution [81]. Fister et al. [70] found that FA is suitable for multi-modal optimization and fast convergence.
3.2. Strategy 2: Evolution-Based Optimization
Evolution-based optimization is involved in the processes of selection, recombination, and mutation [102]. The selection of evolution strategy fails to deal with changing environments, and it threatens the self-adaptation with its control parameters (internal model) [103,104]. For recombination processes (in terms of discrete and intermediate processes), it performs with control parameters on object variables, standard deviations, and rotation angles. The mutation mechanism makes the techniques evolve its control parameters (standard deviations and covariances). Evolution-based optimization can optimize the mathematical functions of the technique with continuously changeable parameters and extend to solve discrete optimization problems. This strategy can deliver a high quality of solutions and allows the technique to move toward better solutions in the search space with a population [105,106]. GA is one of the techniques using evolution strategy, which is commonly used for clustering based on selection, crossover, and mutation. In previous studies, most algorithms were derived from GA, such as evolution strategy (ES) and evolutionary programming (EP) [92]. The memetic algorithm is the extension of GA and includes local search optimization for problem-solving [97,98,99]. Genetic programming (GP), on the other hand, is the extension of GA that has been successfully applied and used to solve many problems [95,96]. Moreover, gene expression programming (GEP) uses the character of linear chromosomes and has been applied in symbolic regression and block stacking [93,94].
4. Clustering Validation in Measurements
Previous studies have evaluated the identified gene clustering in terms of distance [1]. If they are not within a distance regarding a specified gene in each experimental condition, then the specified gene is classified as an inactive gene. Otherwise, the specified gene is co-expressed.
Clustering validation can be measured in terms of internal and external criteria [17,18,100,107]. Table 6 summarizes the differences between internal and external validations. In general, internal criteria can assess the fitness between clustering structure and data. External criteria can measure the performance by matching cluster structure to prior information. As mentioned by Handl et al. [23], internal validation suffers from bias regarding clusters number and partitioning structure from data. The goal of internal validation is measured based on compactness and separation [18,107]. Compactness is defined as a measure of how close the objects are in a cluster based on variance. Separation measures either how a cluster is distinct or how well separated it is from other clusters. Handl et al. [23] held the view that external validation can suffer from biases in a partitioning according to cluster number and distribution of groups with class sizes.
Table 6.
The difference in measurements between internal and external validations.
Table 7 sets out examples of measurements to validate the quality of clusters. As can be seen from the table, previous studies commonly used Euclidean distance and silhouette width. In general, silhouette width can validate the clustering performance in terms of pairwise difference between and within cluster distances [18,107]. The maximum values of the silhouette width can identify an optimal number of clusters.
Table 7.
Examples of previous studies in clustering validation.
5. Discussion
An efficient clustering technique is the one capable of extracting useful information about the behavior of a gene. According to Oyelade et al. [114], ensemble clustering (a combination of two or more phases of clustering) can generate more robust and better quality clusters compared to single clustering. Table 8 summarizes the ensemble methods for clustering that were used by previous researchers. In addition, Oyelade et al. [114] also showed that hierarchical clustering is more suitable to handle real datasets, such as image data, compared to partitioning clustering, but it is computationally expensive. Advanced technological developments can isolate a large group of cells. Biological data can provide a better understanding of the complex biological processes. For example, single-cell RNA sequencing can help to expose biological processes and medical insights [115]. The k-means clustering typically performs better than hierarchical clustering in smaller datasets, but it requires a long computational time [114,115]. Other than that, large amounts of bulk data can address biological dynamics and cancer heterogeneity. Tang et al. [115] proposed High-order Correlation Integration (HCI), which uses k-means clustering and Pearson’s correlation coefficient in the experiments. Their results showed that HCI outperforms the existing methods (k-means clustering and hierarchical clustering) under single-cell and bulk RNA-seq datasets. Unsupervised clustering is one of the powerful techniques used in single-cell RNA sequencing to define cell types based on the transcriptome [116]. Fully unsupervised clustering techniques (e.g., intelligent k-means and kernel k-means) are applied to analyze genes in colorectal carcinoma [117]. Other than that, random walk-based clustering, GCHL, and CLIQUE clustering techniques are also used in unsupervised manners [26,41,46,47,48,61,67].
Table 8.
Summary of the existing ensemble methods used in clustering.
The purpose of optimization for objective function and validation is to achieve quality clusters. Most of the previous studies used swarm intelligence to optimize the parameters of clustering techniques and to identify the optimal number of possible clusters [118]. The objective function of clustering techniques defines optimization as maximizing the accuracy of the centroid or the cluster center, especially for partitioning clustering techniques. It is because partitioning clustering needs to initialize either the number of clusters or the number of centroids beforehand. Furthermore, clustering validation is also essential to measure within or between the identified clusters [19].
In this research, leukemia data containing 3051 genes and 38 samples [49] were used to evaluate the performance of each clustering techniques category. The genes obtained by the clustering techniques were different from one technique category to another; however, the number of target clusters was the same among the techniques. As a result, the grid-based clustering technique provided higher classification accuracy than other clustering techniques. The technique was able to identify 7.29% of the prognostic markers in leukemia data. On the other hand, k-means clustering achieved the highest percentage (8%) of identifying prognostic markers in leukemia, but the classification accuracy in this case was quite poor.
A summary of optimal cluster analysis studied by previous researchers is shown in Table 9. According to the table, k-means clustering was the most used in the research. Integration of optimization is critical to its use in research because it can solve the issue of k-means clustering that requires initializing the number of clusters beforehand [10,11].
Table 9.
Summary of optimal cluster analysis.
6. Conclusions
In summary, this paper reviewed examples of existing computational methods for clustering genes with similar biological functions. As a result, we found that partitioning, hierarchical, grid-based, and density-based are the categories of clustering techniques. Clustering can identify a high-quality cluster that is helpful in biological mechanisms and could lead to the identification of new genes related to potentially known or suspected cancer genes [67,117,123].
Among the categories of clustering, grid-based and density-based techniques are more suitable to be used to cluster objects in large spatial data. These techniques are inappropriate for artificial and biological datasets such as iris, wine, breast tissue, blood transfusion, and yeast datasets [24,114]. On the other hand, density-based clustering techniques are useful if used to cluster gene expression data [114]. Moreover, hierarchical clustering techniques are useful to handle synthetic and real datasets (e.g., image data). However, these techniques have some limitations when the data are very large [114]. Finally, partitioning clustering techniques are inappropriate for non-convex data but suitable for smaller datasets [53,114,115].
Grid-based clustering (CLIQUE) was more efficient than other categories of clustering (e.g., k-means clustering, DBSCAN, and AGNES), but it was difficult to identify multiple clusters in cases of high dimensional data types. Although k-means clustering (category: partitioning) was sensitive to initializing the number of clusters, it provided a higher chance of identifying prognostic markers of leukemia. A prognostic marker is useful for identifying a disease outcome, which can be helpful in cancer treatment and drug discovery as well [52]. However, the quality of clusters is usually affected by initializing the number of intended clusters, especially for partitioning clustering. Therefore, the optimization of the objective function and validation can help clustering techniques to identify the optimal number of clusters with better quality [11,89]. This paper also showed the two types of optimization strategies, which are population and evolution. Most of the existing techniques used for optimization utilize population strategies. Carneiro et al. [124] also concluded that the use of optimization could generate better classification together with the use of clustering and topological data. In addition, this paper also reviewed clustering validation and its measurements criteria. Internal and external criteria are commonly used to measure the cluster structure. Besides, genes in clusters can belong to a specific pathway, which can reflect the genes’ functioning in biological processes [125]. For example, BCL2 associated with X apoptosis regulator (BAX) was among the genes identified in our experimental work, which is also a prognostic marker of leukemia. The BAX gene was encoded in the pro-apoptosis proteins, which could increase its expression and decrease the expression of anti-apoptosis (e.g., Bcl-2 gene) in the treatment of leukemia [126,127]. Moreover, clustered genes can identify metabolic gene clusters related to the discovery of metabolite in bacteria and fungi [127]. Identifying genes in clusters can not only allow us to discover the informative gene and the prognostic marker for the specific disease, but it can also provide a clue about the cluster dictated by signature enzymes. The signature enzyme can catalyze reactions and further tailor the product. Hence, the genes can be encoded in the pathway with enzymes.
Based on the experimental work, the CLIQUE and the k-means clustering techniques produce better results in terms of classification accuracy and identifying cancer markers. Therefore, this review suggests combining clustering techniques such as CLIQUE and k-means to yield more accurate gene clustering.
Although the optimal cluster analysis is the focus of this review, the findings can be applied to different areas.
Author Contributions
Conceptualization, H.W.N., Z.Z., M.S.M. and W.H.C.; Methodology, H.W.N., Z.Z., M.S.M., W.H.C. and N.Z.; Resources, H.W.N.; Writing—Original Draft Preparation, H.W.N.; Writing—Review and Editing, Z.Z., M.S.M., W.H.C., N.Z., R.O.S., S.N., P.C., S.O., J.M.C.; supervision, Z.Z., M.S.M. and W.H.C.
Funding
This research was funded by Fundamental Research Grant Scheme—Malaysia’s Research Star Award (FRGS-MRSA) and Fundamental Research Grant Scheme (R.J130000.7828.4F973) from Ministry of Education Malaysia, ICT funding agency from United Arab Emirates University (G00001472), and Research University Grant from Universiti Teknologi Malaysia (Q.J130000.2628.14J68). The authors also would like to thank Universiti Teknologi Malaysia (UTM) for the support of UTM’s Zamalah Scholarship.
Acknowledgments
The authors acknowledge support from the Ministry of Education Malaysia, United Arab Emirates University (UAEU), University of Salamanca (USAL), and Universiti Teknologi Malaysia (UTM).
Conflicts of Interest
The authors declare no conflict of interest.
References
- Chandra, G.; Tripathi, S. A Column-Wise Distance-Based Approach for Clustering of Gene Expression Data with Detection of Functionally Inactive Genes and Noise. In Advances in Intelligent Computing; Springer: Singapore, 2019; pp. 125–149. [Google Scholar]
- Xu, R.; Wunsch, D.C. Clustering algorithms in biomedical research: A review. IEEE Rev. Biomed. Eng. 2010, 3, 120–154. [Google Scholar] [CrossRef]
- Cai, B.; Wang, H.; Zheng, H.; Wang, H. An improved random walk-based clustering algorithm for community detection in complex networks. In Proceedings of the International Conference on Systems, Man, and Cybernetics (SMC), Anchorage, AK, USA, 9–12 October 2011; pp. 2162–2167. [Google Scholar]
- Zhang, H.; Raitoharju, J.; Kiranyaz, S.; Gabbouj, M. Limited random walk algorithm for big graph data clustering. J. Big Data 2016, 3, 26. [Google Scholar] [CrossRef]
- Liu, W.; Li, C.; Xu, Y.; Yang, H.; Yao, Q.; Han, J.; Shang, D.; Zhang, C.; Su, F.; Li, X.; et al. Topologically inferring risk-active pathways toward precise cancer classification by directed random walk. Bioinformatics 2013, 29, 2169–2177. [Google Scholar] [CrossRef]
- Liu, W.; Bai, X.; Liu, Y.; Wang, W.; Han, J.; Wang, Q.; Xu, Y.; Zhang, C.; Zhang, S.; Li, X.; et al. Topologically inferring pathway activity toward precise cancer classification via integrating genomic and metabolomic data: Prostate cancer as a case. Sci. Rep. 2015, 5, 13192. [Google Scholar] [CrossRef]
- Liu, W.; Wang, W.; Tian, G.; Xie, W.; Lei, L.; Liu, J.; Huang, W.; Xu, L.; Li, E. Topologically inferring pathway activity for precise survival outcome prediction: Breast cancer as a case. Mol. Biosyst. 2017, 13, 537–548. [Google Scholar] [CrossRef]
- Wang, W.; Liu, W. Integration of gene interaction information into a reweighted random survival forest approach for accurate survival prediction and survival biomarker discovery. Sci. Rep. 2018, 8, 13202. [Google Scholar] [CrossRef]
- Mehmood, R.; El-Ashram, S.; Bie, R.; Sun, Y. Effective cancer subtyping by employing density peaks clustering by using gene expression microarray. Pers. Ubiquitous Comput. 2018, 22, 615–619. [Google Scholar] [CrossRef]
- Bajo, J.; De Paz, J.F.; Rodríguez, S.; González, A. A new clustering algorithm applying a hierarchical method neural network. Log. J. IGPL 2010, 19, 304–314. [Google Scholar] [CrossRef]
- Majhi, S.K.; Biswal, S. A Hybrid Clustering Algorithm Based on K-means and Ant Lion Optimization. In Emerging Technologies in Data Mining and Information Security; Springer: Singapore, 2019; pp. 639–650. [Google Scholar]
- Ye, S.; Huang, X.; Teng, Y.; Li, Y. K-means clustering algorithm based on improved Cuckoo search algorithm and its application. In Proceedings of the 3rd International Conference on Big Data Analysis (ICBDA), Shanghai, China, 9–12 March 2018; pp. 422–426. [Google Scholar]
- Zelnik-Manor, L.; Perona, P. Self-tuning spectral clustering. In Advances in Neural Information Processing Systems; Neural Information Processing Systems Foundation, Inc. (NIPS): Vancouver, BC, Canada, 2005; pp. 1601–1608. [Google Scholar]
- Sugiyama, M.; Yamada, M.; Kimura, M.; Hachiya, H. On Information-Maximization Clustering: Tuning Parameter Selection and Analytic Solution. In Proceedings of the 28th International Conference on Machine Learning, Bellevue, WA, USA, 28 June–2 July 2011; pp. 65–72. [Google Scholar]
- Pollard, K.S.; Van Der Laan, M.J. A method to identify significant clusters in gene expression data. In U.C. Berkeley Division of Biostatistics Working Paper Series; Working Paper 107; Berkeley Electronic Press: Berkeley, CA, USA, 2002. [Google Scholar]
- Bholowalia, P.; Kumar, A. EBK-means: A clustering technique based on elbow method and k-means in WSN. Int. J. Comput. Appl. 2014, 105. [Google Scholar] [CrossRef]
- Jain, A.K. Data clustering: 50 years beyond K-means. Pattern Recognit. Lett. 2010, 31, 651–666. [Google Scholar] [CrossRef]
- Liu, Y.; Li, Z.; Xiong, H.; Gao, X.; Wu, J. Understanding of internal clustering validation measures. In Proceedings of the 10th International Conference on Data Mining (ICDM), Sydney, Australia, 13–17 December 2010; pp. 911–916. [Google Scholar]
- Garzón, J.A.C.; González, J.R. A gene selection approach based on clustering for classification tasks in colon cancer. Adv. Distrib. Comput. Artif. Intell. J. 2015, 4, 1–10. [Google Scholar]
- Kriegel, H.P.; Kröger, P.; Sander, J.; Zimek, A. Density-based clustering. Wiley Interdiscip. Rev. 2011, 1, 231–240. [Google Scholar] [CrossRef]
- Nagpal, A.; Jatain, A.; Gaur, D. Review based on data clustering algorithms. In Proceedings of the Conference on Information & Communication Technologies, Thuckalay, Tamil Nadu, India, 11–12 April 2013; pp. 298–303. [Google Scholar]
- Chen, Y.; Tang, S.; Bouguila, N.; Wang, C.; Du, J.; Li, H. A Fast Clustering Algorithm based on pruning unnecessary distance computations in DBSCAN for High-Dimensional Data. Pattern Recognit. 2018, 83, 375–387. [Google Scholar] [CrossRef]
- Handl, J.; Knowles, J.; Kell, D.B. Computational cluster validation in post-genomic data analysis. Bioinformatics 2005, 21, 3201–3212. [Google Scholar] [CrossRef]
- Deng, C.; Song, J.; Sun, R.; Cai, S.; Shi, Y. GRIDEN: An effective grid-based and density-based spatial clustering algorithm to support parallel computing. Pattern Recognit. Lett. 2018, 109, 81–88. [Google Scholar] [CrossRef]
- Murtagh, F.; Contreras, P. Algorithms for hierarchical clustering: An overview. Wiley Interdiscip. Rev. Data Min. Knowl. Discov. 2012, 2, 86–97. [Google Scholar] [CrossRef]
- Pilevar, A.H.; Sukumar, M. GCHL: A grid-clustering technique for high-dimensional very large spatial data bases. Pattern Recognit. Lett. 2005, 26, 999–1010. [Google Scholar] [CrossRef]
- Dembele, D.; Kastner, P. Fuzzy C-means method for clustering microarray data. Bioinformatics 2003, 19, 973–980. [Google Scholar] [CrossRef] [PubMed]
- Nayak, J.; Naik, B.; Behera, H.S. Fuzzy C-means (FCM) clustering algorithm: A decade review from 2000 to 2014. In Computational Intelligence in Data Mining-Volume 2; Springer: New Delhi, India, 2015; pp. 133–149. [Google Scholar]
- Datta, S.; Datta, S. Methods for evaluating clustering algorithms for gene expression data using a reference set of functional classes. BMC Bioinform. 2006, 7, 397. [Google Scholar] [CrossRef] [PubMed]
- Mary, C.; Raja, S.K. Refinement of Clusters from K-Means with Ant Colony Optimization. J. Theor. Appl. Inf. Technol. 2009, 6, 28–32. [Google Scholar]
- Remli, M.A.; Daud, K.M.; Nies, H.W.; Mohamad, M.S.; Deris, S.; Omatu, S.; Kasim, S.; Sulong, G. K-Means Clustering with Infinite Feature Selection for Classification Tasks in Gene Expression Data. In Proceedings of the International Conference on Practical Applications of Computational Biology & Bioinformatics, Porto, Portugal, 21–23 June 2017; pp. 50–57. [Google Scholar]
- Garg, S.; Batra, S. Fuzzified cuckoo based clustering technique for network anomaly detection. Comput. Electr. Eng. 2018, 71, 798–817. [Google Scholar] [CrossRef]
- Majhi, S.K.; Biswal, S. Optimal cluster analysis using hybrid K-Means and Ant Lion Optimizer. Karbala Int. J. Mod. Sci. 2018, 4, 347–360. [Google Scholar] [CrossRef]
- Kaufman, L.; Rousseeuw, P.J. Finding Groups in Data: An Introduction to Cluster Analysis; John Wiley & Sons: Hoboken, NJ, USA, 2009; Volume 344. [Google Scholar]
- Vesanto, J.; Alhoniemi, E. Clustering of the self-organizing map. IEEE Trans. Neural Netw. 2000, 11, 586–600. [Google Scholar] [CrossRef] [PubMed]
- Bassani, H.F.; Araujo, A.F. Dimension selective self-organizing maps with time-varying structure for subspace and projected clustering. IEEE Trans. Neural Netw. Learn. Syst. 2015, 26, 458–471. [Google Scholar] [CrossRef]
- Mikaeil, R.; Haghshenas, S.S.; Hoseinie, S.H. Rock penetrability classification using artificial bee colony (ABC) algorithm and self-organizing map. Geotech. Geol. Eng. 2018, 36, 1309–1318. [Google Scholar] [CrossRef]
- Tian, J.; Gu, M. Subspace Clustering Based on Self-organizing Map. In Proceedings of the 24th International Conference on Industrial Engineering and Engineering Management 2018, Changsha, China, 19–21 May 2018; pp. 151–159. [Google Scholar]
- Agrawal, R.; Gehrke, J.; Gunopulos, D.; Raghavan, P. Automatic Subspace Clustering of High Dimensional Data for Data Mining Applications; ACM: New York, NY, USA, 1998; Volume 27, pp. 94–105. [Google Scholar]
- Santhisree, K.; Damodaram, A. CLIQUE: Clustering based on density on web usage data: Experiments and test results. In Proceedings of the 3rd International Conference on Electronics Computer Technology (ICECT), Kanyakumari, India, 8–10 April 2011; Volume 4, pp. 233–236. [Google Scholar]
- Cheng, W.; Wang, W.; Batista, S. Grid-based clustering. In Data Clustering; Chapman and Hall, CRC Press: London, UK, 2018; pp. 128–148. [Google Scholar]
- Wang, W.; Yang, J.; Muntz, R. STING: A statistical information grid approach to spatial data mining. In Proceedings of the 23rd International Conference on Very Large Data Bases, Athens, Greece, 25–29 August 1997; Volume 97, pp. 186–195. [Google Scholar]
- Hu, J.; Pei, J. Subspace multi-clustering: A review. Knowl. Inf. Syst. 2018, 56, 257–284. [Google Scholar] [CrossRef]
- Ester, M.; Kriegel, H.P.; Sander, J.; Xu, X. A density-based algorithm for discovering clusters in large spatial databases with noise. In Proceedings of the Second International Conference on Knowledge Discovery and Data Mining, Portland, OR, USA, 2–4 August 1996; Volume 96, pp. 226–231. [Google Scholar]
- Geng, Y.A.; Li, Q.; Zheng, R.; Zhuang, F.; He, R.; Xiong, N. RECOME: A new density-based clustering algorithm using relative KNN kernel density. Inf. Sci. 2018, 436, 13–30. [Google Scholar] [CrossRef]
- Can, T.; Çamoǧlu, O.; Singh, A.K. Analysis of protein-protein interaction networks using random walks. In Proceedings of the 5th International Workshop on Bioinformatics, Chicago, IL, USA, 21 August 2005; pp. 61–68. [Google Scholar]
- Firat, A.; Chatterjee, S.; Yilmaz, M. Genetic clustering of social networks using random walks. Comput. Stat. Data Anal. 2007, 51, 6285–6294. [Google Scholar] [CrossRef]
- Re, M.; Valentini, G. Random walking on functional interaction networks to rank genes involved in cancer. In Proceedings of the International Conference on Artificial Intelligence Applications and Innovations (IFIP), Halkidiki, Greece, 27–30 September 2012; pp. 66–75. [Google Scholar]
- Golub, T.R.; Slonim, D.K.; Tamayo, P.; Huard, C.; Gaasenbeek, M.; Mesirov, J.P.; Coller, H.; Loh, M.L.; Downing, J.R.; Caligiuri, M.A.; et al. Molecular classification of cancer: Class discovery and class prediction by gene expression monitoring. Science 1999, 286, 531–537. [Google Scholar] [CrossRef] [PubMed]
- Dudoit, S.; Fridlyand, J.; Speed, T.P. Comparison of discrimination methods for the classification of tumors using gene expression data. J. Am. Stat. Assoc. 2002, 97, 77–87. [Google Scholar] [CrossRef]
- Ricci, C.; Marzocchi, C.; Battistini, S. MicroRNAs as biomarkers in amyotrophic lateral sclerosis. Cells 2018, 7, 219. [Google Scholar] [CrossRef] [PubMed]
- Eyileten, C.; Wicik, Z.; De Rosa, S.; Mirowska-Guzel, D.; Soplinska, A.; Indolfi, C.; Jastrzebska-Kurkowska, I.; Czlonkowska, A.; Postula, M. MicroRNAs as Diagnostic and Prognostic Biomarkers in Ischemic Stroke—A Comprehensive Review and Bioinformatic Analysis. Cells 2018, 7, 249. [Google Scholar] [CrossRef] [PubMed]
- Xu, D.; Tian, Y. A comprehensive survey of clustering algorithms. Ann. Data Sci. 2015, 2, 165–193. [Google Scholar] [CrossRef]
- Halkidi, M.; Vazirgiannis, M. Clustering validity assessment: Finding the optimal partitioning of a data set. In Proceedings of the IEEE International Conference on Data Mining (ICDM), San Jose, CA, USA, 29 November–2 December 2001; pp. 187–194. [Google Scholar]
- Rechkalov, T.V. Partition Around Medoids Clustering on the Intel Xeon Phi Many-Core Coprocessor. In Proceedings of the 1st Ural Workshop on Parallel, Distributed, and Cloud Computing for Young Scientists (Ural-PDC 2015), Yekaterinburg, Russia, 17 November 2015; Volume 1513. [Google Scholar]
- Kumar, P.; Wasan, S.K. Comparative study of k-means, pam and rough k-means algorithms using cancer datasets. In Proceedings of the CSIT: 2009 International Symposium on Computing, Communication, and Control (ISCCC 2009), Singapore, 9 October 2011; Volume 1, pp. 136–140. [Google Scholar]
- Mushtaq, H.; Khawaja, S.G.; Akram, M.U.; Yasin, A.; Muzammal, M.; Khalid, S.; Khan, S.A. A Parallel Architecture for the Partitioning around Medoids (PAM) Algorithm for Scalable Multi-Core Processor Implementation with Applications in Healthcare. Sensors 2018, 18, 4129. [Google Scholar] [CrossRef] [PubMed]
- Roux, M. A Comparative Study of Divisive and Agglomerative Hierarchical Clustering Algorithms. J. Classif. 2018, 35, 345–366. [Google Scholar] [CrossRef]
- Wang, J.; Zhu, C.; Zhou, Y.; Zhu, X.; Wang, Y.; Zhang, W. From Partition-Based Clustering to Density-Based Clustering: Fast Find Clusters with Diverse Shapes and Densities in Spatial Databases. IEEE Access 2018, 6, 1718–1729. [Google Scholar] [CrossRef]
- Ding, F.; Wang, J.; Ge, J.; Li, W. Anomaly Detection in Large-Scale Trajectories Using Hybrid Grid-Based Hierarchical Clustering. Int. J. Robot. Autom. 2018, 33. [Google Scholar] [CrossRef]
- Vijendra, S. Efficient clustering for high dimensional data: Subspace based clustering and density-based clustering. Inf. Technol. J. 2011, 10, 1092–1105. [Google Scholar] [CrossRef]
- Yu, X.; Yu, G.; Wang, J. Clustering cancer gene expression data by projective clustering ensemble. PLoS ONE 2017, 12, e0171429. [Google Scholar] [CrossRef] [PubMed]
- Bryant, A.; Cios, K. RNN-DBSCAN: A density-based clustering algorithm using reverse nearest neighbor density estimates. IEEE Trans. Knowl. Data Eng. 2018, 30, 1109–1121. [Google Scholar] [CrossRef]
- Deng, C.; Song, J.; Sun, R.; Cai, S.; Shi, Y. Gridwave: A grid-based clustering algorithm for market transaction data based on spatial-temporal density-waves and synchronization. Multimed. Tools Appl. 2018, 77, 29623–29637. [Google Scholar] [CrossRef]
- Pons, P.; Latapy, M. Computing communities in large networks using random walks. J. Graph Algorithms Appl. 2006, 10, 191–218. [Google Scholar] [CrossRef]
- Petrochilos, D.; Shojaie, A.; Gennari, J.; Abernethy, N. Using random walks to identify cancer-associated modules in expression data. BioData Min. 2013, 6, 17. [Google Scholar] [CrossRef] [PubMed]
- Ma, C.; Chen, Y.; Wilkins, D.; Chen, X.; Zhang, J. An unsupervised learning approach to find ovarian cancer genes through integration of biological data. BMC Genom. 2015, 16, S3. [Google Scholar] [CrossRef] [PubMed]
- Zhu, L.; Su, F.; Xu, Y.; Zou, Q. Network-based method for mining novel HPV infection related genes using random walk with restart algorithm. Biochim. Biophys. Acta Mol. Basis Dis. 2018, 1864, 2376–2383. [Google Scholar] [CrossRef] [PubMed]
- Civicioglu, P.; Besdok, E. A conceptual comparison of the Cuckoo-search, particle swarm optimization, differential evolution and artificial bee colony algorithms. Artif. Intell. Rev. 2013, 39, 315–346. [Google Scholar] [CrossRef]
- Fister, I.; Fister, I., Jr.; Yang, X.S.; Brest, J. A comprehensive review of firefly algorithms. Swarm Evol. Comput. 2013, 13, 34–46. [Google Scholar] [CrossRef]
- De Barros Franco, D.G.; Steiner, M.T.A. Clustering of solar energy facilities using a hybrid fuzzy c-means algorithm initialized by metaheuristics. J. Clean. Prod. 2018, 191, 445–457. [Google Scholar] [CrossRef]
- Mortazavi, A.; Toğan, V.; Moloodpoor, M. Solution of structural and mathematical optimization problems using a new hybrid swarm intelligence optimization algorithm. Adv. Eng. Softw. 2019, 127, 106–123. [Google Scholar] [CrossRef]
- Karaboga, D.; Akay, B. A survey: Algorithms simulating bee swarm intelligence. Artif. Intell. Rev. 2009, 31, 61–85. [Google Scholar] [CrossRef]
- García, J.; Crawford, B.; Soto, R.; Astorga, G. A clustering algorithm applied to the binarization of Swarm intelligence continuous metaheuristics. Swarm Evol. Comput. 2019, 44, 646–664. [Google Scholar] [CrossRef]
- Beni, G.; Wang, J. Swarm intelligence in cellular robotic systems. In Robots and Biological Systems: Towards a New Bionics? Springer: Berlin/Heidelberg, Germany, 1993; pp. 703–712. [Google Scholar]
- Abraham, A.; Das, S.; Roy, S. Swarm intelligence algorithms for data clustering. In Soft Computing for Knowledge Discovery and Data Mining; Springer: Boston, MA, USA, 2008; pp. 279–313. [Google Scholar]
- Pacheco, T.M.; Gonçalves, L.B.; Ströele, V.; Soares, S.S.R. An Ant Colony Optimization for Automatic Data Clustering Problem. In Proceedings of the IEEE Congress on Evolutionary Computation (CEC), Rio de Janeiro, Brazil, 8–13 July 2018; pp. 1–8. [Google Scholar]
- Gandomi, A.H.; Yang, X.S.; Alavi, A.H.; Talatahari, S. Bat algorithm for constrained optimization tasks. Neural Comput. Appl. 2013, 22, 1239–1255. [Google Scholar] [CrossRef]
- Gandomi, A.H.; Yang, X.S.; Alavi, A.H. Cuckoo search algorithm: A metaheuristic approach to solve structural optimization problems. Eng. Comput. 2013, 29, 17–35. [Google Scholar] [CrossRef]
- Das, D.; Pratihar, D.K.; Roy, G.G.; Pal, A.R. Phenomenological model-based study on electron beam welding process, and input-output modeling using neural networks trained by back-propagation algorithm, genetic algorithms, particle swarm optimization algorithm and bat algorithm. Appl. Intell. 2018, 48, 2698–2718. [Google Scholar] [CrossRef]
- Xu, X.; Li, J.; Zhou, M.; Xu, J.; Cao, J. Accelerated Two-Stage Particle Swarm Optimization for Clustering Not-Well-Separated Data. IEEE Trans. Syst. Man Cybern. Syst. 2018, 1–12. [Google Scholar] [CrossRef]
- Cao, Y.; Lu, Y.; Pan, X.; Sun, N. An improved global best guided artificial bee colony algorithm for continuous optimization problems. In Cluster Computing; Springer: Berlin, Germany, 2018; pp. 1–9. [Google Scholar]
- Li, Y.; Wang, G.; Chen, H.; Shi, L.; Qin, L. An ant colony optimization-based dimension reduction method for high-dimensional datasets. J. Bionic Eng. 2013, 10, 231–241. [Google Scholar] [CrossRef]
- Cheng, C.; Bao, C. A Kernelized Fuzzy C-means Clustering Algorithm based on Bat Algorithm. In Proceedings of the 2018 10th International Conference on Computer and Automation Engineering, Brisbane, Australia, 24–26 February 2018; pp. 1–5. [Google Scholar]
- Ghaedi, A.M.; Ghaedi, M.; Vafaei, A.; Iravani, N.; Keshavarz, M.; Rad, M.; Tyagi, I.; Agarwal, S.; Gupta, V.K. Adsorption of copper (II) using modified activated carbon prepared from Pomegranate wood: Optimization by bee algorithm and response surface methodology. J. Mol. Liq. 2015, 206, 195–206. [Google Scholar] [CrossRef]
- Yang, X.S. Firefly algorithm, stochastic test functions and design optimisation. arXiv 2010, arXiv:1003.1409. [Google Scholar] [CrossRef]
- Rashedi, E.; Nezamabadi-Pour, H.; Saryazdi, S. GSA: A gravitational search algorithm. Inf. Sci. 2009, 179, 2232–2248. [Google Scholar] [CrossRef]
- Yazdani, S.; Nezamabadi-pour, H.; Kamyab, S. A gravitational search algorithm for multimodal optimization. Swarm Evol. Comput. 2014, 14, 1–14. [Google Scholar] [CrossRef]
- Tharwat, A.; Hassanien, A.E. Quantum-Behaved Particle Swarm Optimization for Parameter Optimization of Support Vector Machine. J. Classif. 2019, 1–23. [Google Scholar] [CrossRef]
- Bandyopadhyay, S.; Saha, S.; Maulik, U.; Deb, K. A simulated annealing-based multi-objective optimization algorithm: AMOSA. IEEE Trans. Evol. Comput. 2008, 12, 269–283. [Google Scholar] [CrossRef]
- Acharya, S.; Saha, S.; Sahoo, P. Bi-clustering of microarray data using a symmetry-based multi-objective optimization framework. Soft Comput. 2018, 1–22. [Google Scholar] [CrossRef]
- Bäck, T.; Rudolph, G.; Schwefel, H.P. Evolutionary programming and evolution strategies: Similarities and differences. In Proceedings of the Second Annual Conference on Evolutionary Programming, Los Altos, CA, USA, 25–26 February 1993. [Google Scholar]
- Ferreira, C. Gene expression programming: A new adaptive algorithm for solving problems. arXiv 2001, arXiv:cs/0102027. [Google Scholar]
- Guven, A.; Aytek, A. New approach for stage–discharge relationship: Gene-expression programming. J. Hydrol. Eng. 2009, 14, 812–820. [Google Scholar] [CrossRef]
- Koza, J.R.; Koza, J.R. Genetic Programming: On the Programming of computers by Means of Natural Selection; MIT Press: Cambridge, MA, USA, 1992. [Google Scholar]
- Mitra, A.P.; Almal, A.A.; George, B.; Fry, D.W.; Lenehan, P.F.; Pagliarulo, V.; Cote, R.J.; Datar, R.H.; Worzel, W.P. The use of genetic programming in the analysis of quantitative gene expression profiles for identification of nodal status in bladder cancer. BMC Cancer 2006, 6, 159. [Google Scholar] [CrossRef] [PubMed]
- Cheng, R.; Gen, M. Parallel machine scheduling problems using memetic algorithms. In Proceedings of the 1996 IEEE International Conference on Systems, Man and Cybernetics. Information Intelligence and Systems (Cat. No. 96CH35929), Beijing, China, 14–17 October 1996; Volume 4, pp. 2665–2670. [Google Scholar]
- Knowles, J.D.; Corne, D.W. M-PAES: A memetic algorithm for multi-objective optimization. In Proceedings of the 2000 Congress on Evolutionary Computation. CEC00 (Cat. No. 00TH8512), Istanbul, Turkey, 5–9 June 2000; Volume 1, pp. 325–332. [Google Scholar]
- Duval, B.; Hao, J.K.; Hernandez, J.C. A memetic algorithm for gene selection and molecular classification of cancer. In Proceedings of the 11th Annual Conference on Genetic and Evolutionary Computation, Montreal, QC, Canada, 8–12 July 2009; pp. 201–208. [Google Scholar]
- Chehouri, A.; Younes, R.; Khoder, J.; Perron, J.; Ilinca, A. A selection process for genetic algorithm using clustering analysis. Algorithms 2017, 10, 123. [Google Scholar] [CrossRef]
- Srivastava, A.; Chakrabarti, S.; Das, S.; Ghosh, S.; Jayaraman, V.K. Hybrid firefly based simultaneous gene selection and cancer classification using support vector machines and random forests. In Proceedings of the Seventh International Conference on Bio-Inspired Computing: Theories and Applications (BIC-TA 2012), Gwalior, India, 14–16 December 2012; pp. 485–494. [Google Scholar]
- Babu, G.P.; Murty, M.N. Clustering with evolution strategies. Pattern Recognit. 1994, 27, 321–329. [Google Scholar] [CrossRef]
- Bäck, T.; Schwefel, H.P. An overview of evolutionary algorithms for parameter optimization. Evol. Comput. 1993, 1, 1–23. [Google Scholar] [CrossRef]
- Bäck, T.; Fogel, D.B.; Michalewicz, Z. (Eds.) Evolutionary Computation 1: Basic Algorithms and Operators; CRC Press: Boca Raton, FL, USA, 2018. [Google Scholar]
- Eiben, A.E.; Smith, J. From evolutionary computation to the evolution of things. Nature 2015, 521, 476. [Google Scholar]
- Lynn, N.; Ali, M.Z.; Suganthan, P.N. Population topologies for particle swarm optimization and differential evolution. Swarm Evol. Comput. 2018, 39, 24–35. [Google Scholar] [CrossRef]
- Liu, Y.; Li, Z.; Xiong, H.; Gao, X.; Wu, J.; Wu, S. Understanding and enhancement of internal clustering validation measures. IEEE Trans. Cybern. 2013, 43, 982–994. [Google Scholar]
- Karo, I.M.K.; MaulanaAdhinugraha, K.; Huda, A.F. A cluster validity for spatial clustering based on davies bouldin index and Polygon Dissimilarity function. In Proceedings of the Second International Conference on Informatics and Computing (ICIC), Jayapura, Indonesia, 1–3 November 2017; pp. 1–6. [Google Scholar]
- Nies, H.W.; Daud, K.M.; Remli, M.A.; Mohamad, M.S.; Deris, S.; Omatu, S.; Kasim, S.; Sulong, G. Classification of Colorectal Cancer Using Clustering and Feature Selection Approaches. In Proceedings of the International Conference on Practical Applications of Computational Biology & Bioinformatics, Porto, Portugal, 21–23 June 2017; pp. 58–65. [Google Scholar]
- Billmann, M.; Chaudhary, V.; ElMaghraby, M.F.; Fischer, B.; Boutros, M. Widespread Rewiring of Genetic Networks upon Cancer Signaling Pathway Activation. Cell Syst. 2018, 6, 52–64. [Google Scholar] [CrossRef] [PubMed]
- Labed, K.; Fizazi, H.; Mahi, H.; Galvan, I.M. A Comparative Study of Classical Clustering Method and Cuckoo Search Approach for Satellite Image Clustering: Application to Water Body Extraction. Appl. Artif. Intell. 2018, 32, 96–118. [Google Scholar] [CrossRef]
- Aarthi, P. Improving Class Separability for Microarray datasets using Genetic Algorithm with KLD Measure. Int. J. Eng. Sci. Innov. Technol. 2014, 3, 514–521. [Google Scholar]
- Gomez-Pilar, J.; Poza, J.; Bachiller, A.; Gómez, C.; Núñez, P.; Lubeiro, A.; Molina, V.; Hornero, R. Quantification of graph complexity based on the edge weight distribution balance: Application to brain networks. Int. J. Neural Syst. 2018, 28, 1750032. [Google Scholar] [CrossRef] [PubMed]
- Oyelade, J.; Isewon, I.; Oladipupo, F.; Aromolaran, O.; Uwoghiren, E.; Ameh, F.; Achas, M.; Adebiyi, E. Clustering algorithms: Their application to gene expression data. Bioinform. Biol. Insights 2016, 10. [Google Scholar] [CrossRef] [PubMed]
- Tang, H.; Zeng, T.; Chen, L. High-order correlation integration for single-cell or bulk RNA-seq data analysis. Front. Genet. 2019, 10, 371. [Google Scholar] [CrossRef]
- Kiselev, V.Y.; Andrews, T.S.; Hemberg, M. Challenges in unsupervised clustering of single-cell RNA-seq data. Nat. Rev. Genet. 2019, 20, 273–282. [Google Scholar] [CrossRef]
- Handhayani, T.; Hiryanto, L. Intelligent kernel k-means for clustering gene expression. Procedia Comput. Sci. 2015, 59, 171–177. [Google Scholar] [CrossRef]
- Shanmugam, C.; Sekaran, E.C. IRT image segmentation and enhancement using FCM-MALO approach. Infrared Phys. Technol. 2019, 97, 187–196. [Google Scholar] [CrossRef]
- Masciari, E.; Mazzeo, G.M.; Zaniolo, C. Analysing microarray expression data through effective clustering. Inf. Sci. 2014, 262, 32–45. [Google Scholar] [CrossRef]
- Bouguettaya, A.; Yu, Q.; Liu, X.; Zhou, X.; Song, A. Efficient agglomerative hierarchical clustering. Expert Syst. Appl. 2015, 42, 2785–2797. [Google Scholar] [CrossRef]
- Lin, C.R.; Chen, M.S. Combining partitional and hierarchical algorithms for robust and efficient data clustering with cohesion self-merging. IEEE Trans. Knowl. Data Eng. 2005, 17, 145–159. [Google Scholar]
- Darong, H.; Peng, W. Grid-based DBSCAN algorithm with referential parameters. Phys. Procedia 2012, 24, 1166–1170. [Google Scholar] [CrossRef]
- Langohr, L.; Toivonen, H. Finding representative nodes in probabilistic graphs. In Bisociative Knowledge Discovery; Springer: Berlin/Heidelberg, Germany, 2012; pp. 218–229. [Google Scholar]
- Carneiro, M.G.; Cheng, R.; Zhao, L.; Jin, Y. Particle swarm optimization for network-based data classification. Neural Netw. 2019, 110, 243–255. [Google Scholar] [CrossRef]
- Yi, G.; Sze, S.H.; Thon, M.R. Identifying clusters of functionally related genes in genomes. Bioinformatics 2007, 23, 1053–1060. [Google Scholar] [CrossRef]
- Somintara, S.; Leardkamolkarn, V.; Suttiarporn, P.; Mahatheeranont, S. Anti-tumor and immune enhancing activities of rice bran gramisterol on acute myelogenous leukemia. PLoS ONE 2016, 11, e0146869. [Google Scholar] [CrossRef]
- Chavali, A.K.; Rhee, S.Y. Bioinformatics tools for the identification of gene clusters that biosynthesize specialized metabolites. Brief. Bioinform. 2017, 19, 1022–1034. [Google Scholar] [CrossRef]

© 2019 by the authors. Licensee MDPI, Basel, Switzerland. This article is an open access article distributed under the terms and conditions of the Creative Commons Attribution (CC BY) license (http://creativecommons.org/licenses/by/4.0/).