Abstract
Steady state and dynamic modelling and simulation of catalytic reforming unit of Kaduna Refining & Petrochemical Company, NNPC (Nigeria) was carried to find out the behaviour of the reactions under both steady and unsteady state conditions. The basic model together with kinetic and thermodynamic parameters and properties were taken from the literature but is developed in gPROMs (an equation oriented modelling software) model building platform for the first time rather than in MATLAB or other modelling platform used by other researchers in the past. The simulation was performed using gPROMs and the predictions were validated against those available in the literature. The validated model was then used to monitor the behaviour of the temperature, concentrations of paraffins, naphthenes and aromatics with respect to both time and height of the reactor of the industrial refinery of Nigeria. Hydrogen yield, Research octane number (RON) and temperature profiles are also reported. The components behave similarly in terms of reactions in the reactors but the time to attain quasi-steady state is different. The results are in good agreement with the industrial plant data.
1. Introduction
Naphtha is a low octane cut from atmospheric distillation of crude oil from the topping plant usually in the range between 30 °C–200 °C and constitutes typically 15–30% by weight of the crude oil [1]. This cut contains some impurities such as sulphur, oxygen and nitrogen compounds. This low run naphtha, sometimes referred to as straight run, requires reforming to a more valuable higher run naphtha called reformate which is blended into a pool of gasoline for use as a motor spirit. SR naphtha can be Light naphtha a fraction with boiling point ranging from 30 °C to 90 °C, containing the C5 and C6 hydrocarbons or Heavy naphtha which is the fraction with boiling range from 90 °C to 200 °C. The medium naphtha is a fraction of this heavy cut that boils below 150 °C and includes mostly C7–C9 hydrocarbons [2]. Prior to reforming, the SR is treated in a hydrotreating unit. Reforming is a form of reaction where the components paraffins, naphthenes and aromatics are rearranged to produce higher gasolines. These components typically contain 40–70 wt% paraffins, 20–50 wt% naphthenes, 5–20 wt% aromatics [3]. The various reforming reactions are dehydrogenation reactions of the paraffins to naphthenes and dehydrogenation of the naphthenes to aromatics, dehyrocylization of paraffins to naphthenes, isomerization of normal paraffins to iso-paraffins, cracking of paraffins and naphthenes and hydrodealkylation of aromatics. Modelling and simulation of catalytic reforming has been considered by different researchers to determine the plant performance or product distribution behaviour. Hu carried out [4] steady state modelling of semi regenerative catalytic reformer with 17 lumps and monitored the plant performance on stream. Modelling and parameter estimation was carried out by Stijepovic with benchmarking with industrial data and a good prediction of concentration and hydrogen was obtained [5]. Optimization of catalyst distribution was carried by [6] to determine the optimal catalyst distribution in the reactors. The dynamics of a process tells a lot about the behaviour of the system and the effect of perturbation due to changes in operational conditions such as temperature. It gives an indication on the transient behaviour and the time for the system to reach steady state. This information helps whenever there is need for plant scale up or process modification. Few works have been carried out on the dynamics of the reaction [7,8,9,10]. The modelling and simulation works carried out by [11,12] (steady state) and [10] (dynamic) use the same reactor configurations, same feed throughput and feed stock properties. It requires rigorous modelling method to model and simulate dynamically series of reactors concurrently together having three or four heaters and reactors in series. It is a difficult task and in [10], one reactor was simulated as a first contribution In this work, first a modelling and simulation of catalytic reforming unit by [11,12] was performed on gPROMs software and was compared with that performed on MATLAB ODE45 by the earlier authors. The validated model is then used to study the steady state and dynamic behaviour of an industrial commercial plant of Kaduna Refining and Petrochemical Company, using four reactors was performed sequentially using the gPROMs software (Version 5.0.0 Process System Enterprise Limited, London, UK). gPROMs software was found capable and robust in performing complex dynamic modelling and simulations.
2. Process Description and Process Variables
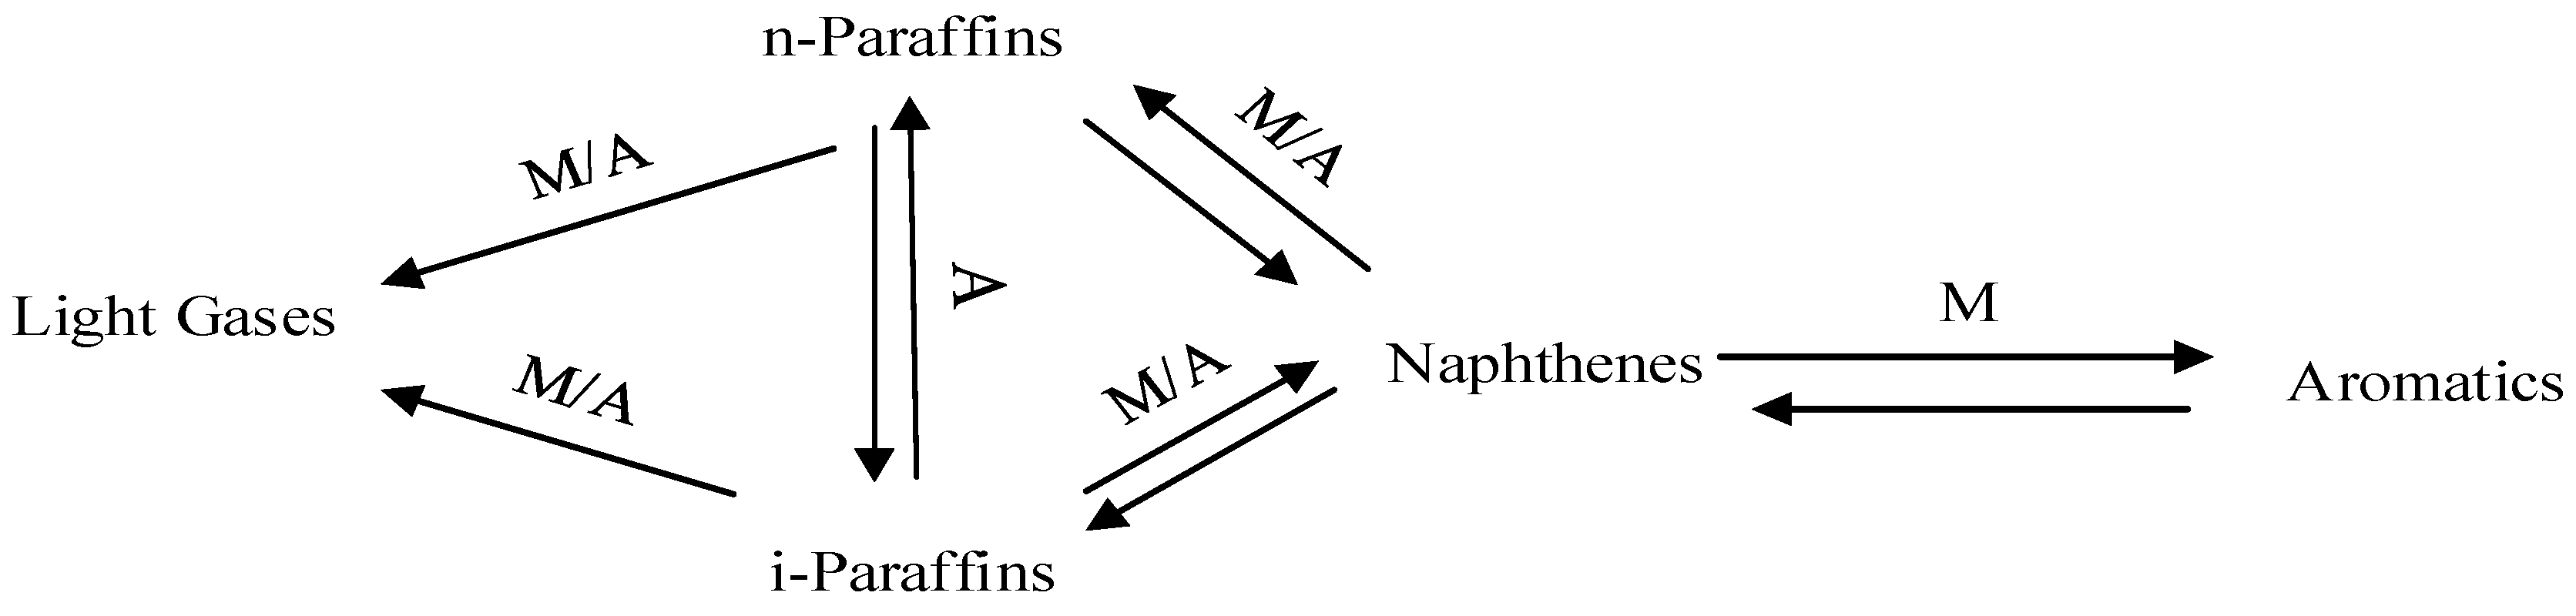
Naphtha catalytic reforming reactions include Dehydrogenation, Dehydrocyclization, Isomerization and Hydrocracking reactions which are performed on both the metallic and acidic parts of the catalyst. A simple network reaction is given in Figure 1.

Figure 1.
Network of Reforming Reactions.
M represents the metal catalyst site, A represents the Acid catalyst site. The main reactions involved in reforming processes are catalysed essentially either by the acid support or the metal functions.
| Dehydrogenation | Metallic function |
| Dehydrocyclization | Metallic + acidic functions |
| Isomerization | Metallic + acidic functions |
| Hydrogenolysis | Metallic function |
| Hydrocracking | Metallic + acidic function |
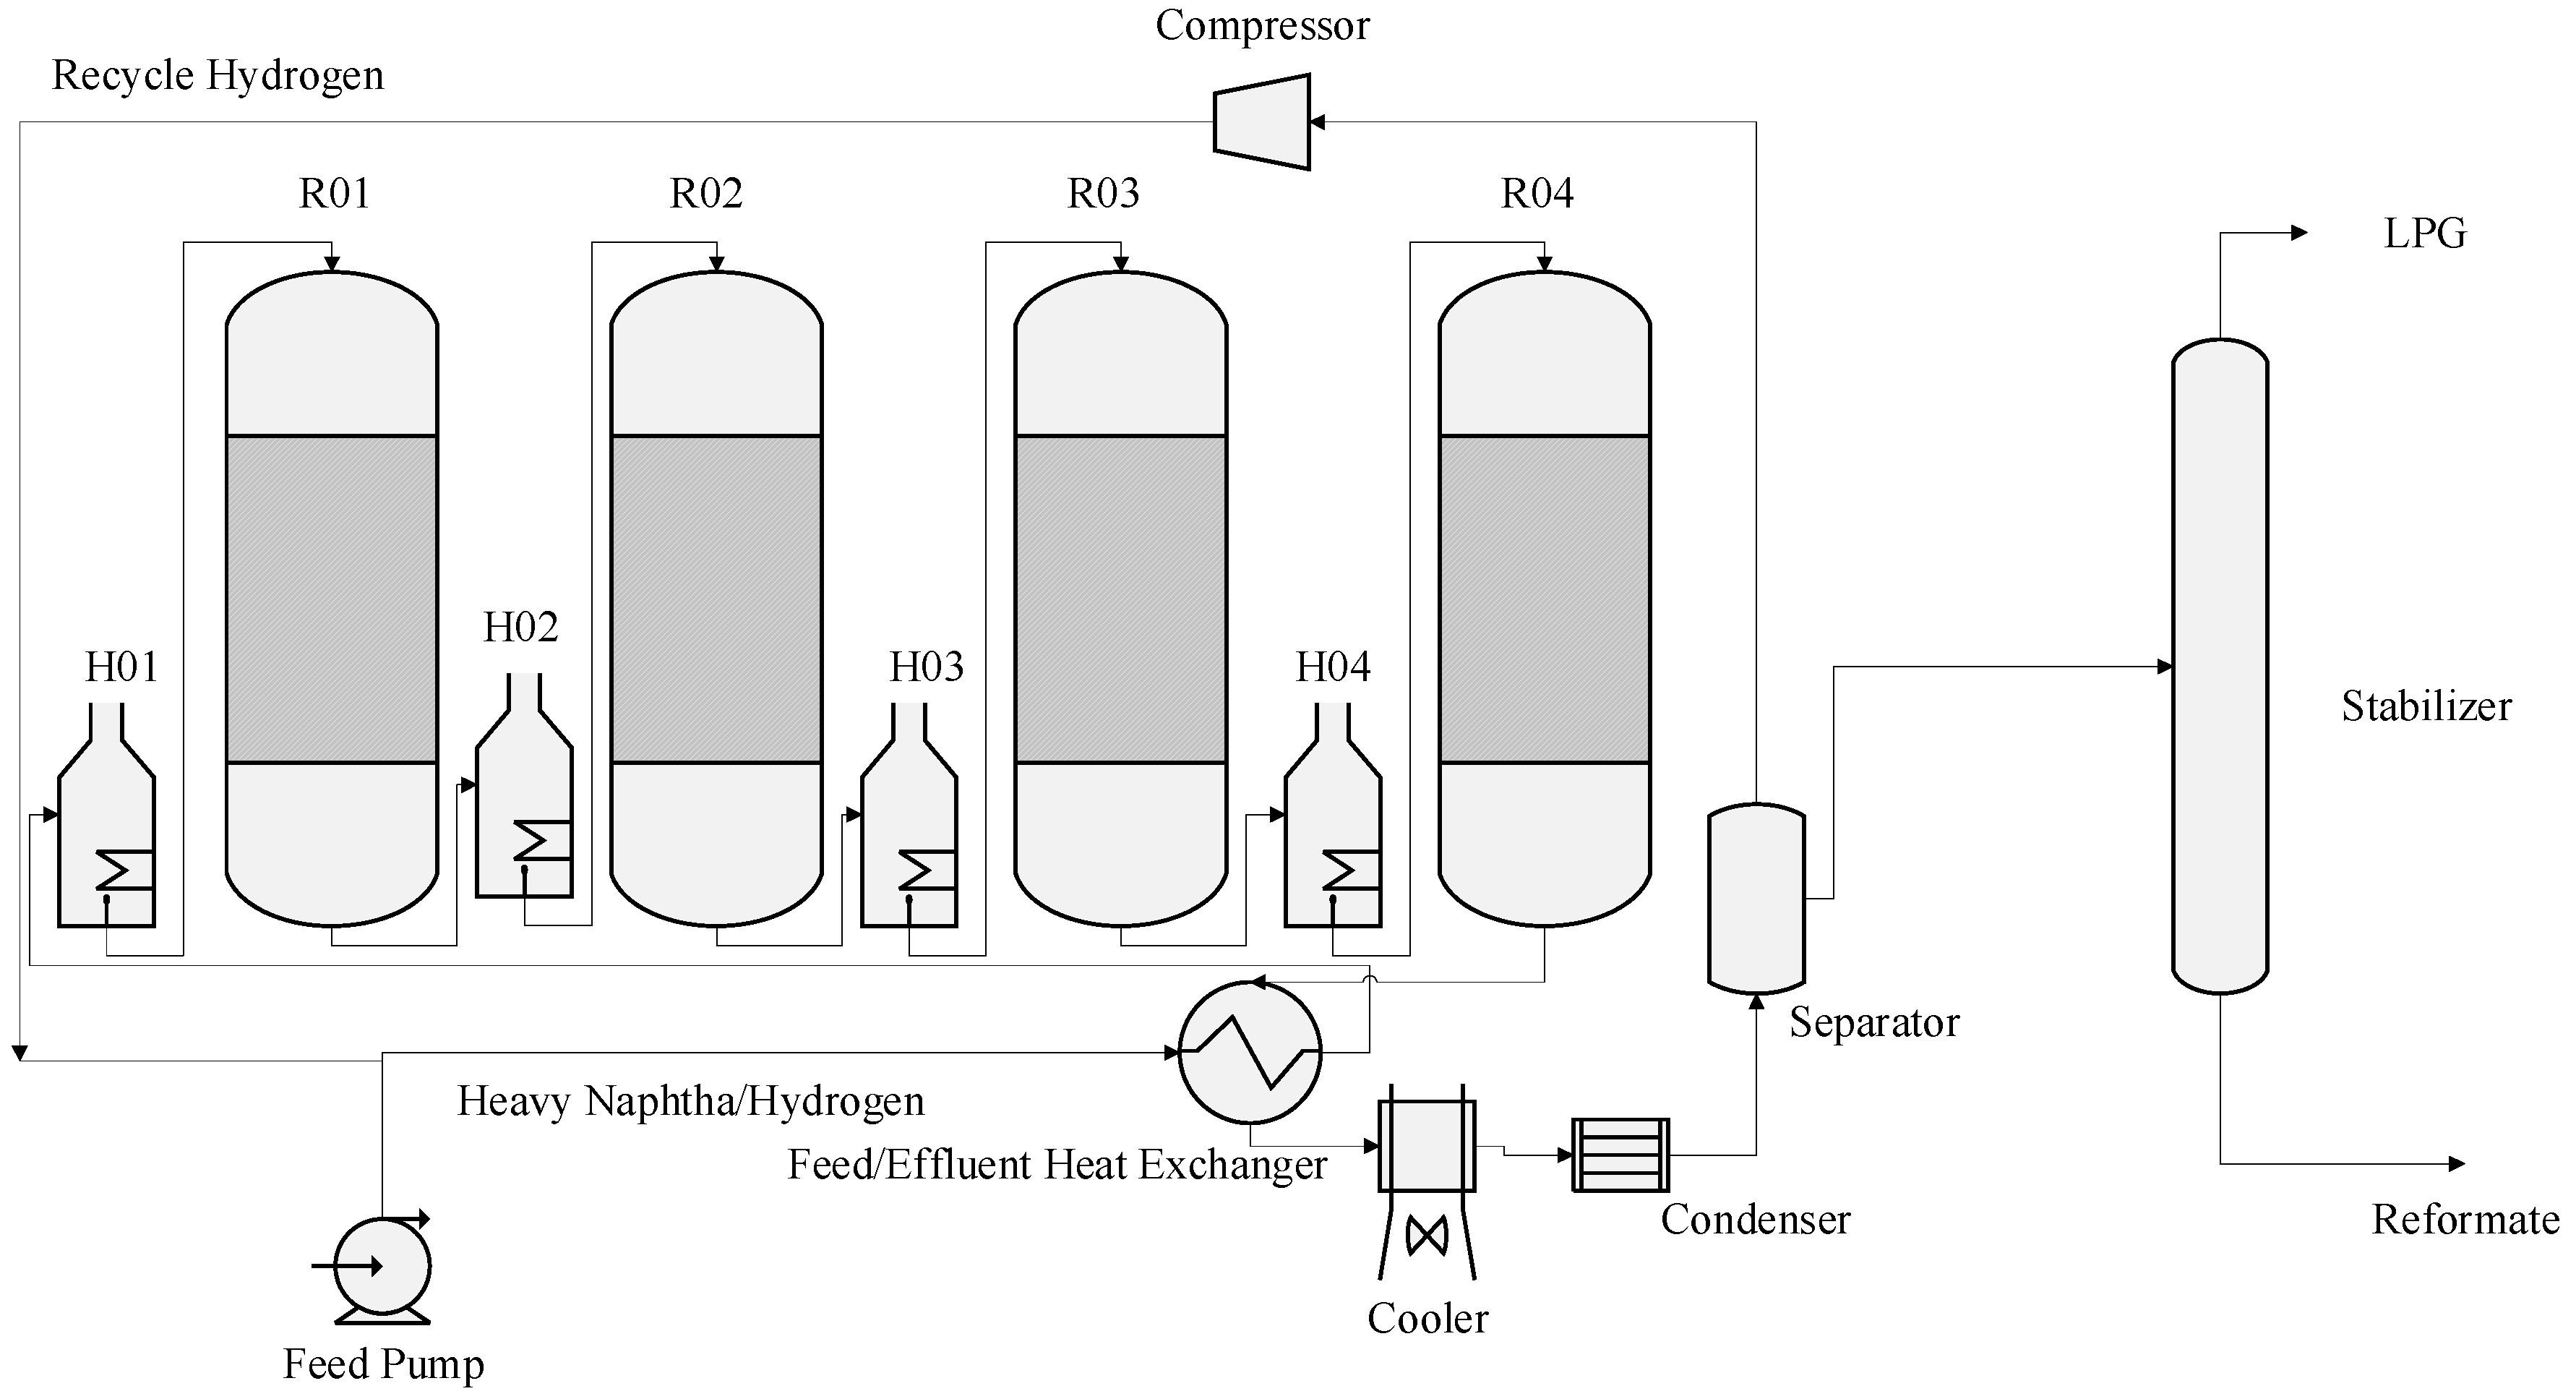
A Naphtha catalytic reforming unit (CRU) typically is made up of a preheat system, that is, a long vertical heat exchanger with large surface area to allow for feed preheating prior to further heating in the charge heater usually three or four heaters and reactors in series and a low pressure separator. The hydrogen is flashed and separated in the separator where part of it is recycled to the meet the feed again continuously before it enters the first heater, while the heavier liquid (reformate) is sent to a stabilization column. Reformate is obtained as a bottom product from the stabilization column while the liquefied petroleum gases (LPG) are obtained from the top of the stabilization after condensation in a trim cooler and condenser. It is important to mention that the flashed hydrogen from the low pressure separator goes through a drying section, a dryer consisting some alumina balls in order to reduce the amount of water vapour in the gas to a maximum of 25 ppm before recycling back to the feed. Also the bottom of the low pressure separator, liquid reformate prior to stabilization is re-contacted with hydrogen from a dry gas compressor at high pressure (high pressure separator) in order to strip more of hydrogen if still contained in the reformate. This high pressure separator otherwise called re-contactor is the source of hydrogen to other units in refinery where it is distributed at high pressure. These reforming reactions globally are endothermic in nature, multiple charge heaters are used to raise the temperature of the reaction to the desired value (400–500 °C) [13]. During the reaction in the catalytic bed in the reactor, one of the most significant reaction which is the dehydrogenation of naphthenes to aromatics, is very fast and more endothermic. This results in a high decrease of temperature in the reactor. The temperature of the exit stream from the first reactor is raised and sent to the next reactor. The rate of reaction of the feed decreases whenever it moves through the reactors in series. The reaction becomes less endothermic and the differential temperature along the reactor falls and the quantity of heat required to reheat the stream also decrease. The treated naphtha fed to the reactor is combined with a gas stream containing about 60 to 90 mole % hydrogen whose pressure depends on compressor capacity. Thus, total reactor charge is the naphtha feed plus the hydrogen recycle gas stream. The reactor feed must be raised to the proper temperature for the reforming reactions to occur when the charge contacts the catalyst. As shown in Figure 2 total reactor charge is heated, at first by exchange with effluent from the last reactor and is finally brought up to the first reactor inlet temperature in the first charge heater which is also called the first inter heater. The reactor effluent-to-feed exchanger recovers the heat from the reactor effluent and provides it to the reactor feed. Thus, it is one key to energy conservation in a catalytic reformer. The reactor effluent which may be as high as 750 to 790 K, must be cooled to 315 to 320 K for flash separation of hydrogen from reformate. This heat exchange is carried out in several banks of heat exchangers, arranged for parallel flow. Some of the newer units use one large single-pass vertical exchanger for this purpose. Catalytic reforming is a gas phase process [13]. After passing through the reactor effluent-to-feed exchanger and the charge heater, the total reactor charge is 100% vapour at the appropriate reaction temperature and is ready to contact the reforming catalyst. The most commonly used catalyst type is platinum on alumina support. Recent developments in catalysis have produced some bi-metallic and tri-metallic catalysts, such as Pt-Re or Pt-Ir on alumina support [14]. The flow scheme in Figure 2 shows the four reactors in series.
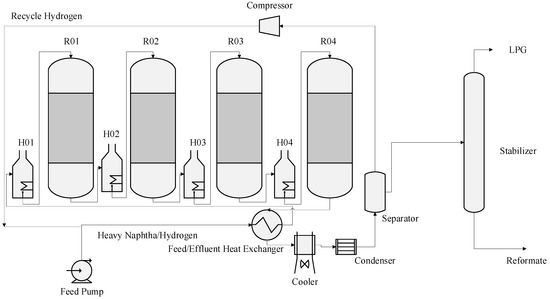
Figure 2.
Catalytic Reforming processes.
The hydrogen circulation to the naphtha charge is called the hydrogen recycle. The hydrogen recycle is maintained in order of control the rates of deactivation of the catalyst. Excess hydrogen from the separator is sent to feed gas or to hydrogen consuming units in the refinery such as hydro-treaters and petrochemical plants. The separator liquid, comprised mostly of the desired reformate product but also containing hydrogen, methane, ethane, propane and butanes is pumped to the reformate stabilizer. The stabilized reformate is sent to storage for gasoline blending while the C3 and C4 are sent to LPG storage tanks. The reformer that is modelled in this work is a semi regenerative type of reformer consisting of four reactors in series. When the catalyst gets deactivated after time and has reached end of run (EOR) where the quality of the product is not obtained, the plant is shut down and the deactivated catalyst is regenerated and this is called a catalyst cycle. A cycle may be terminated for a number of reasons but the most common is poor catalyst performance due to deactivation of the catalyst by coke formation on its surface as a result of severity of operation mainly high temperature. This usually leads to a loss of reformate yield. The regeneration procedure restores the catalyst to near fresh-catalyst condition. The temperature, pressure, space velocity, H2/Hc ratio and feed quality are the variables affecting rate of the reaction and the sensitivity of the product distribution to these variables are studied in the result section of this work. A summary of the effect of these variables are shown in Table 1 [15].

Table 1.
Effect of variables on product distribution, coke and Research octane number (RON).
Process Classification
Naphtha catalytic reforming process is typically classified based on the method and procedure of operation and regeneration of catalyst. They are semi catalyst regeneration, cyclic catalyst regeneration and continuous catalyst regeneration. Different refineries have different processes but most widely used is the semi catalyst regeneration, then continuous catalyst regeneration and the less commonly used is cyclic catalyst regeneration. Nowadays, more catalytic reformers are developed and designed for continuous catalyst regeneration and the previous semi catalyst regeneration units are being revamped to operate in continuous regeneration mode. A semi catalyst regeneration process typically consists of three or four reactors in series in a fixed bed catalyst system and operates within a time line where the catalyst gets deactivated, a cycle length and it is regenerated. Usually a period of 6 months to one year. The advantage of this process type is the simplicity of the mode of operation but one major drawback is that the plant has to be shut down for catalyst regeneration after end of run (EOR). Another drawback is the application of high pressure and hydrogen hydrocarbon (HHR) to avoid quick catalyst deactivation. The cyclic catalyst regeneration unit is similar to the semi catalyst regeneration mode but it has an extra swing reactor which is used as a spare reactor whenever the catalyst of one of the reactors is deactivated. It serves as a reactor for the unit while it is regenerated and this prevents the total shut down of the plant. The drawback of this process is the complexity and challenges of reactor swing from one to the other although it has the advantage of use of lower pressure than the semi catalyst regeneration mode. The continuous catalyst regeneration mode is a moving bed mode where the catalyst is continuously regenerated. It does not require shut down for catalyst regeneration and this implies less down time for the unit and more production time. The major challenge of this process is the complexity of mechanism of engaging and disengaging of the product from the last reactor to the regenerator. The hydrogen from the catalyst to be regenerated has to be displaced with nitrogen before it is sent to the regenerator to avoid explosion since the regenerator operates at a high temperature of about 600–700 °C. The catalyst after cooling must be swept of nitrogen before is sent to the reactor. An important aspect in this type of process is disharmony at times between the catalyst suppliers and the technology owners where some catalysts used may not be suitable for the technology of the process. The major operational draw backs of the previous modes have solved in this mode of operation. It uses low pressure and low hydrogen hydrocarbon ratio and gives higher hydrogen purity and higher yield of aromatics. In this work, a semi catalyst regeneration mode of CRU, in Kaduna refining and petrochemical company is modelled.
3. Kinetic Models
In this work, various models have been developed for both steady state and dynamic process of the catalytic reforming reaction with different lumps to investigate the behaviour of the reaction and products distribution. The reaction steps and equations of the model are given in this section. Table 2 shows the reaction steps and rate constants for the various reactions used in the model.
Table 2.
Table of reaction steps and rate constants of the Model (adapted from [10]).
The kinetic rate equations for the components are given in Equations (1)–(25) where is space velocity and is residence time.
where a1 = , a2 = , a3 = , a4 = , a5 = , a6 = , a7 = , b1 = , b2 = ), b3 = , b4 = , b5 = , b6 = , c1 = (), c2 = , c3 = , c4 = , c5 = , c6 = .
where Ki is the kinetic constants for the reactions, T0 and P0 are the reference temperatures and pressures. EAi (activation energy) and w (exponential values of pressure) are taken from [10] and are given in Table 3. ki, EAi, w, T0 and P0 are also obtained from [10].
Table 3.
Activation Energies for the reactions and Exponential values of Pressure (adapted from [10]).
4. Mathematical Model
The kinetic rate equations from Equations (1)–(25) which determine the rate of the reaction of each component is used in the mathematical modelling Equations of (27)–(32) to determine the concentration, temperature and pressure distributions of the components describing the system. The rates of the equations are defined as in Equations (27) and (28) and summations of the rate equations and their stoichiometric coefficients. These model equations, (27)–(32), in cooperated with Equations (1)–(25) are solved simultaneously on gPROMs. Equations (27) and (28) are equations representing the dynamic behaviour of the system and change with time dt. At steady state, the system does not change with time and dt becomes zero. So the equations can be used for both steady state and dynamic behaviour depending on the application.
5. RON Model
The estimation of the Research octane number, RON of hydrocarbons for the feed and products can be done using different methods of prediction. RON can be calculated for each pure component by using a polynomial equation that correlates to the normal boiling point [16]. Equation (33) represents the model equation for the RON estimation.
where T = TBP × 0.01, TBP represents the normal boiling point (°C) and Aa, Bb, Cc, Dd and Ee, are coefficients. The RON of a hydrocarbon mixture is calculated by assuming that the mixture consists of paraffins, naphthenic hydrocarbons and aromatics. The equation is expressed as the sum of the RON for each pure component multiplied by the volume fractions of the components. Equation (27) is the material balance equation where is the bulk density and the bed voidage. Equation (28) is the heat balance of the reaction to determine the temperature behaviour where is the heat of the reaction of jth component and Cpcat the heat capacity of the catalyst. Equation (29) is the pressure profile of the reaction where Dp is particle diameter, G the mass flux, the bed voidage, the gas density and A the reactor cross sectional area. , the standard heat of formation of the components. The constants A, B, C, D used for the heat capacity, Cp, in Equations (31) and (32) are taken from [16]. These equations are solved simultaneously using gPROMs to determine the behaviour of the system. gPROMs is a robust mathematical software that can solve the equations for all the four reactors in series dynamically given the behaviour of the paraffins, naphthenes and aromatics as well as the dynamics of the temperature in the reactors. All the components behaviours were determined.
RON = Aa + BbT + CcT2 + DdT3 + EeT4
6. Model Validation
The model validation was carried out by modelling and simulating the commercial data of [11,12] on gPROMs to ascertain the capability and ruggedness of the mathematical software in complex modelling. The modelling of [11] was performed using MATLAB software and the result is compared with that obtained with gPROMs. The configuration of the commercial reformer and Feed Properties are given in Table 4; Table 5 respectively.
Table 4.
Configuration of Commercial Catalytic Reformer [11].
Table 5.
Feed stock Properties of Commercial Catalytic Reformer [11].
The commercial reformer of [11] was simulated with the properties of Table 4 and Table 5 respectively with four semi regenerative reactors in series. The reformer’s through put is 30 MBPD at inlet temperature of 495 °C, pressure of 10.5 kg/cm2 using MATLAB mathematical tool on ODE45.
The simulation was performed on gPROMs software to validate its capability in modelling this problem. The result obtained from gPROMs is compared with that obtained with MATLAB from [11] and are shown in Table 6. The result showed a good and comparable result between the actual and that simulated with gPROMs. This is an indication of the capability of the mathematical tool in solving complex model equations and hence can be used as a validation for modelling other catalytic reformers using same kinetic models.
Table 6.
Comparison between results from MATLAB [11] and gPROMs.
7. Results and Discussion
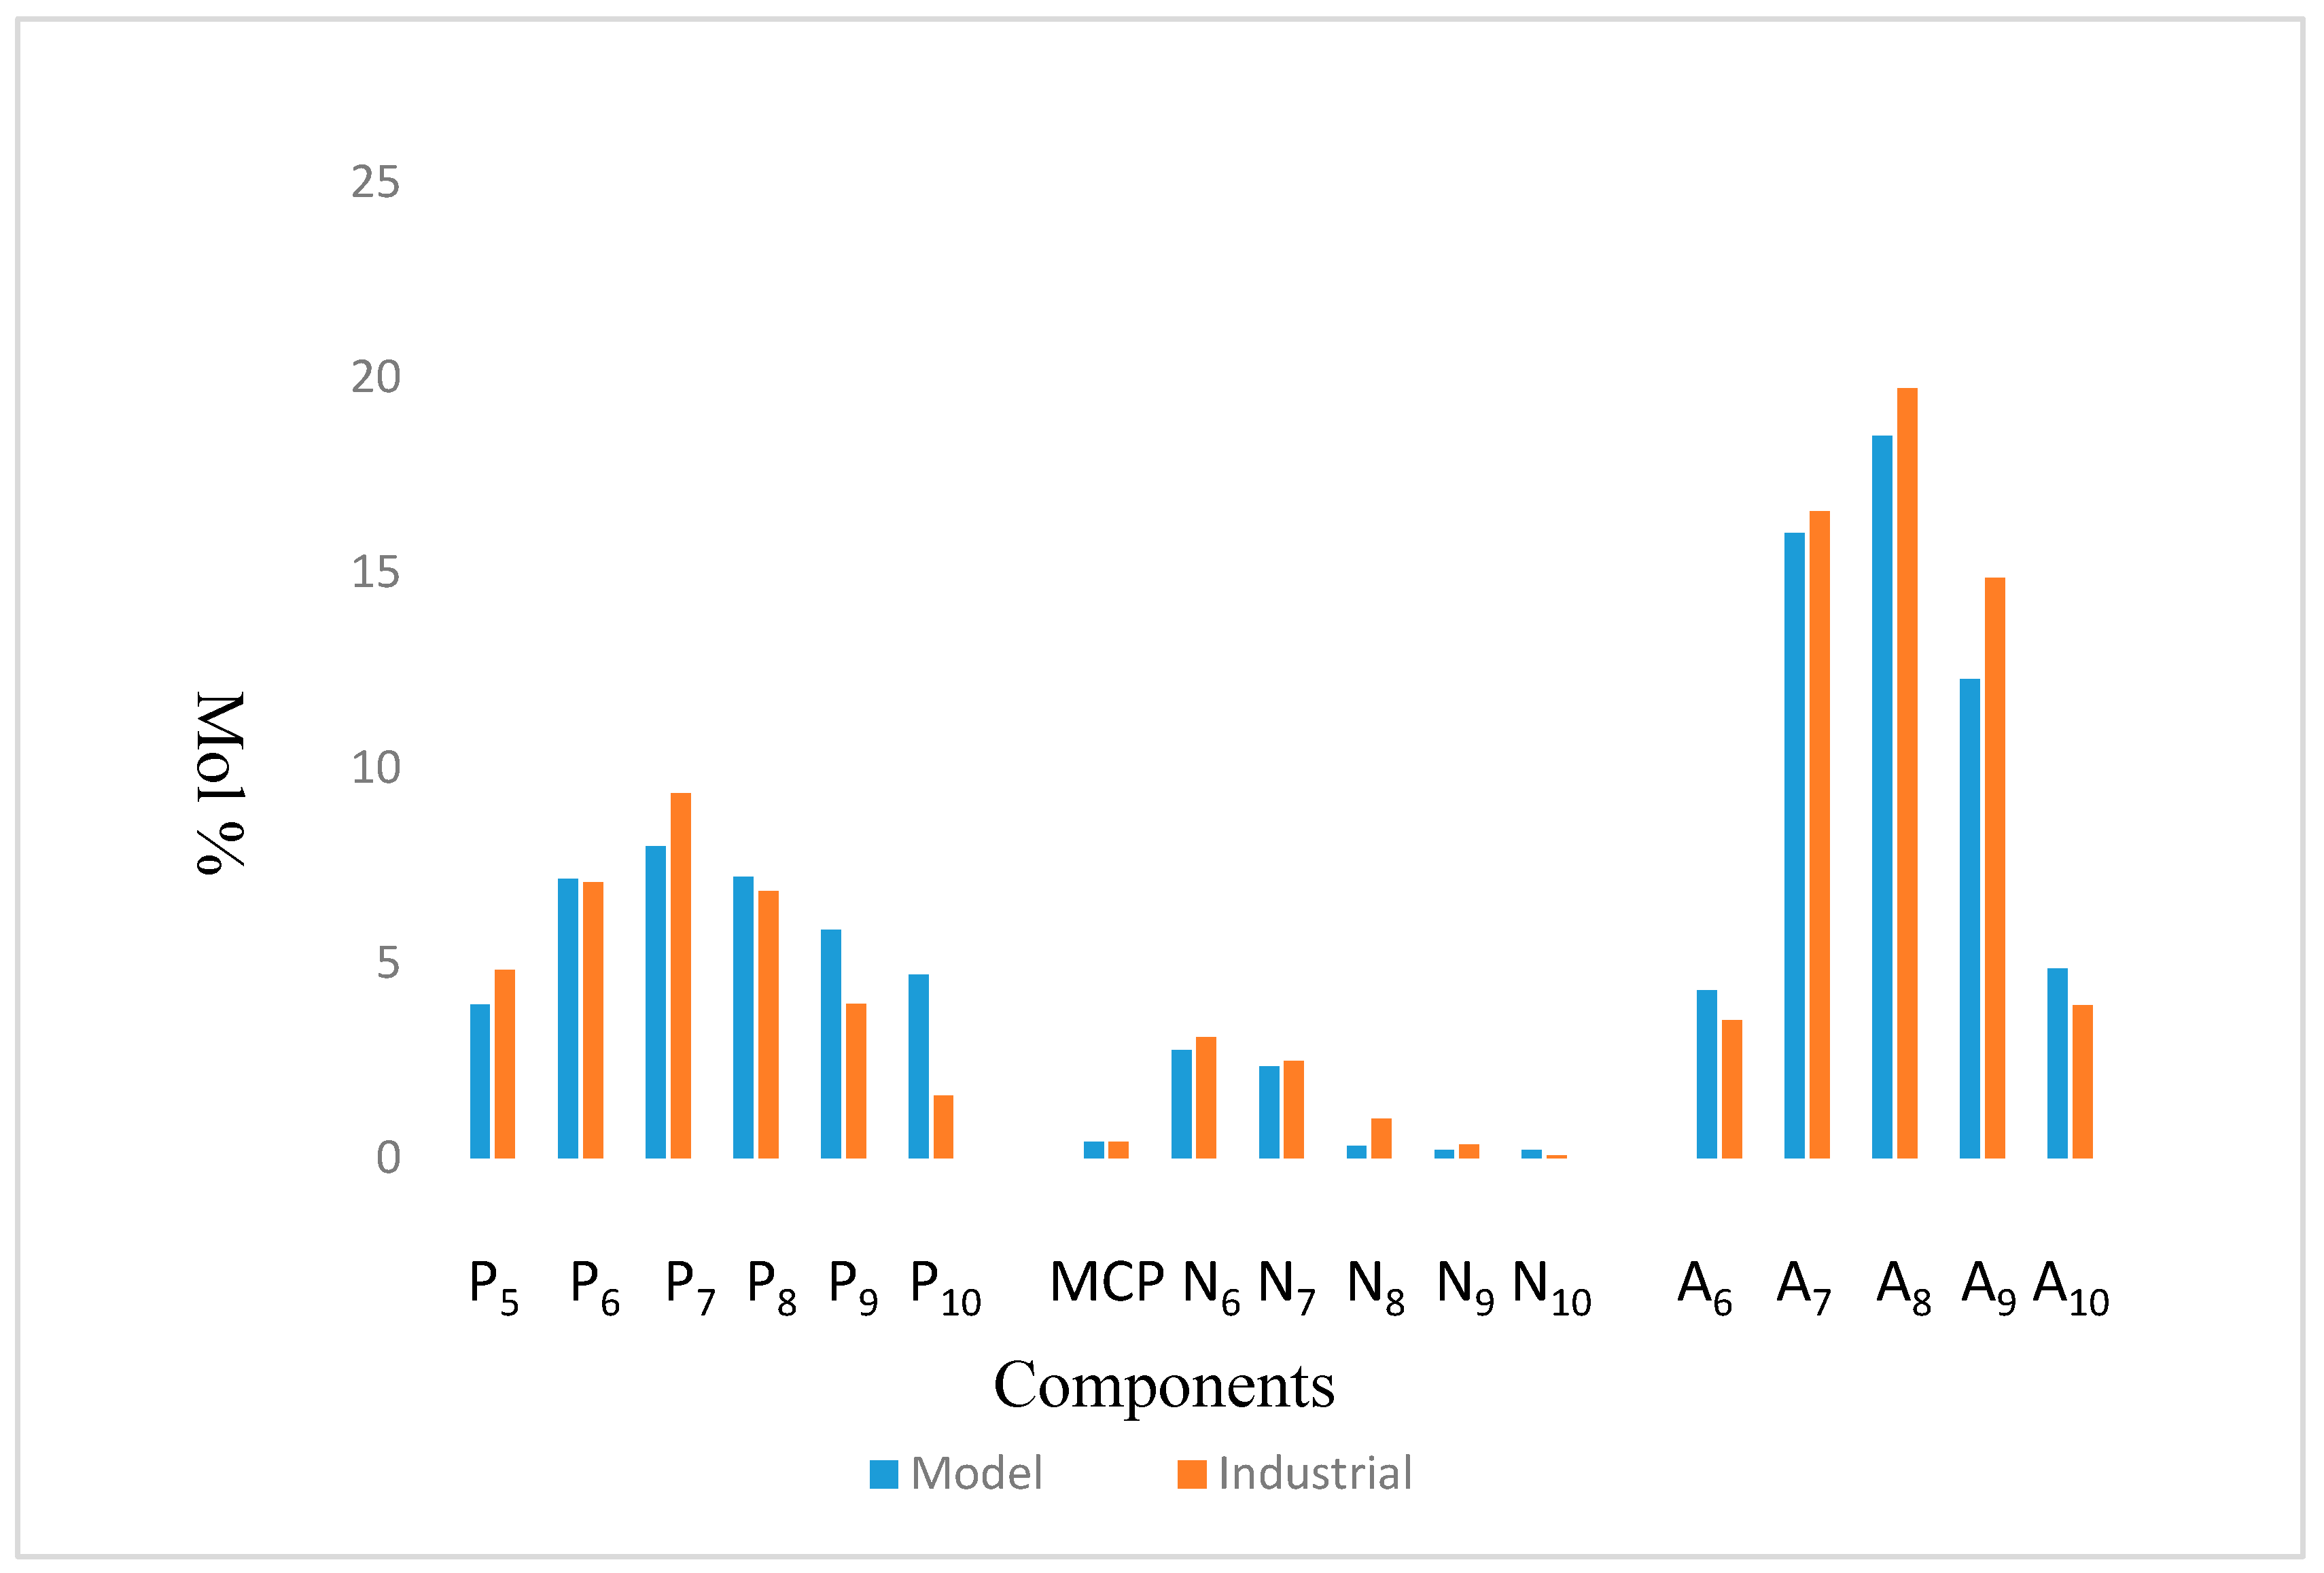
The model was simulated based on the kinetic data from [11,12] and validated with Kaduna Refining & Petrochemical Company, KRPC Commercial Catalytic Reformer data from Nigeria. Table 7 and Table 8 show the Configuration and Feed Properties of KRPC Reformer. The results show a good agreement as shown in Figure 3 and Table 9.
Table 7.
Configuration of KRPC Commercial Catalytic Reformer.
Table 8.
Feed Properties KRPC Commercial Catalytic Reformer.
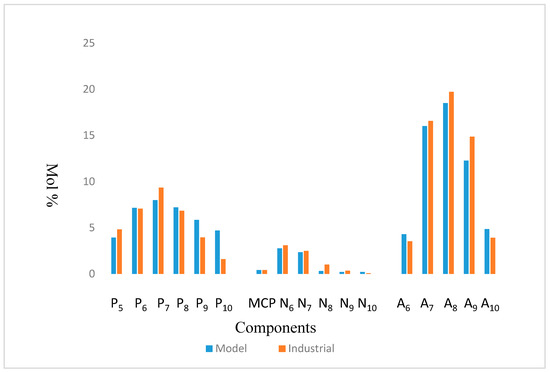
Figure 3.
Comparison between Model Simulation and Industrial Plant data of KRPC.
Table 9.
Relative errors between Industrial and Simulated results of KRPC plant.
7.1. Steady State Simulation Results
The time derivatives of the model equation are set to zero to simulate the process at steady state. The modelling results from the model equations of (27)–(32) gives the concentration and temperature distribution only across the reactor height. In this work, four reactors are simulated with the reactor configurations given in Table 4. The total reactor height is 25.232 m which is total sum of the heights of the four reactors as in Table 4 and is denoted as height of reactor in Section 7.1 therefore the height in Figure 4, Figure 5, Figure 6, Figure 7, Figure 8 and Figure 9 refer to reactors total height of 25.232 m. In Section 7.2, the different reactors heights for the four reactors were used differently to show variation with both the height and time as shown in Figure 10, Figure 11, Figure 12, Figure 13 and Figure 14.
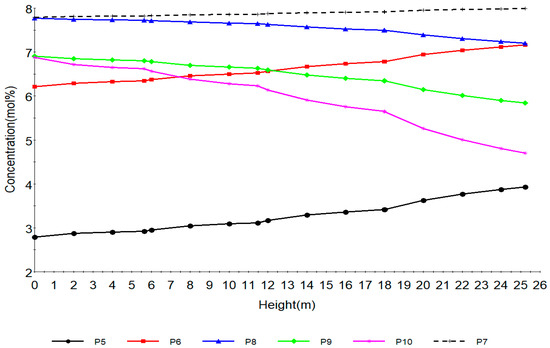
Figure 4.
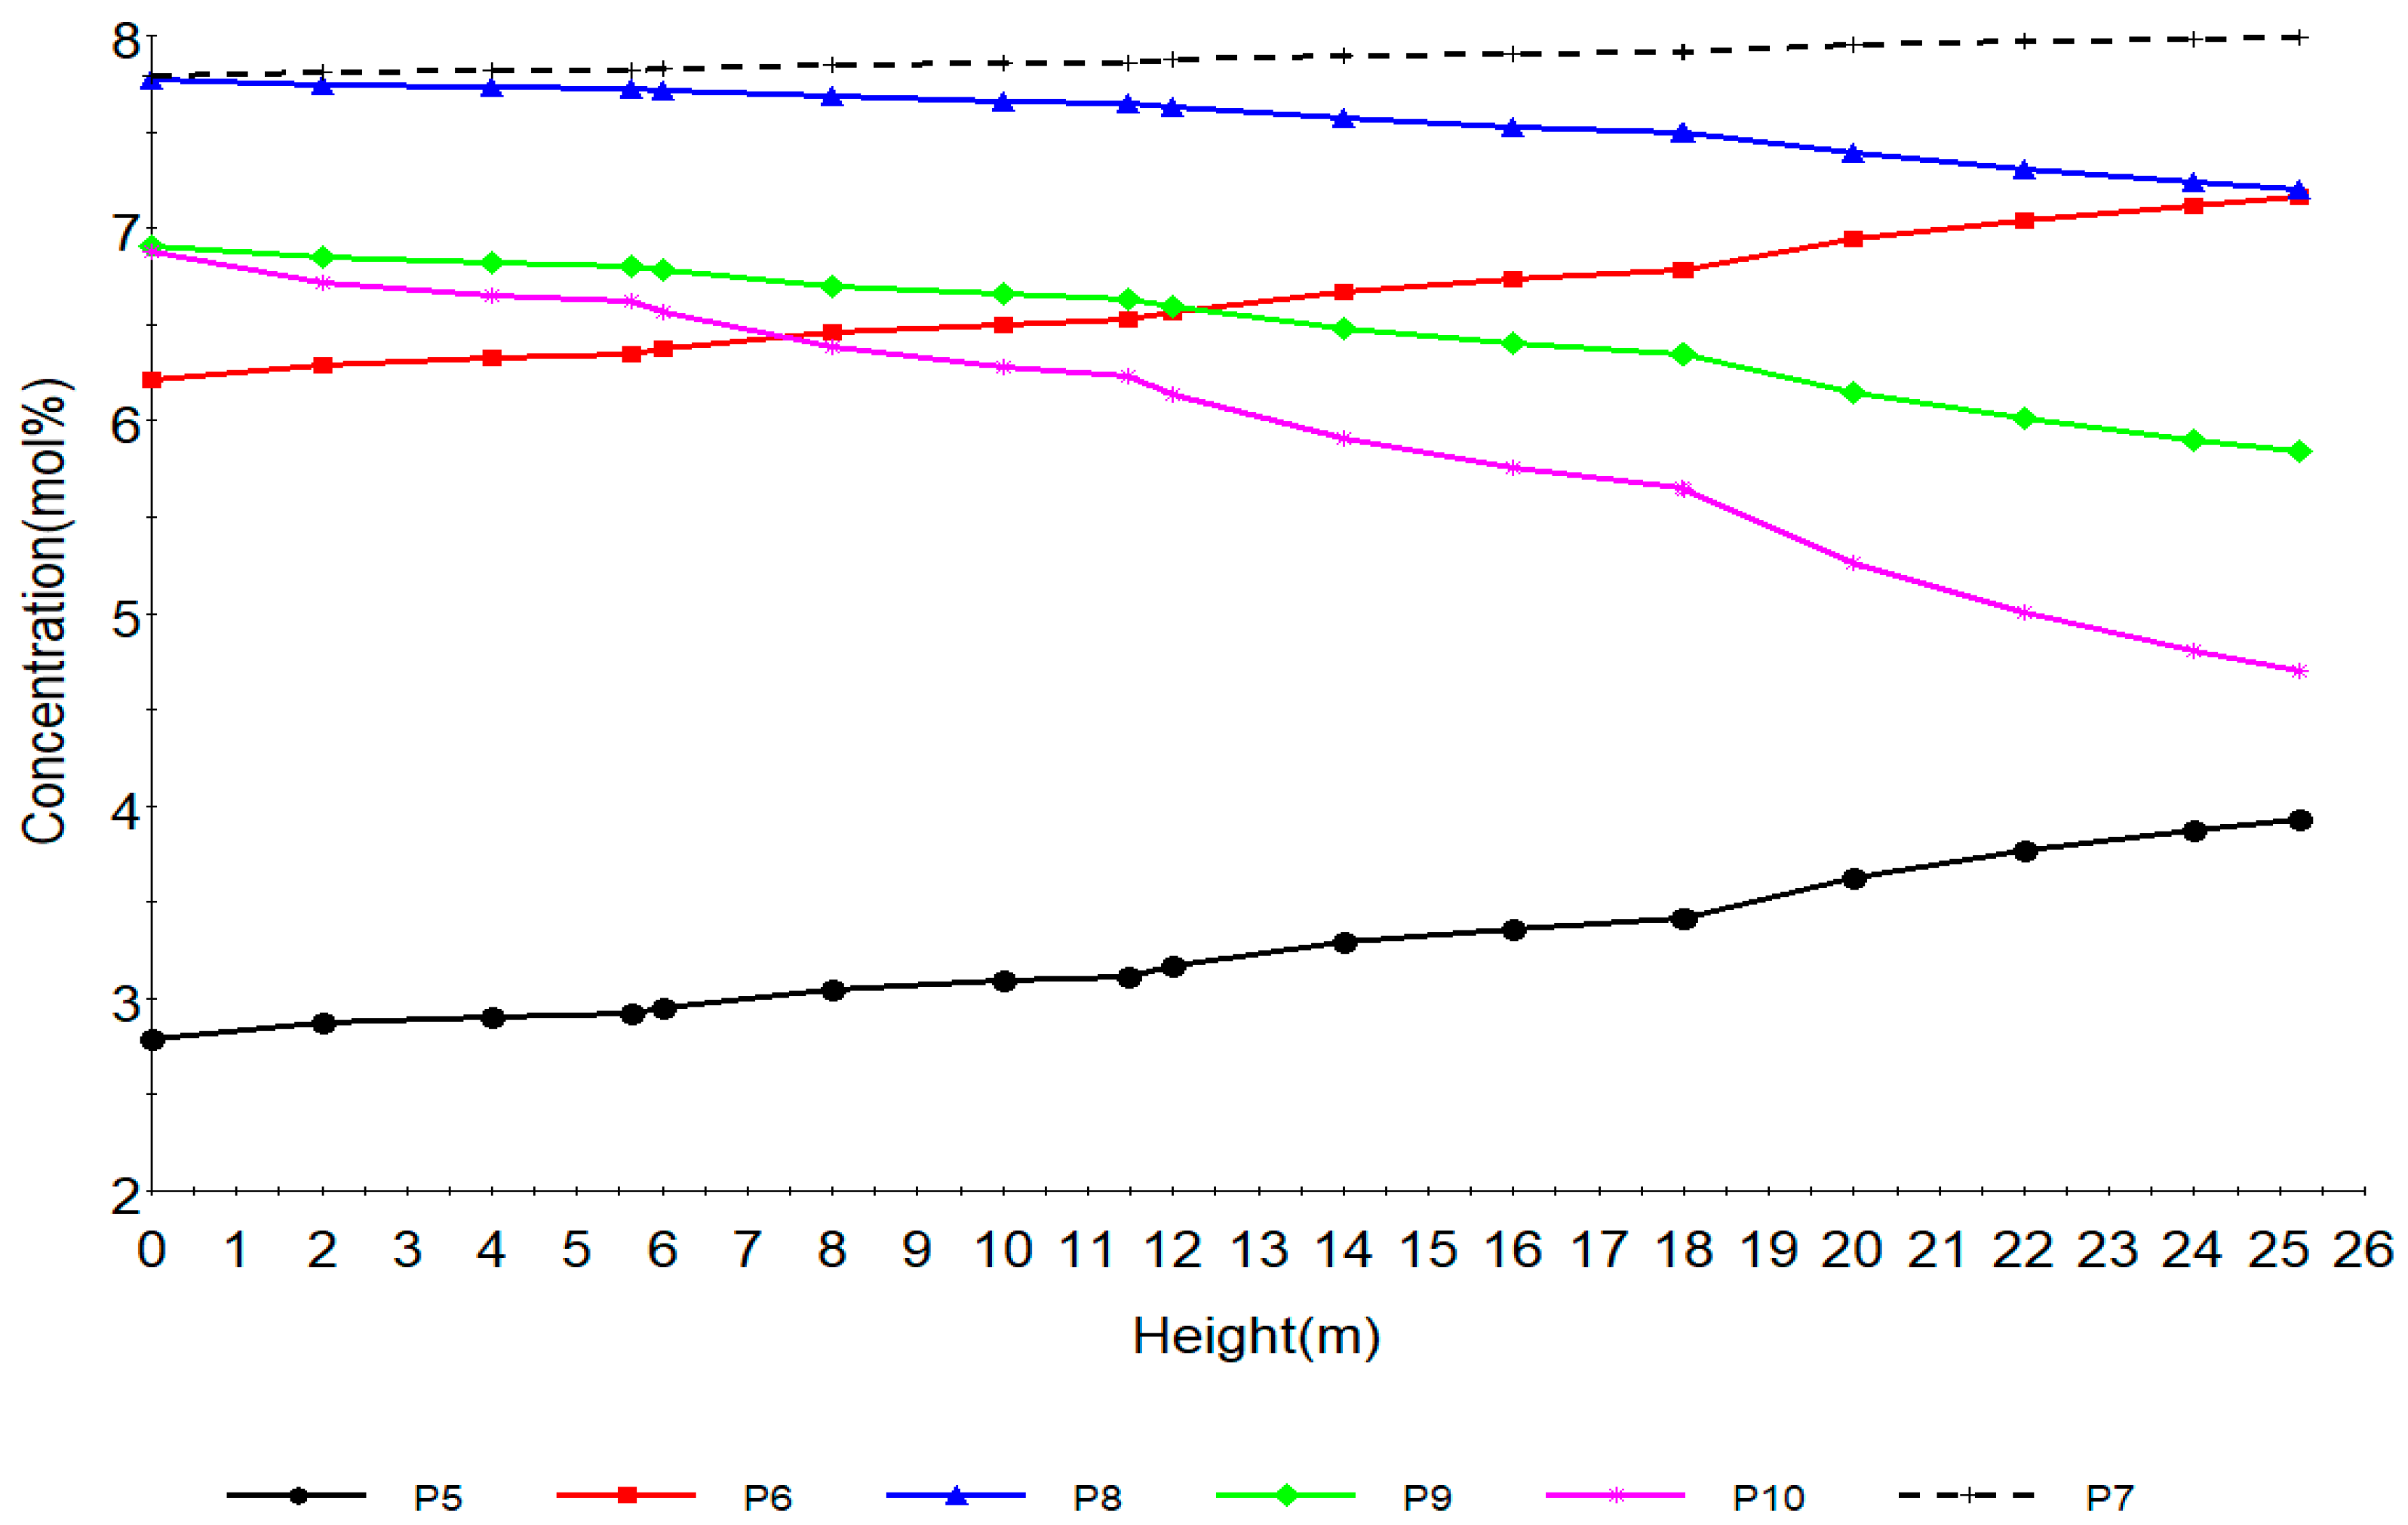
Concentration profile of paraffins with total height of reactors.
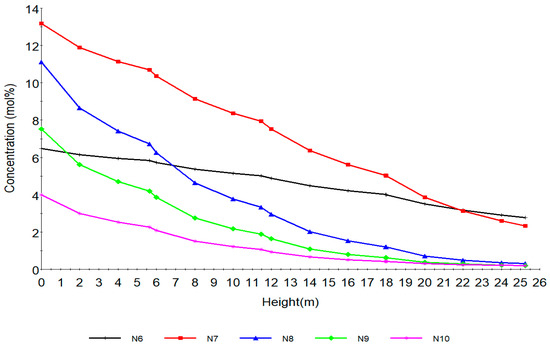
Figure 5.
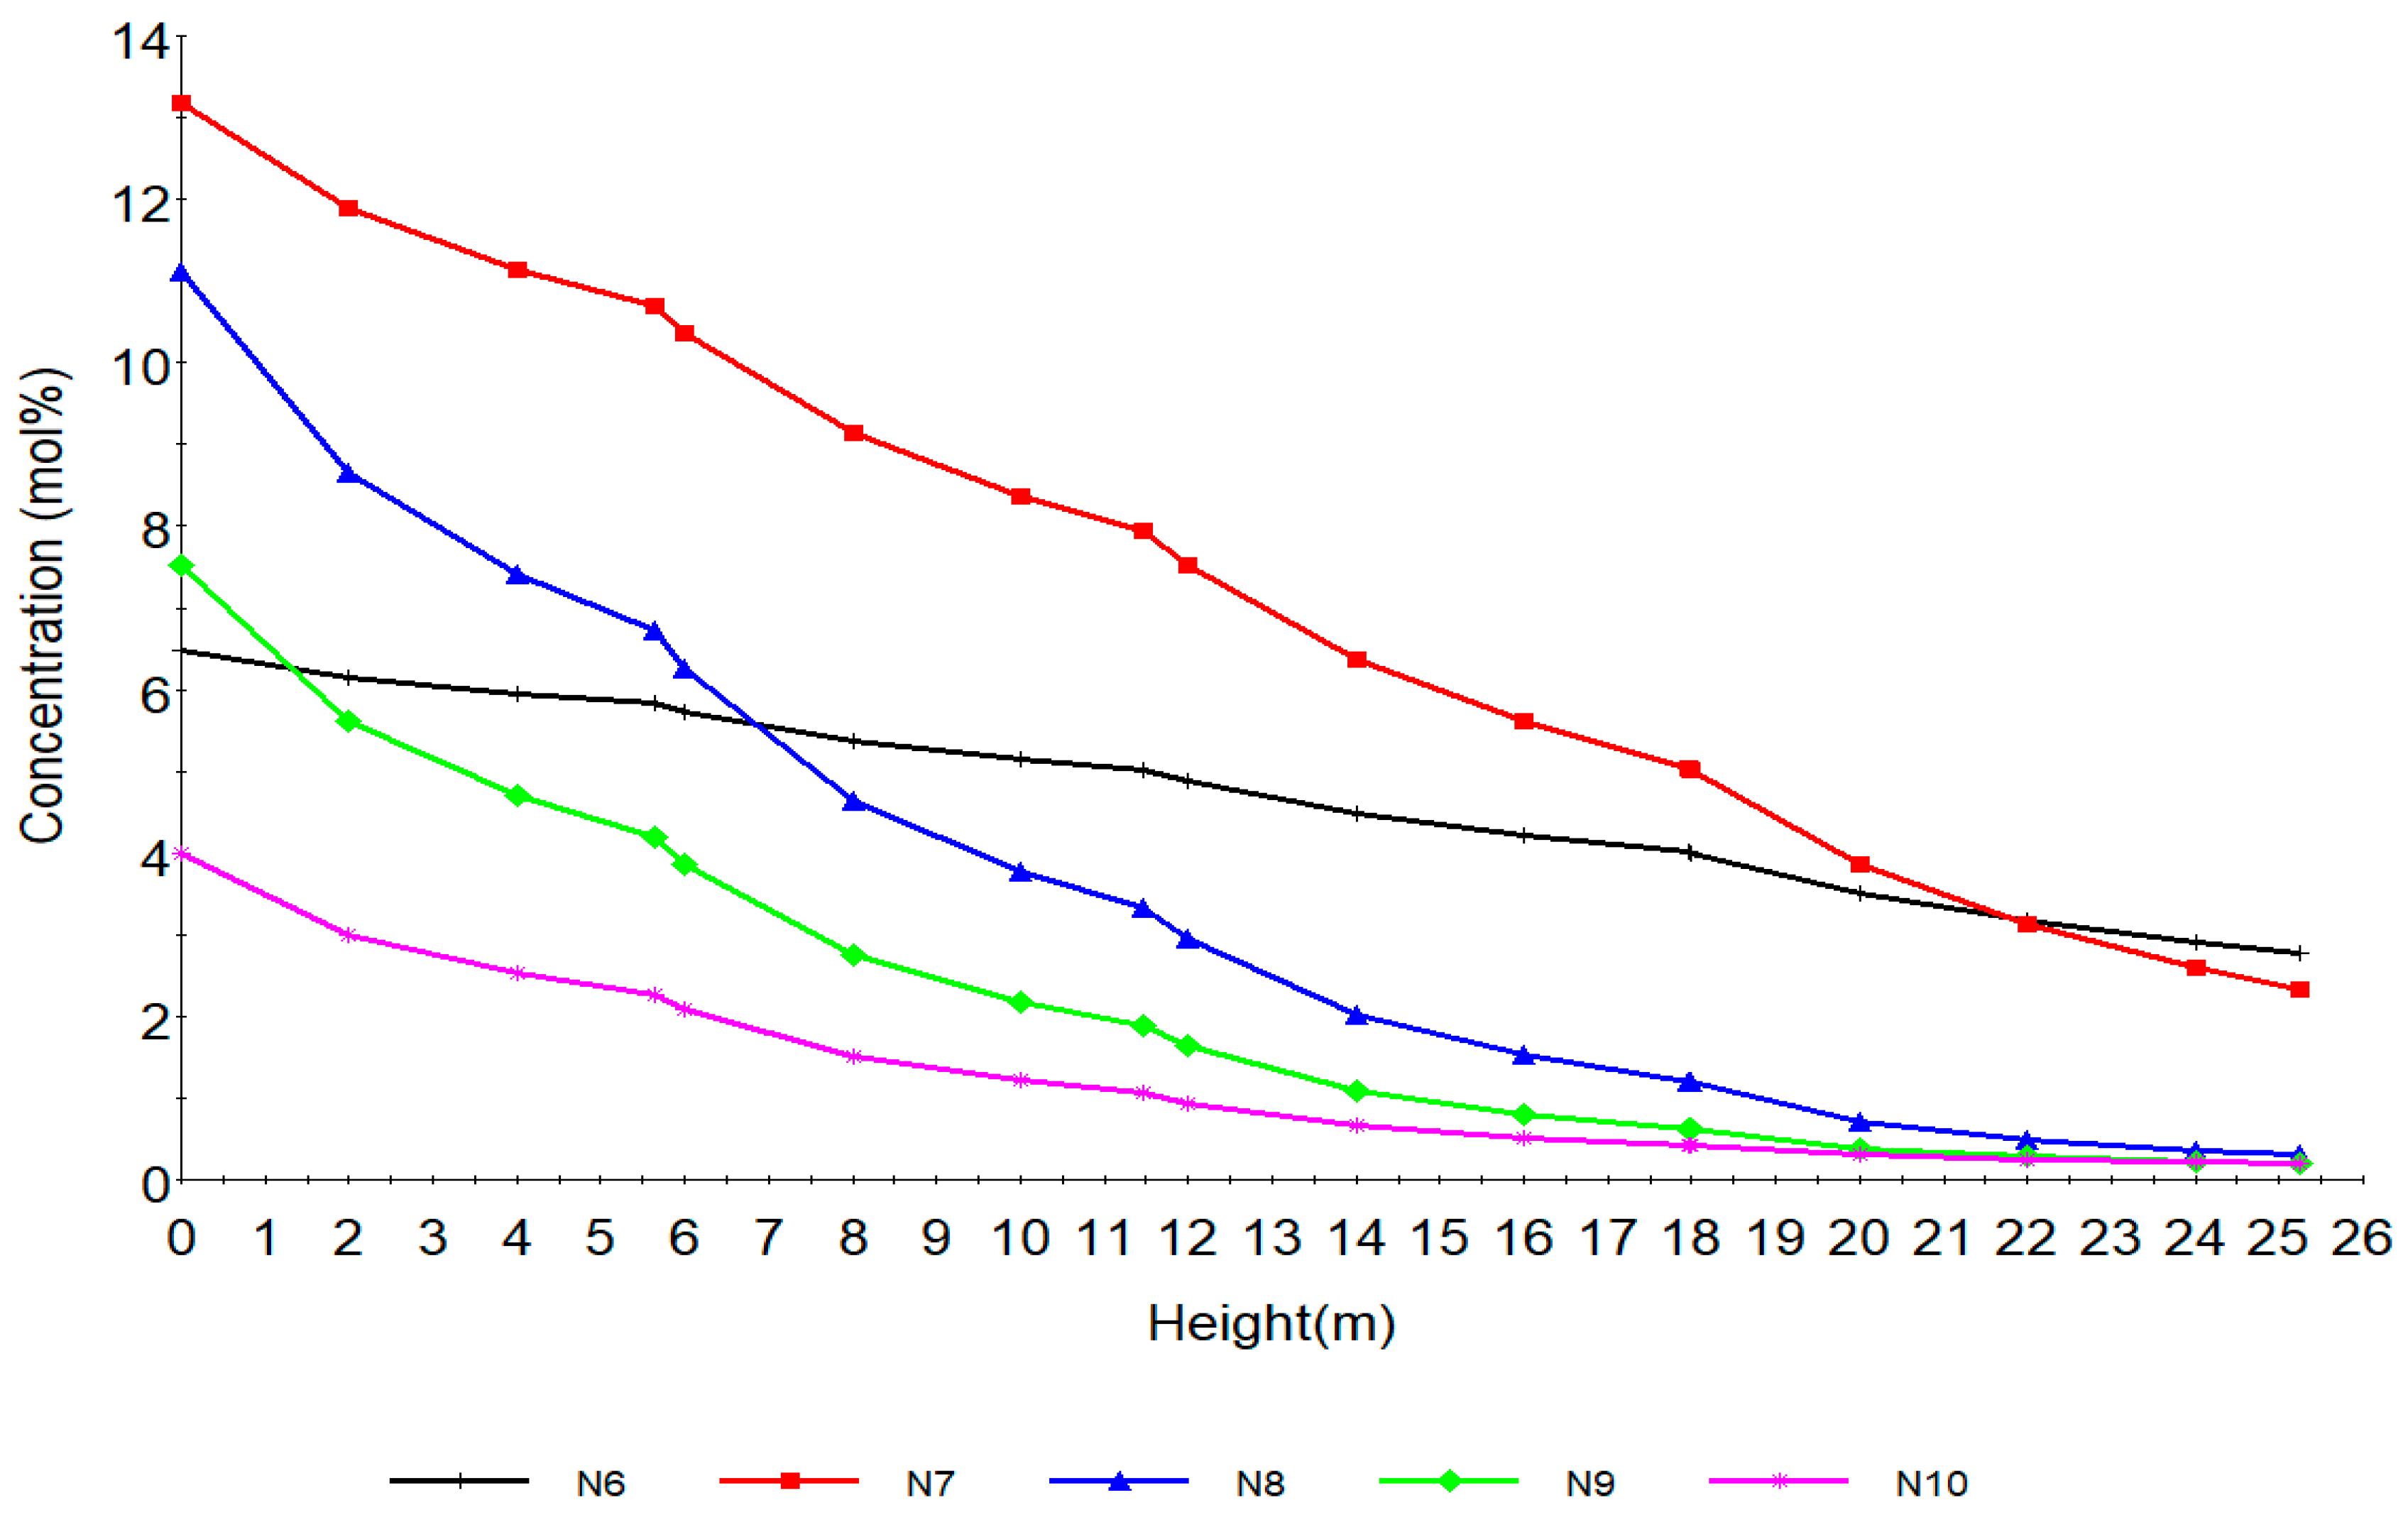
Concentration profile of naphthenes with total height of reactors.
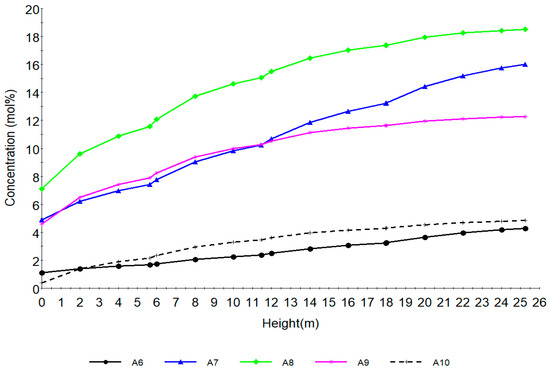
Figure 6.
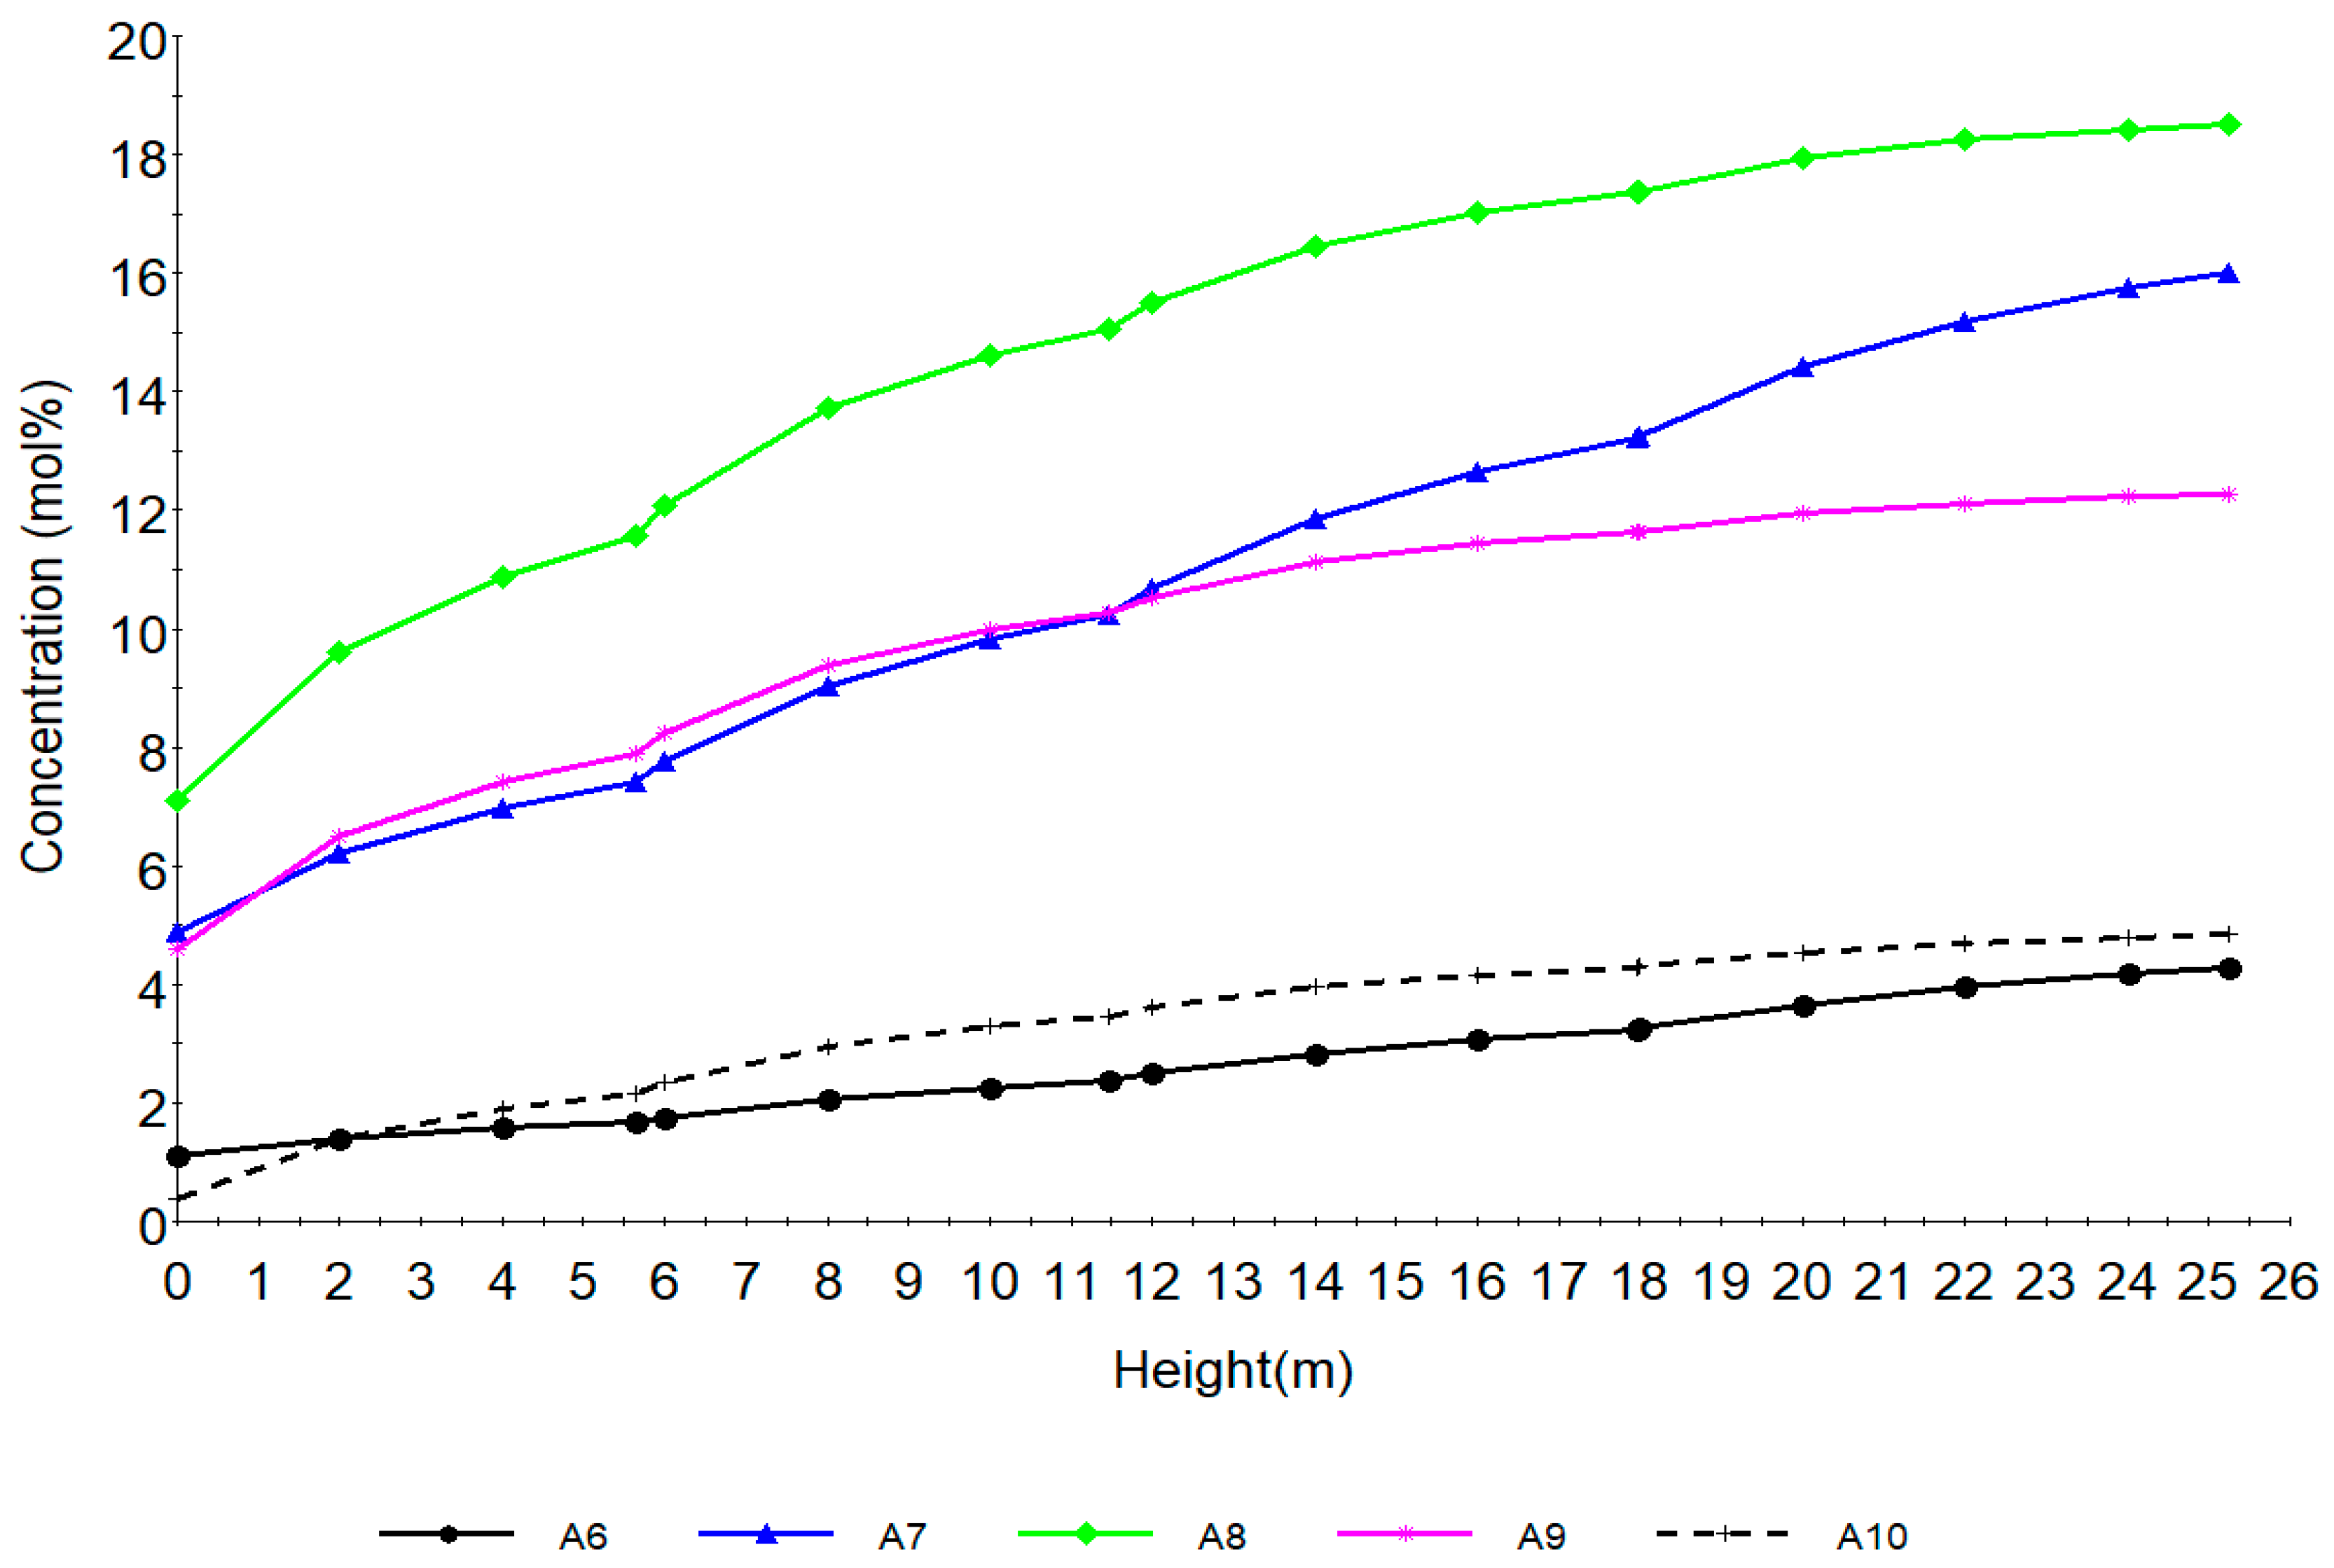
Concentration profile of aromatics with total height of reactors.
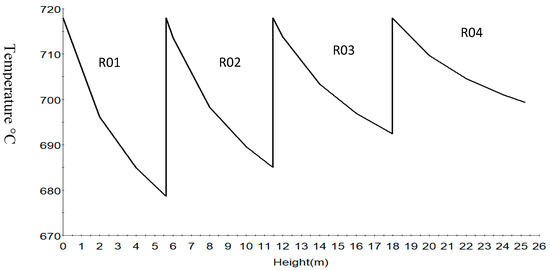
Figure 7.
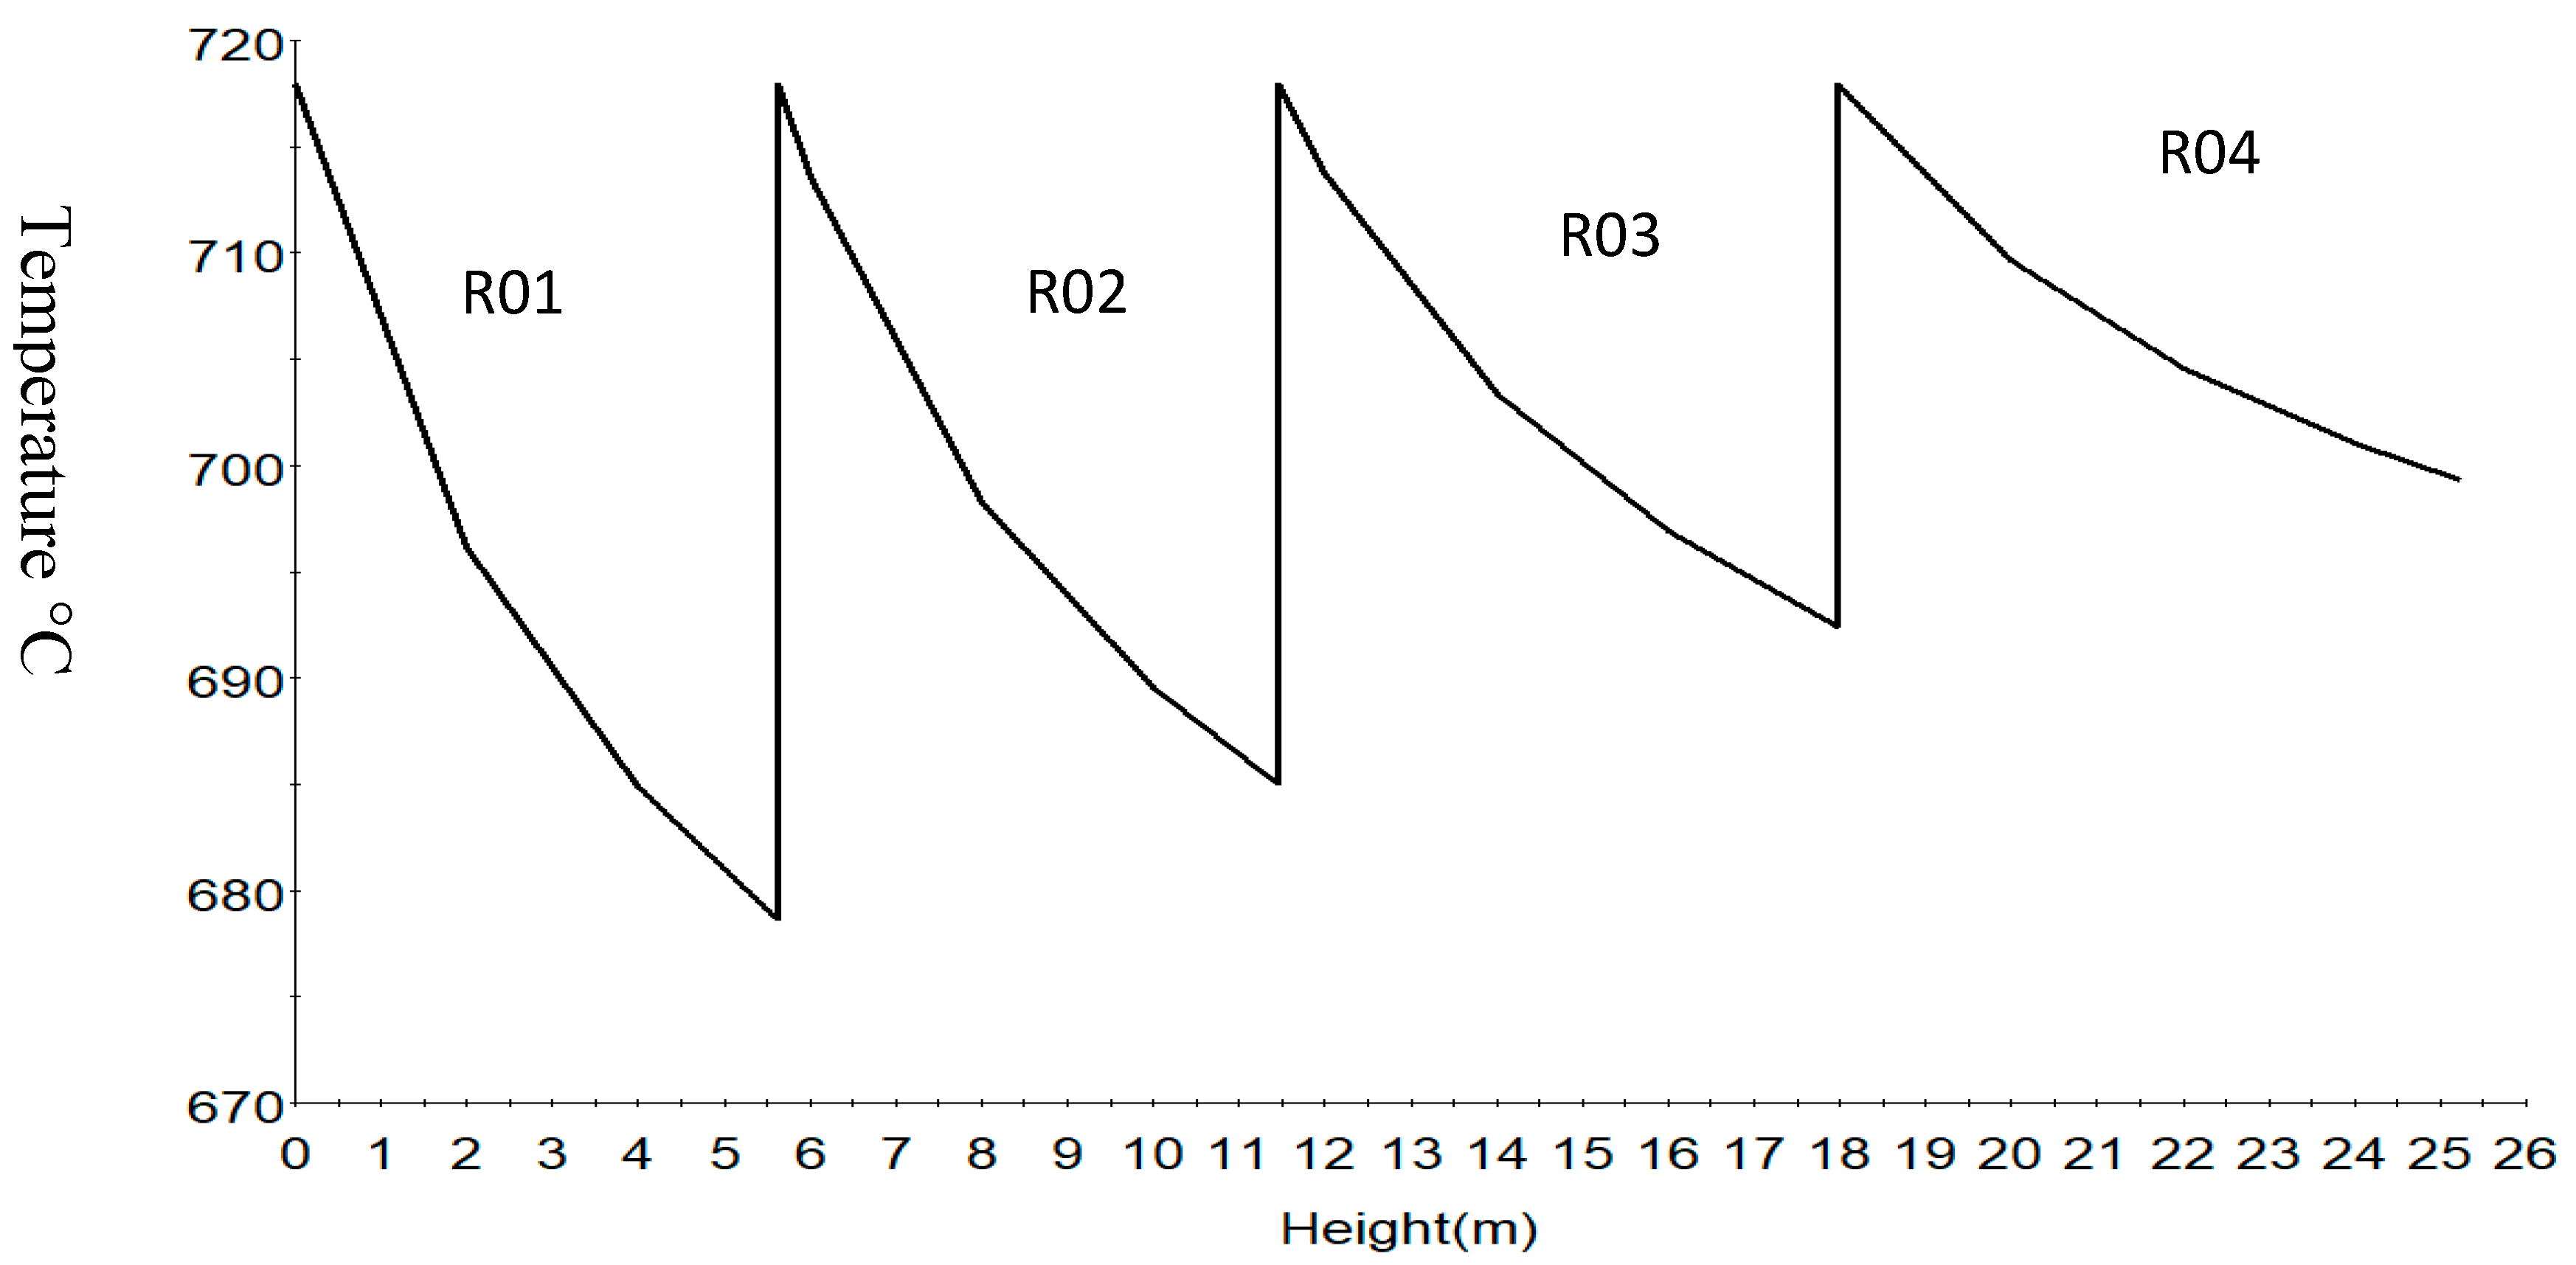
Temperature profile in the four reactors.
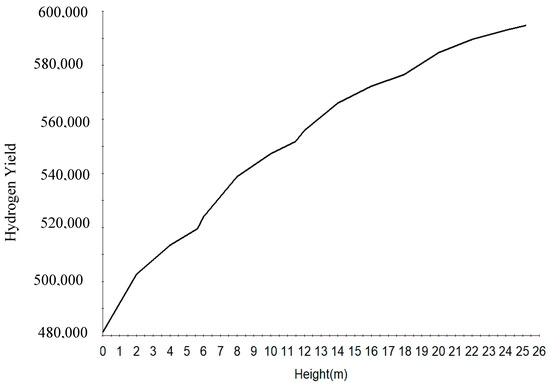
Figure 8.
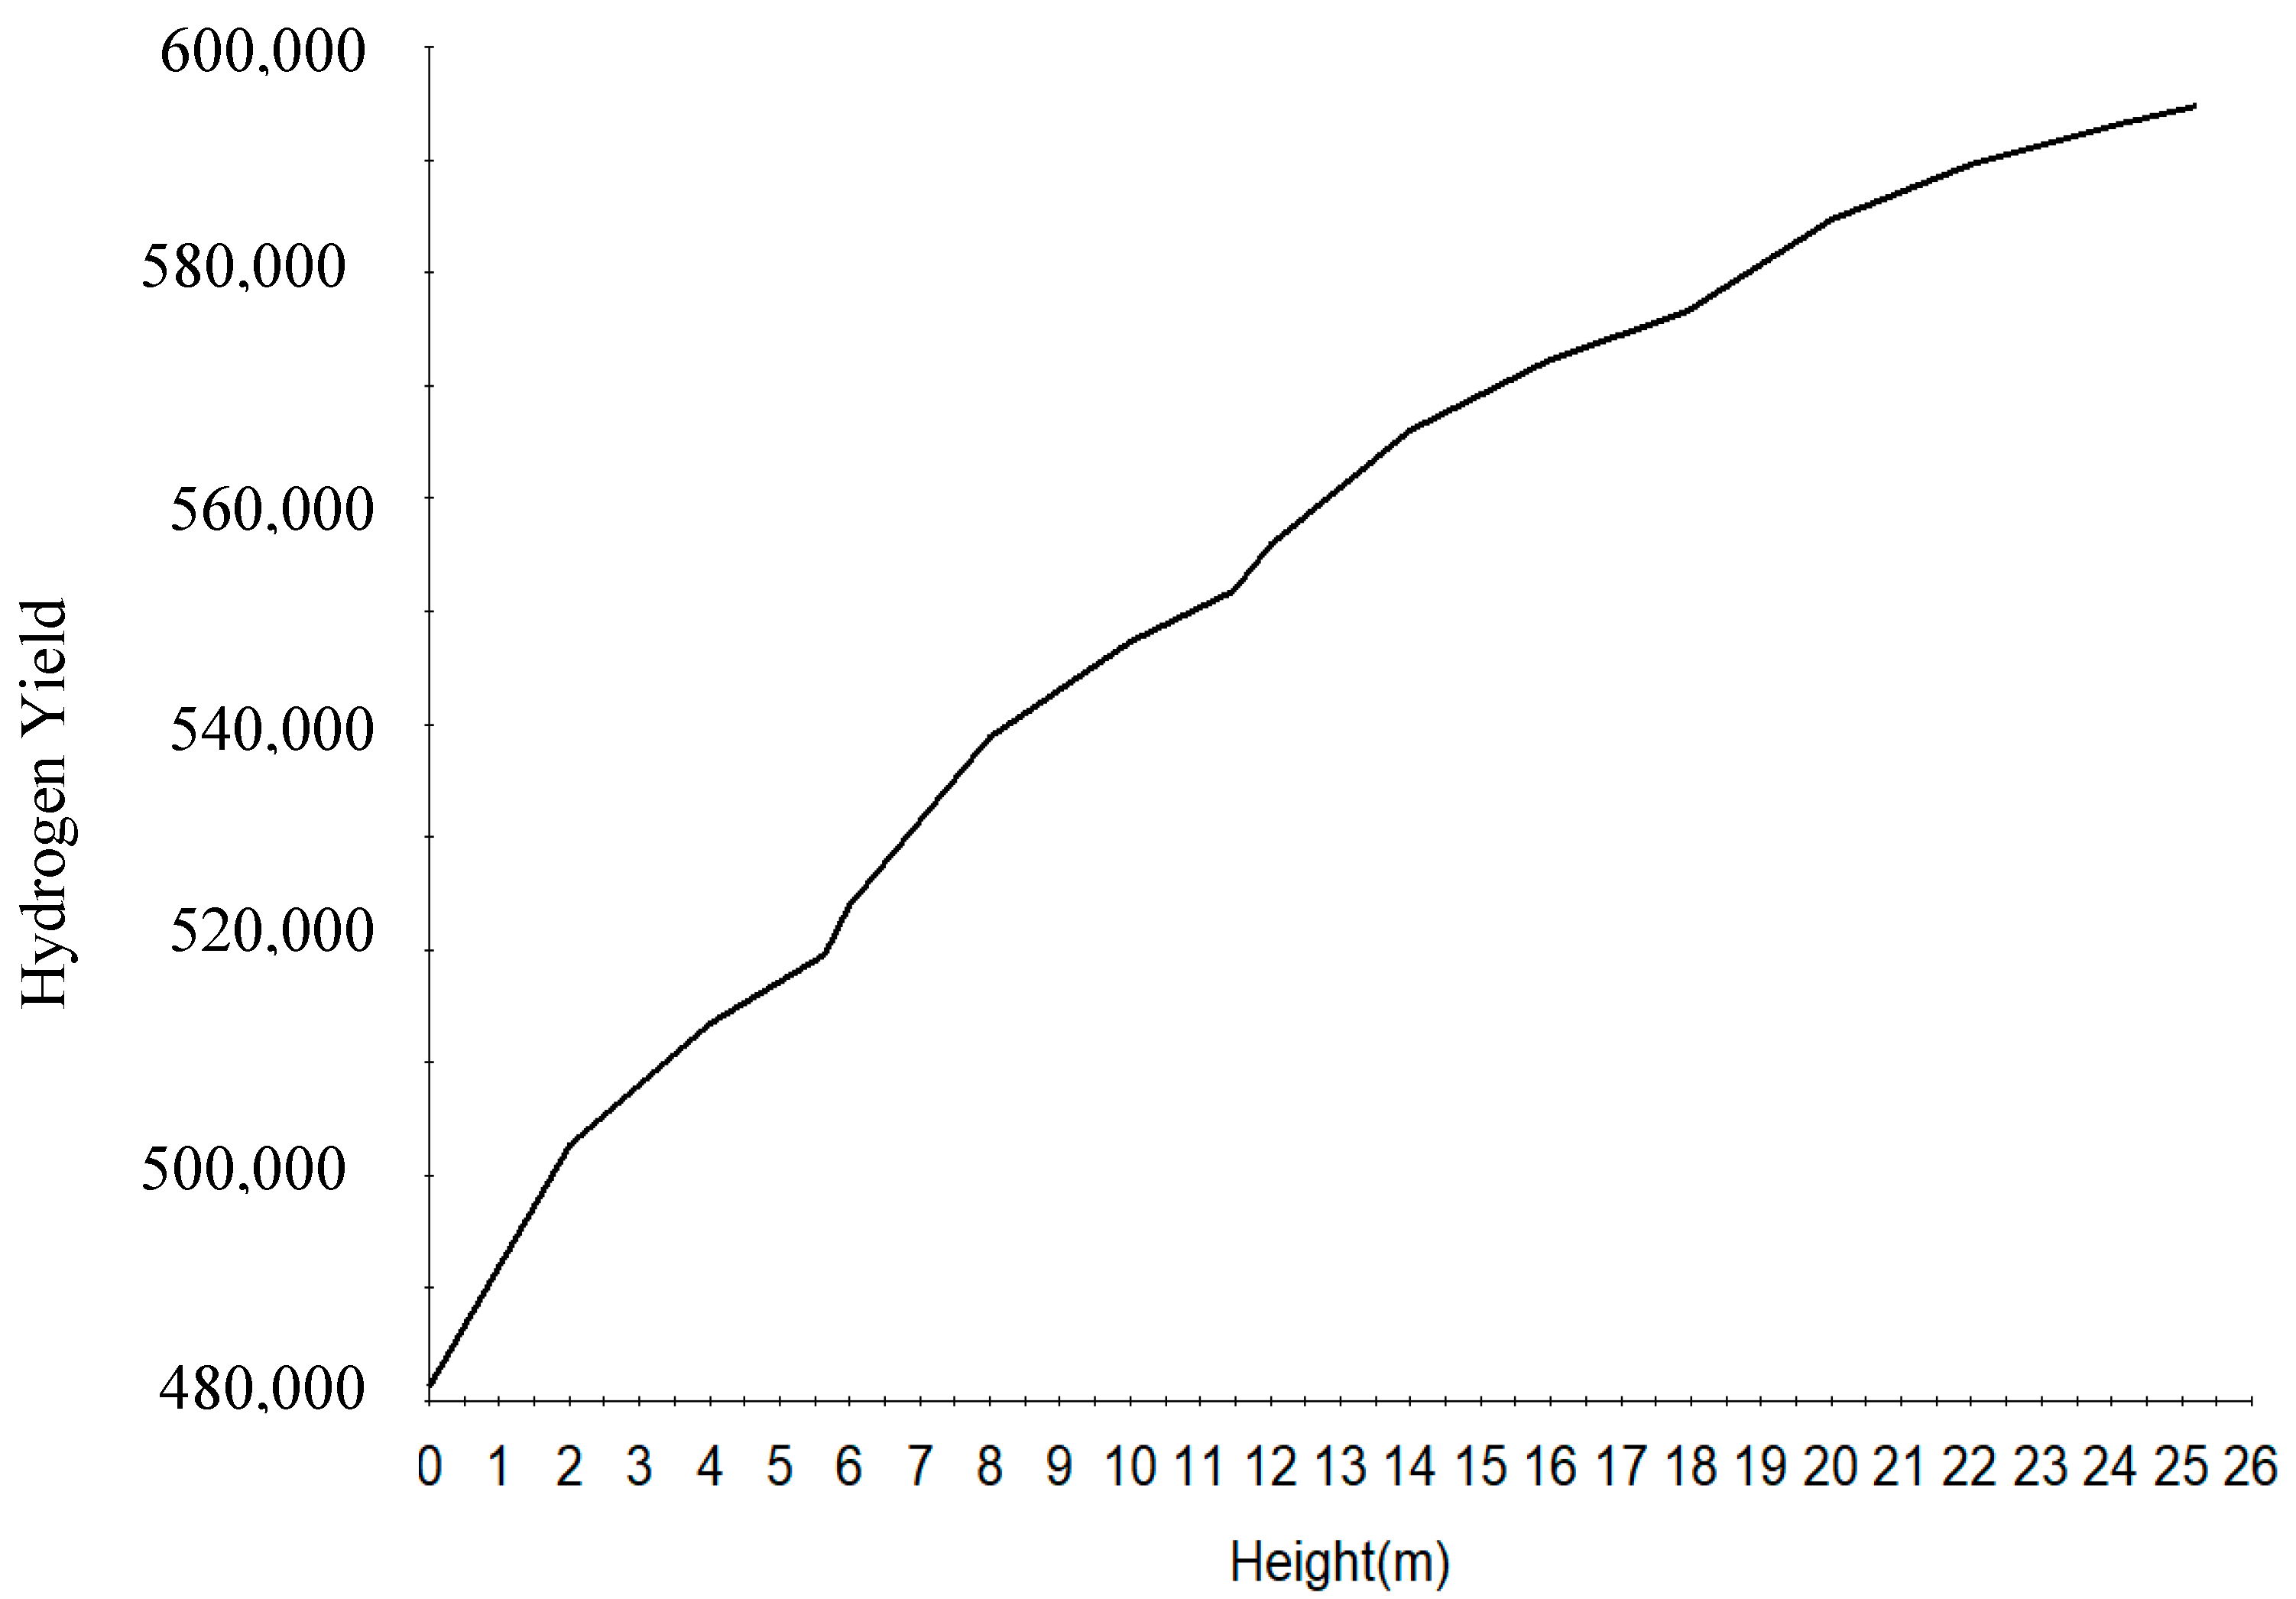
H2 yield along the four reactors height.
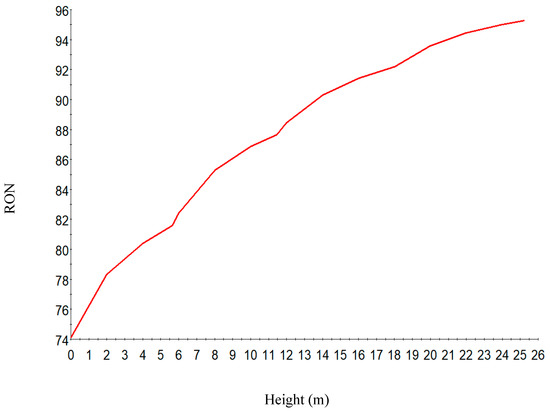
Figure 9.
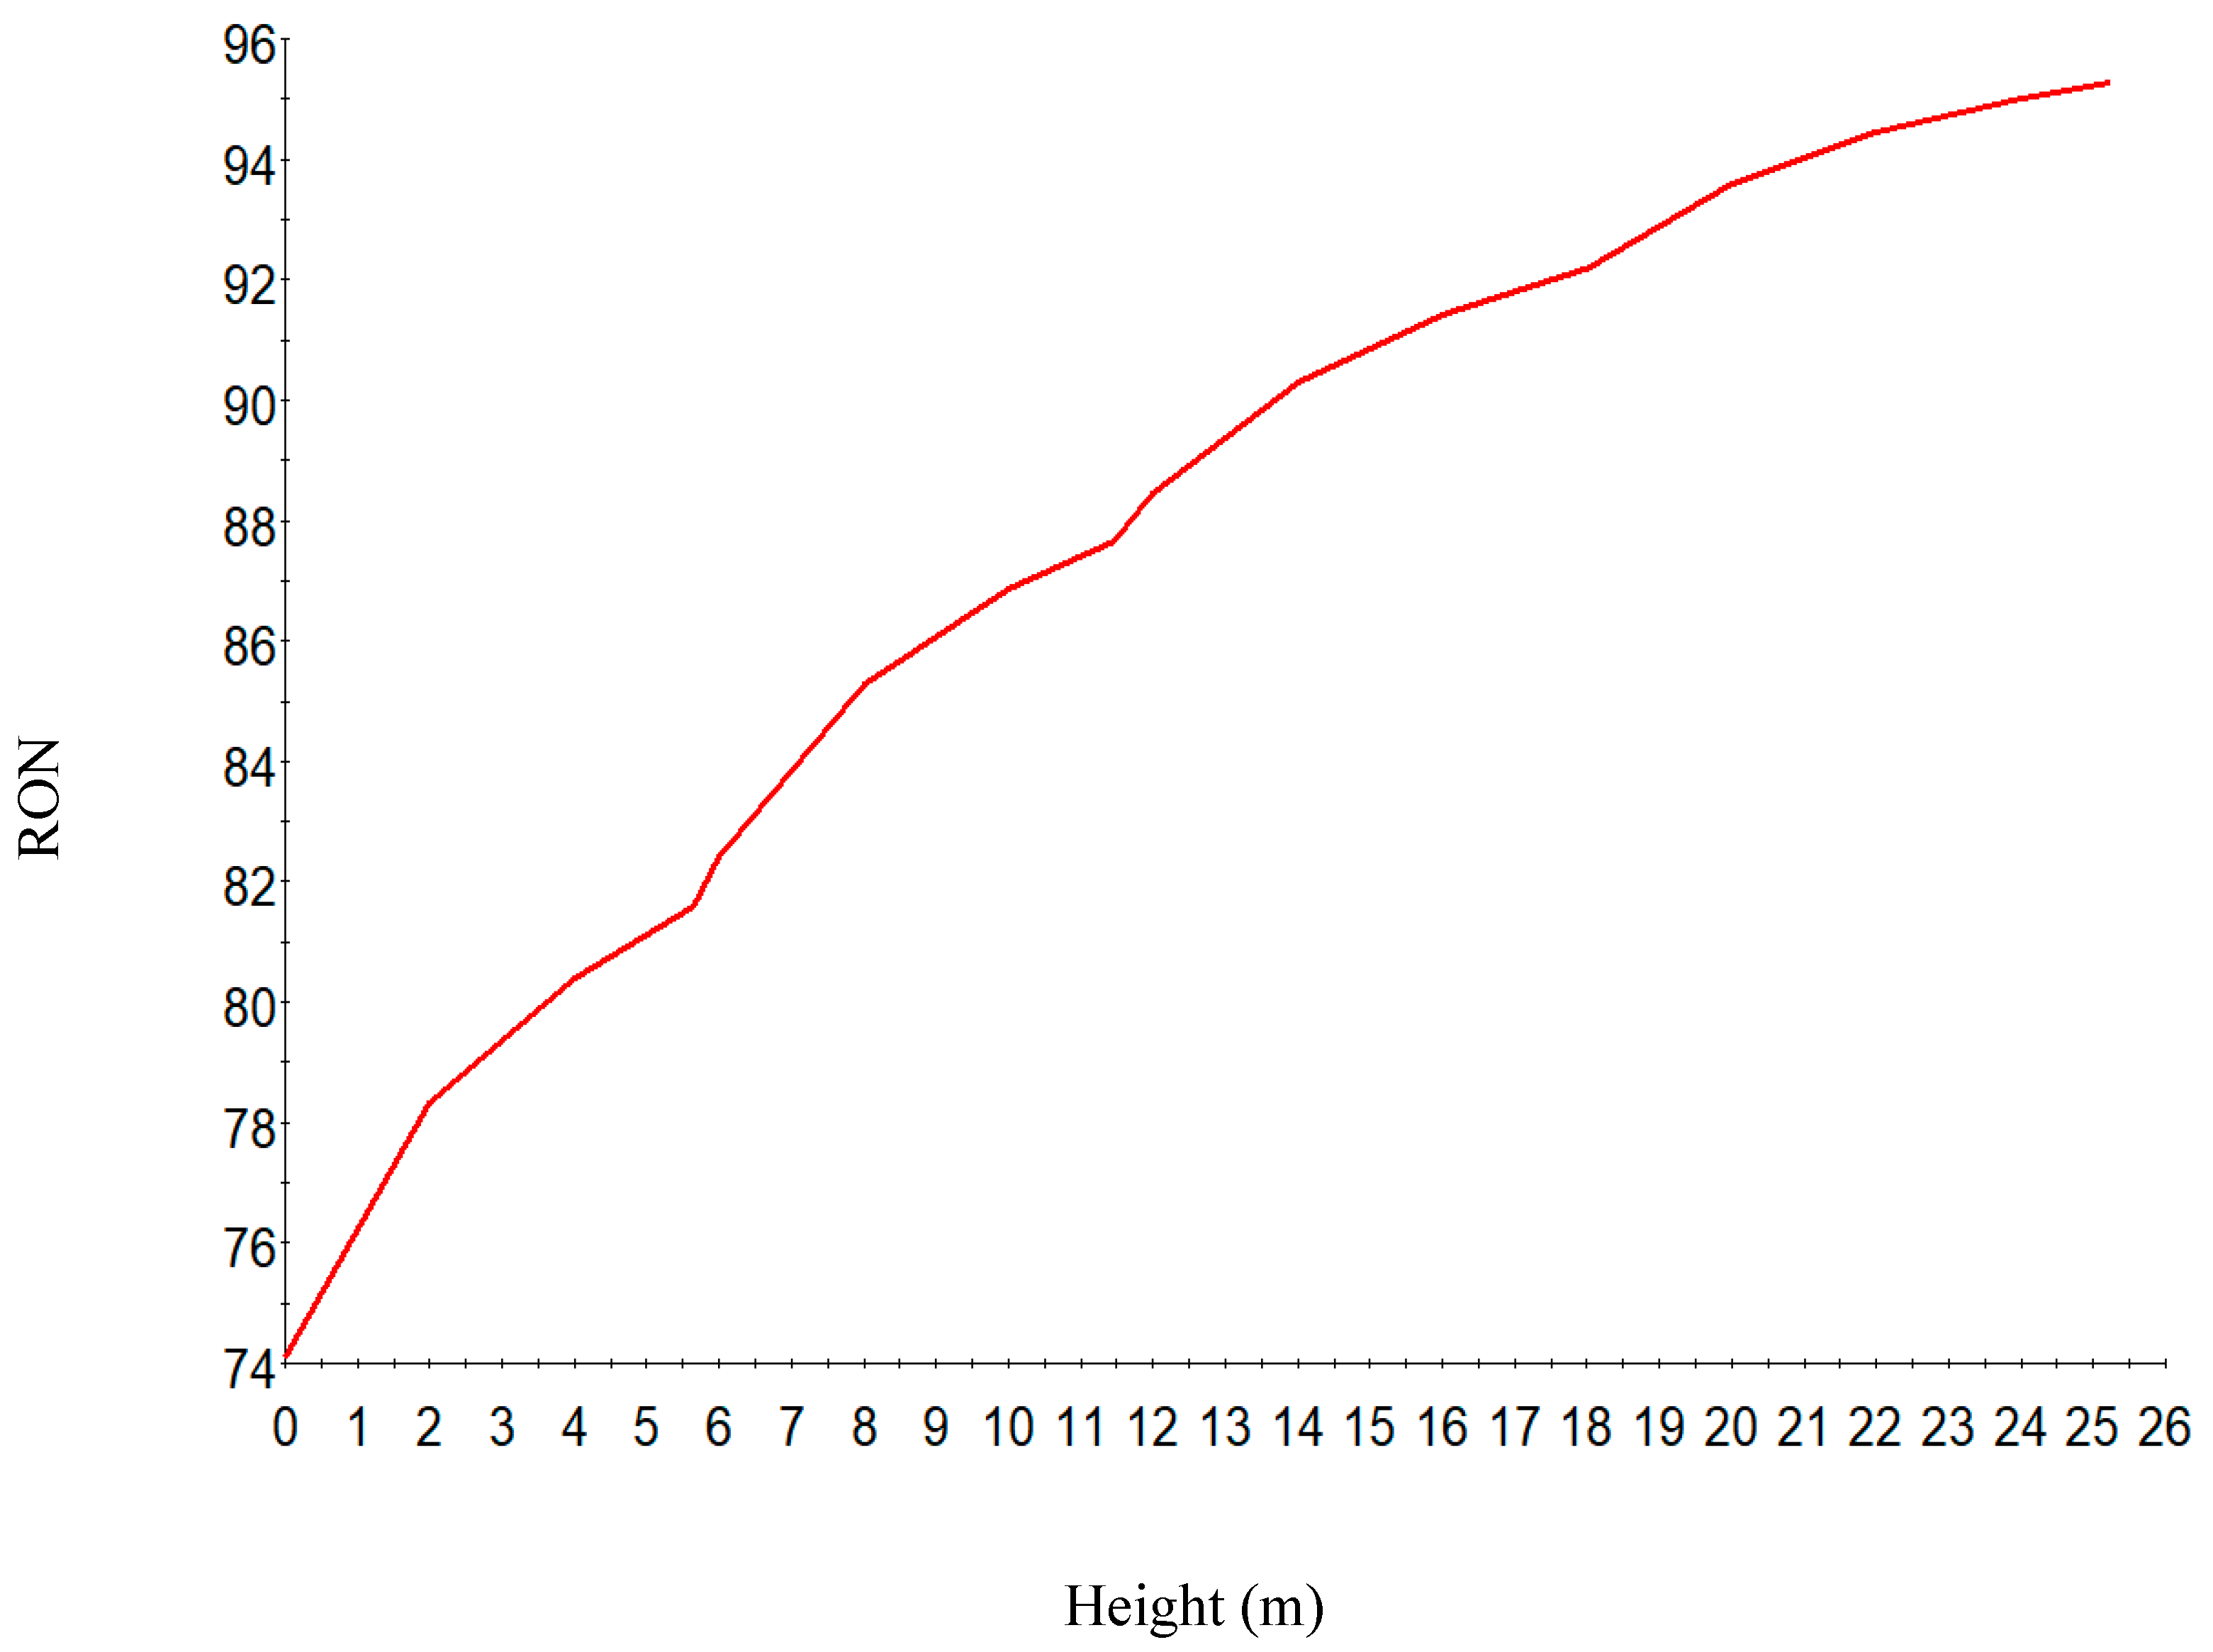
RON along the reactor height.

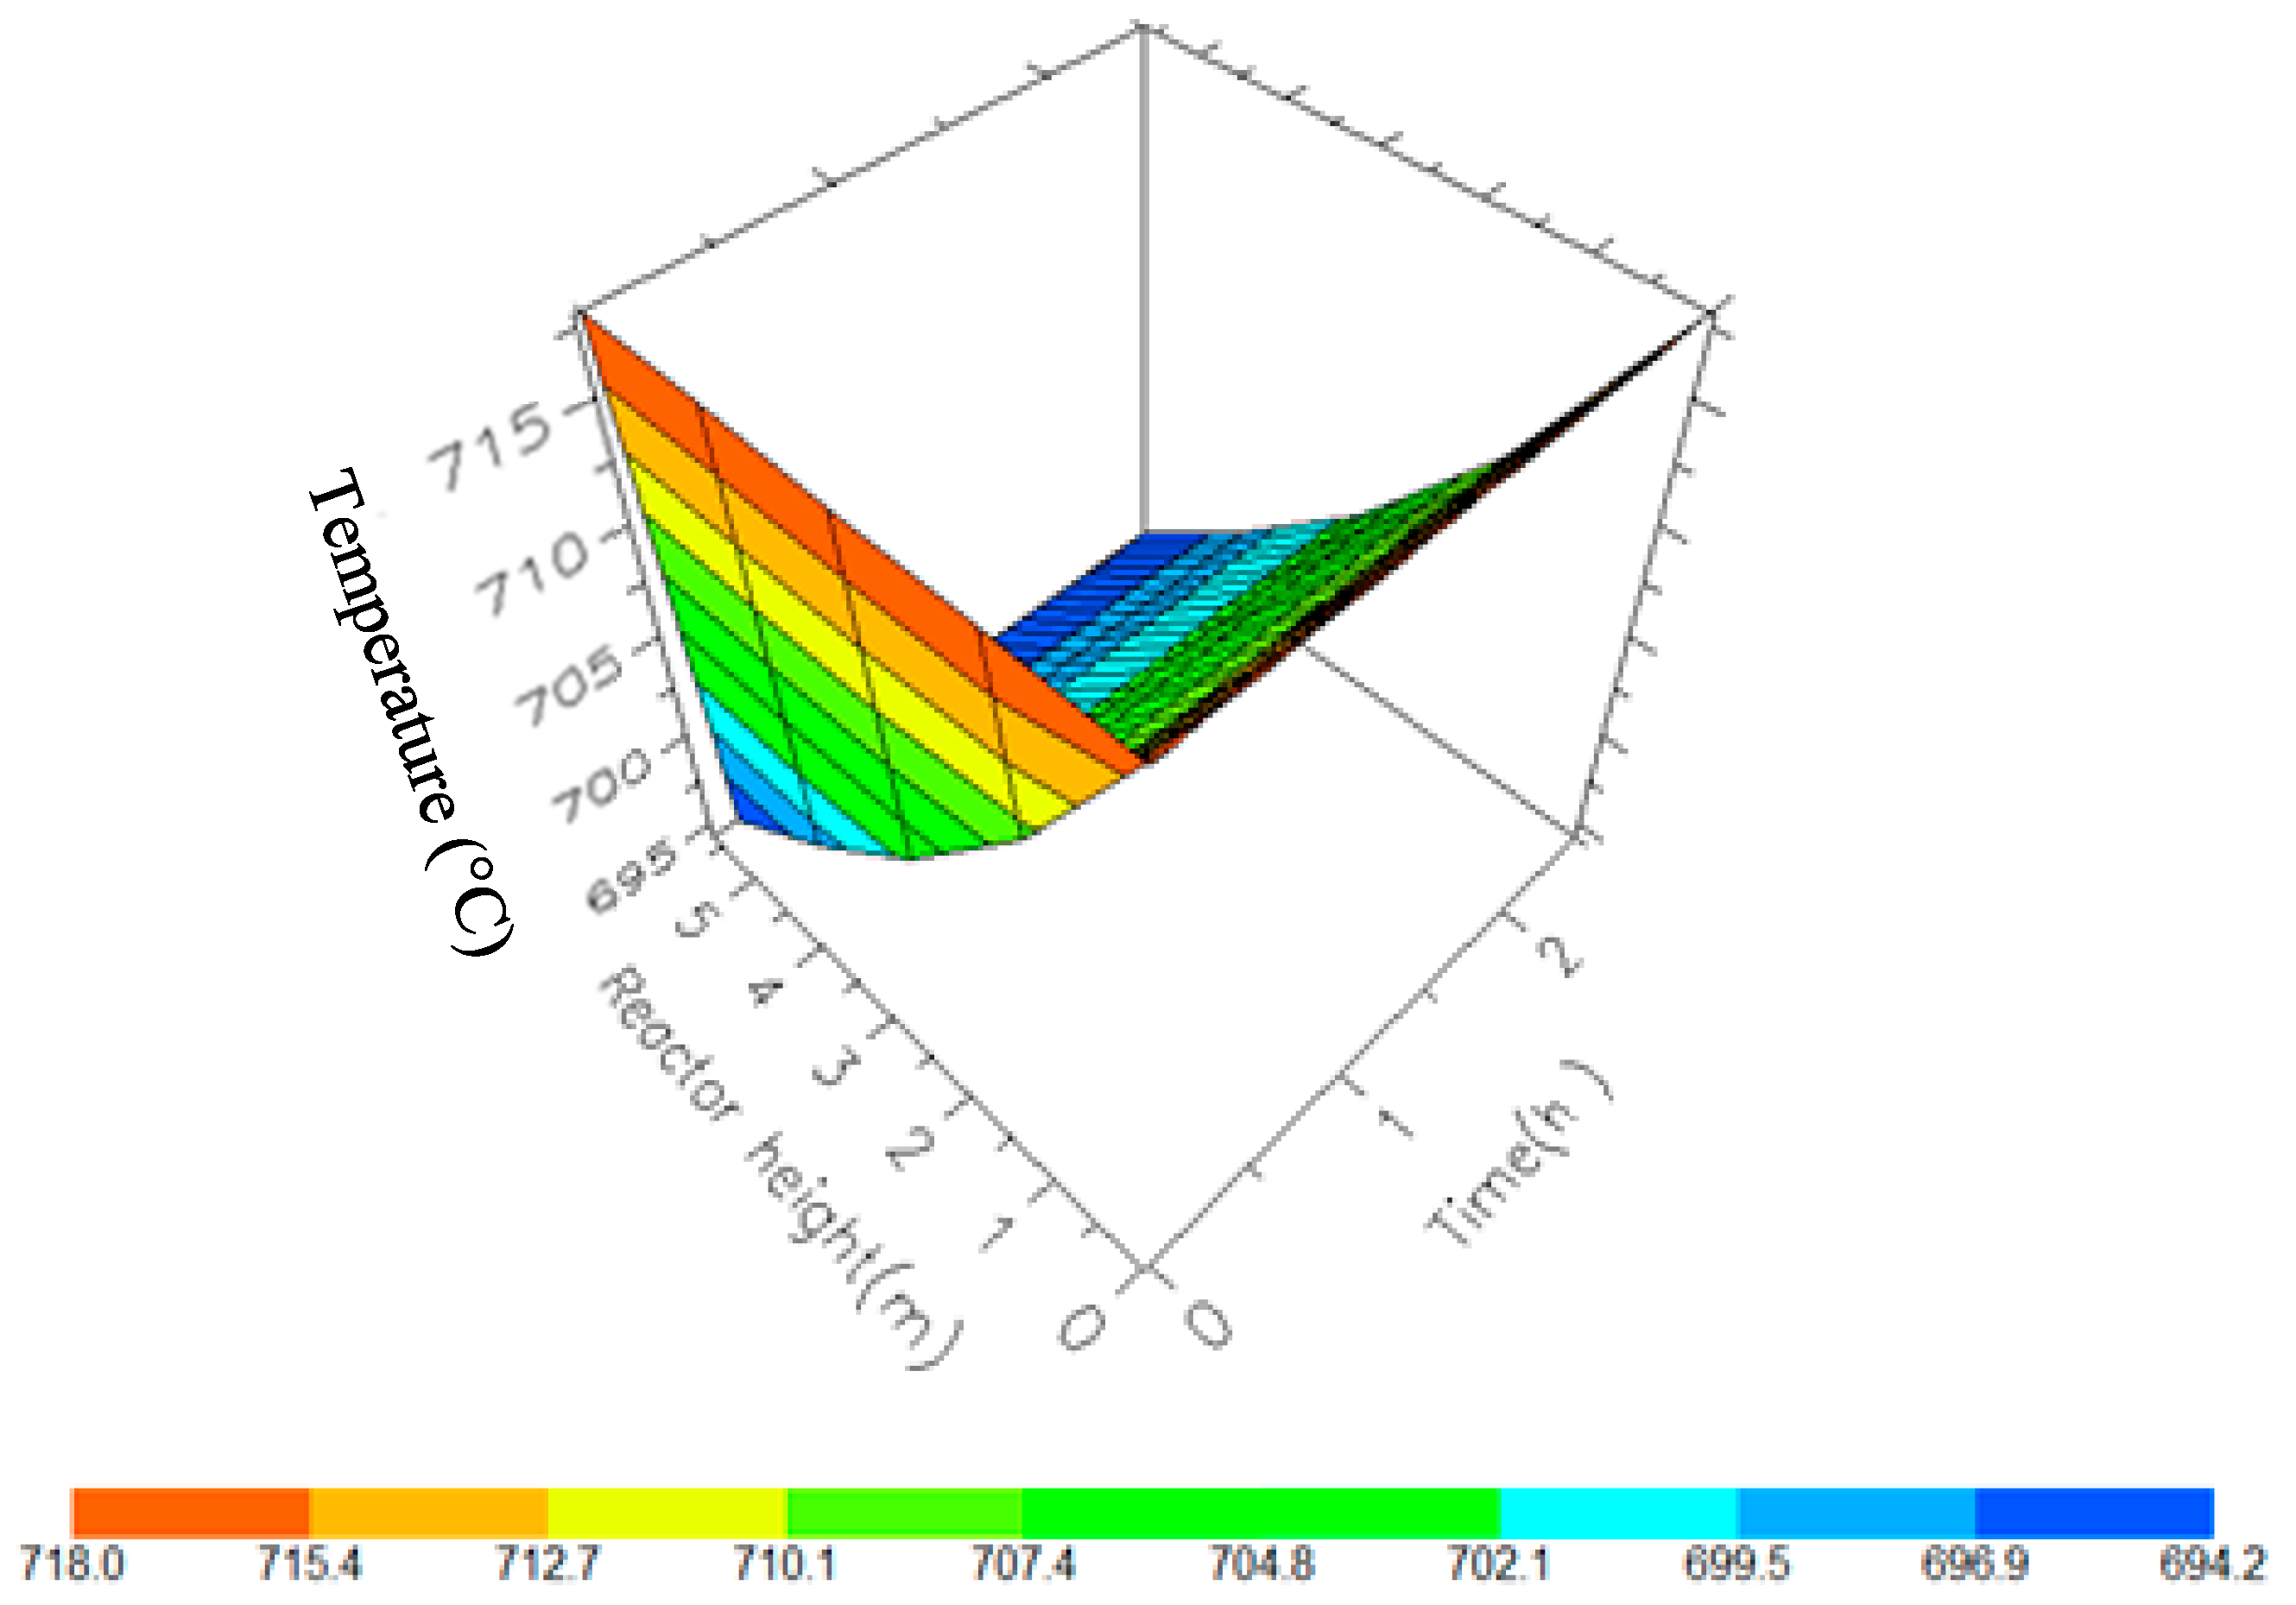
Figure 10.
A 3D representation of Reactor 1 Temperature variation with reactor height and time.

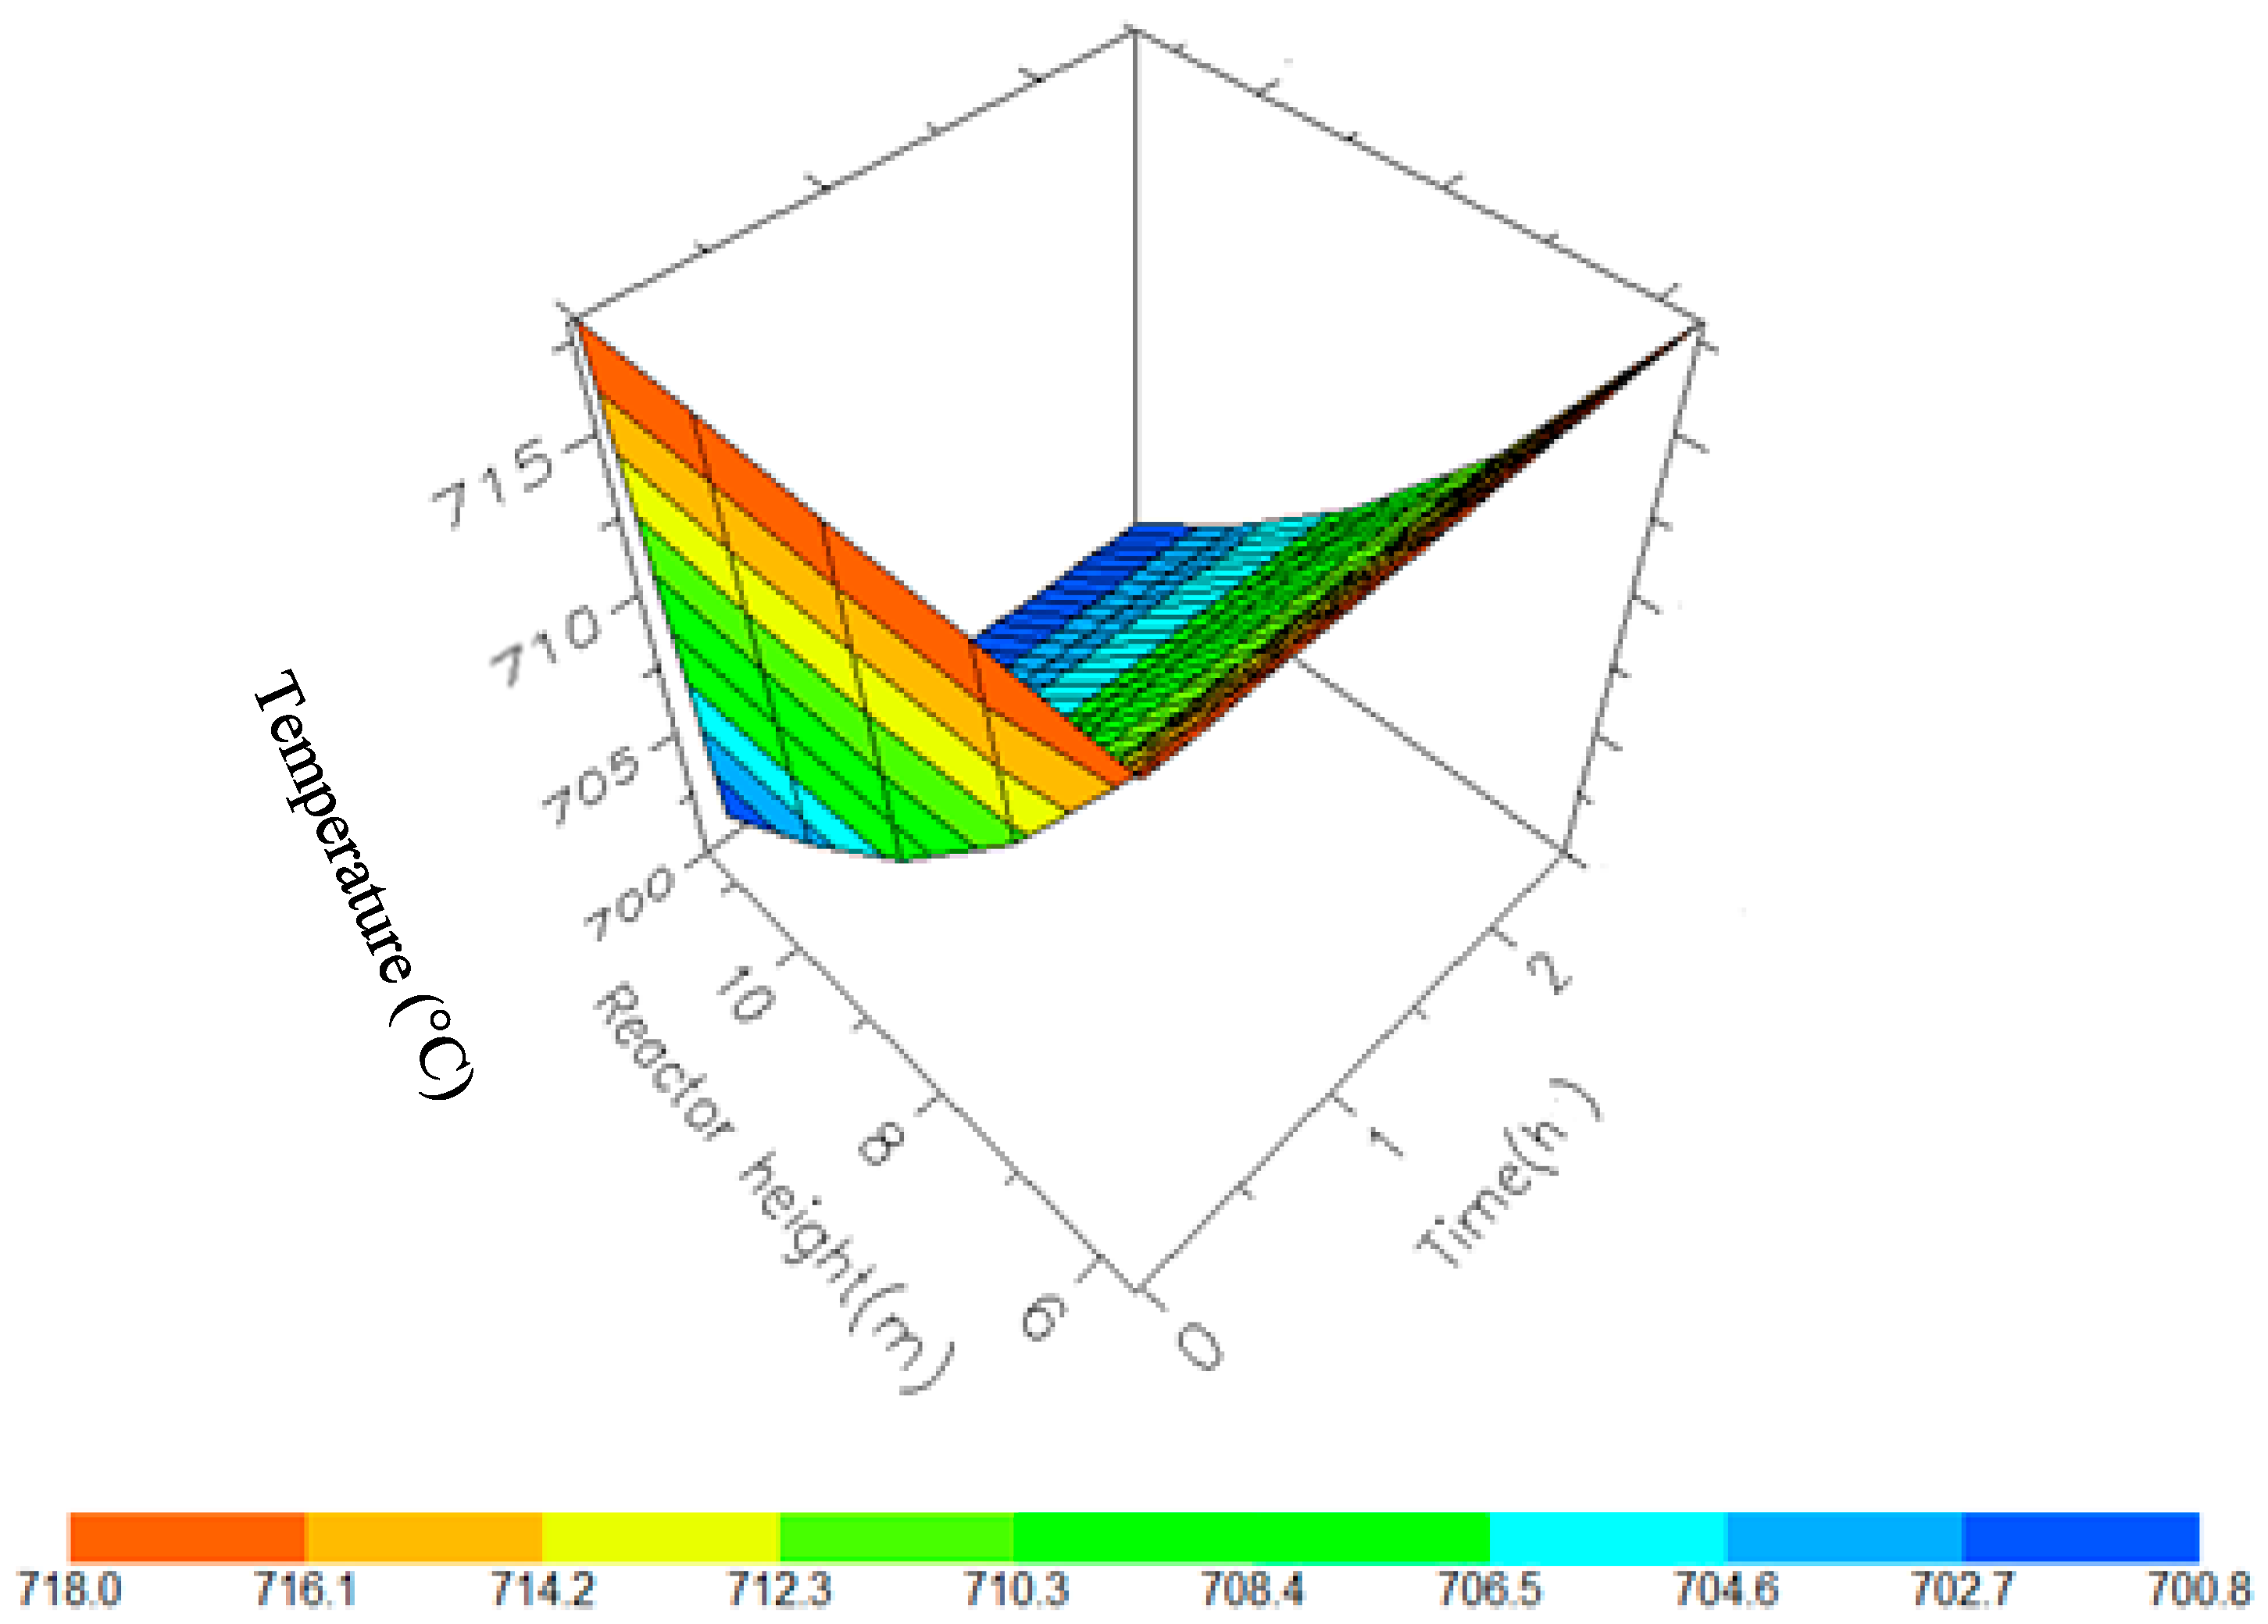
Figure 11.
A 3D representation of Reactor 2 Temperature variation with reactor height and time.

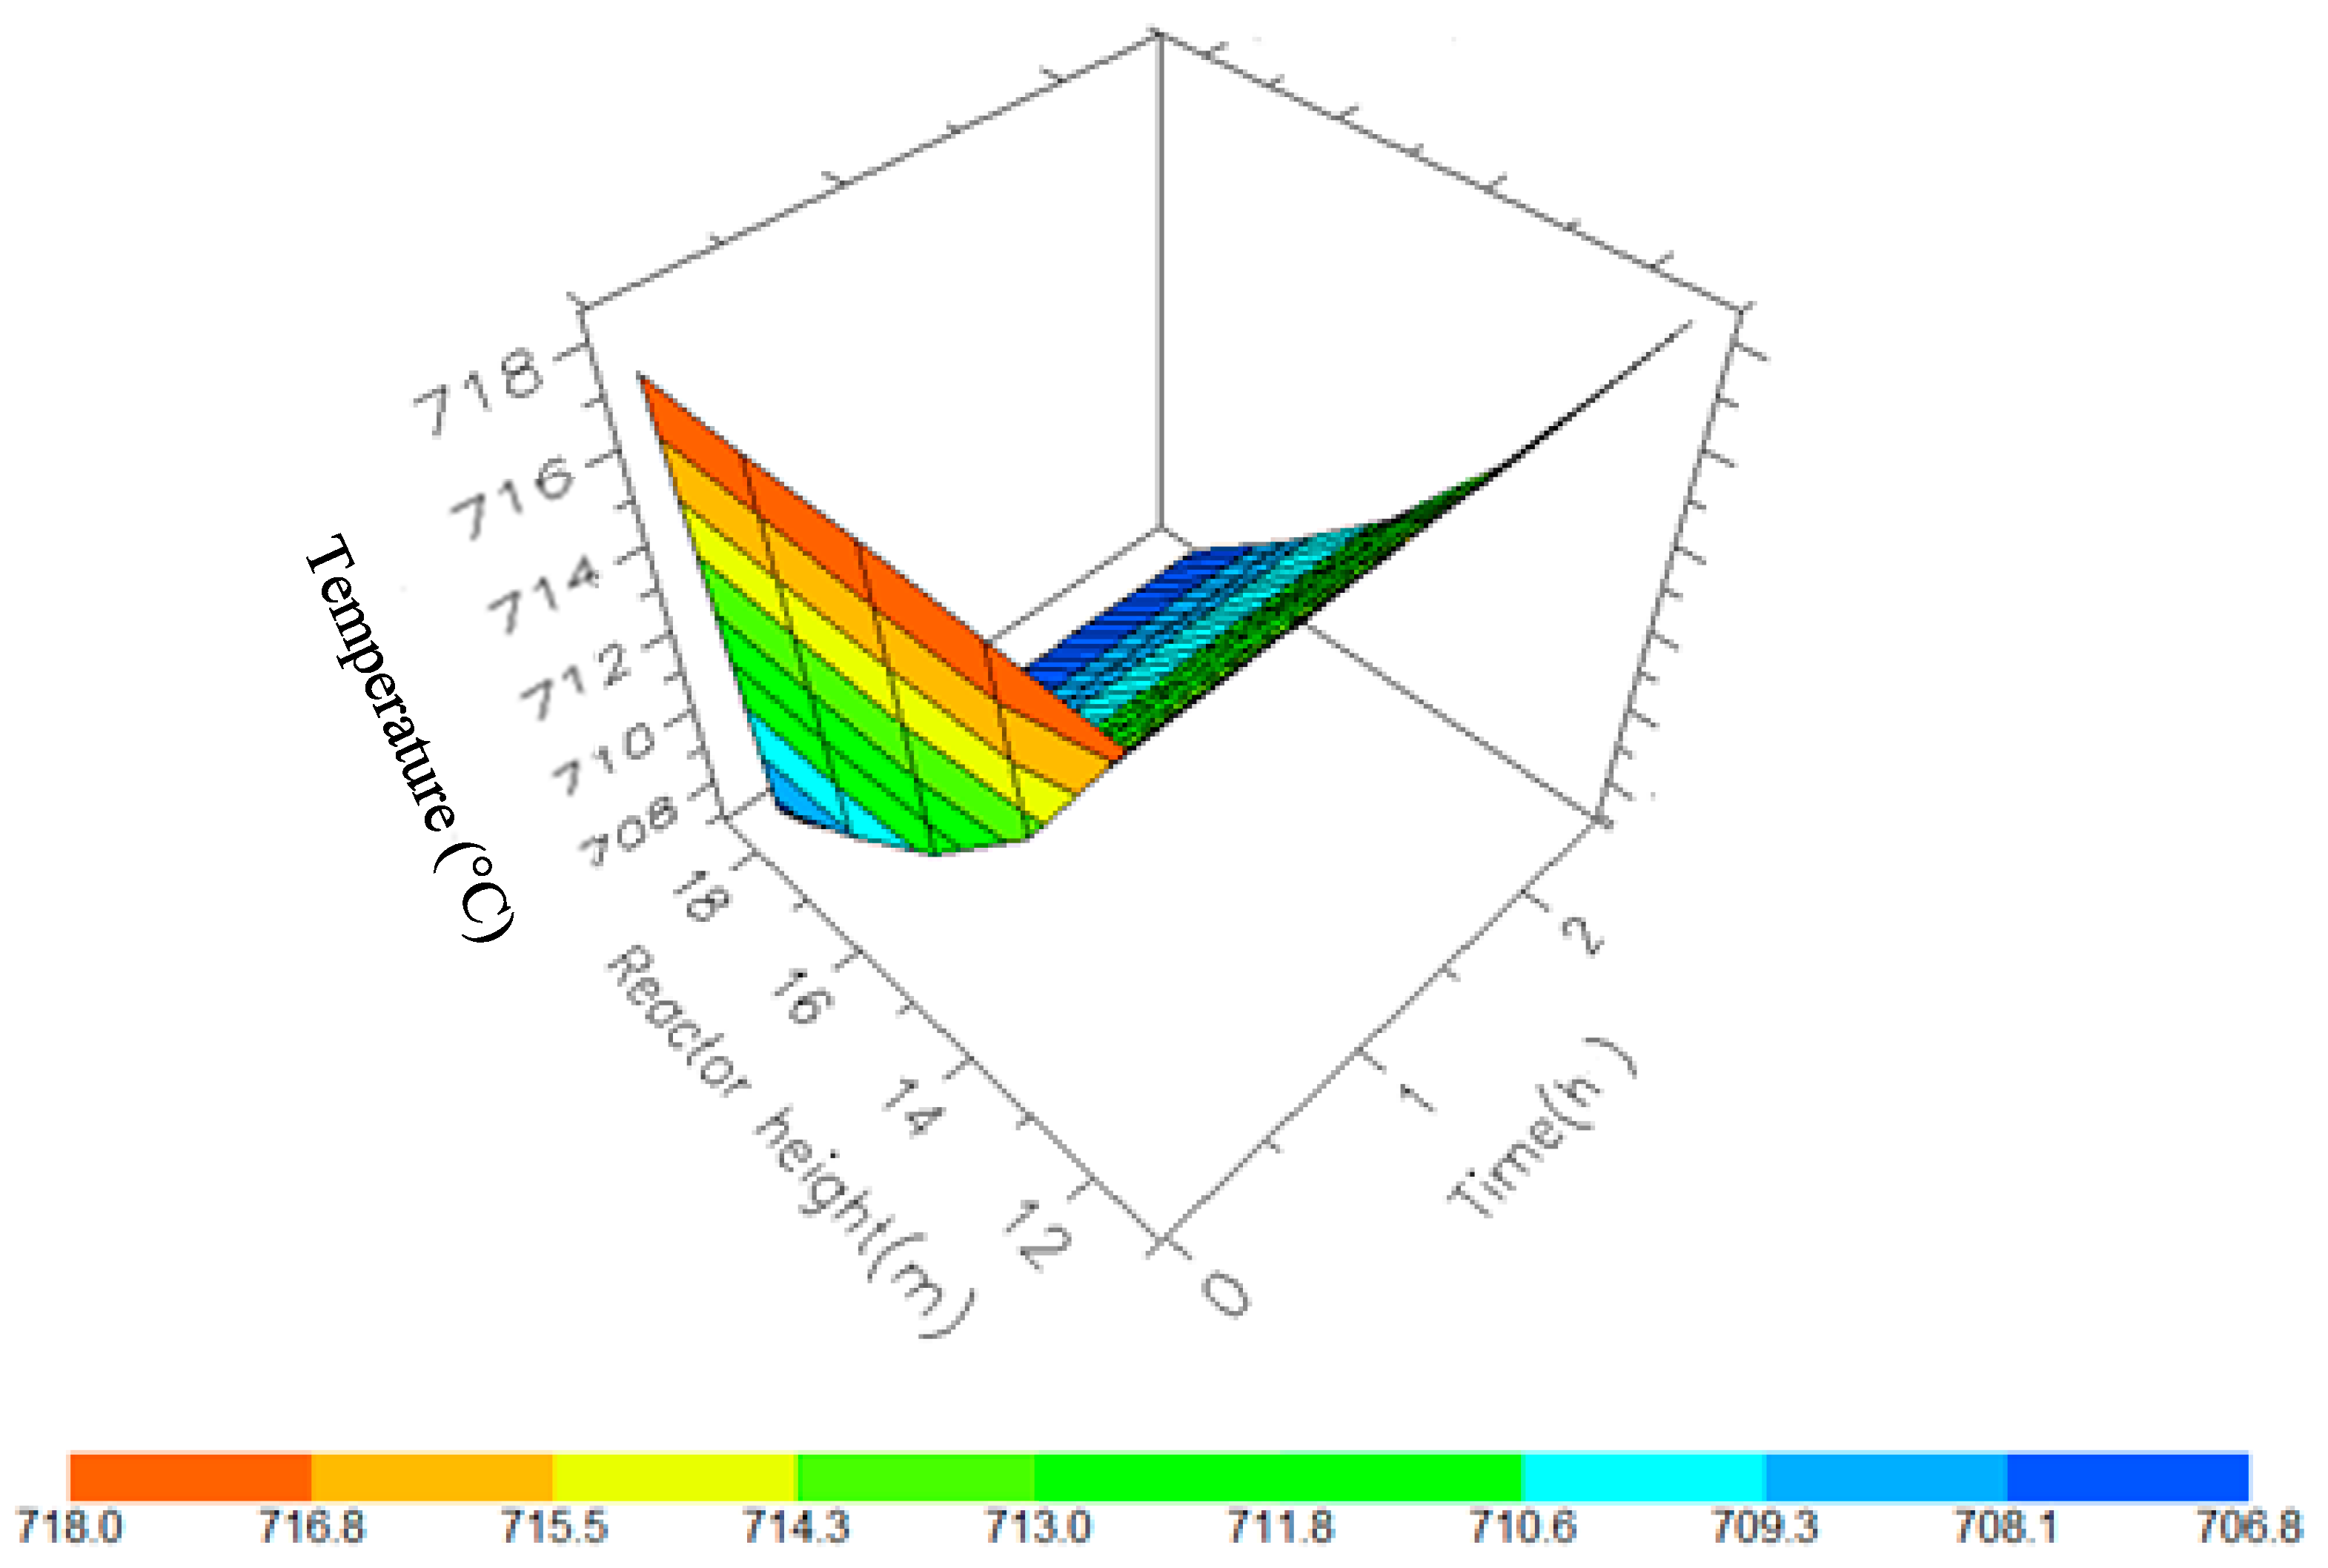
Figure 12.
A 3D representation of Reactor 3 Temperature variation with reactor height and time.

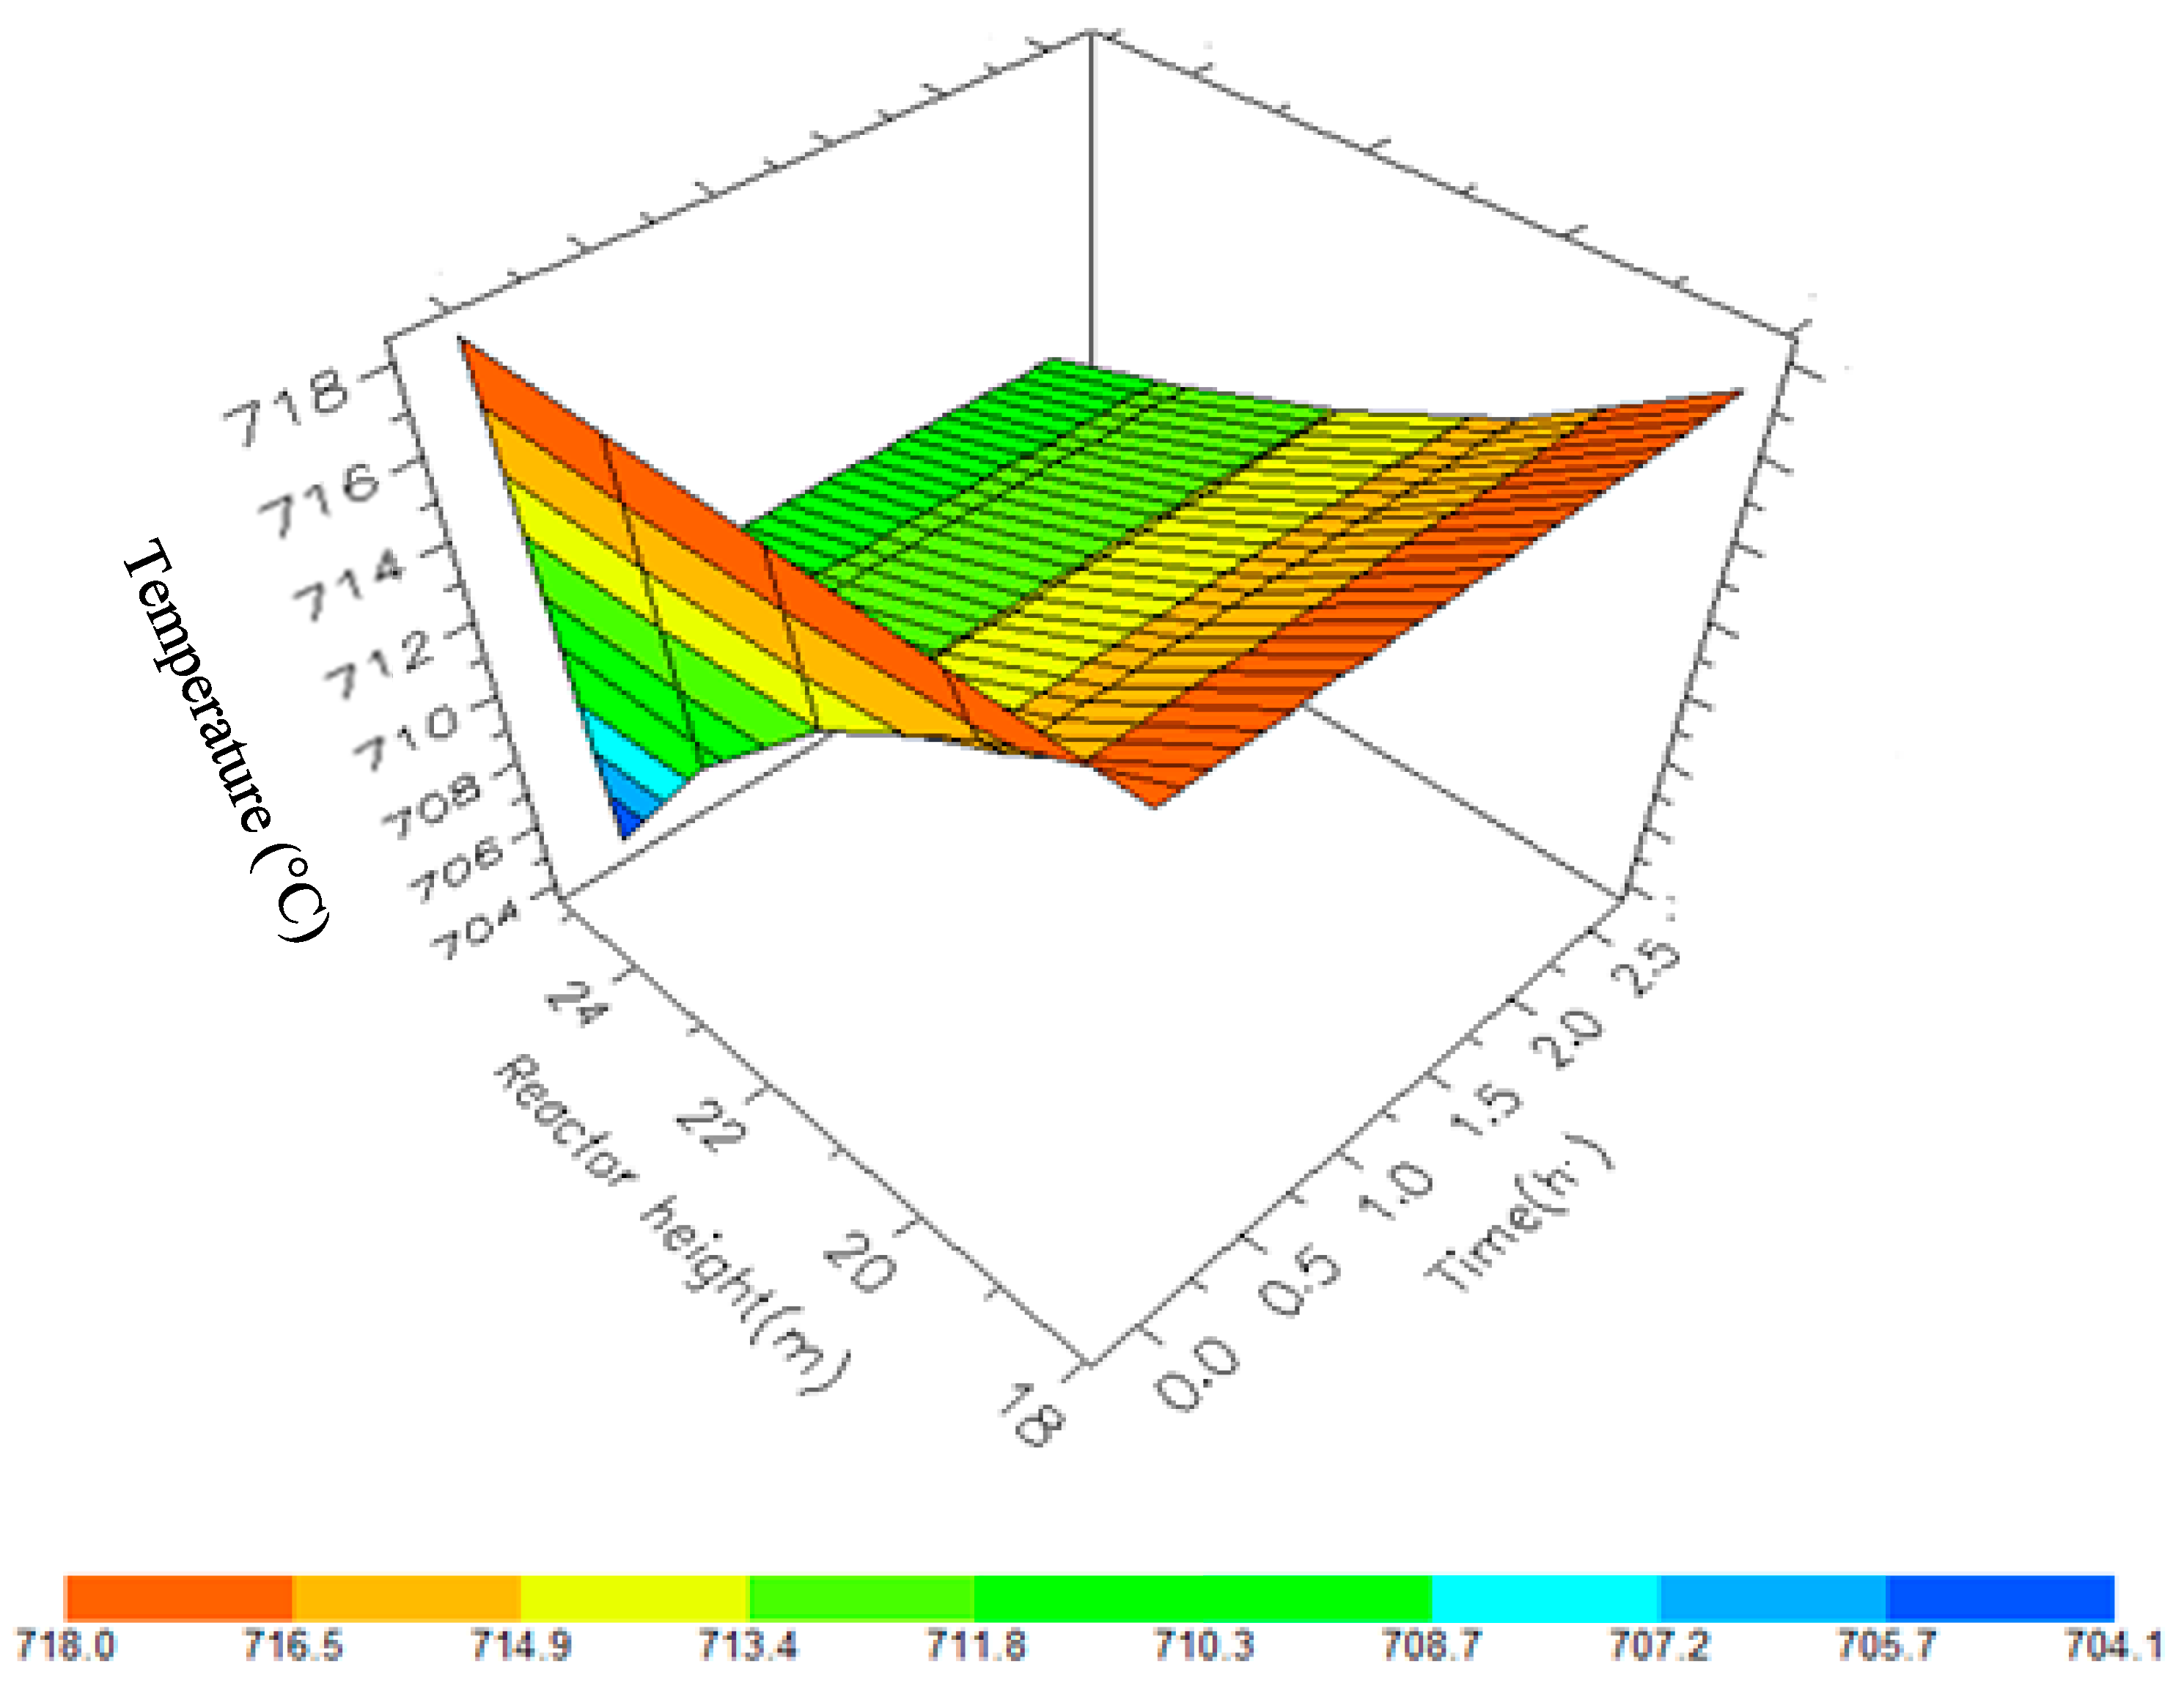
Figure 13.
A 3D representation of Reactor 4 Temperature variation with reactor height and time.
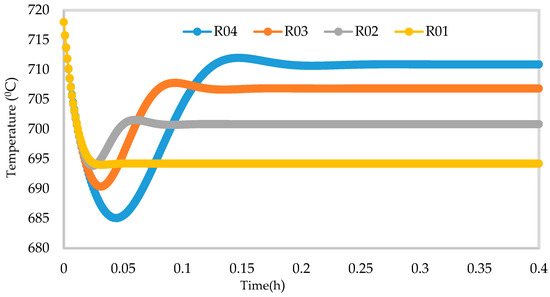
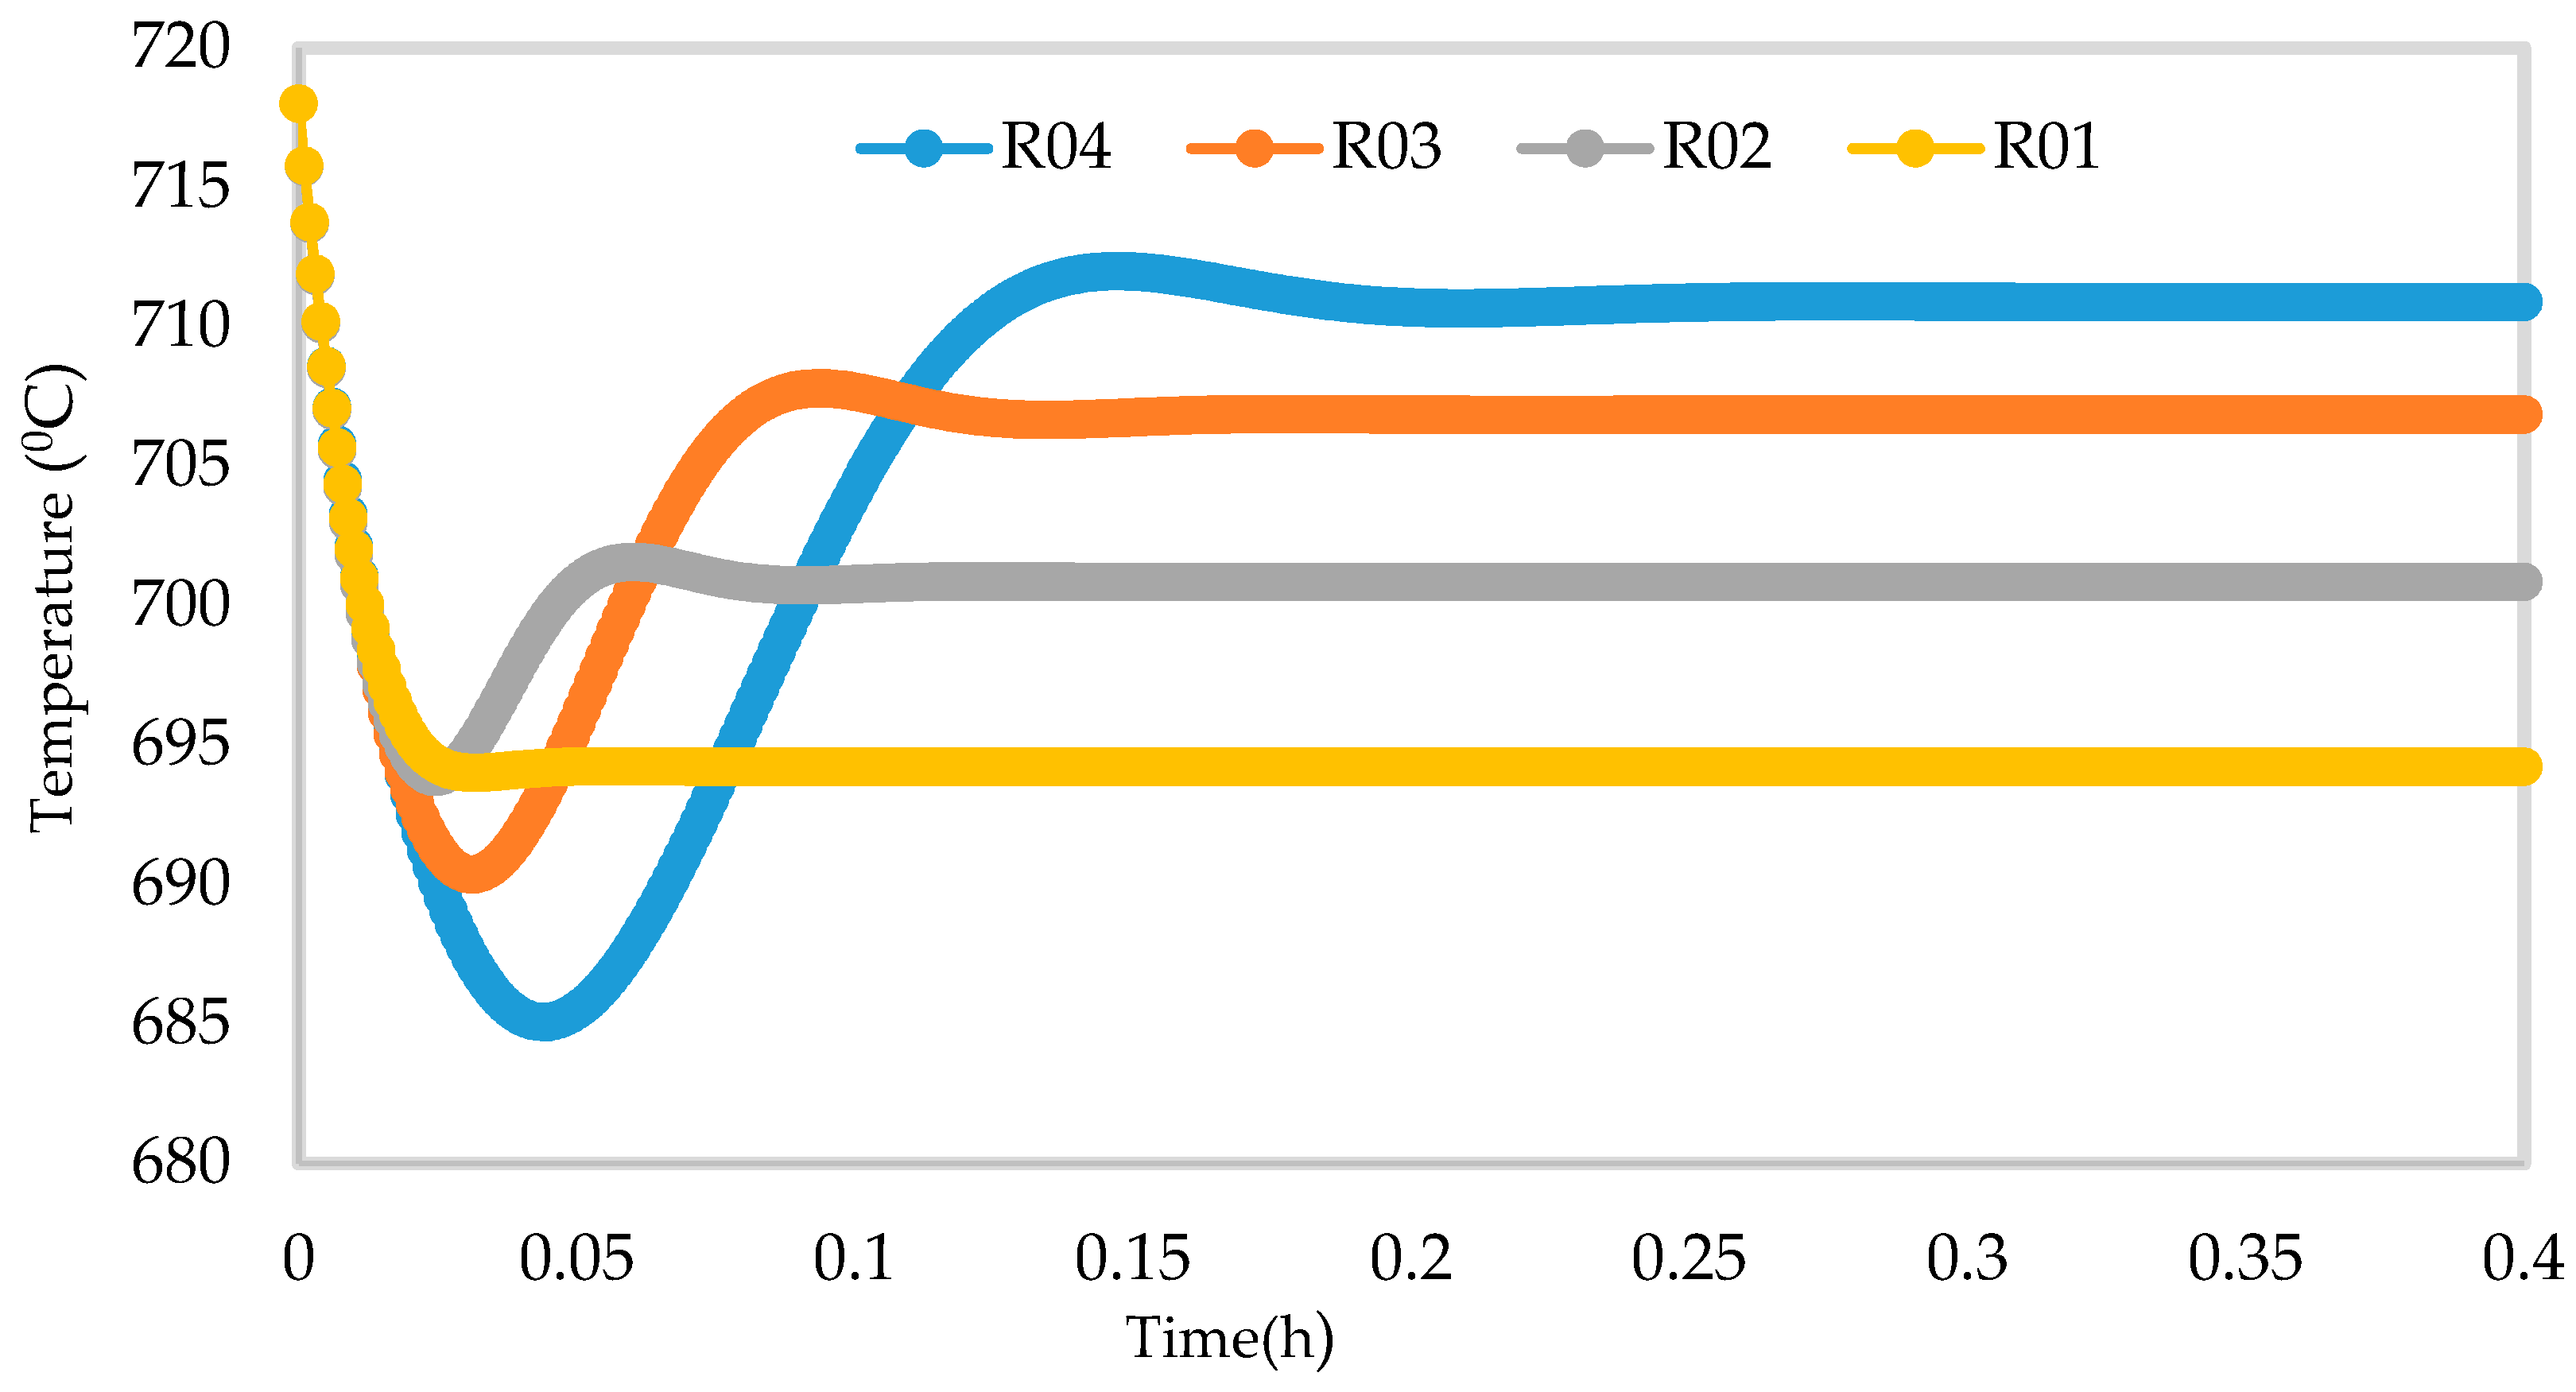
Figure 14.
Dynamic behaviour of Temperature in the four reactors.
Figure 4 shows the concentration profile of paraffins along the reactor height. P5, P6, P7, P8, P9, P10 are paraffins with hydrocarbon number 5, 6, 7, 8, 9, 10 respectively. Normal Paraffin components basically undergo three major reactions during naphtha reforming. They undergo hydrocracking to lighter paraffins that is, methane, ethane, propane and butane as in shown in reactions 8 to 33 in Table 2, isomerization to iso-paraffins which are not modelled in this work, it is a slow reaction with slow reaction rate, dehydrocyclization to naphthenes, a very slow reaction which leads to a decrease in the paraffins. These reactions are reactions 1–7 from Table 2. Dehydrocyclization reaction becomes easier as the molecular weight of the paraffins increases as in P8, P9 and P10 while P7 shows little increase. P5 and P6 increase due to hydrocracking. The main effects of hydrocracking are decrease of paraffins (C5+) in the reformate, decrease in hydrogen production, increase of LPG production and hydrogenolysis. The isomerization reactions are fast, slightly exothermic and do not affect the number of carbon atoms. The thermodynamic equilibrium of iso-paraffins to paraffins depends mainly on the temperature and pressure has no effect. The paraffins isomerization results in a slight increase of the octane number. These reactions are promoted by the acidic function of the catalyst support. The paraffin dehydrocyclization step becomes easier as the molecular weight of the paraffin increases, from Table 2 we can see that the rates increase from 0.0, 0.58, 1.33,1.81, 2.54 from P6 to P11 however the tendency of paraffins to hydrocrack increases concurrently. Kinetically, the rate of dehydrocyclization increases with low pressure and high temperature. To sum up, the dehydrocyclization of P6 paraffins to benzene is more difficult than that of C7 paraffin to toluene, which itself is more difficult than that of C8 paraffin to xylenes. Accordingly, the most suitable fraction to feed a reforming process is the C7–C10 fraction.
Figure 5 shows the behaviour of the naphthenes along the reactor height. N6, N7, N8, N9, N10 are naphthenes with hydrocarbon number 6, 7, 8, 9, 10 respectively. The fastest reaction is aromatization that is, dehydrogenation of naphthenes, resulting in the large temperature drop due to its highly endothermic nature. The drastic reduction is due to the aromatization to aromatics. Thermodynamically the reaction is highly endothermic and is favoured by high temperature and low pressure. In addition, the higher the number of carbon atoms the higher the aromatics production at equilibrium from N8, N9, N10. This can be seen from Table 2 in equations (34)–(39) where the reaction rates increase from 4.02, 9.03, 21.5, 24.5 and 24.5 respectively for N6, N7, N8, N9 and N10. From a kinetic point of view, the rate of reaction increases with temperature. The naphthenes also undergo hydrocracking to lighter hydrocarbons leading to their decrease as shown in reactions 49–57 in Table 2.
Figure 6 shows the behaviour of aromatics along the reactor height. A6, A7, A8, A9, A10 are aromatics with hydrocarbon number 5, 6, 7, 8, 9, 10 respectively. The dehydrogenation of naphthenes as seen from Figure 5 increases the aromatics shown in Figure 6. The sharp increase is as a result of drastic aromatization of the naphthenes favoured by the metallic sites of the catalyst. The rate of benzene formation is lower due to lower carbon number of N6 while A7, A8, A9 increase rapidly due to higher carbon number of N7, N8 and N9. This can be seen from reactions 58–71 in Table 2.
Figure 7 shows the temperature profile of the reactions along the reactor height. The sharp drop in first and second reactor is due to the more endothermic dehydrogenation reaction of naphthenes to aromatics. Typically, dehydrogenation and isomerization reactions take place in the first reactor, dehydrogenation, isomerization, dehydrogenation and cracking in the second followed by dehydrogenation and cracking in the third and fourth reactors.
Figure 8 shows the increase in hydrogen yield along the height of the reactor. Figure 9 shows the increase in RON along the reactor height. This is due to the increase in the aromatics along the reactor height. The RON increases from reactor one to four due to increase in aromatization reaction which gives a higher research octane number, a parameter for antiknock in the gasoline engine. Straight run naphtha has a low RON and cannot be used as gasoline and hence the reforming reaction of the components to give a gasoline with higher research octane number.
7.2. Dynamic Simulation of the Four Reactors
The modelling results from the model Equations of (27)–(32) gives the concentration and temperature distributions only across the reactor height and the time simultaneously where their behaviours are predicted with changing both time height. In this work, four reactors are simulated with the reactor configurations given in Table 5.
Figure 10, Figure 11, Figure 12 and Figure 13 shows the 3D profiles of the dynamics of the temperatures in the four reactors respectively. It is a combination of the change along both the reactor height and time. For the variation with time, the interesting aspect could be seeing clearly in Figure 14 that the exit temperatures falls and rise with time before reaching a final temperature value unlike the steady state where it shows only a drop in temperature without seeing such interesting aspect as in Figure 7. From Figure 14, temperature decreases along the height simultaneously with time. The dynamic simulation was performed over 10 h but the time to reach steady state was 0.25 h maximum, hence the representation in Figure 14 stops at 0.4 h for clarity purpose. The drop in temperature in first reactor is mainly due to the high endothermic reaction of naphthenes conversion to aromatics. Dehydrogenation is the main reaction in this reactor, the fastest reaction among all the reactions and reaches a steady state at about 0.05 h. This can also be attributed to the lowest residence time of 0.179 h for the reactions in the first reactor. There are also some endothermic reactions in the second reactor where dehydrogenation and isomerization reactions continue, thereby increasing slightly the temperature with time. The temperature here reaches steady state at 0.12 h which is longer than the first value. In reactor three there is lesser temperature drop due to exothermic reactions of isomerization and hydrocracking, reaching a steady state at 0.20 h. Reactor four has the highest exothermic reactions and one can see a sharp rise in temperature. It reaches a steady state at 0.25 h.
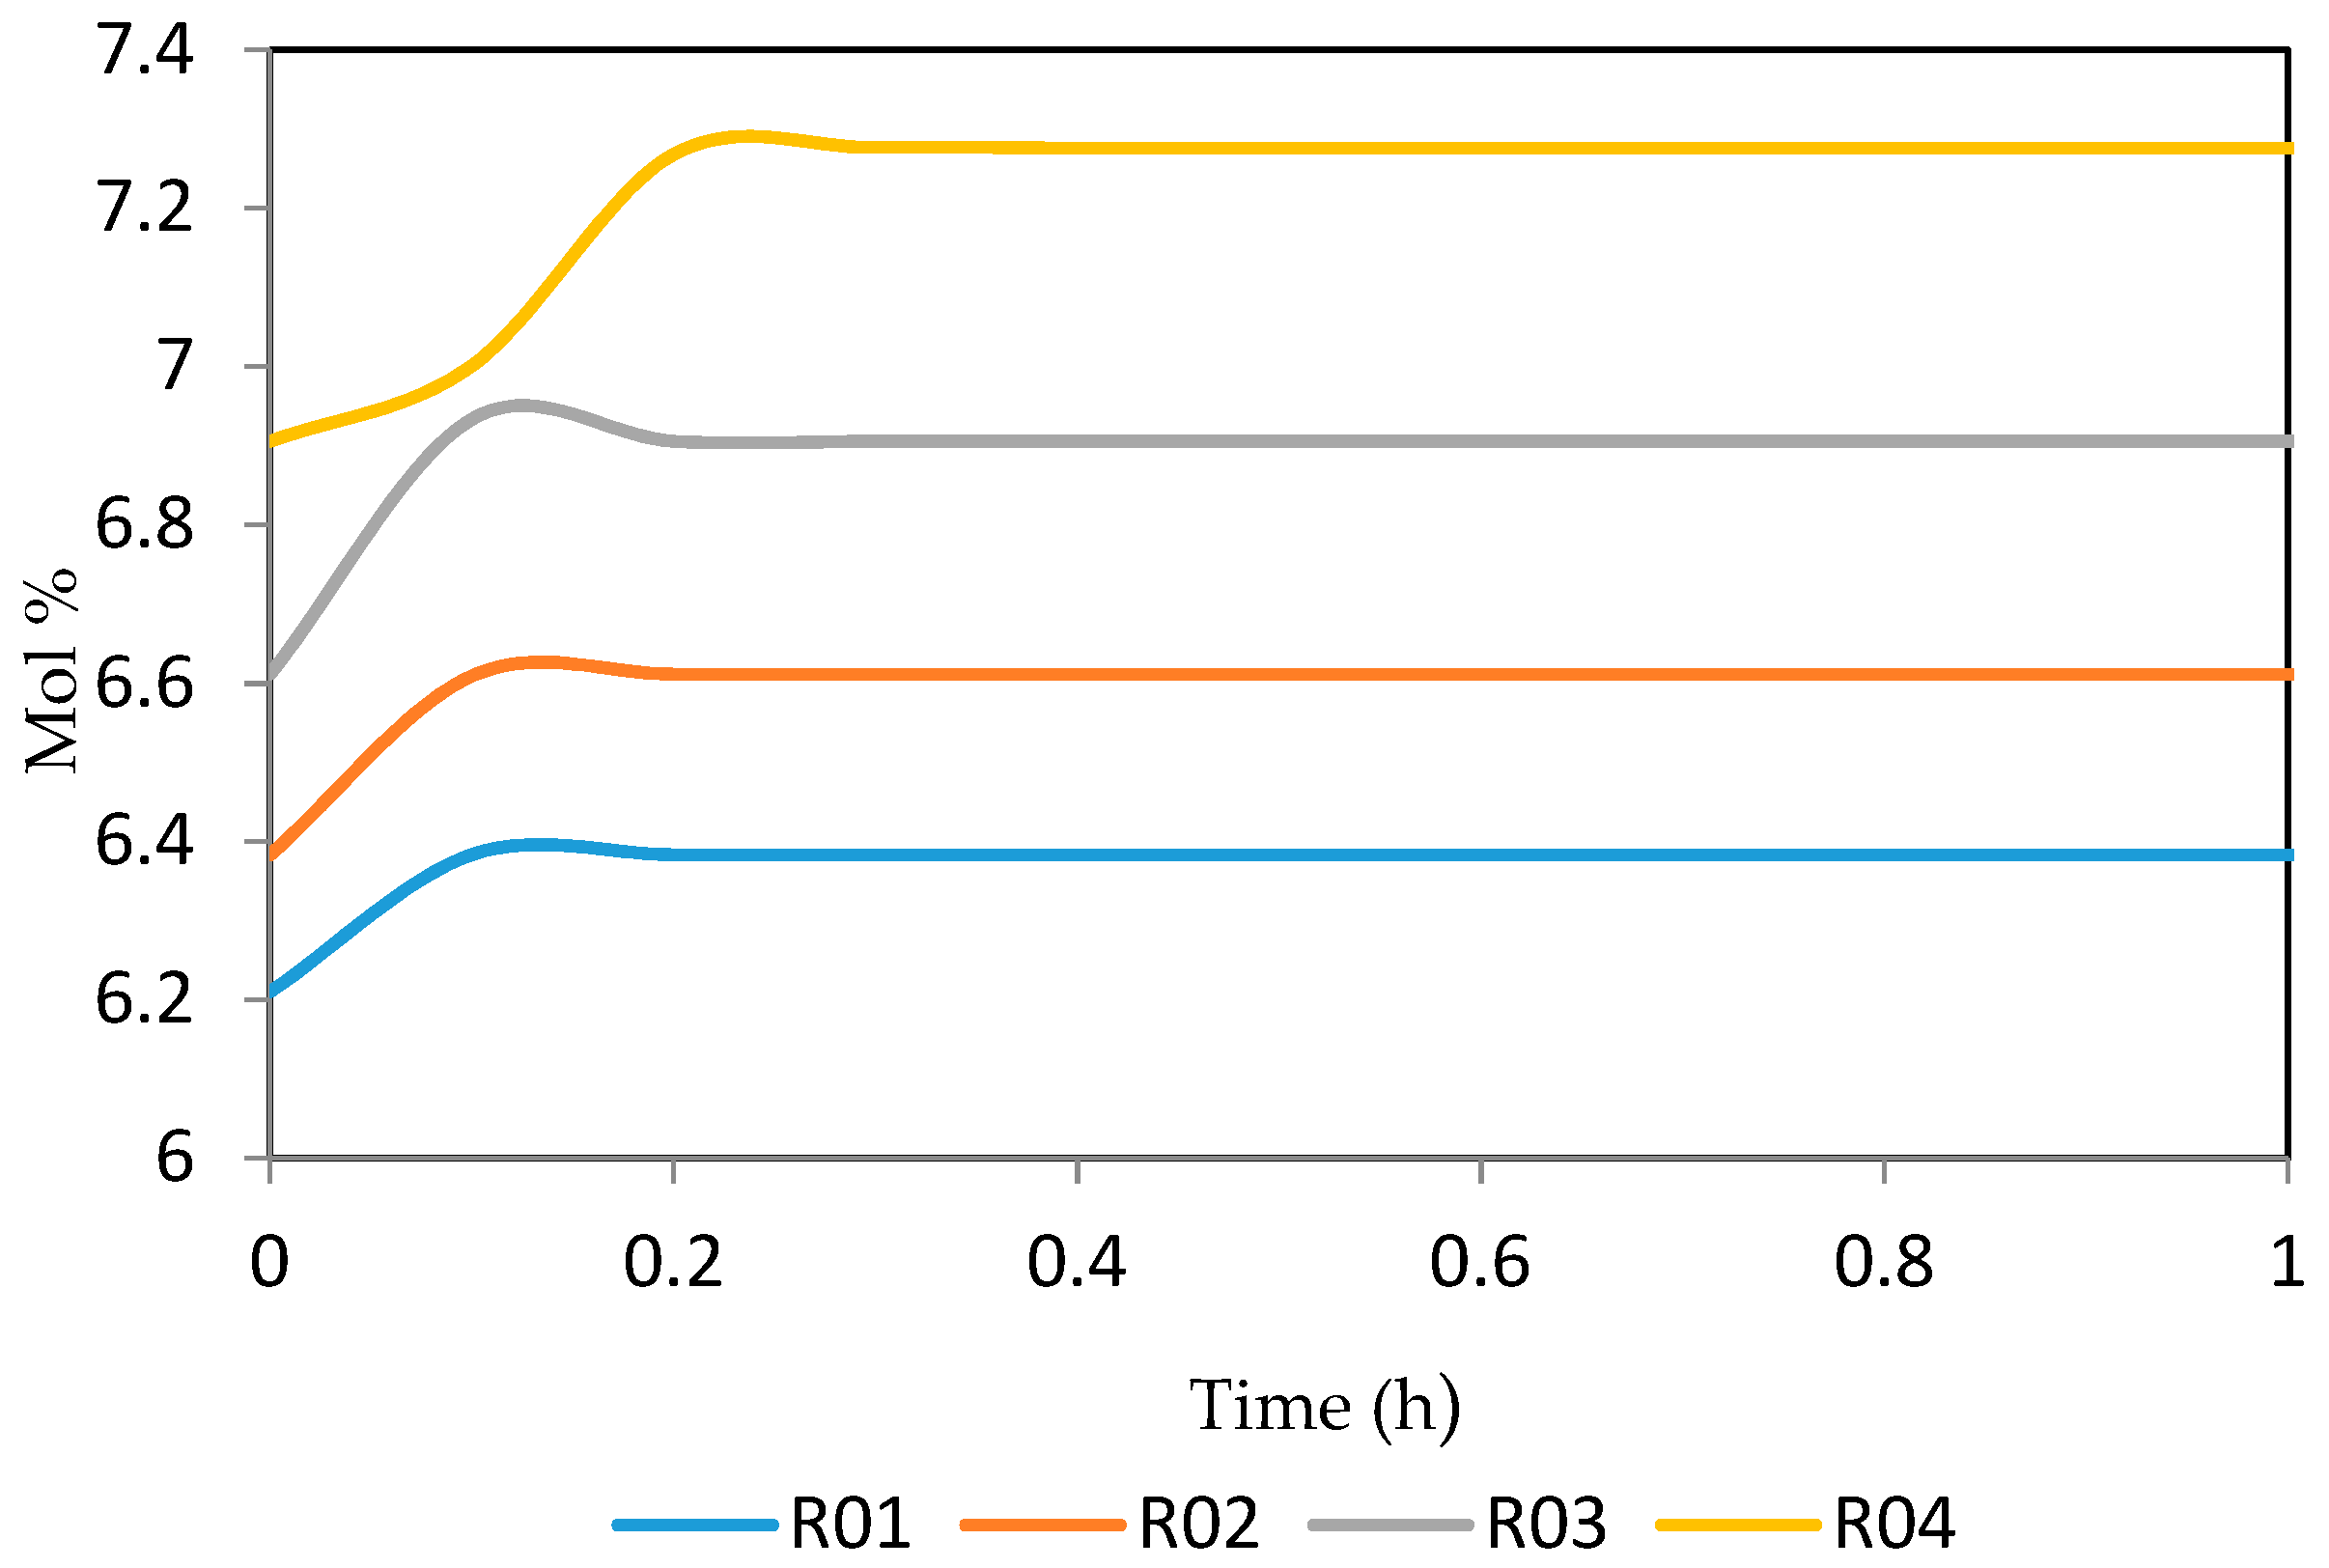
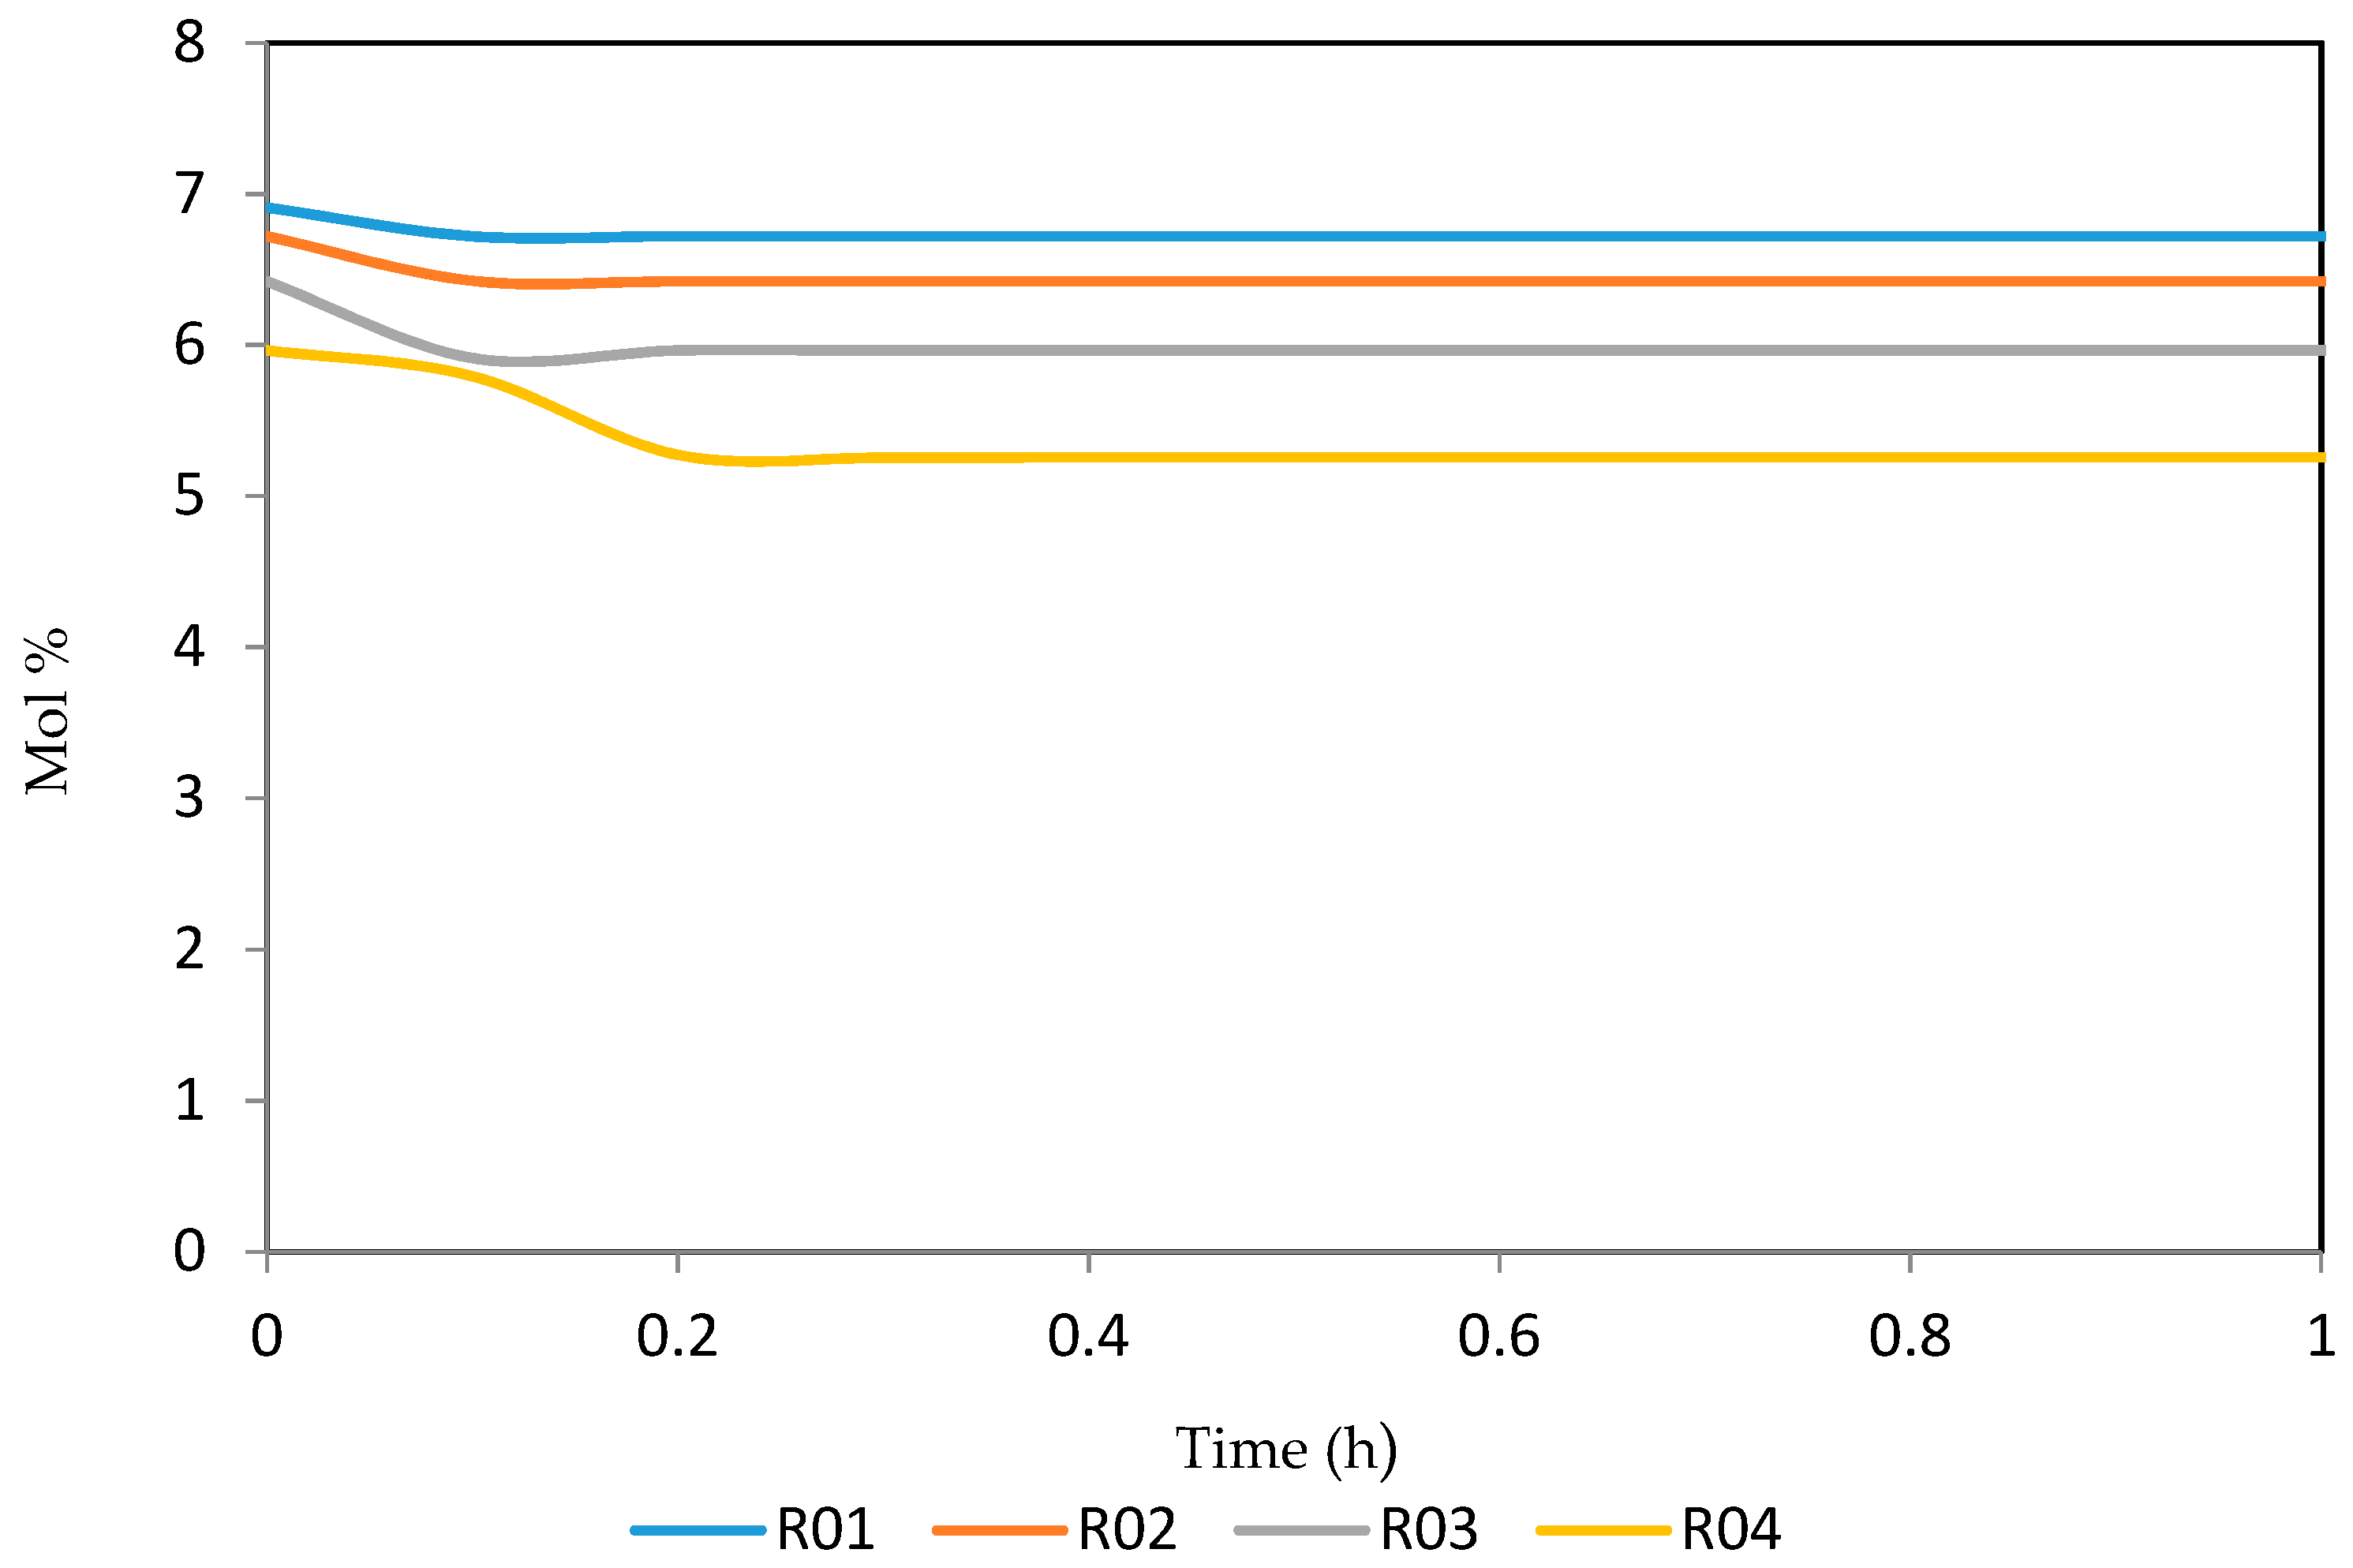
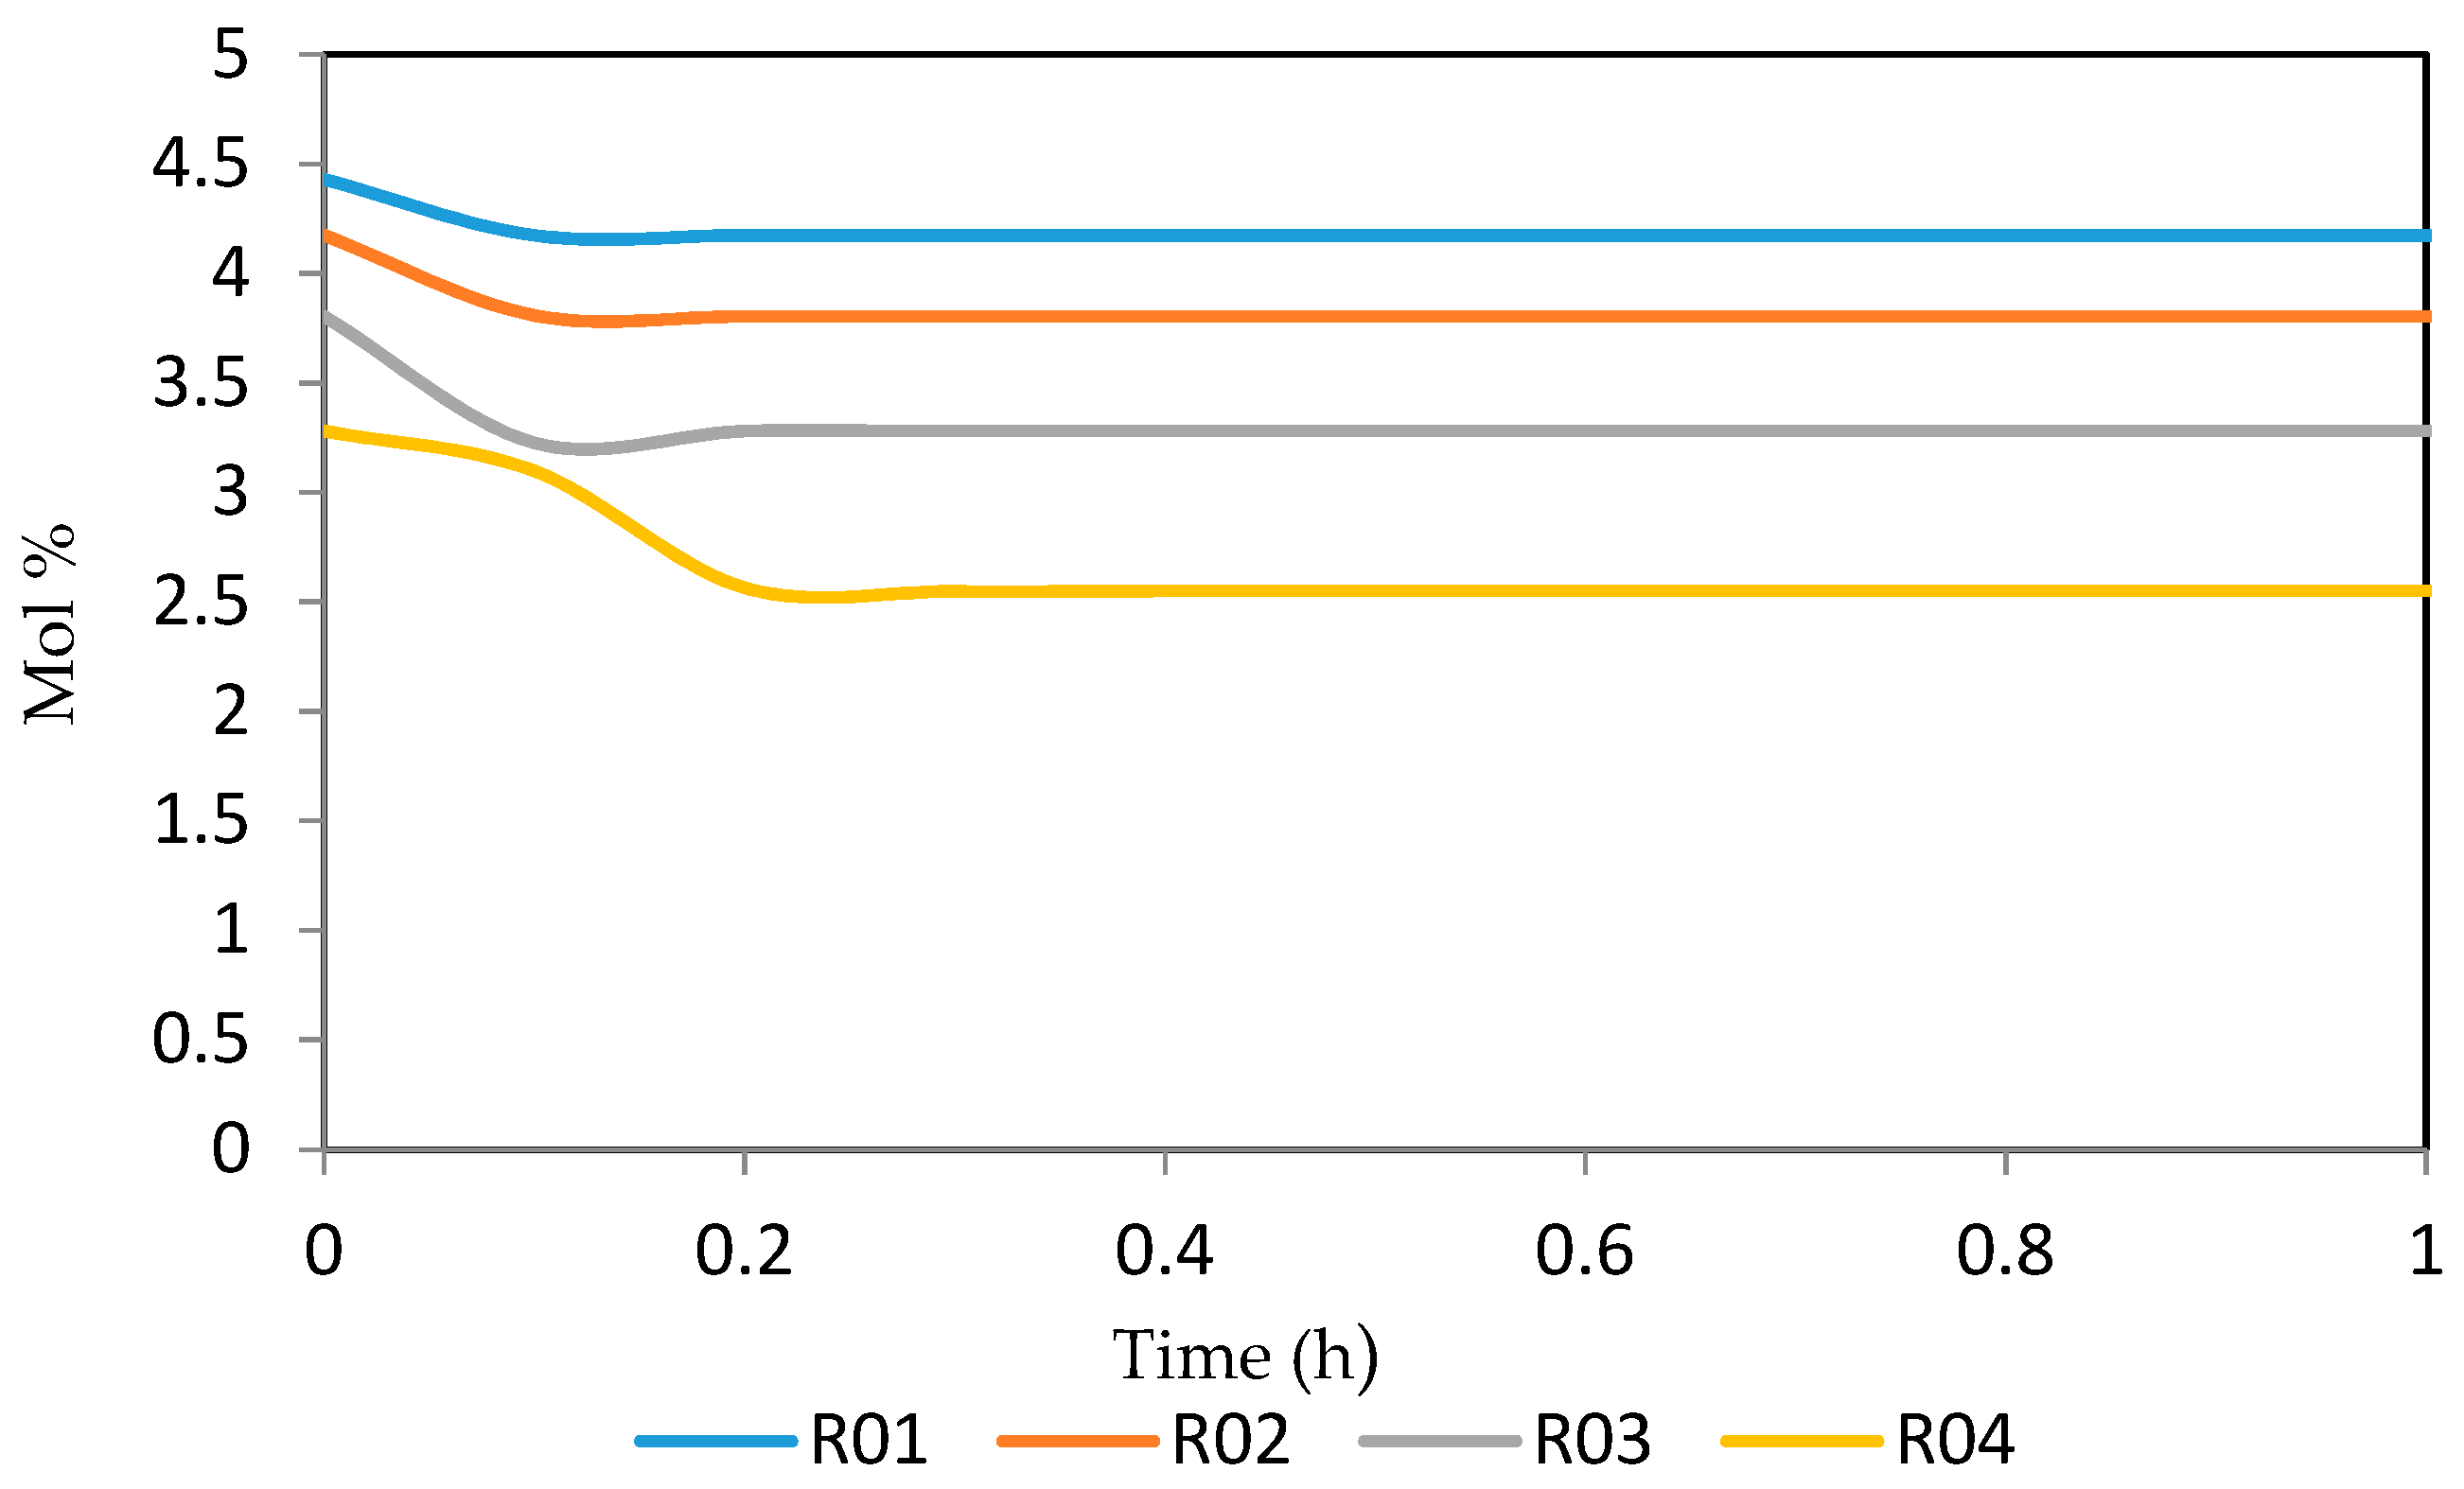
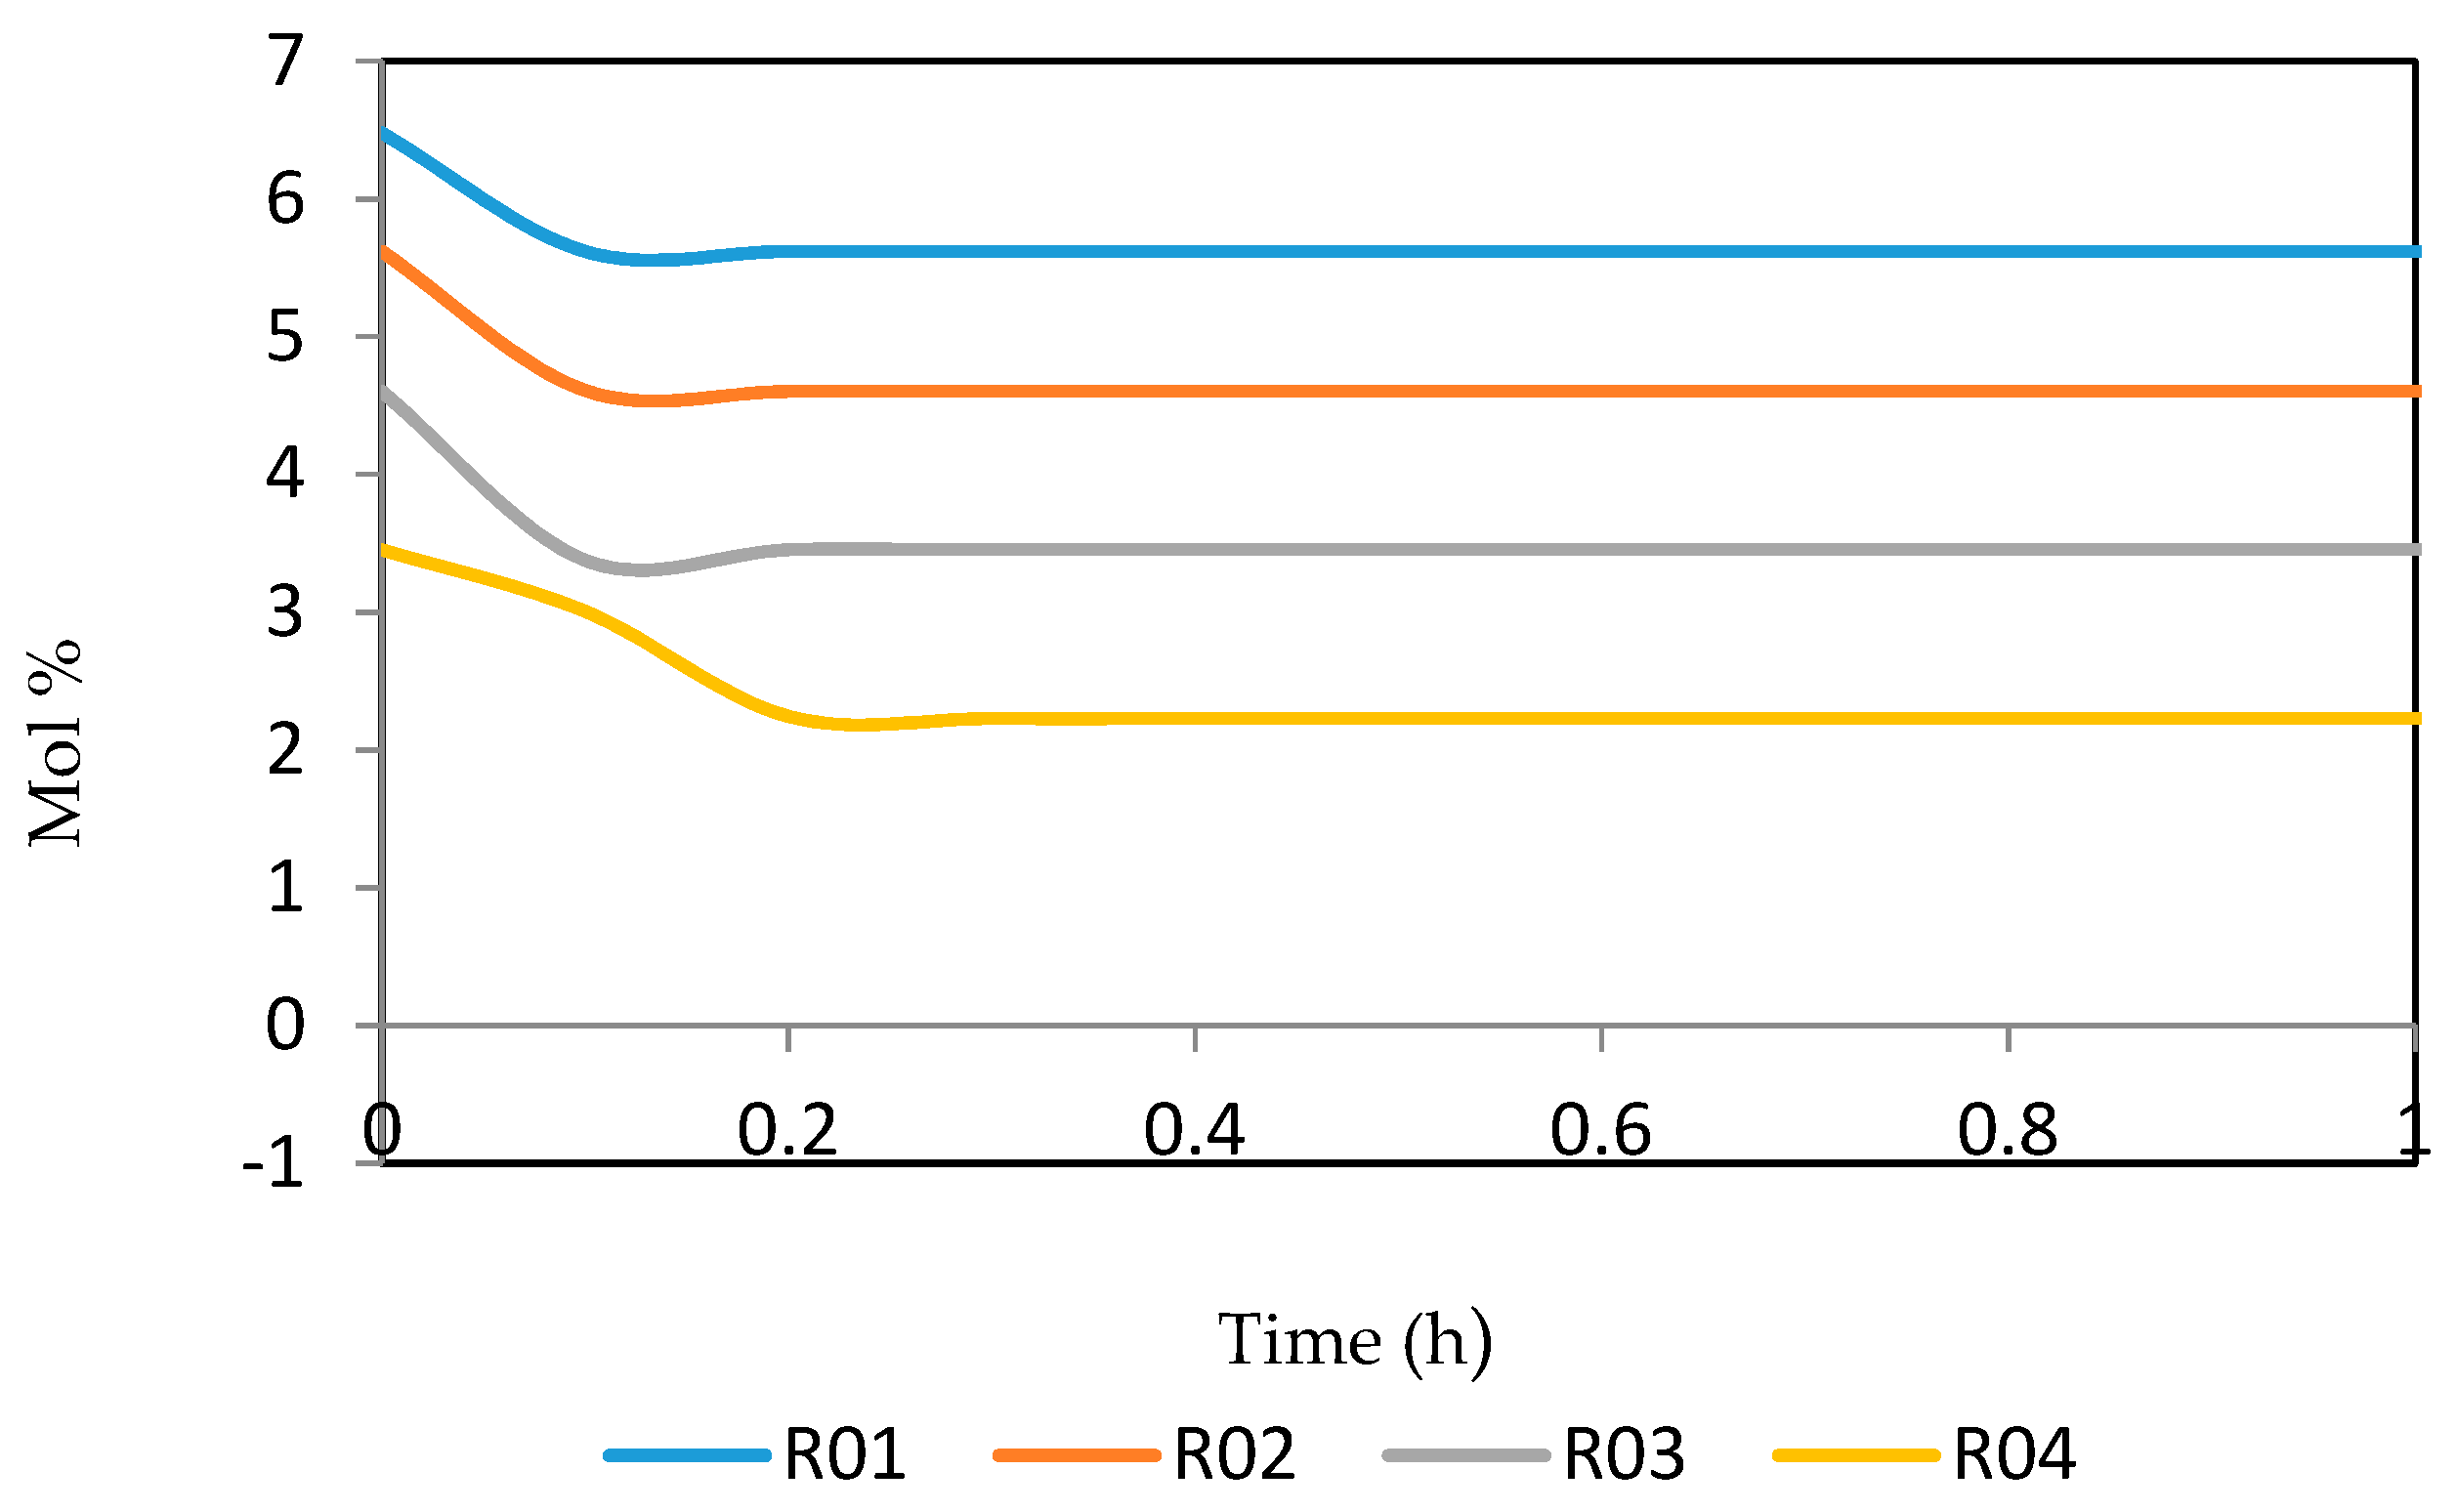
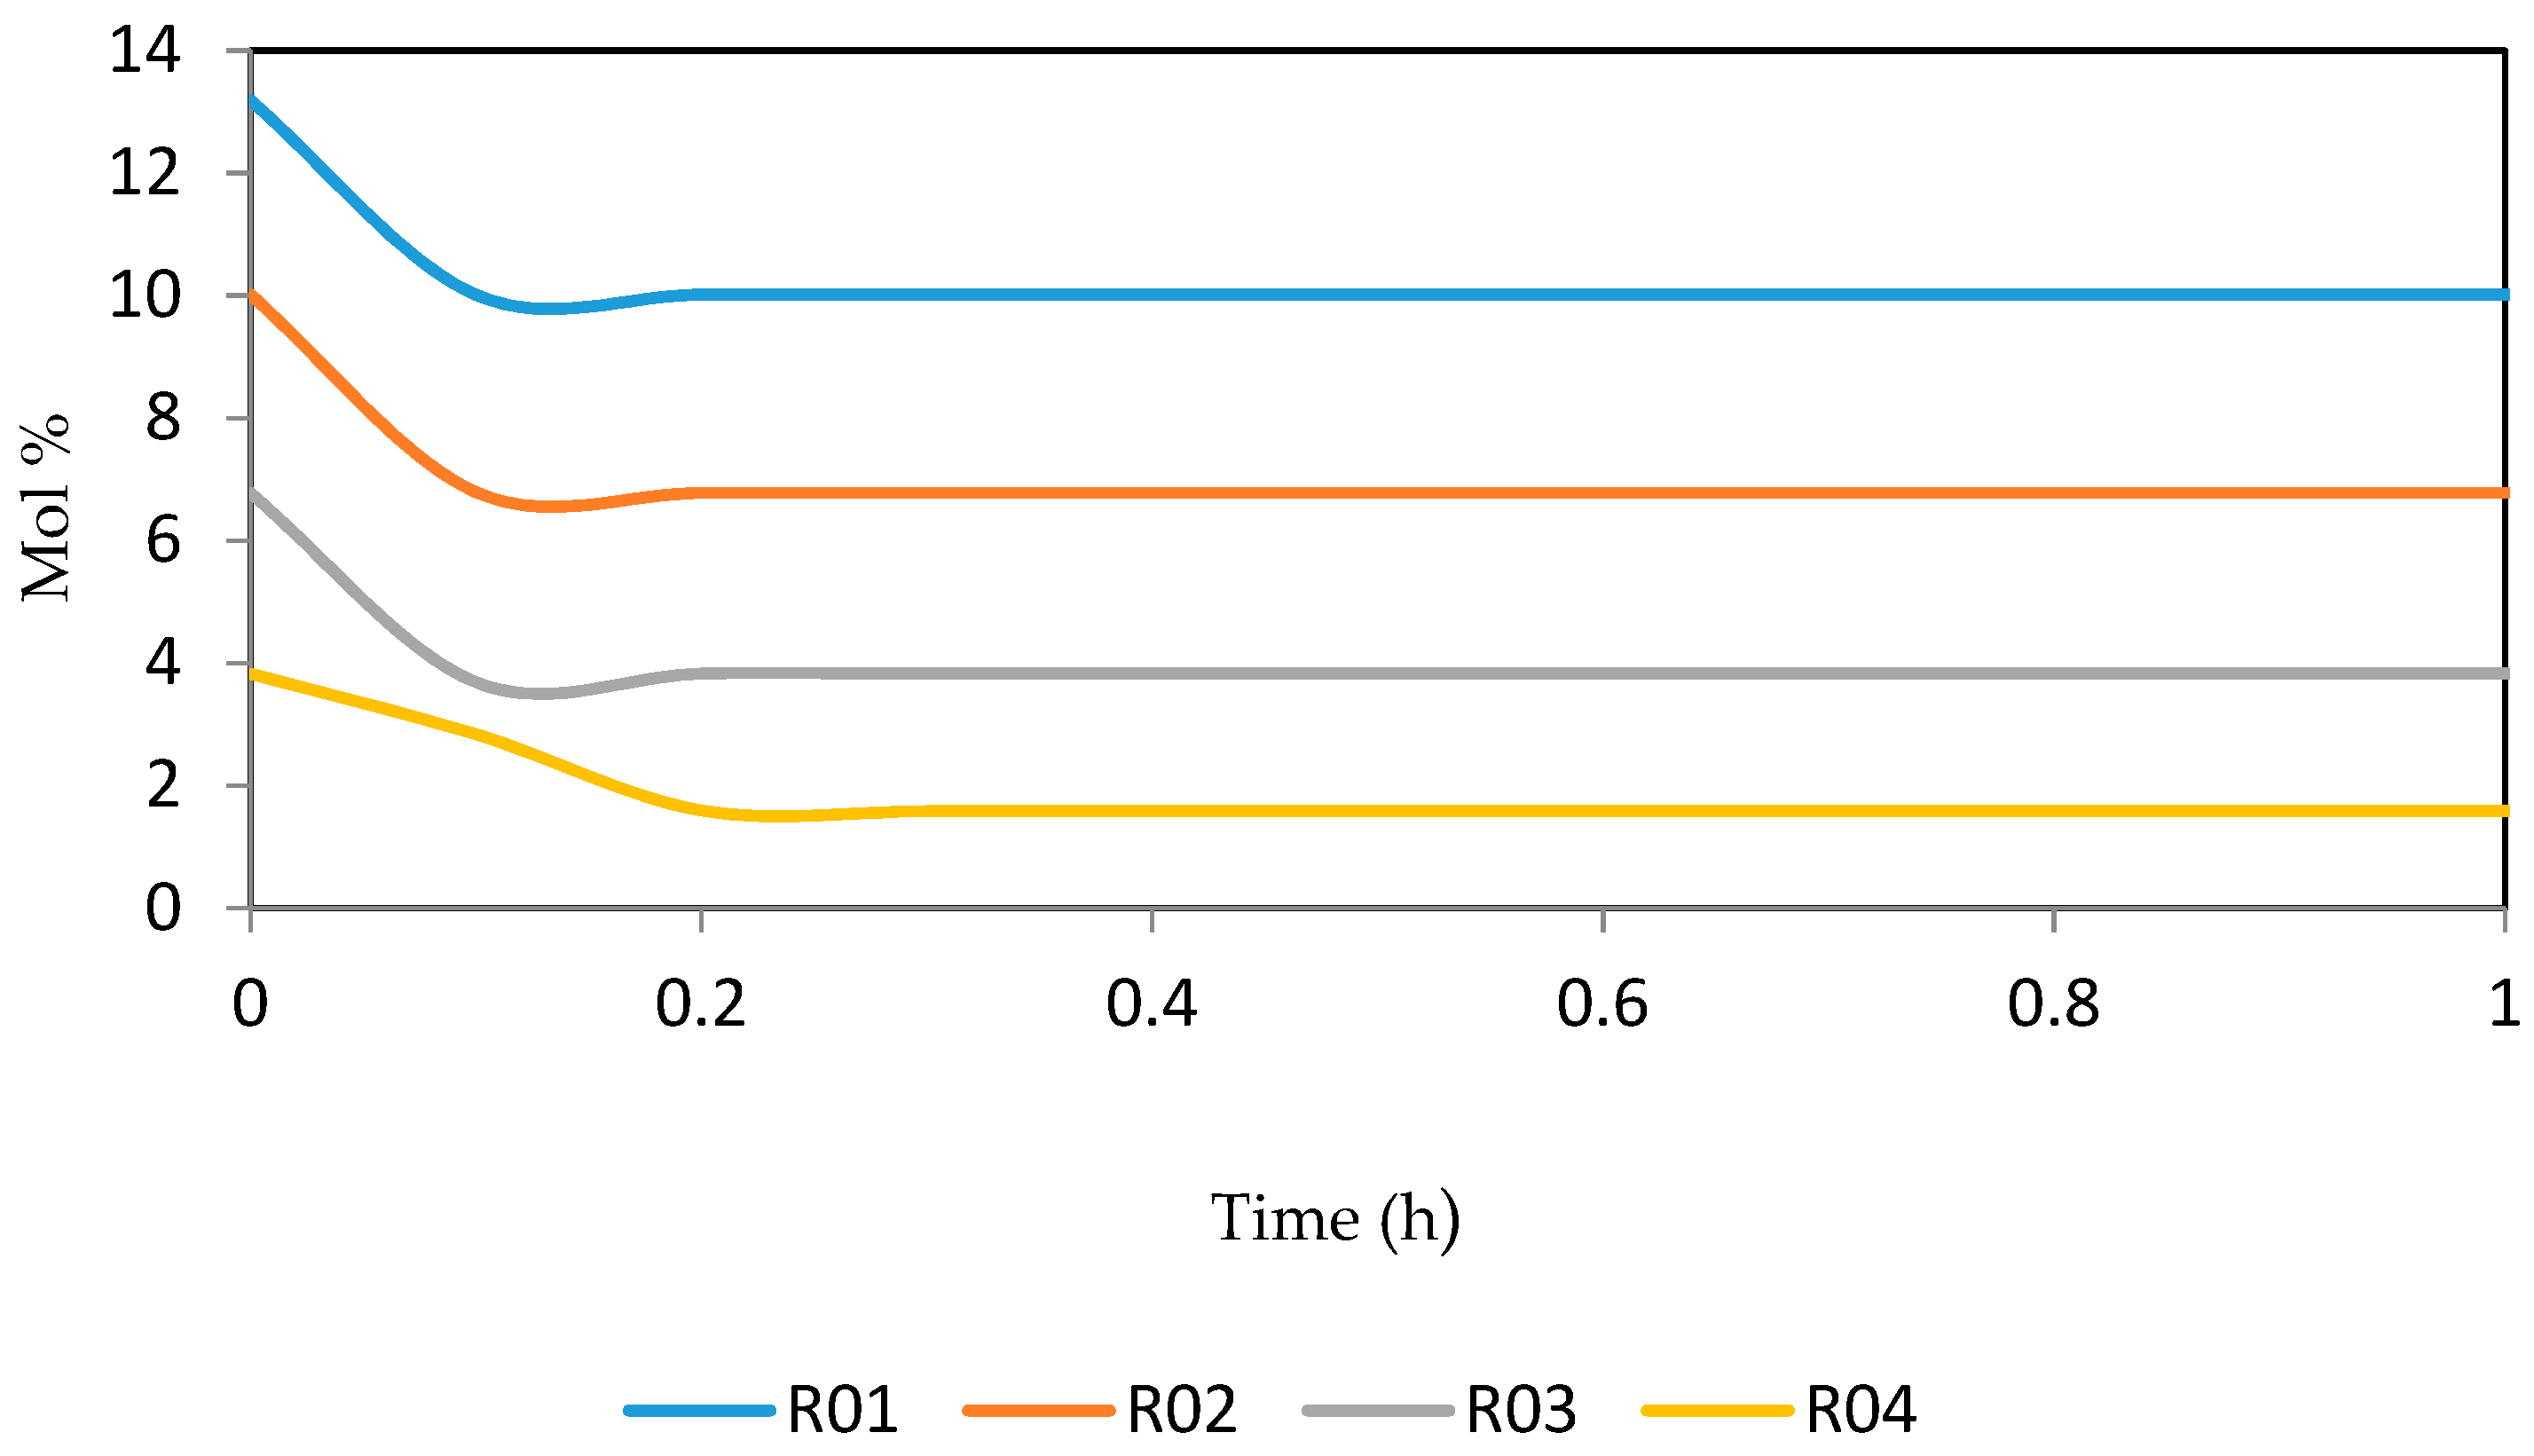
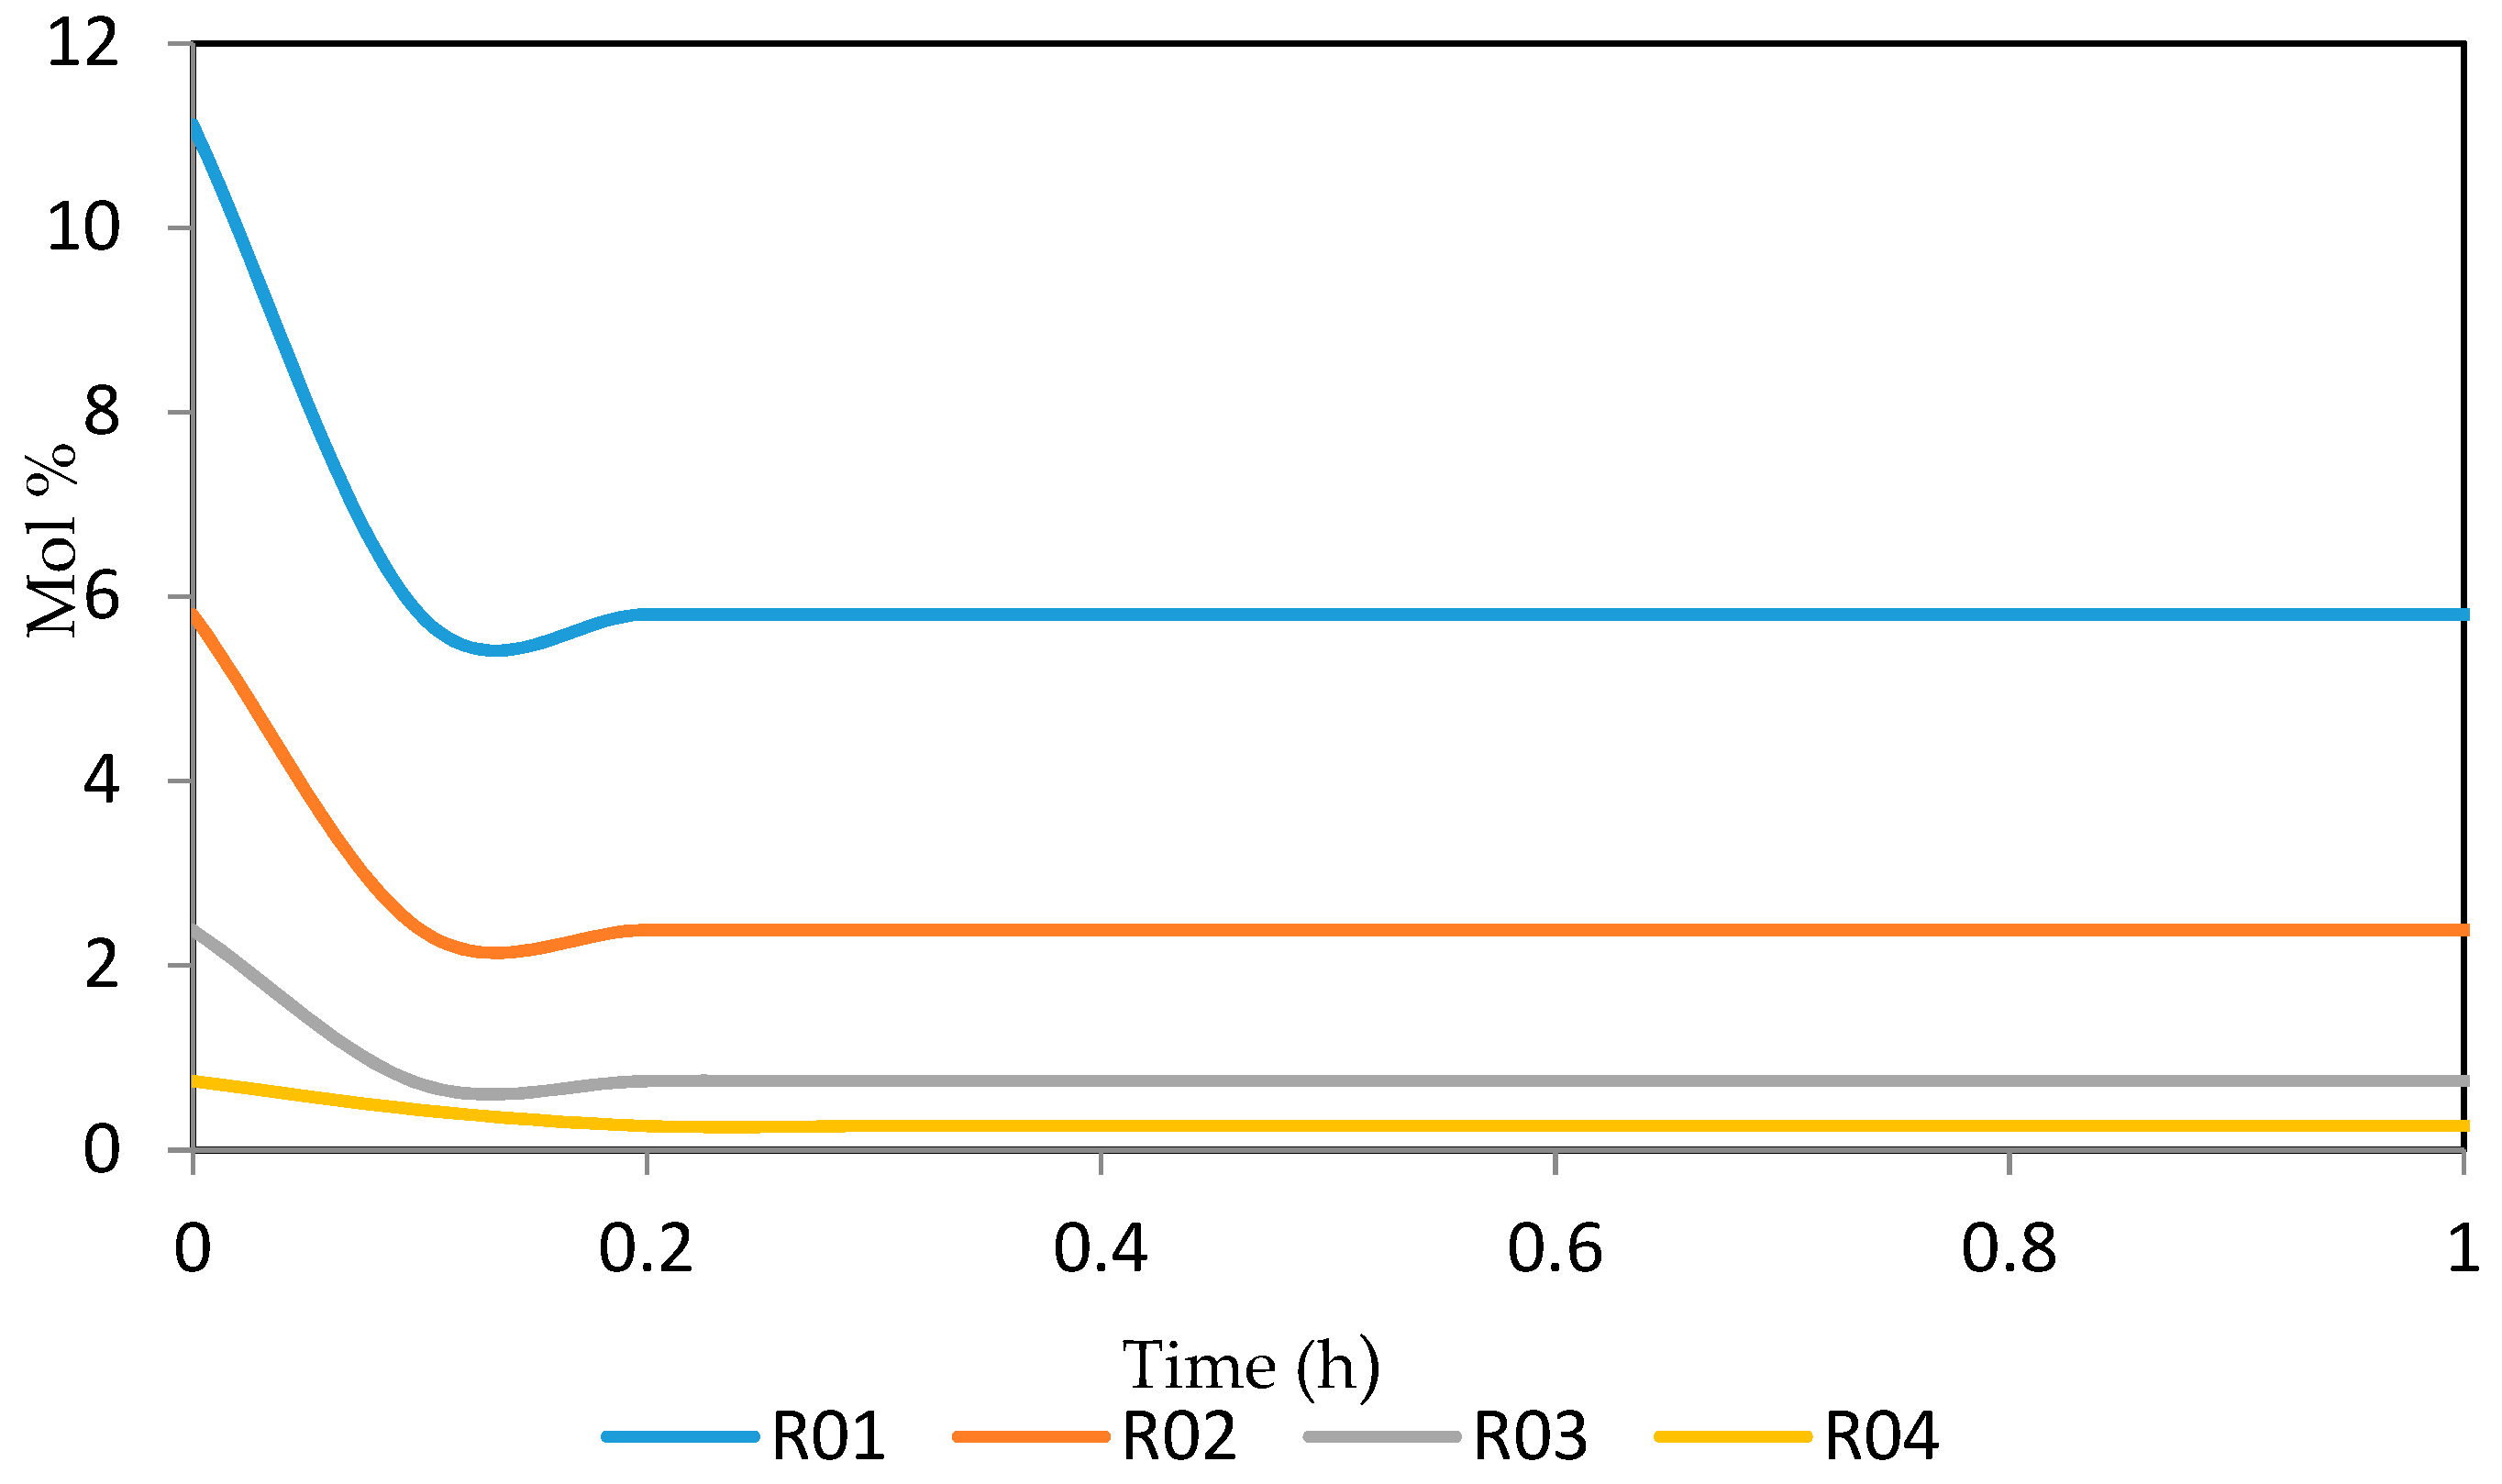
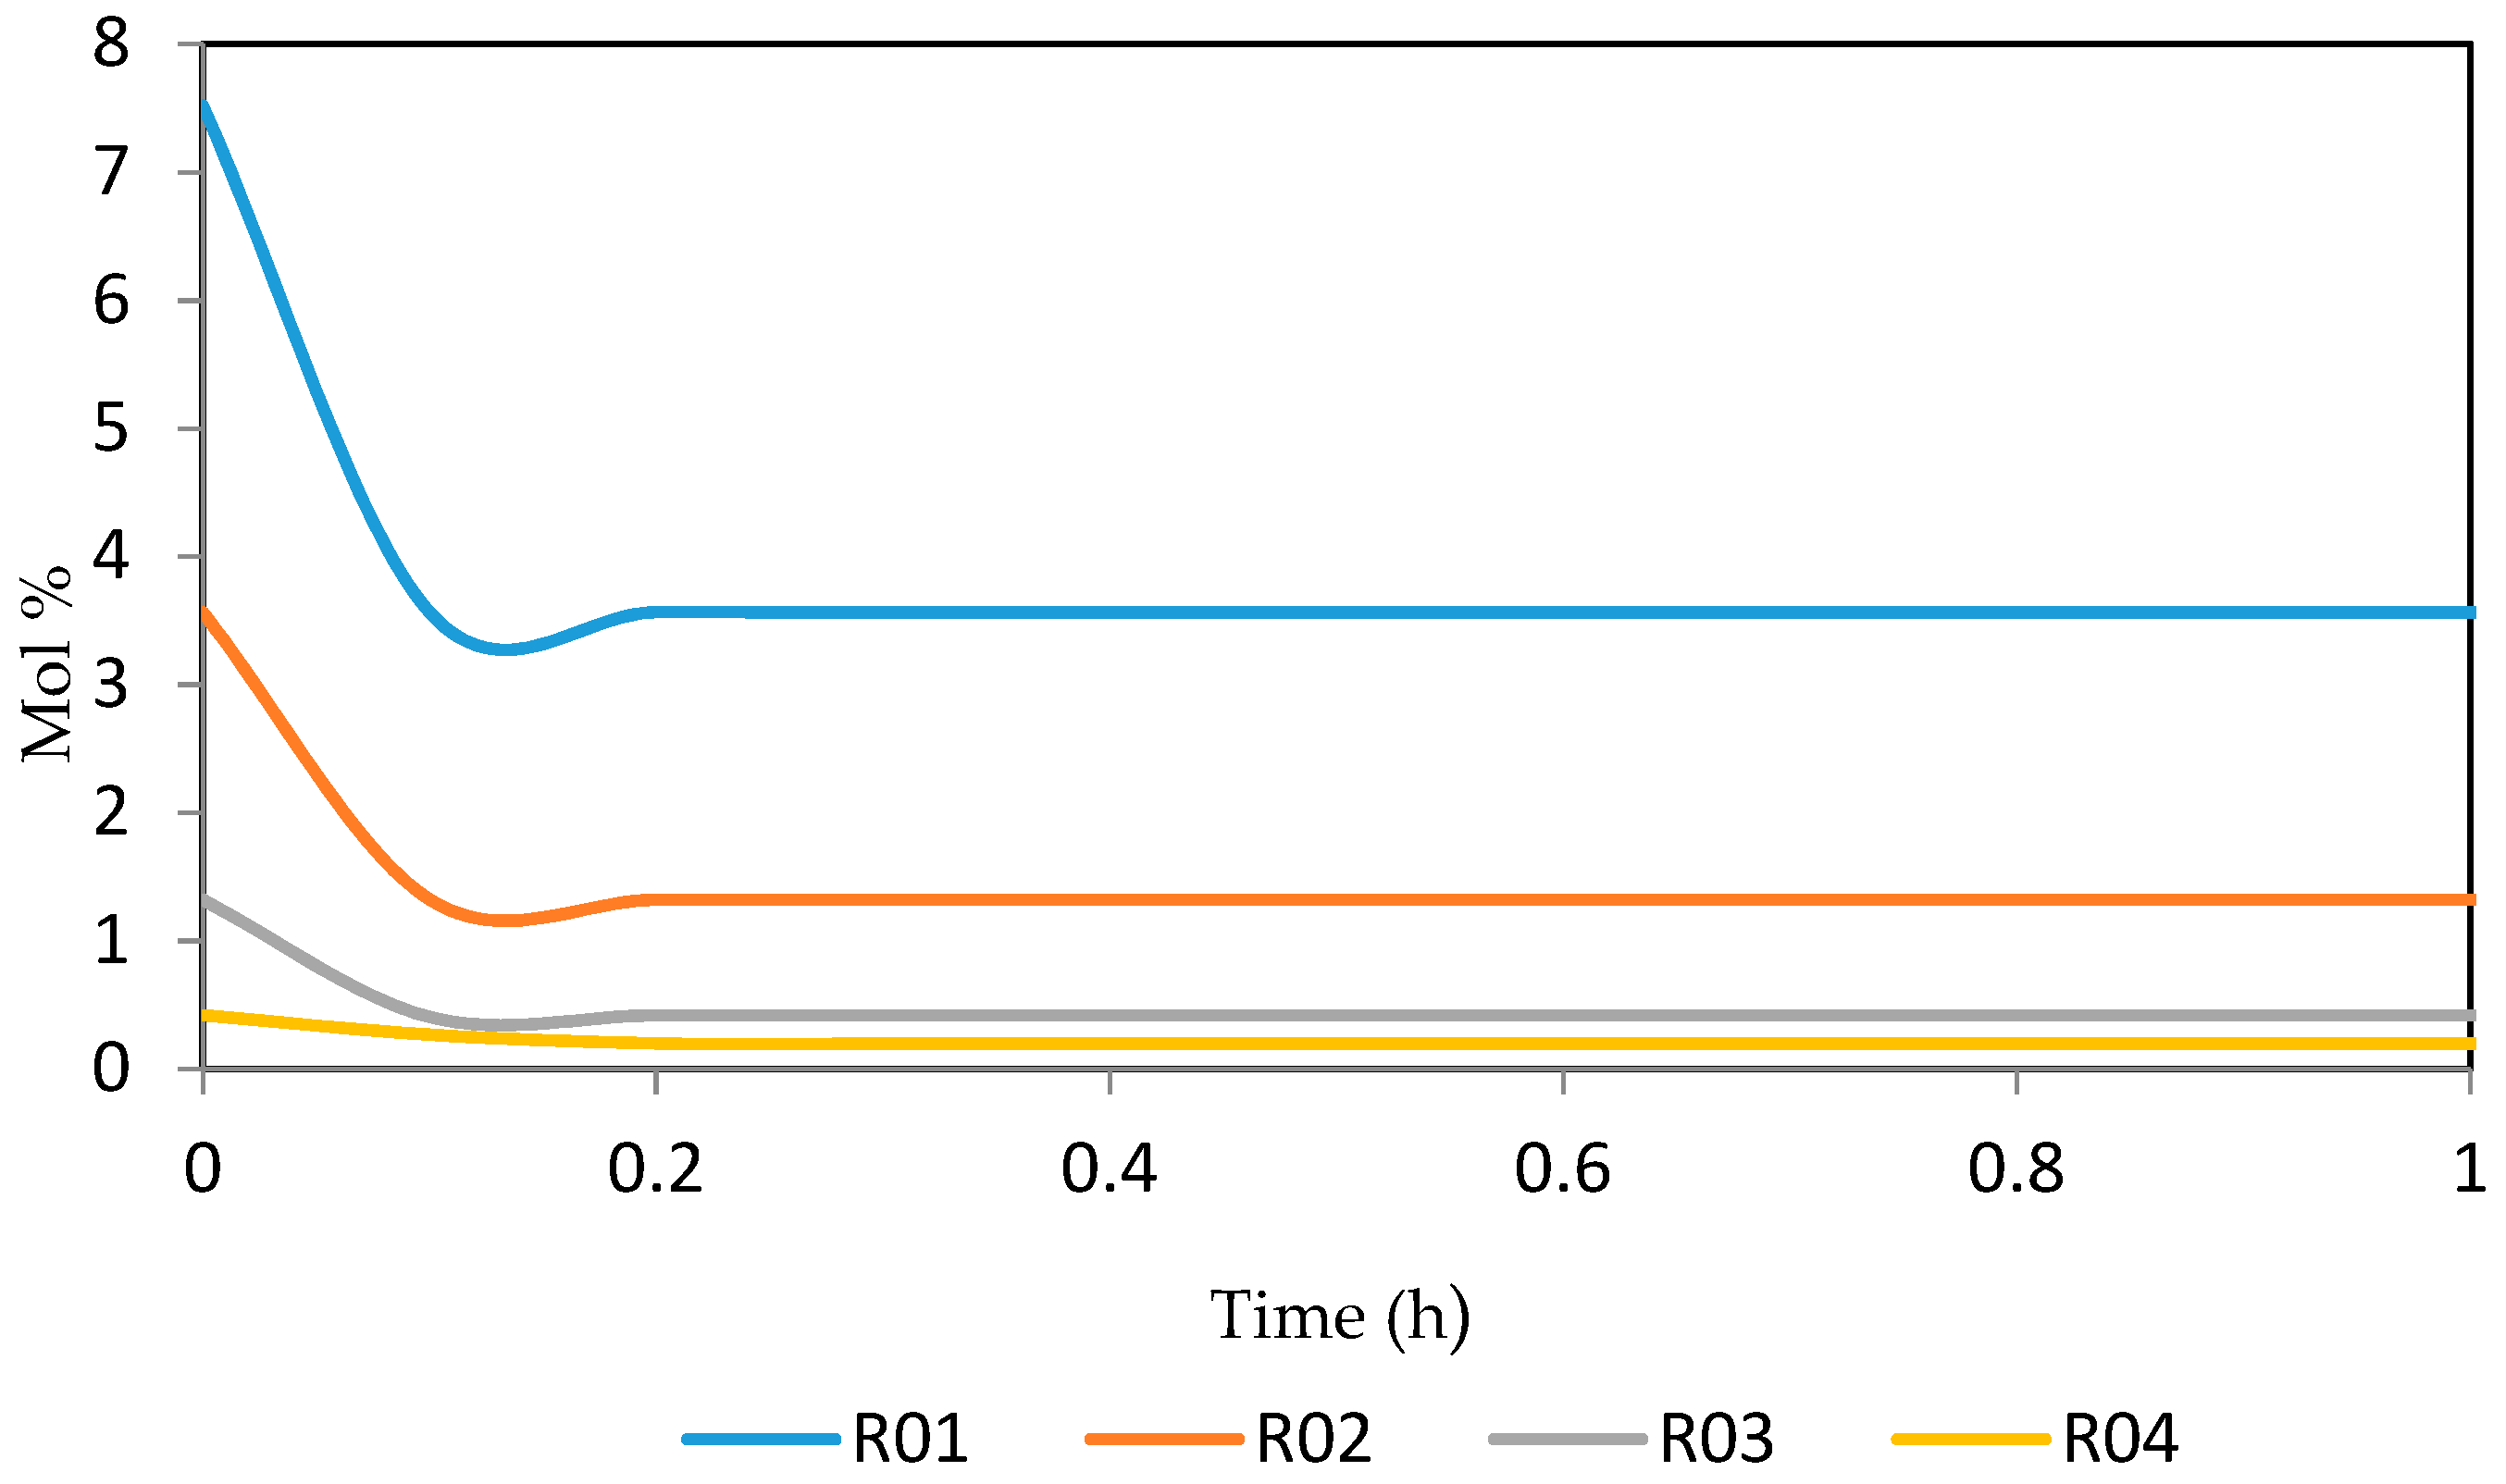
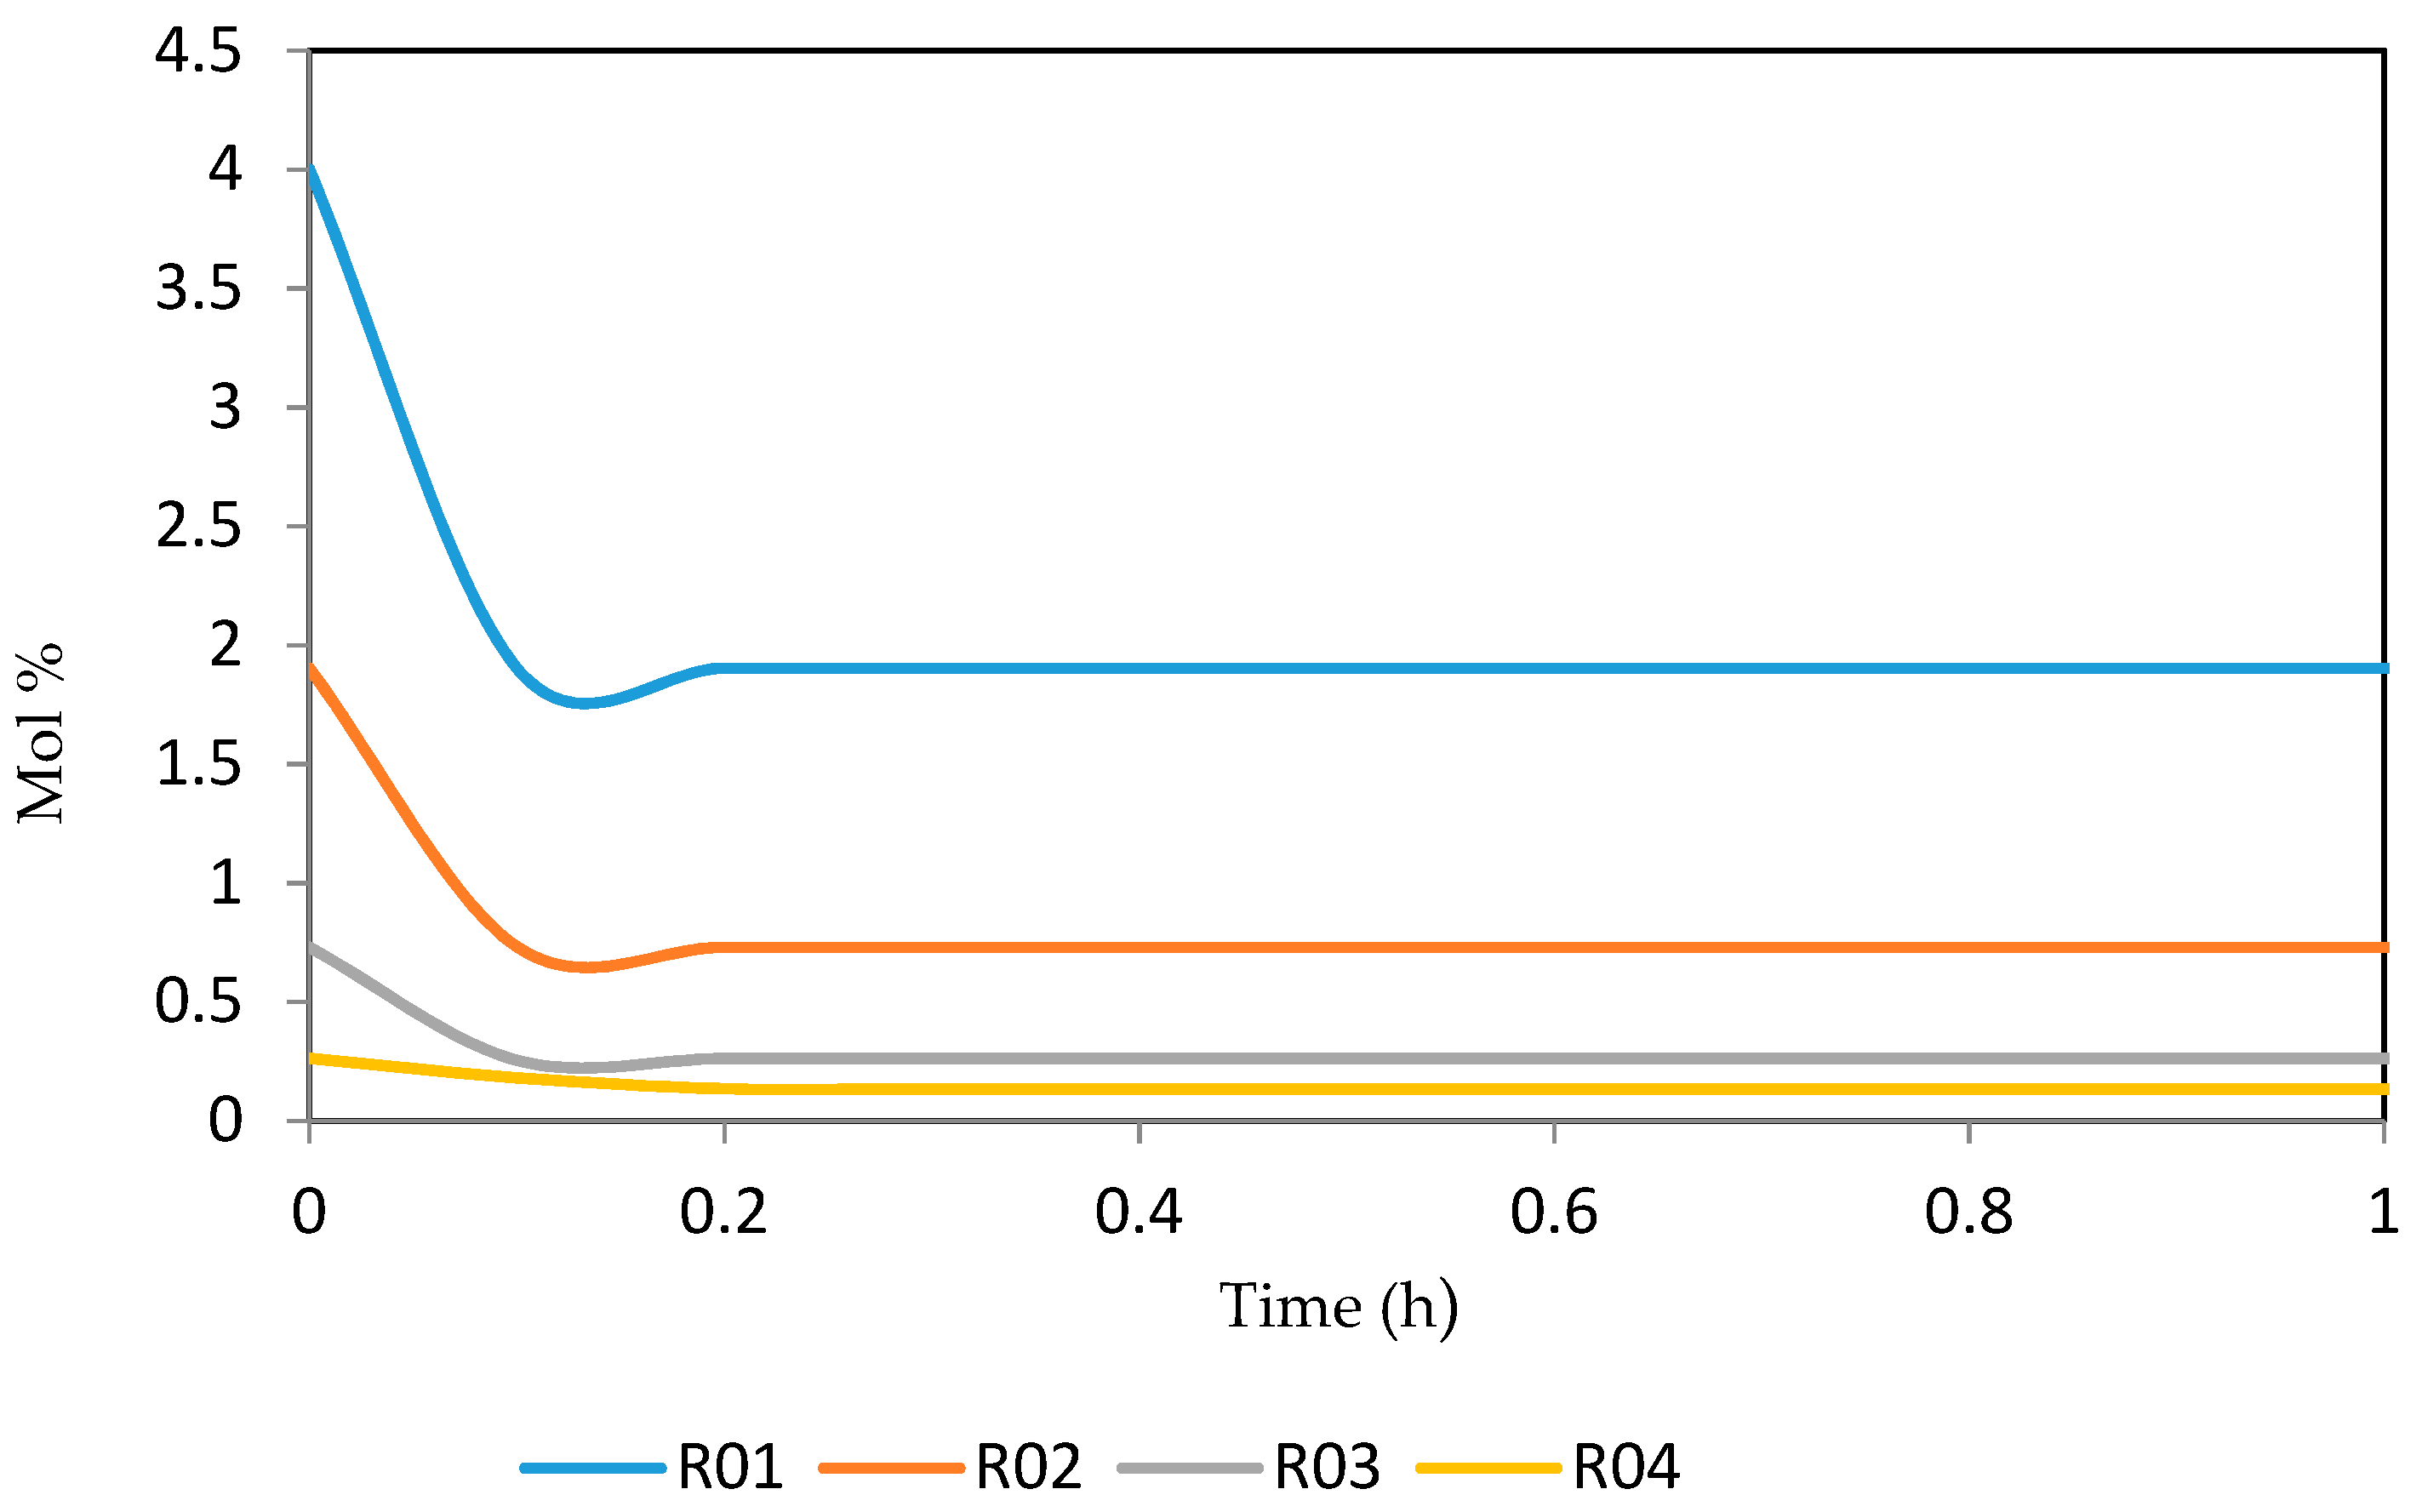
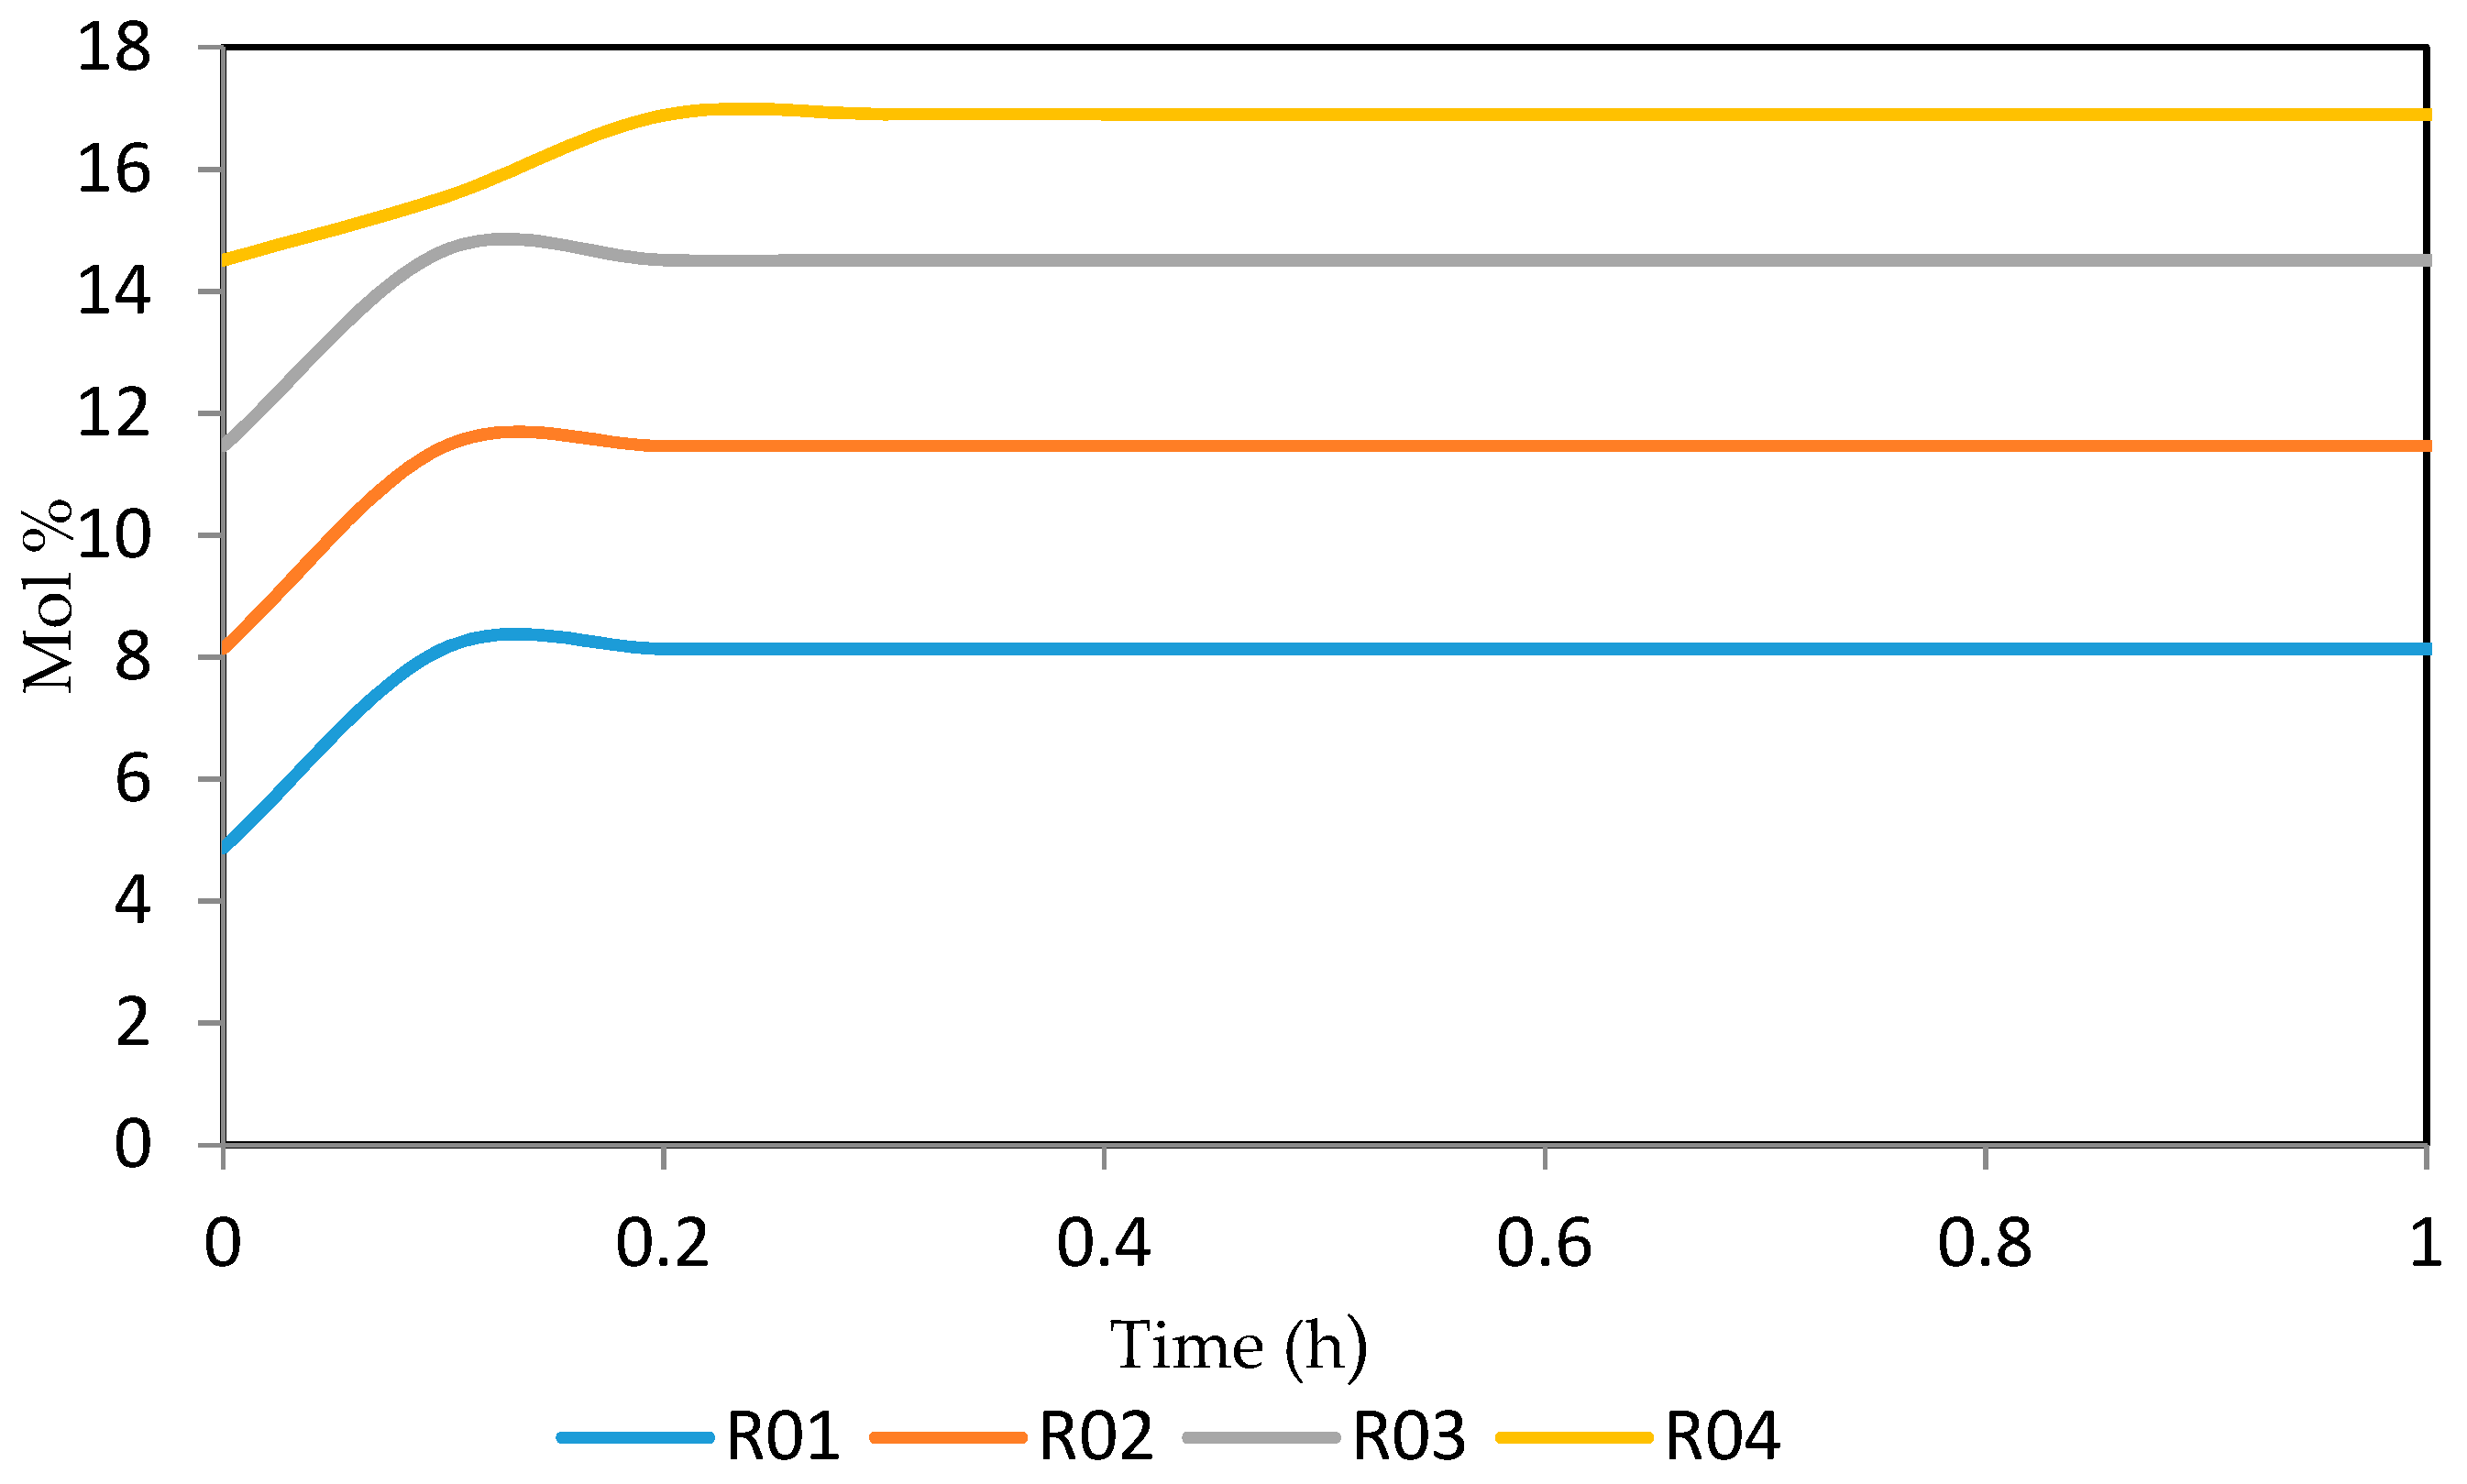
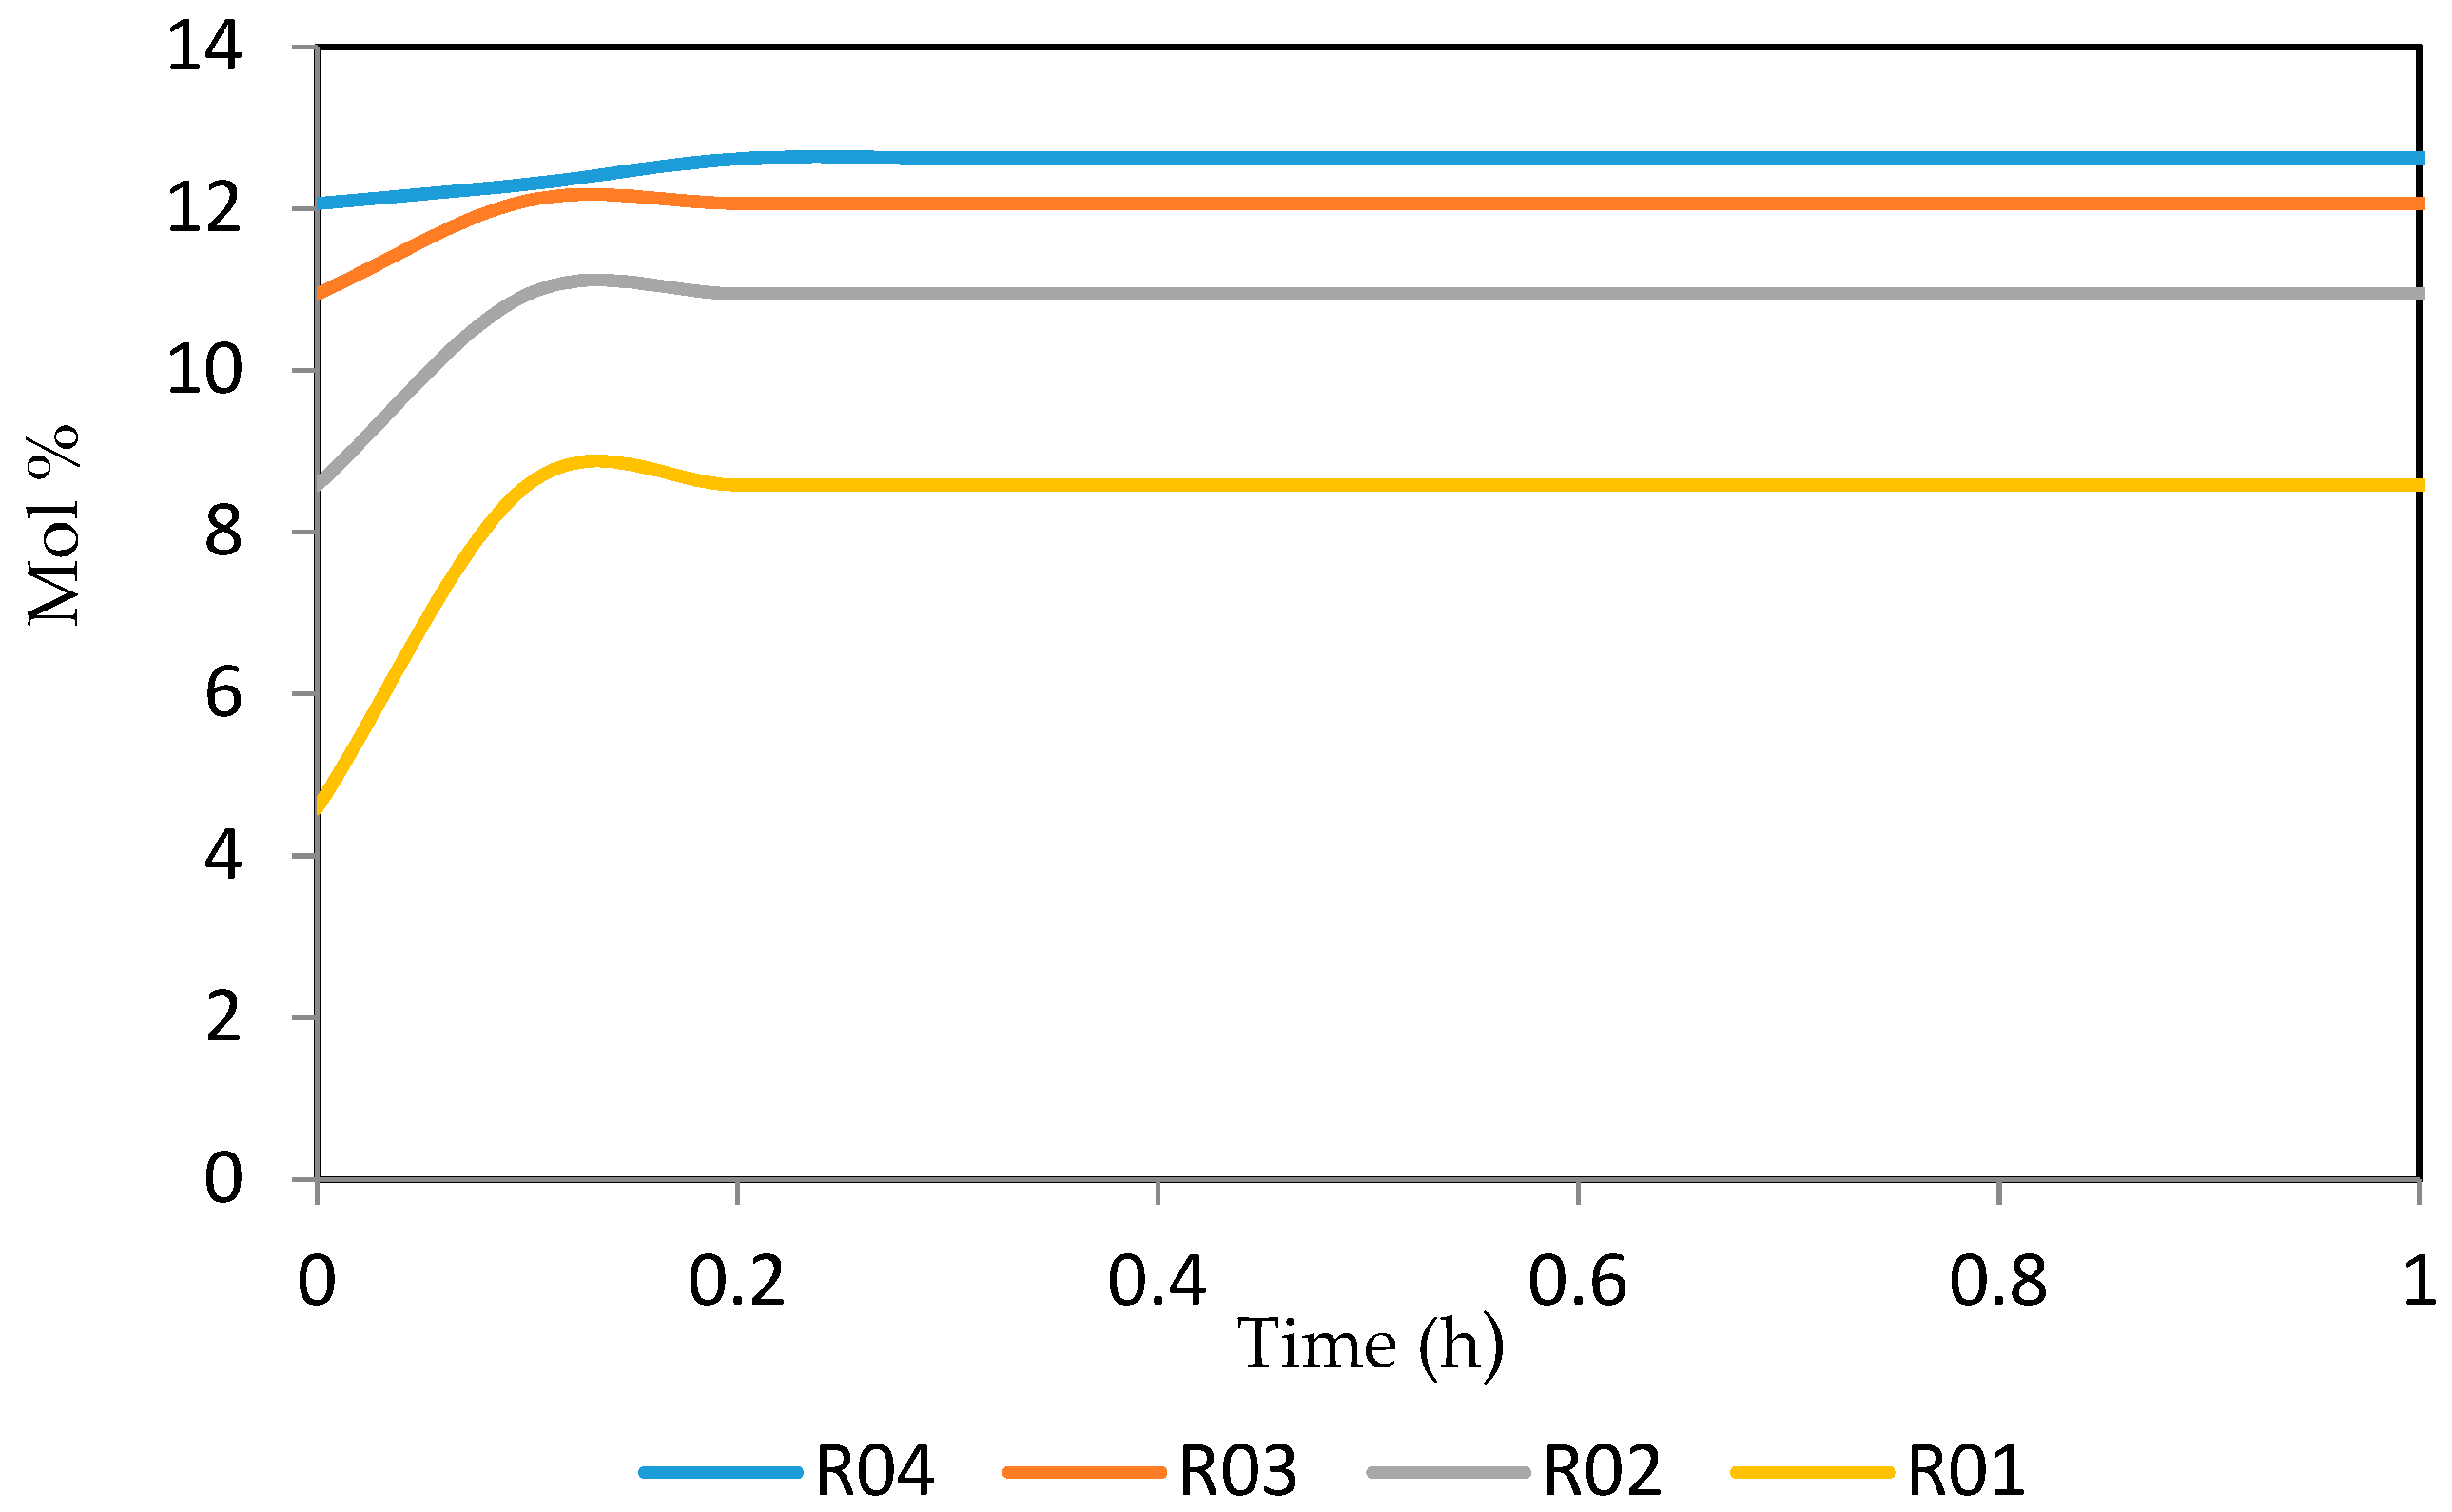
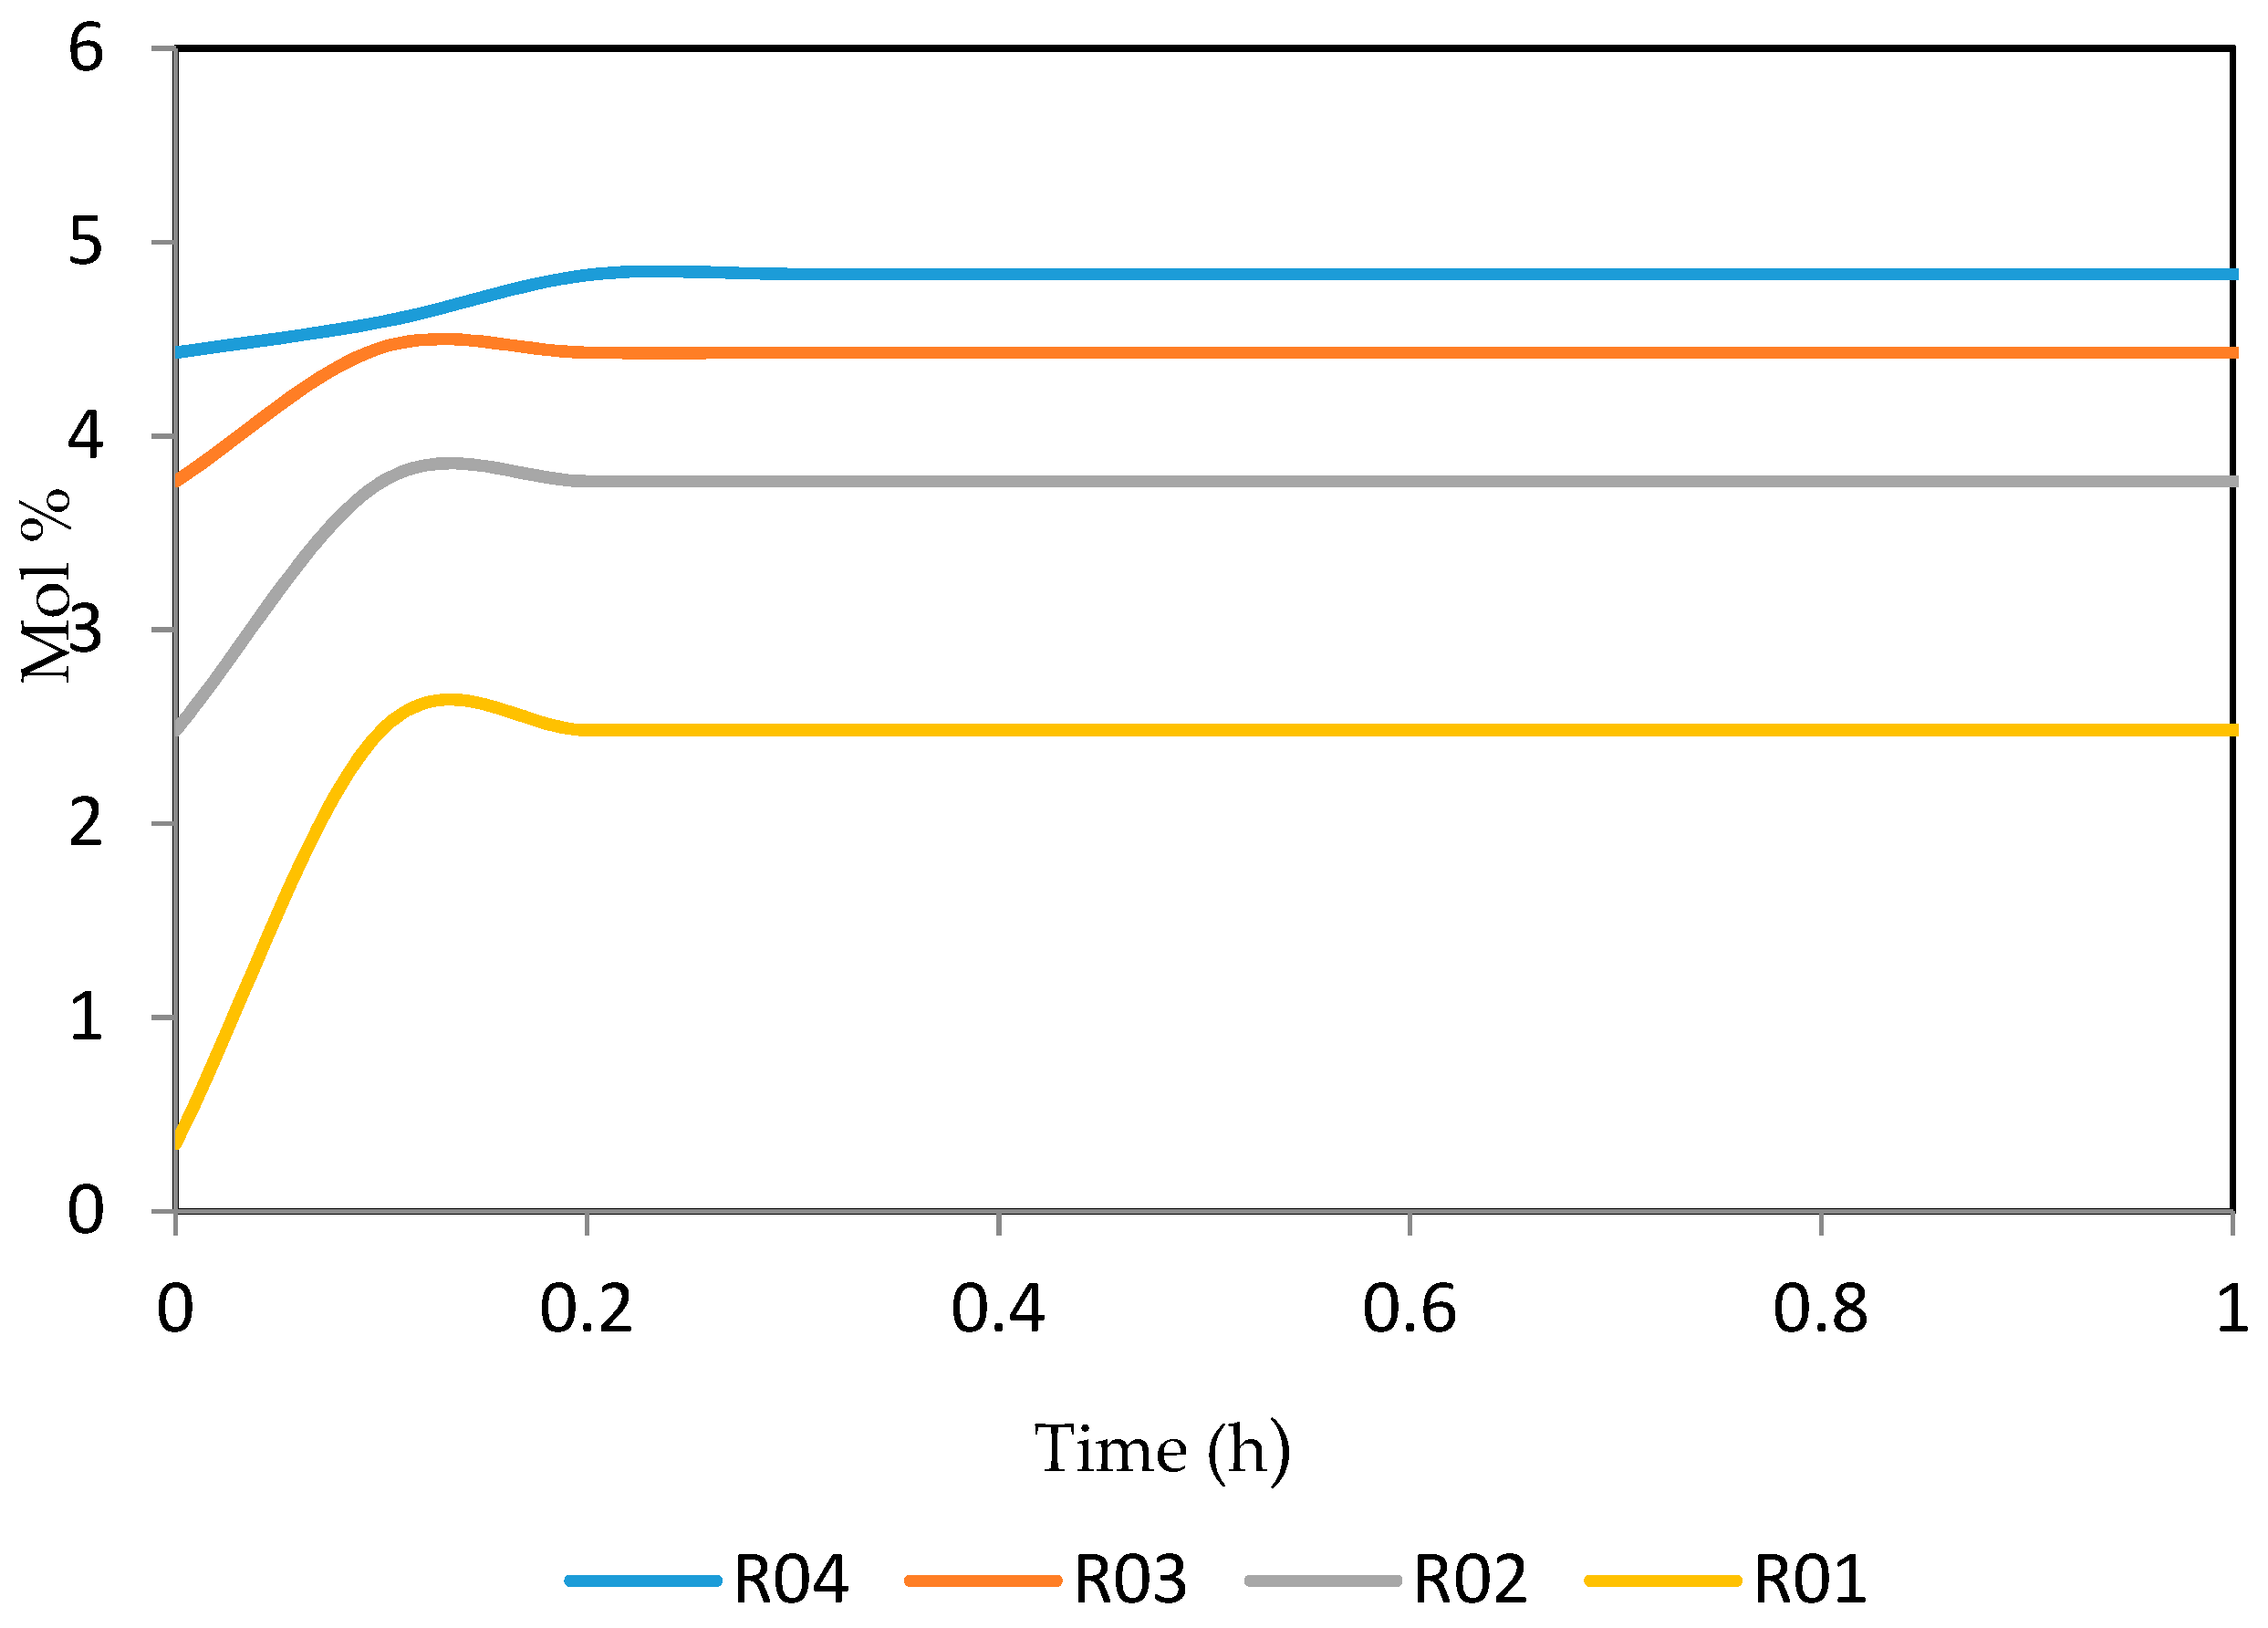
Figure 15, Figure 16, Figure 17, Figure 18, Figure 19 and Figure 20 give the dynamic behaviours of the paraffins. Unlike in Figure 4 where it shows the steady state behaviour of the paraffins changing with the reactor height, in these Figures, the time to reach steady state in all the reactors where studied. The dynamics were run for 10 h but for clarity purpose it stops at 1 h. It takes 0.18 h in reactor 1 to attain steady state, 0.20 h to attain steady state in reactor 2, 0.22 h to attain steady state for reactor 3 while it takes 0.28 h to attain steady state in reactor 4.
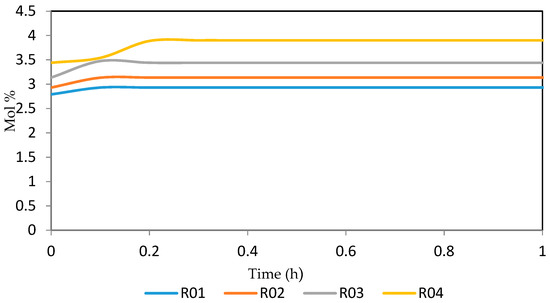
Figure 15.
Dynamic behaviour of P5 in the four reactors.
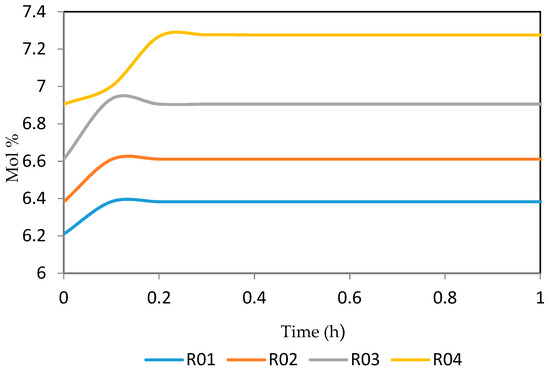
Figure 16.
Dynamic behaviour of P6 in the four reactors.

Figure 17.
Dynamic behaviour of P7 in the four reactors.

Figure 18.
Dynamic behaviour of P8 in the four reactors.
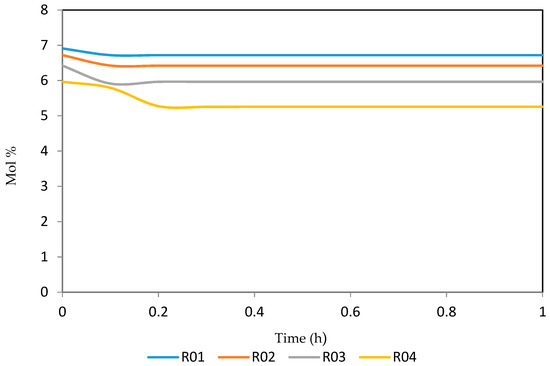
Figure 19.
Dynamic behaviour of P9 in the four reactors.
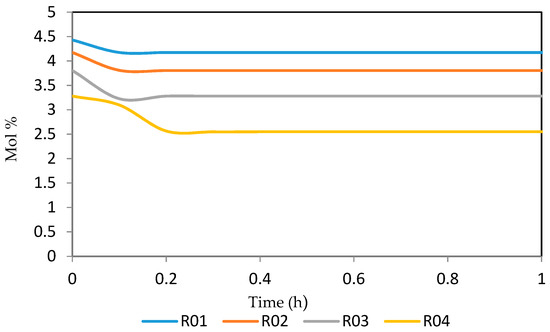
Figure 20.
Dynamic behaviour of P10 in the four reactors.
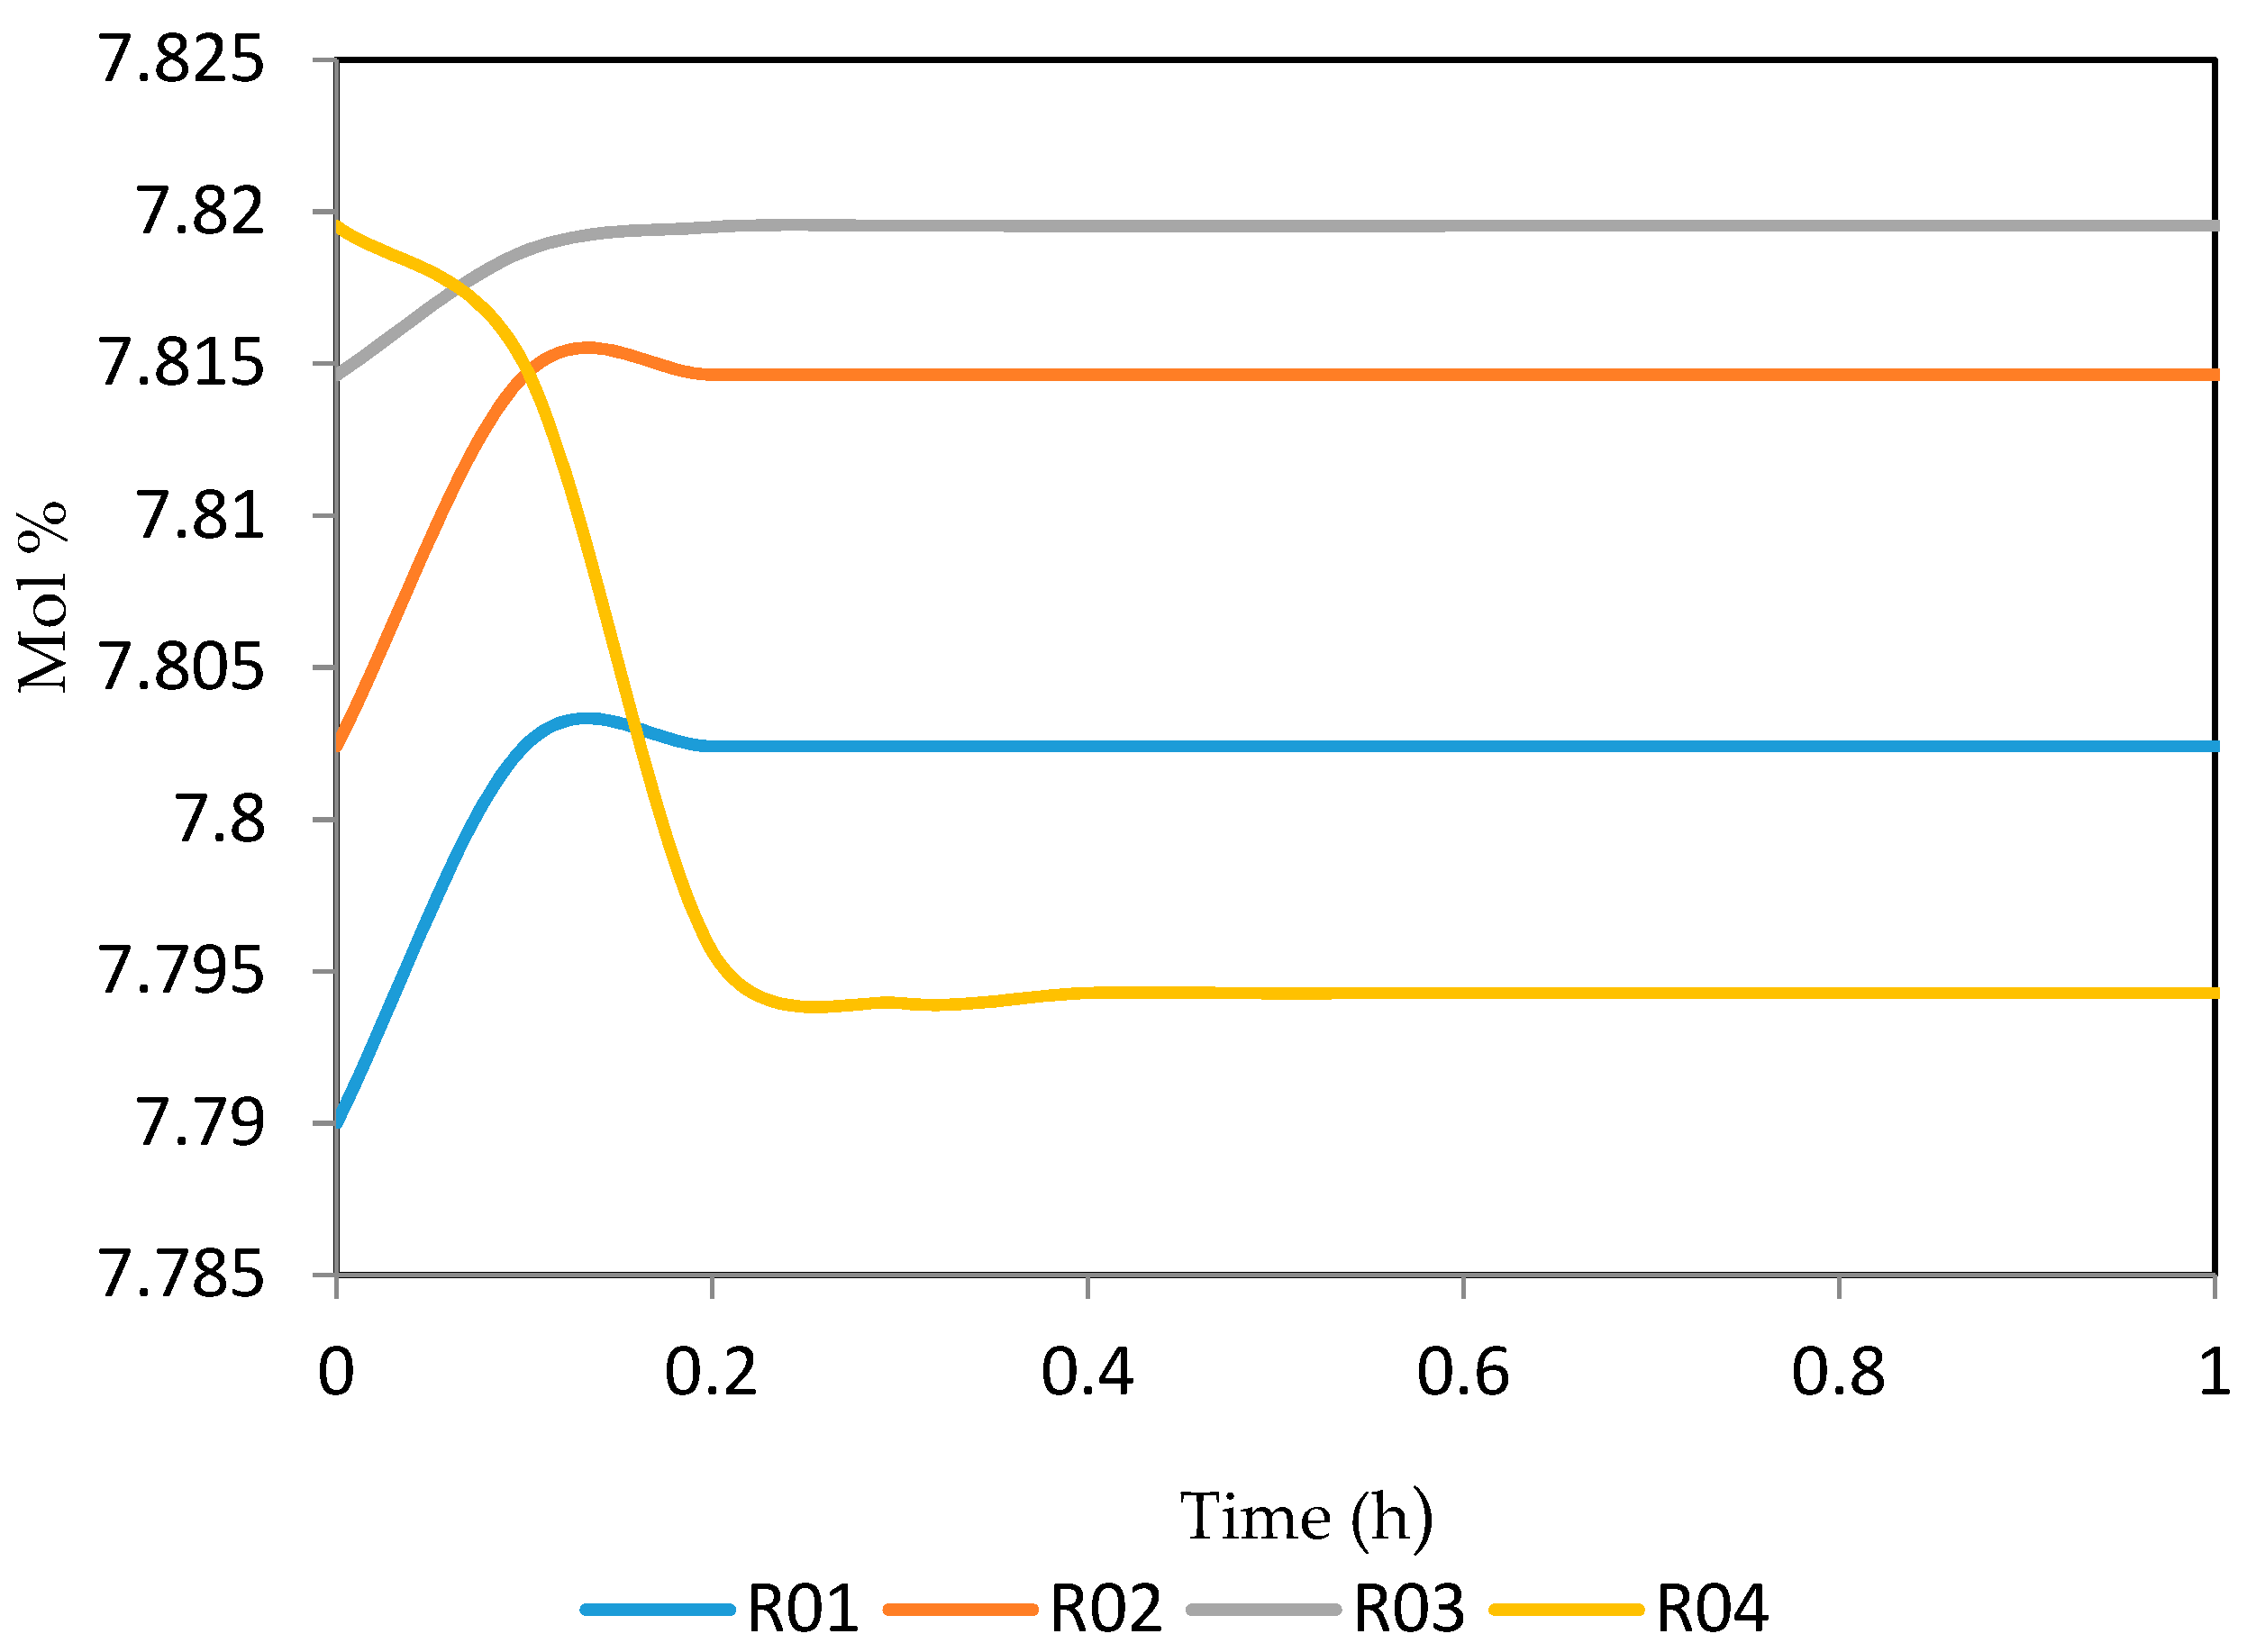
Figure 21, Figure 22, Figure 23, Figure 24 and Figure 25 give the dynamic behaviours of the naphthenes. Unlike in Figure 5 where it shows the steady state behaviour of the naphthenes changing with the reactor height, in these Figures, the time to reach steady state in all the reactors where studied. The dynamics were run for 10 h but for clarity purpose it stops at 1 h. It takes 0.18 h in reactor 1 to attain steady state, 0.20 h to attain steady state in reactor 2, 0.22 h to attain steady state for reactor 3 while it takes 0.28 h to attain steady state in reactor 4.
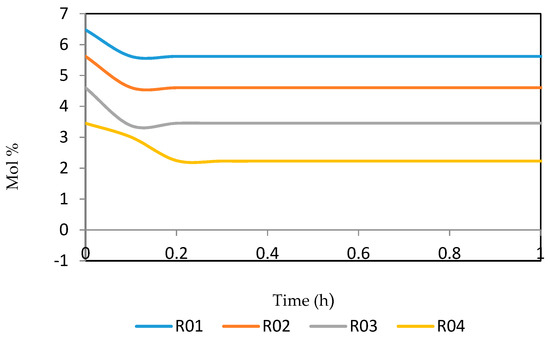
Figure 21.
Dynamic behaviour of N6 in the four reactors.
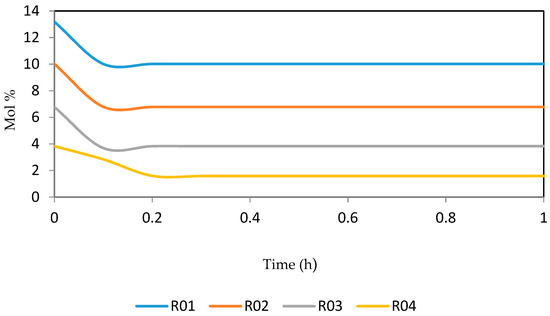
Figure 22.
Dynamic behaviour of N7 in the four reactors.
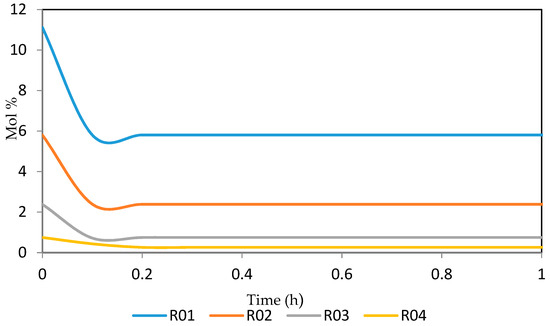
Figure 23.
Dynamic behaviour of N8 in the four reactors.
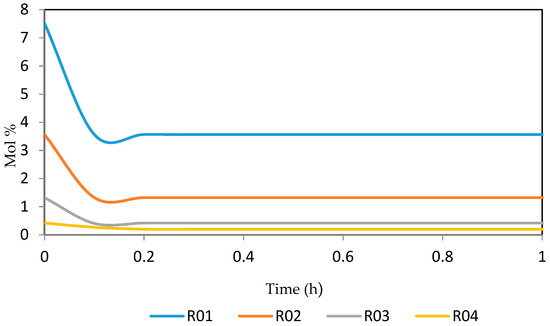
Figure 24.
Dynamic behaviour of N9 in the four reactors.
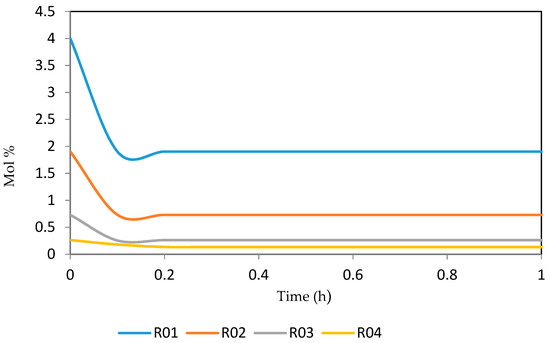
Figure 25.
Dynamic behaviour of N10 in the four reactors.
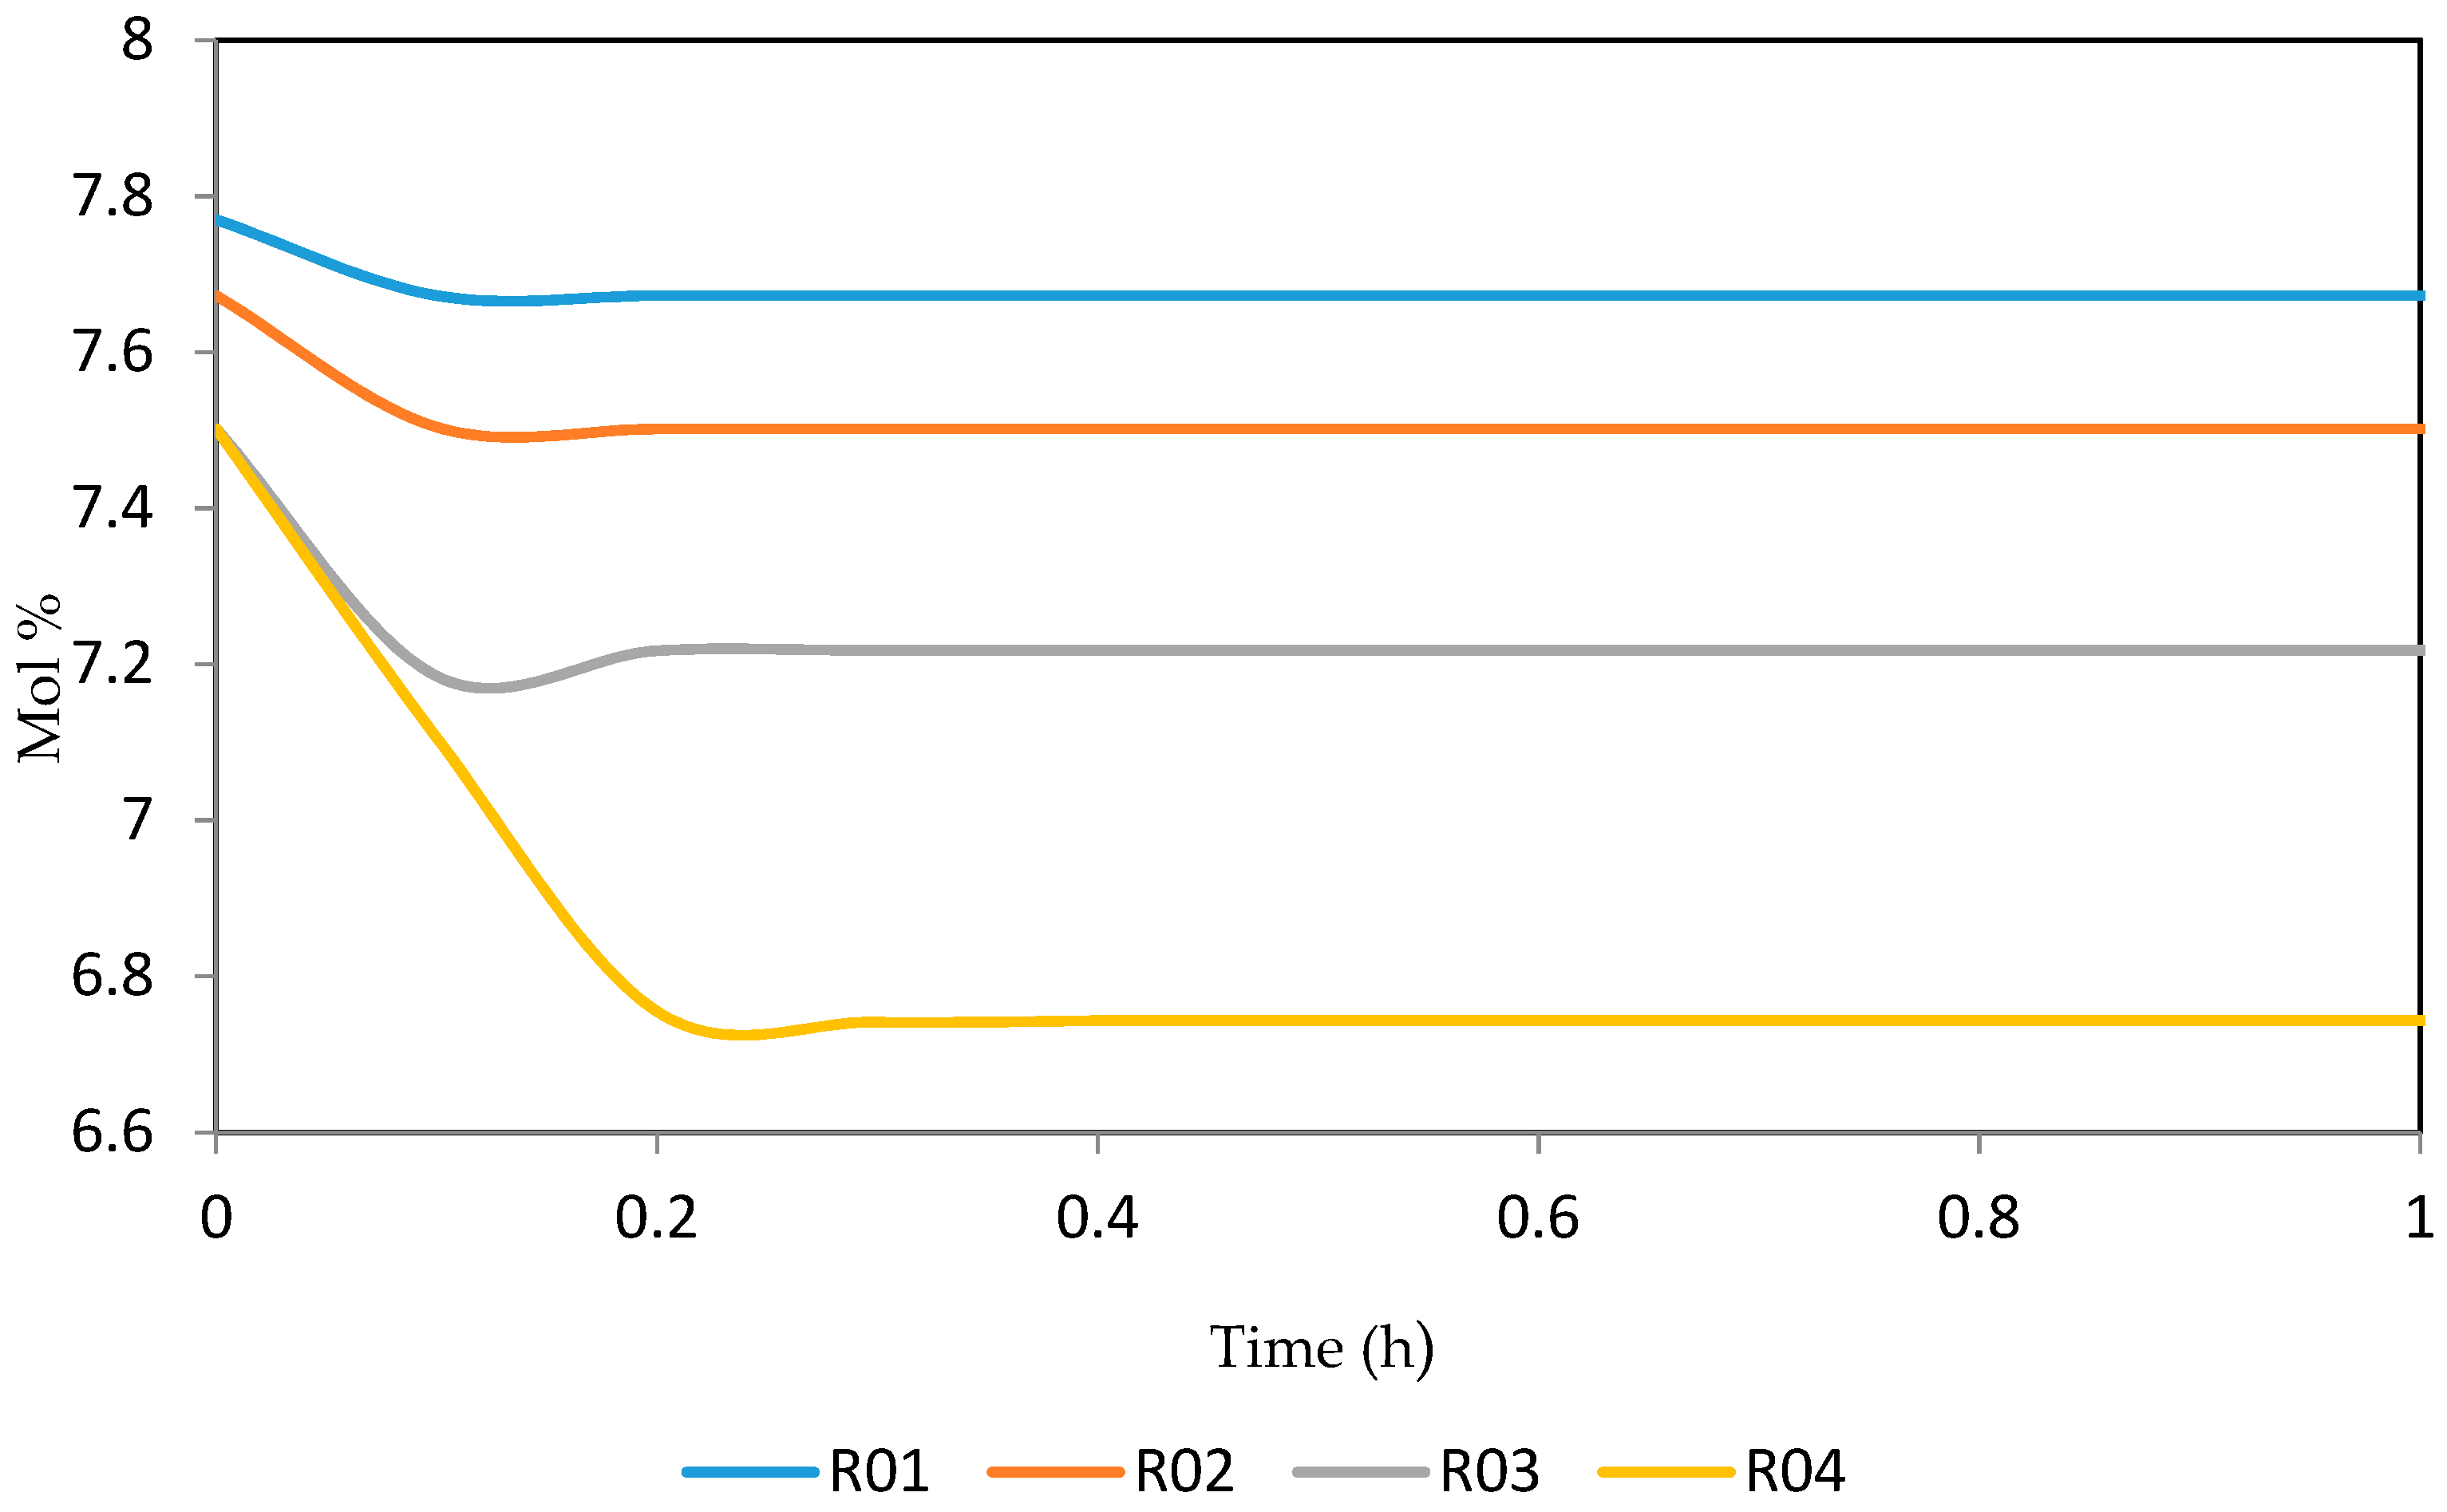
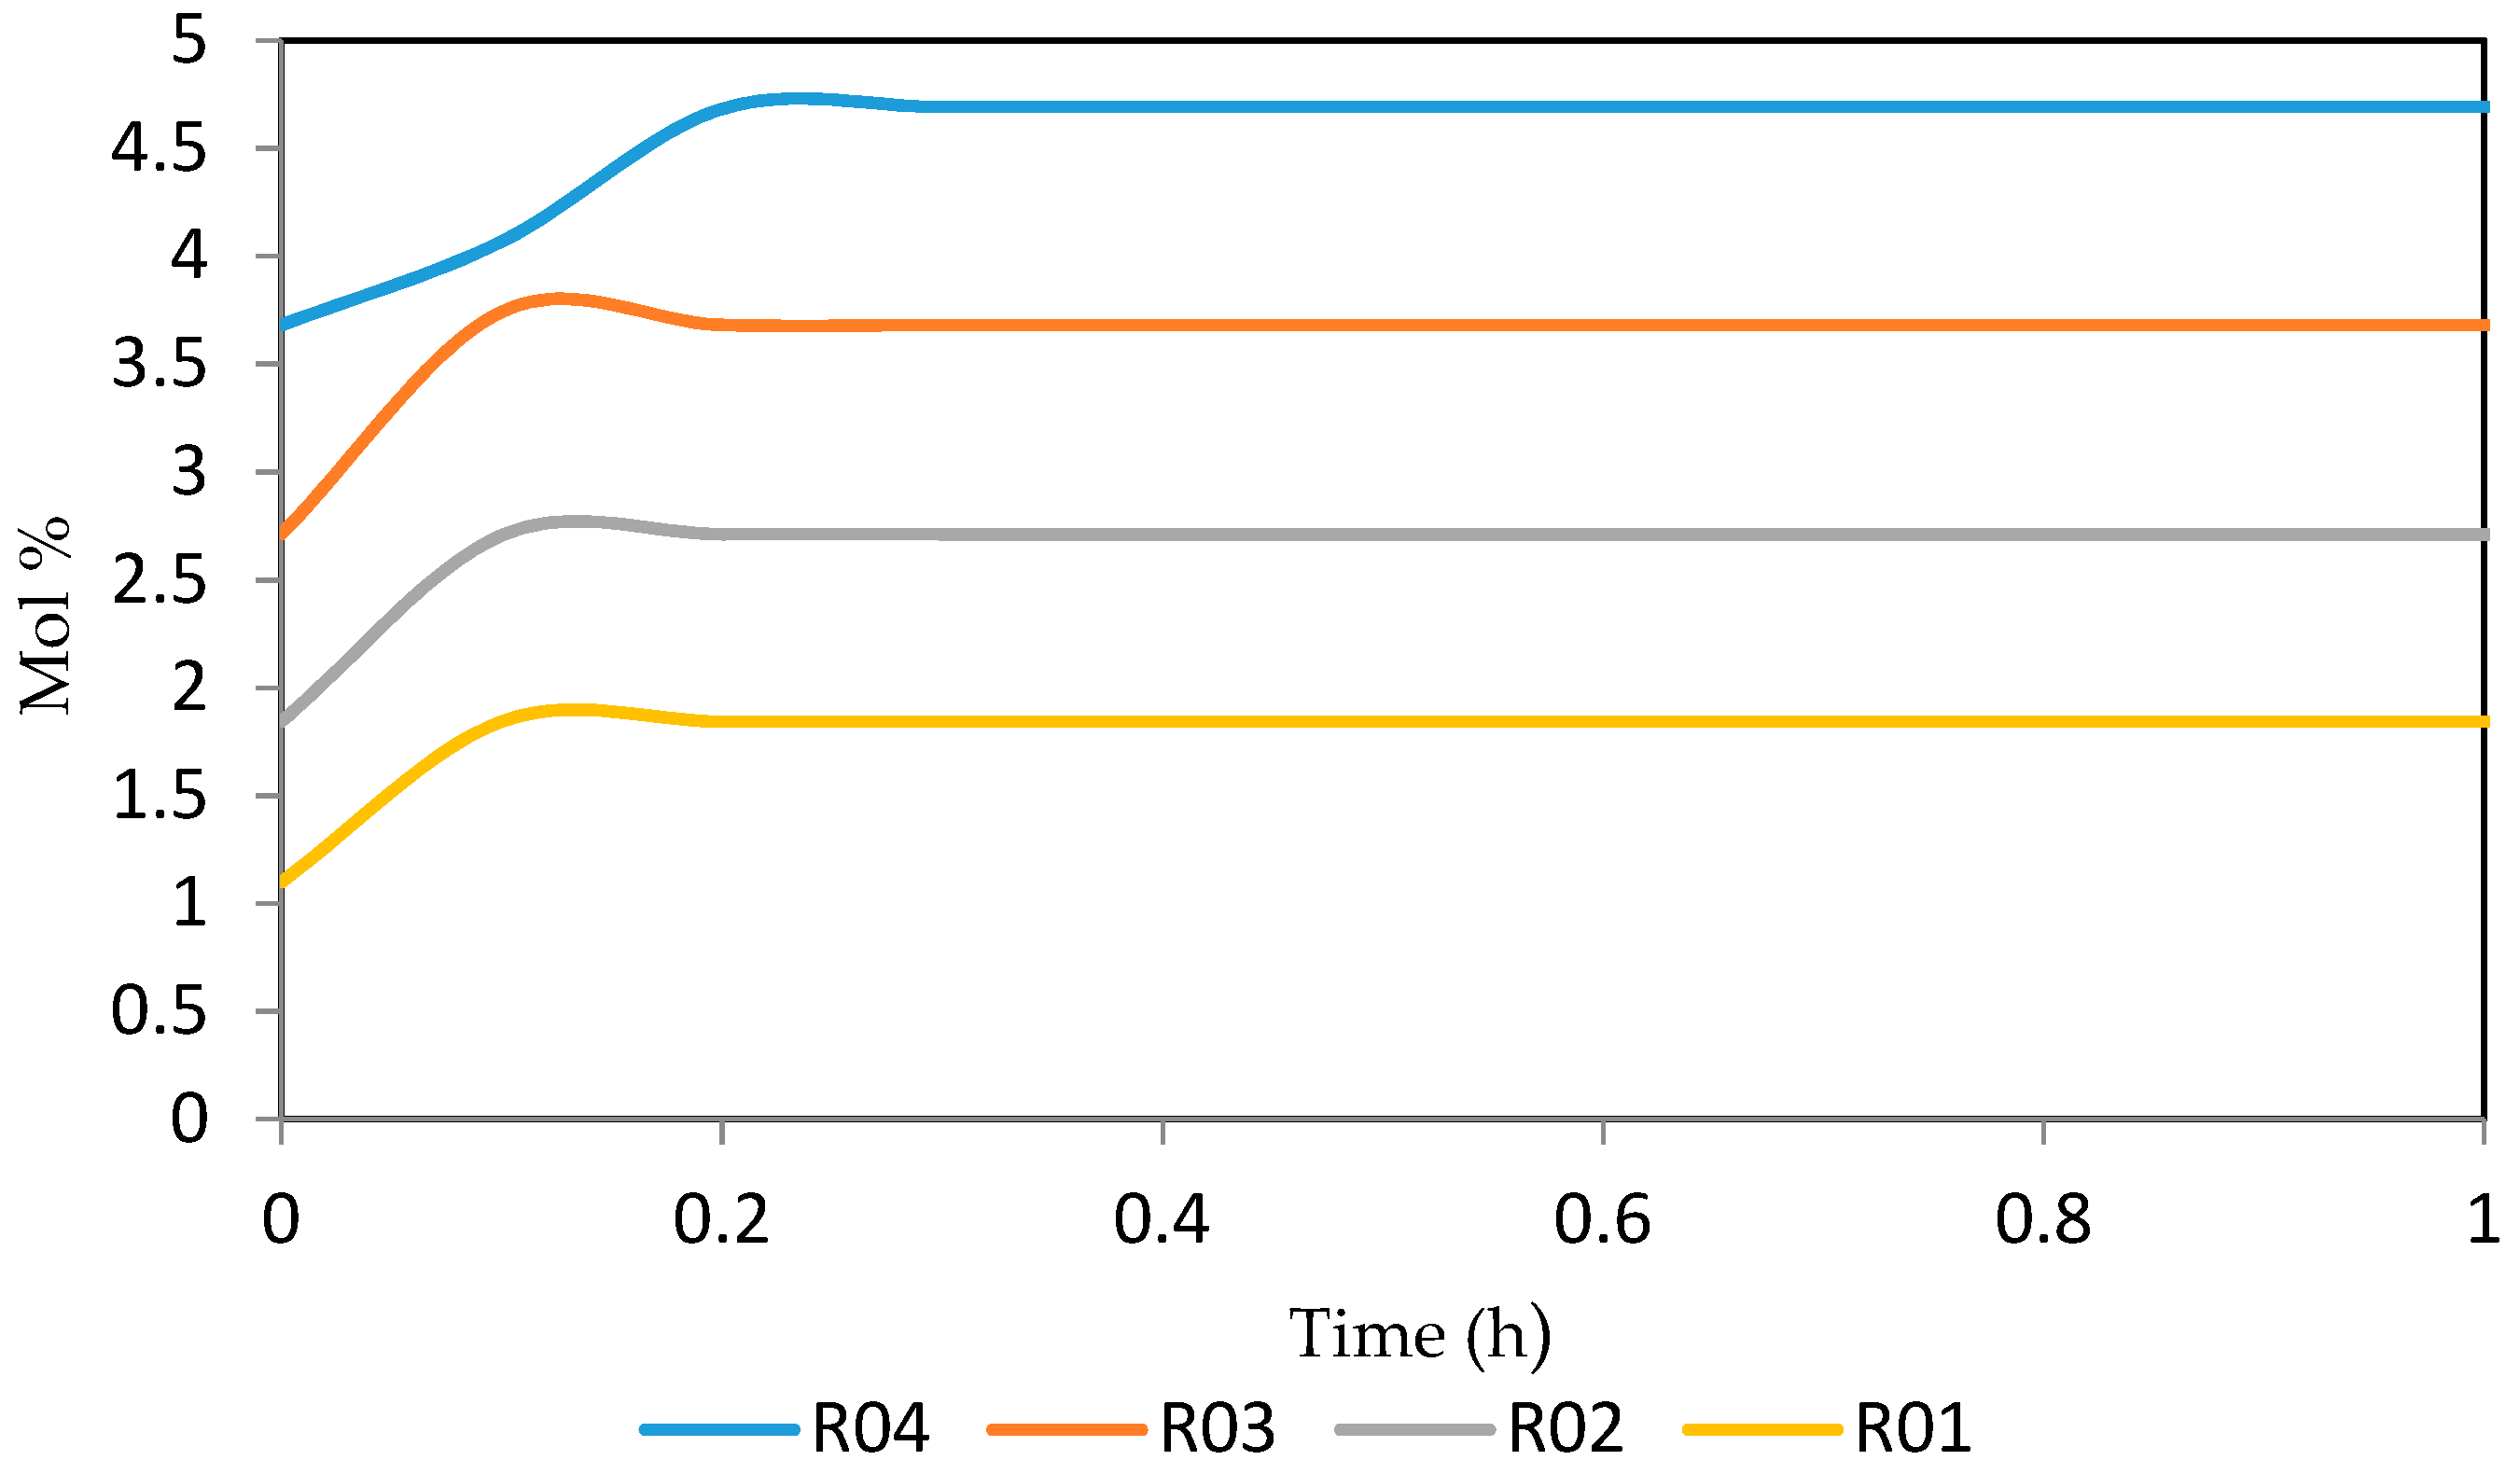
Figure 26, Figure 27, Figure 28, Figure 29 and Figure 30 give the dynamic behaviours of the aromatics. Unlike in Figure 6 where it shows the steady state behaviour of the aromatics changing with the reactor height, in these Figures, the time to reach steady state in all the reactors where studied. The dynamics were run for 10 h but for clarity purpose it stops at 1 h. It takes 0.18 h in reactor 1 to attain steady state, 0.20 h to attain steady state in reactor 2, 0.22 h to attain steady state for reactor 3 while it takes 0.28 h to attain steady state in reactor 4.
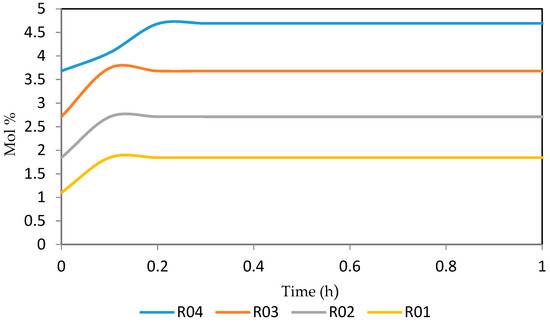
Figure 26.
Dynamic behaviour of A6 in the four reactors.
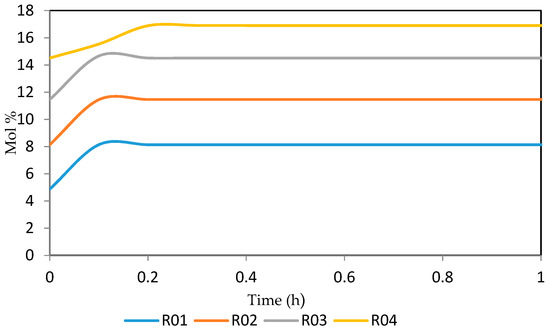
Figure 27.
Dynamic behaviour of A7 in the four reactors.
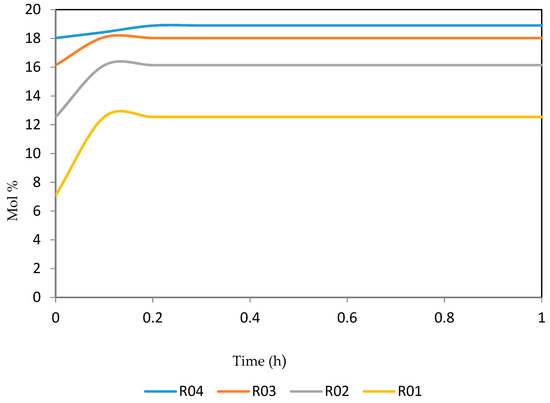
Figure 28.
Dynamic behaviour of A8 in the four reactors.
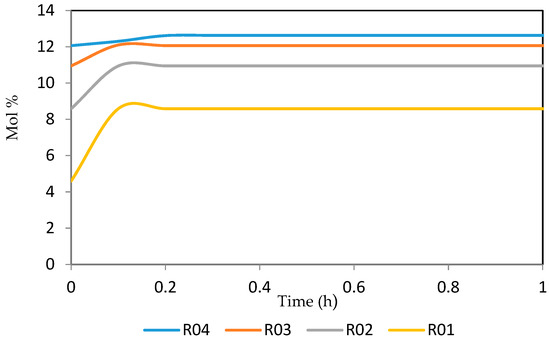
Figure 29.
Dynamic behaviour of A9 in the four reactors.
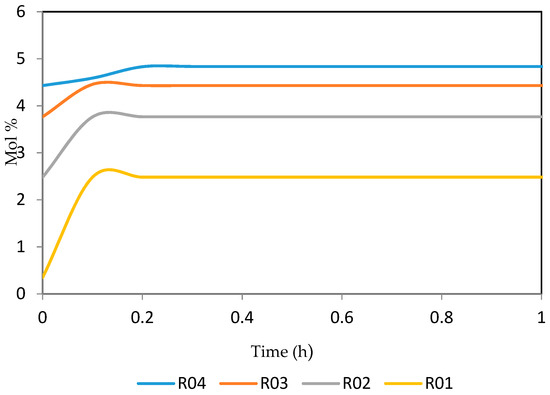
Figure 30.
Dynamic behaviour of A10 in the four reactors.
8. Conclusions
In this paper, the catalytic naphtha reforming process of Kaduna refining and petrochemical company, Kaduna were studied via steady state and dynamic modelling using gPROMs software. The basic model of the process is taken from the literature and was developed in gPROMs platform and was validated using literature data. Note, while [10] simulated one of four reactors (in series) this work simulated all 4 reactors dynamically. The validated model is then used for Kaduna refining to study the behaviour of the concentrations of the paraffins, naphthenes and aromatics components along the reactor height and, the temperature profile of the reactors. The simulated result from gPROMs was in good agreement with industrial plant data of KRPC. The sensitivity of the reaction to the research octane number (RON) was also presented with increase from the first to the fourth reactor due to increase in aromatization. The dynamic models in form of partial differential equations were also solved numerically on gPROMs software and the concentration and temperature profiles for the 25 components determined. The time to attain quasi steady state in the reactor was determined. It is observed that the first reactor reaches the quasi steady state fastest compared to the second, third and fourth reactors due to the type of the reactions in the four different reactors. The 3D representation of the dynamics has also been presented. gPROMs for the first time is used to model and simulate naphtha catalytic reforming reactions and was found to be suitable and robust.
Author Contributions
A.Z.Y. wrote the paper; B.O.A. reviewed the contributions of the paper; R.P. reviewed and corrected the English language and graphical qualities of the paper; I.M.M. analysed the data.
Funding
This research received no external funding.
Conflicts of Interest
The authors declared no conflict of interest.
Nomenclature
| Parameters from hydrogen reaction rate equation | |
| P | Paraffins |
| N | Naphthenes |
| Aromatics | |
| Constants for calculating heat capacities | |
| Constants for calculating Research octane Number (RON) | |
| Aromatics having 10 atoms of carbon | |
| Naphthenes having 10 atoms of carbon | |
| Paraffins having 10 atoms of carbon | |
| Heat capacity (KJ/kmol k) | |
| Particle diameter (m) | |
| Activation energy (KJ/kmol) | |
| Molar flow (Kmol/h) | |
| Force to mass conversion factor, 9.8066 ( m)/() | |
| Mass velocity (kg/m2 h) | |
| Reaction standard Gibbs energy (KJ/kmol k) | |
| Heat of reaction (KJ/kmol k) | |
| Kinetic constant at T (Kmol/h) | |
| Kinetic constant at T (Kmol/h) | |
| Equilibrium constant | |
| Weight hourly space velocity (h−1) | |
| Molecular weight (g/gmol) | |
| Reaction order | |
| N | Number of reactions naphthenes |
| Number of components | |
| Pi | Partial pressure of component i (Pa) |
| Pressure (Pa) | |
| Standard base pressure (Pa) | |
| Rate of reaction of component i (Kmol/h) | |
| Universal constant of gases (KJ/mol k) | |
| Cross sectional area (m2) | |
| Space-velocity (h−1) | |
| Reaction temperature (K) | |
| Base reaction temperature (K) | |
| Molar composition of component i (mol %) | |
| Reactor Height (m) | |
| SG | Specific Gravity |
| IBP | Initial Boiling Point (°C) |
| EBP | Final Boiling Point (°C) |
| RVP | Reid Vapor Pressure (Bar) |
| PPM | Parts Per Million |
| MBPD | Million Barrels Per Stream Day |
| Space velocity |
Greek Letters
| Void fraction of catalyst bed | |
| Density of gas mixture | |
| Density of catalyst | |
| Viscosity of gas mixture |
References
- Fawzi, M.E. Catalytic Naphtha Reforming; Challenges for Selective Gasoline an Overview and Optimization Case Study. J. Adv. Catal. Sci. Technol. 2016, 3, 27–42. [Google Scholar]
- George, J.A.; Abdullah, M.A. Catalytic Naphtha Reforming, 2nd ed.; Marcel Dekker, Inc.: New York, NY, USA, 2004. [Google Scholar]
- George, A. Modelling and Simulation of Catalytic Reactors for Petroleum Refining; John Wiley & Sons, Inc.: Hoboken, NJ, USA, 2011. [Google Scholar]
- Hu, Y.; Su, H.; Chu, J. Modeling, Simulation and Optimization of Commercial Naphtha Catalytic Reforming Process. In Proceedings of the 2003 42nd IEEE Conference on Decision and Control, Maui, HI, USA, 9–12 December 2003; pp. 6206–6211. [Google Scholar]
- Stijepovic, M.Z.; Linke, P.; Kijevcanin, M. Optimization approach for continuous catalytic regenerative reformer processes. Energy Fuels 2010, 24, 1908–1916. [Google Scholar] [CrossRef]
- Mohaddecy, R.S.; Sadighi, S.; Bahmani, M. Optimisation of Catalyst Distribution in the Catalytic Naphtha Reforming of Tehran Refinery. Pet. Coal 2008, 50, 60–68. [Google Scholar]
- Arani, H.M.; Shokri, S.; Shirvani, M. Dynamic Modeling and Simulation of Catalytic Naphtha Reforming. Int. J. Chem. Eng. Appl. 2010, 1, 159–164. [Google Scholar] [CrossRef]
- Gyngazova, M.S.; Kravtsov, A.V.; Ivanchina, E.D.; Korolenko, M.V.; Chekantsev, N.V. Reactor modelling and simulation of moving-bed catalytic reforming process. Chem. Eng. J. 2011, 176–177, 134–143. [Google Scholar] [CrossRef]
- Iranshahi, D.; Rahimpour, M.R.; Asgari, A. A novel dynamic radial-flow, spherical-bed reactor concept for naphtha reforming in the presence of catalyst deactivation. Int. J. Hydrogen Energy 2010, 35, 6261–6275. [Google Scholar] [CrossRef]
- Elizalde, I.; Ancheyta, J. Dynamic modelling and simulation of a naphtha catalytic reforming reactor. Appl. Math. Model. 2015, 39, 764–775. [Google Scholar] [CrossRef]
- Ancheyta, J.; Villafuerte-Marclas, E.; Diaz-Garcia, L. Modelling and Simulation of four catalytic reactors in series for Naphtha Reforming. Energy Fuels 2001, 15, 887–893. [Google Scholar] [CrossRef]
- Rodríguez, M.A.; Ancheyta, J. Detailed description of kinetic and reactor modelling for naphtha catalytic reforming. Fuel 2011, 90, 3492–3508. [Google Scholar] [CrossRef]
- Unmesh, T.; James, B.R. Modeling and Optimization of a Semi regenerative Catalytic Naphtha Reformer. AIChE J. 1997, 43, 740–753. [Google Scholar] [CrossRef]
- Pieck, C.L.; Vera, C.R.; Parea, J.M.; Gimenez, G.N.; Sera, L.R.; Carvalho, L.S. Metal dispersion and catalytic activity of trimetallic Pt-Re-Sn/Al2O3 naphtha reforming catalysts. Catal. Today 2005, 107–108, 637–642. [Google Scholar] [CrossRef]
- Axens. RG Series Catalyst Handbook Catalytic Reforming Catalyst; A.I.G. Technologies, Inc.: Paris, France, 2004. [Google Scholar]
- Riazi, M. Characterization and Properties of Petroleum Fractions, 1st ed.; International Standards (ASTM): Philadephia, PA, USA, 2005. [Google Scholar]


© 2019 by the authors. Licensee MDPI, Basel, Switzerland. This article is an open access article distributed under the terms and conditions of the Creative Commons Attribution (CC BY) license (http://creativecommons.org/licenses/by/4.0/).