Abstract
A new direction of the 4th industrial revolution in manufacturing and IT industries is presented in this study, wherein the manufacturing sector will be able to survive in this period by achieving rapid and flexible change through effective convergence between both industries. Under such an environment, manufacturing IT requires speedy development and a new distribution form, as well as a new method of IT project development which is adequate for that form. Thus, this study compares and analyzes the waterfall method which is being used in general manufacturing System Integration (SI) projects and the proposed DevOps method, which requires faster distribution and improvement. This study confirms that the required human resources are less than the existing SI projects when system improvement is made using the DevOps method. At the same time, this method provides much-improved quality for the same price. Therefore, future manufacturing IT projects would achieve a faster and more efficient development and operation form by adopting the DevOps method to perform continuous and repetitive improvement and operation through the convergence of manufacturing and IT. Also, some of the current smart factory models can be found in several ICT (Information & Communication Technology) advanced countries, and they have actually increased the efficiency in their factories and generated much value-added business. As with the production facilities, materials, and methods, human resource management occupies an important role in the smart factory system to increase efficiency. This study aims to validate such logic by proving the effectiveness of a Bluetooth beacon-based worker positioning system by which workers’ safety can be secured along with the security of the factory itself. This system can be foundational to establishing a safer working environment by controlling accesses to the critical production facilities and determining their whereabouts in case of an accident.
1. Introduction
The 4th industrial revolution refers to the establishment of a flexible and efficient production system through the convergence of the manufacturing system and ICT (Information & Communication Technology). For instance, Germany has started the Industry 4.0 project to strengthen their manufacturing industry, while the US is operating and actively investing in a smart factory research and development consortium. Also, influenced by Germany’s Industry 4.0 project, China’s Ministry of Industry and Information Technology has launched ‘The Year 2025 Chinese Manufacturing Strategy’ to prepare for the new industrial revolution by intensively fostering ten sectors and partially promoting an additional four sectors. Meanwhile, the government of the Republic of Korea (ROK) is also constructing a special program for the innovation of the small and medium manufacturing industry, aiming to construct 10,000 smart factories by 2020. Due to the rapid changes in the manufacturing industry, the ICT central to the 4th Industrial Revolution must quickly respond to various types of customer demands and changes in the manufacturing process to apply improvements to new systems [1,2].
Such rapid distribution and application sometimes leads to the success of a firm. One of the most notable companies in China, Xiaomi, is creating a successful image for their company by updating their software every week. To consistently improve the company’s IT system every week, the development process, architecture, and quality control must work in complete harmony, and rapid response to customer requirements is essential. However, since conventional manufacturing projects use traditional waterfall models, it is difficult to respond to new improvement requirements quickly, as these systems must gradually reflect these changes following the existing procedures. Thus, this study compares a typical manufacturing IT project with a DevOps (Development and Operation) manufacturing IT project, which requires rapid distribution and improvement to determine how the latter affects manufacturing IT in the 4th industrial revolution.
DevOps is one of the software development methods which seeks smooth communication and cooperation between the software developer and the operator. Under the big picture painted by the smart factory and Industry 4.0, manufacturing IT has converged with IT to rapidly respond to the changes and produce a variety of products. As such, manufacturing IT is also required to respond quickly by strengthening cooperation and the development process.
This study attempts to study the influence of the DevOps project on the existing System Integration (SI) project in manufacturing IT under the environment created by smart factory and Industry 4.0.
This study also responds to recent safety concerns in manufacturing facilities. Seven workers working at a city in the ROK were injured recently, and the company was accused of inexcusable negligence as another fatal workplace injury was reported two weeks prior to this incident. Overseas, thousands of Indians died overnight due to a chemical plant accident (1984) which was one of the worst chemical spills in history. Another chemical plant accident occurred in China not many years ago injuring many workers and residents in the area. Such accidents in chemical plants are happening almost every year around the world as these facilities are becoming larger and larger due to technological developments which allow them to store and process a huge volume of hazardous chemicals. This study proposes a reliable accident-prevention system in which Industry 4.0-oriented Bluetooth beacons are used to locate factory workers and increase the security level of the plant.
2. Related Research
2.1. Understanding the 4th Industrial Revolution and Smart Factory
Currently, Germany is the leader in the global manufacturing sector in terms of competitiveness. German manufacturing exhibits a high Gross Value Added (GVA) and occupies 35% of the direct/indirect employment rate, playing a vital role in their national economy. Nevertheless, they are losing their competitiveness gradually due to the strengthened manufacturing strategies from the US and Japan. Table 1 shows a comparison of the counterplans for the 4th Industrial Revolution by major industrial nations.

Table 1.
Comparison of counterplans for the 4th Industrial Revolution by major industrial nations.
They are also facing the problem of labor productivity due to changes in the population structure and issues pertaining to the efficiency and use of existing resources. To deal with the domestic and foreign challenges, they are pushing ahead with a new strategy to heighten their future competitiveness and adapt to the 4th Industrial Revolution.
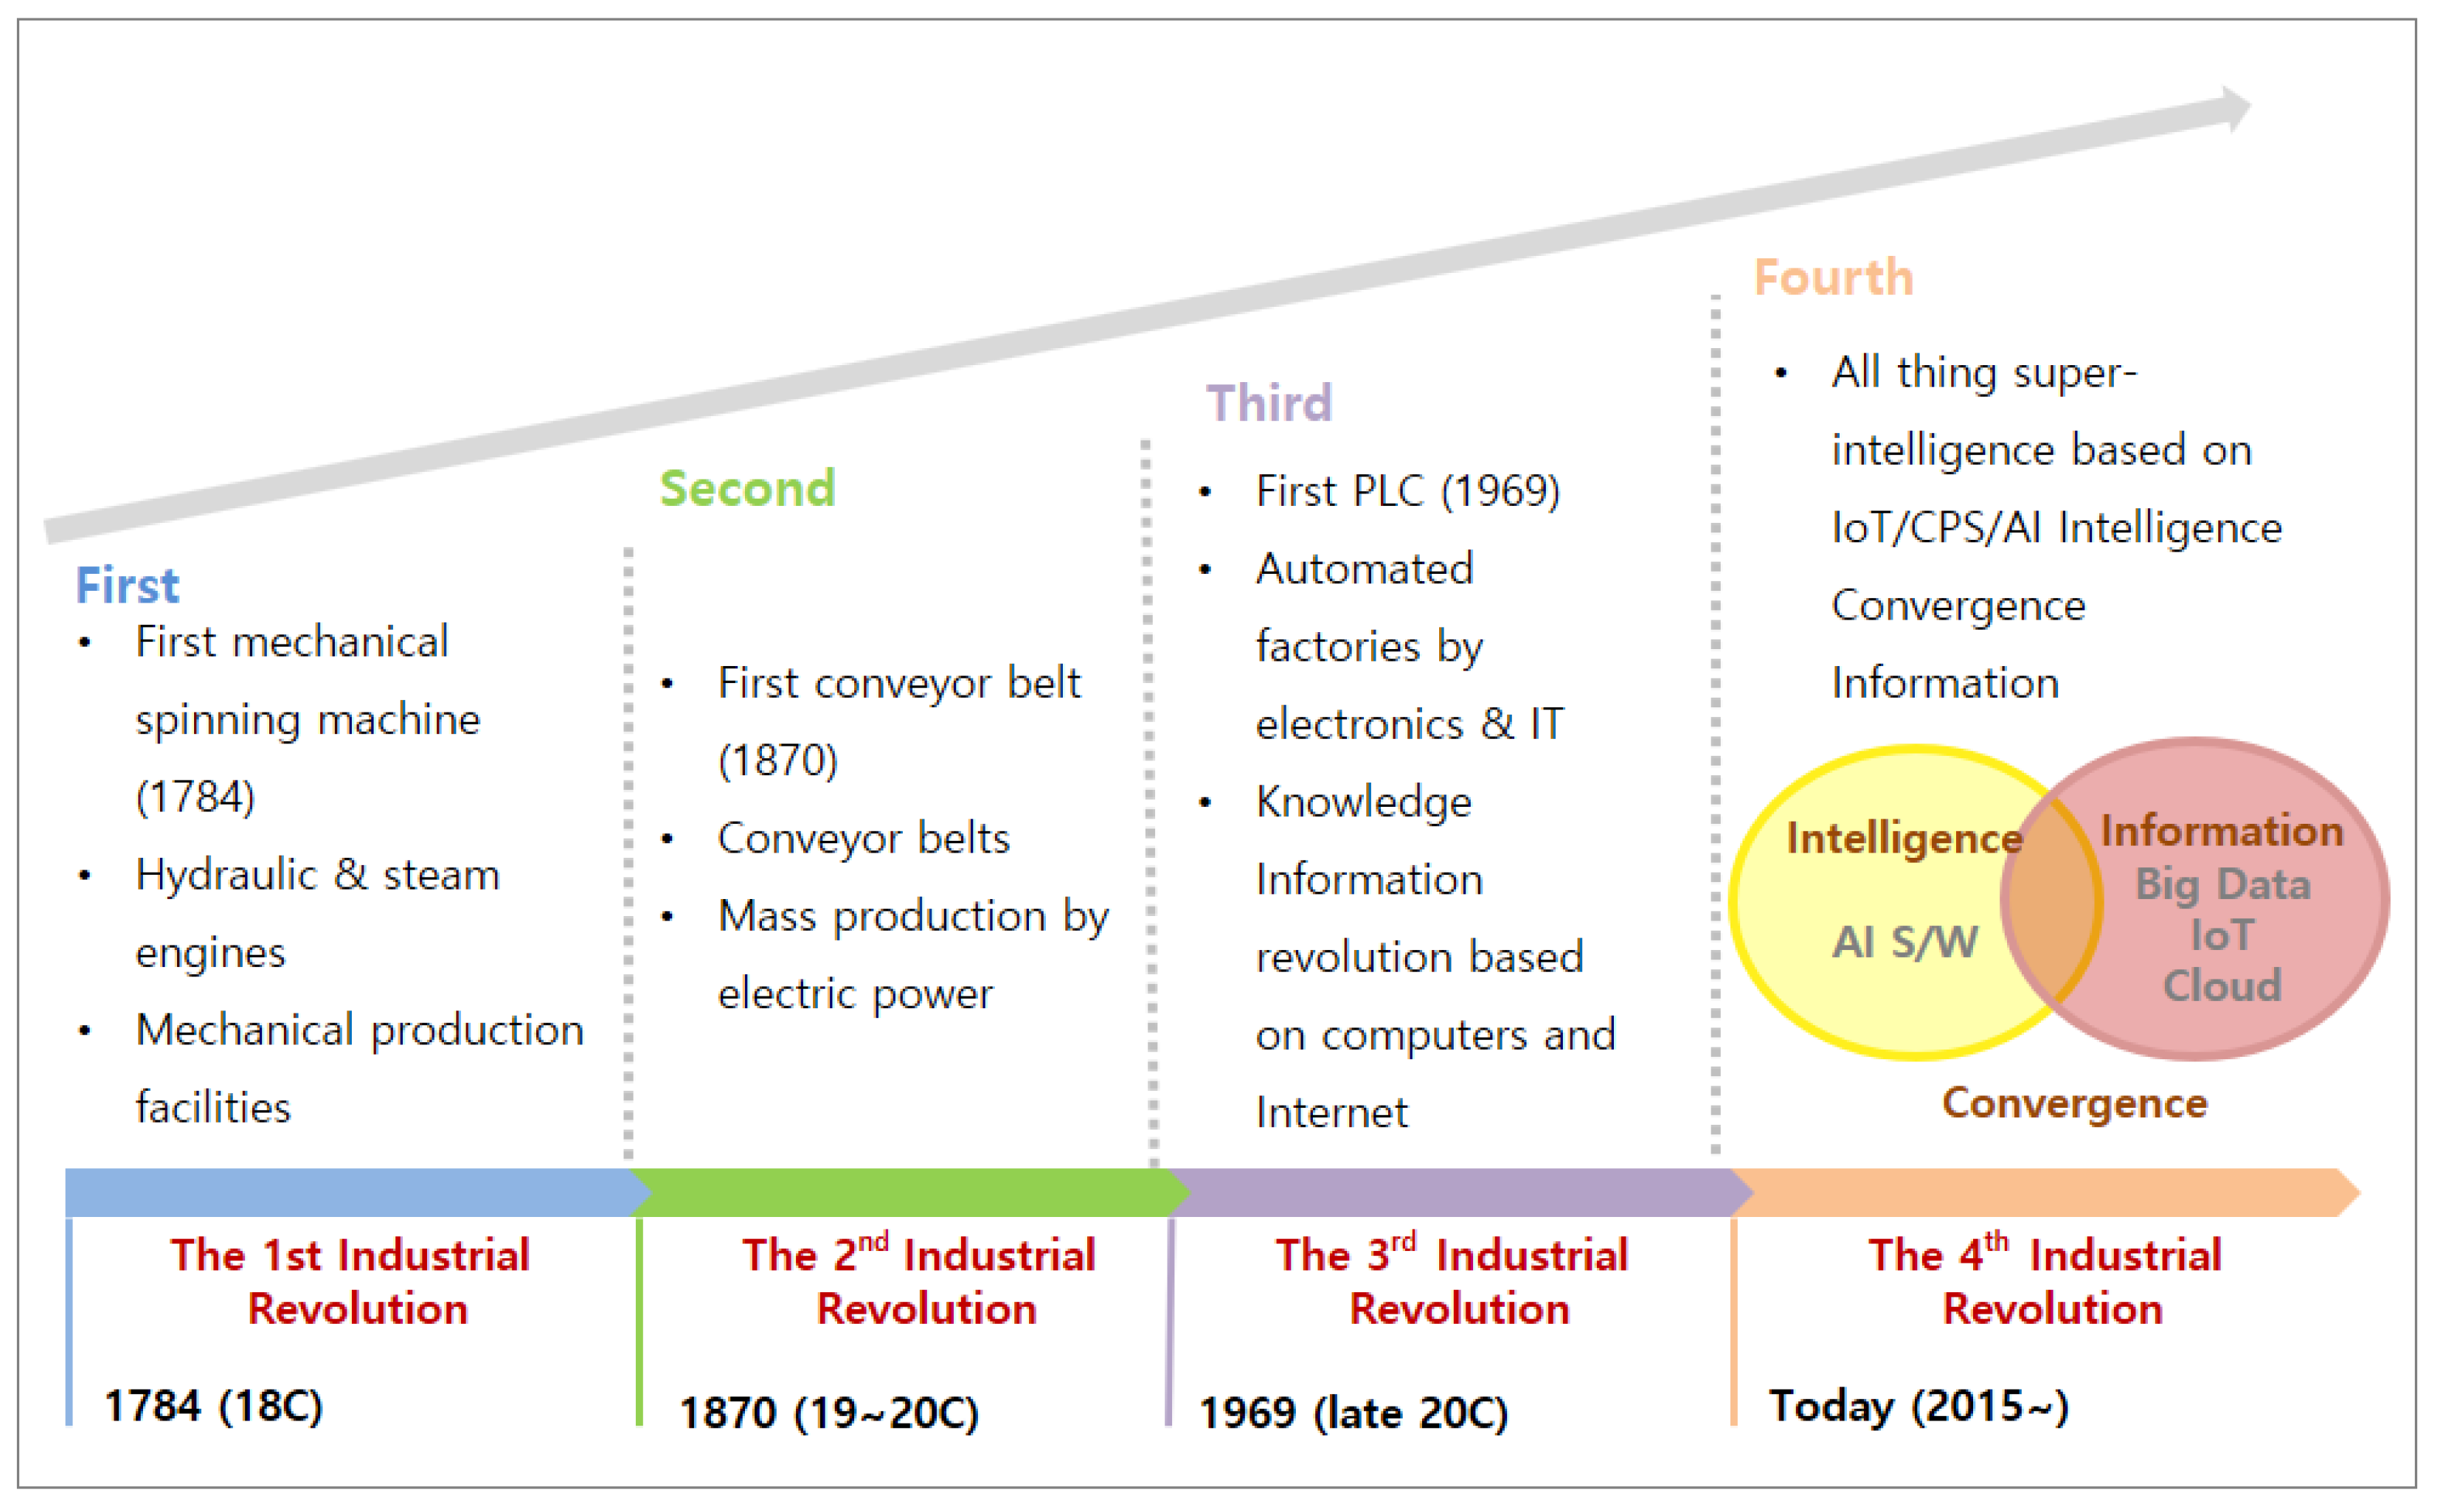
The 4th Industrial Revolution refers to a new form of the industrial revolution through the intellectualization of systems based on big data and AI (Artificial Intelligence). As shown in Figure 1, the 1st Industrial Revolution was a starting point of machine-based production systems such as hydraulic or steam-powered manufacturing systems. The 2nd Industrial Revolution led to a mass-production system using conveyor belts and electric power, while the 3rd Industrial Revolution resulted in factory automation based on electronics and IT. The 4th Industrial Revolution further added advanced ICT technologies to such a factory automation system.
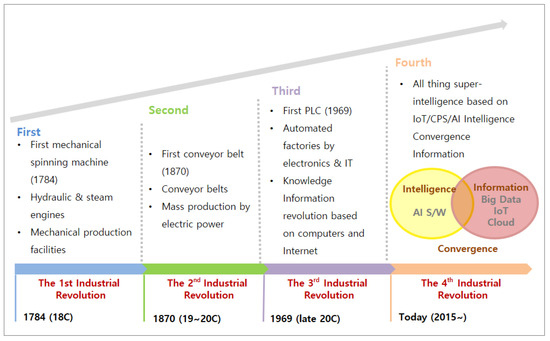
Figure 1.
Phased changes of industrial revolutions.
In the 4th Industrial Revolution, machines and the products have some sort of intellect and data is shared through networks. This brings a new paradigm between consumers and suppliers.
Also, the 4th Industrial Revolution changes the existing mass-production method to achieve customized small-quantity production with which production and delivery can be processed flexibly and rapidly. To meet the requirements of the 4th Industrial Revolution, it is necessary to estimate accurate market demands and customer orders by using IT systems, perform smart production based on an automated system, and establish an AI-based production system which can deliver goods to the places where there is a shortage in stock promptly and efficiently. In particular, it is important that a smart production system should establish a rapid supply system to optimize the efficiency of resources such as production materials. As such, the manufacturers in the 4th Industrial Revolution must respond to changes quickly and accurately. To this end, relevant IT systems should be continuously developed.
During the last four decades, the US’s position in the global manufacturing industry has weakened drastically, and the amount the manufacturing business in the US has been declining continuously. Under these circumstances, the US government has made a plan to maintain more than 20% of their GDP (Gross Domestic Product) with the manufacturing business, and by studying Germany’s policies focusing on the manufacturing sector (Industry 4.0) which have achieved more than 3.7% economic growth, they have prioritized job creation and economic recovery. Accordingly, a national innovation network involving 15 manufacturing innovation institutions is well underway. Additionally, a strategic plan for the national high-tech manufacturing industry has been established by the NSTC (National Science and Technology Council) along with the SMLC (Smart Manufacturing Leadership Coalition), who is to conduct research on the manufacturing industry at a national level.
The SMLC’s main objective is to establish a new concept of smart manufacturing while setting specific development directions, technology objects, role sharing models, and roadmaps for implementation. Rapid manufacturing and active response to production demands and supply, as well as the intensified application of cutting-edge AI which allows real-time distribution efficiency are key to the SMLC.
At the core of the smart manufacturing industry, there are Smart Factory and the smart manufacturing platform. This concept is similar to Germany’s concept of Industry 4.0. Smart Factory refers to data-analytical factory automation which maximizes energy efficiency through analysis of a large volume of data by grafting ICT technology onto the production process. Such a smart factory quickly analyzes the relevant data in the entire process from product planning/designing to distribution/sales to reduce production costs and flexibly respond to the rapidly changing market, ultimately strengthening competitiveness in manufacturing.
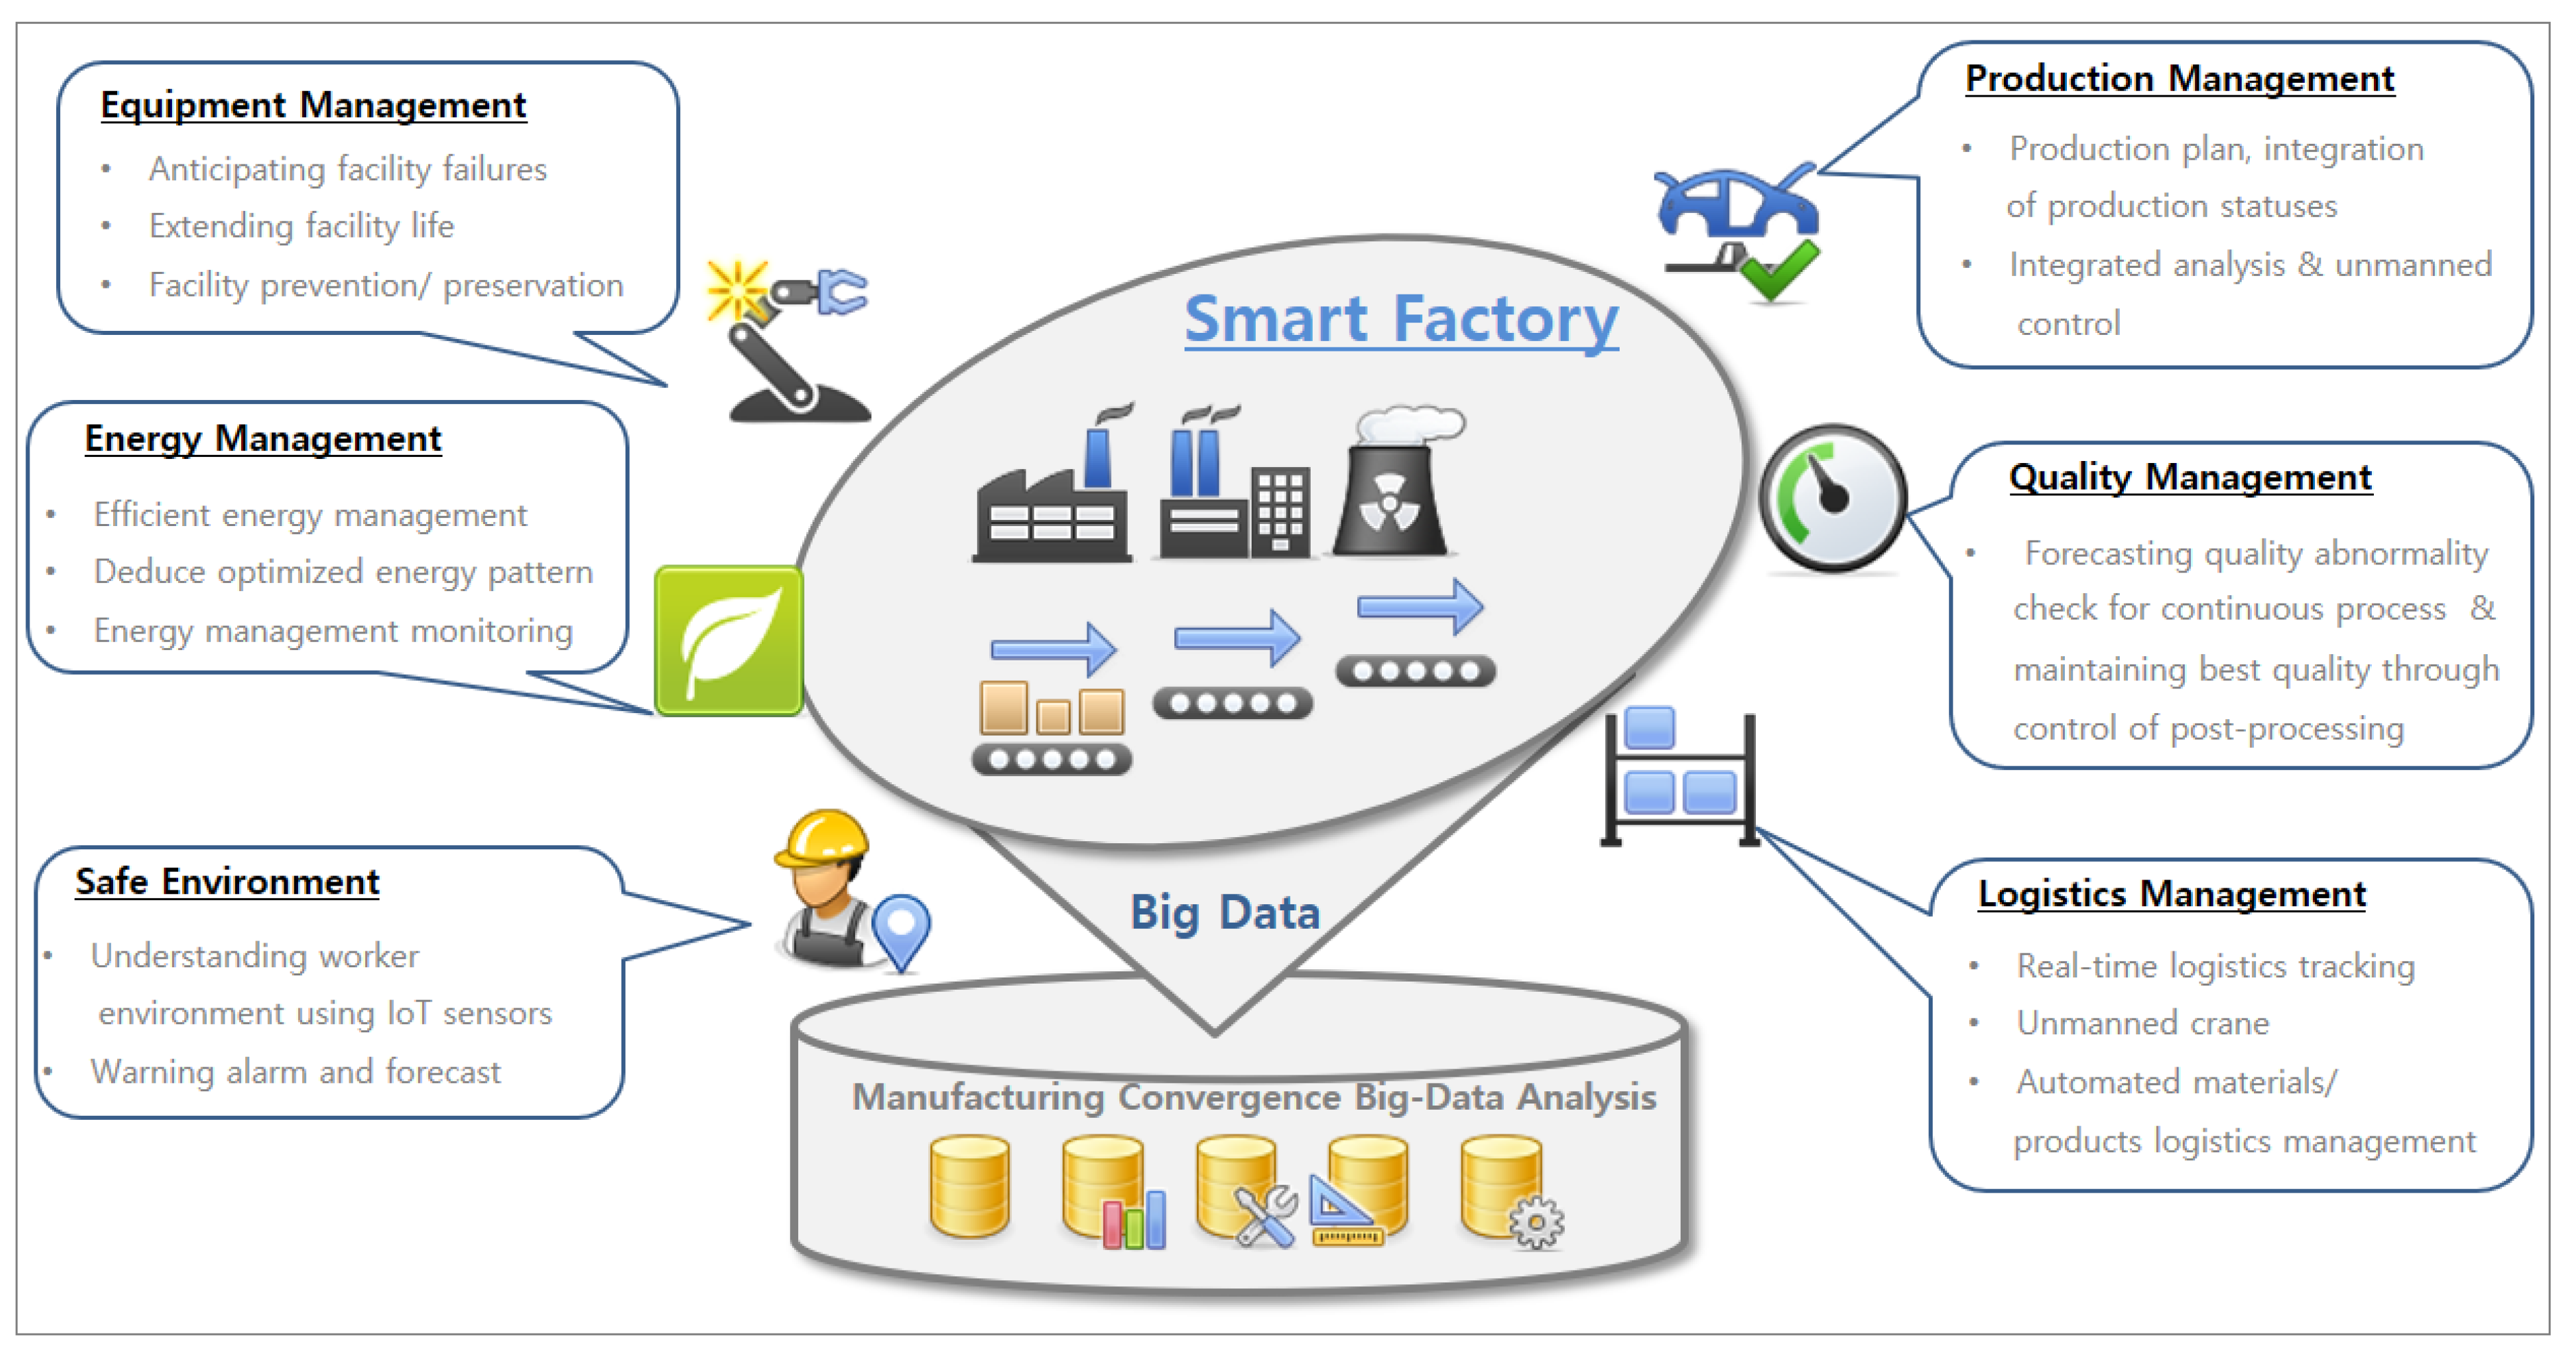
Figure 2 presents the configuration of an ICT-based smart factory where the entire operation/management process involving facilities, energy, safety production, quality, and distribution is carried out by adopting ICT technology. The productivity and quality can be expected to be improved through the production and quality forecast based on analysis of the data collected.
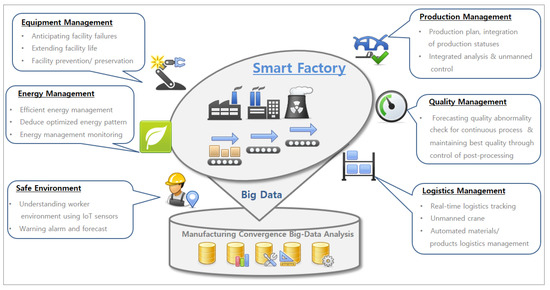
Figure 2.
The configuration of an ICT-based smart factory.
2.2. Current State of Manufacturing IT
Robust and automated manufacturing IT systems are being gradually integrated and linked to an external internet, physically converging the real world with the virtual world.
The crux of Germany’s Industry 4.0 and the US’s smart manufacturing system is to implement smart factories. To achieve this, it is necessary to develop a management platform that can control the manufacturing process with which optimal products will be produced. The CPS (Cyber Physical System) is being introduced to both systems. The CPS is a manufacturing system designed to store all the production information in their IT systems by utilizing IoT (Internet of Things) in the production system to achieve optimized manufacturing and efficiency. The CPS consists of IoT, process sensors, automated warehouses, and a production facility, all of which provide an integrated function based on the ICT technology for early distribution, production, marketing, shipment, and service.
The CPS supports the smart production performed with the Internet, sensors, and IT technology and exchanges all the information necessary for the production. As the manufacturing process is controlled by the IT system, the production process can be optimized as well. Also, in a CPS, elements such as facility, process, production line, and factory are interlinked such that customers and companies with their own supply chains can be linked together. To construct such a CPS for manufacturing IT, the IT personnel responsible for constructing the production system should have highly developed IT skills along with expert knowledge in the manufacturing process to construct a stable system rapidly.
2.3. The Concept of Project
According to PMBOK 5th (2013), which is a project management standard established by the US’s PMI (Project Management Institute), ‘Project’ is an effort transiently (temporarily) made to create a unique service, product or output and the characteristic of being ‘temporary’ means that there is a beginning and an end to the project. However, the fact that it is temporary does not necessarily mean that the project is short-term, but rather it implies participation and continuity within the project contract period (PMI, 2013). Also, the UK’s APM (Association of Project Management) defines that ‘Project’ as a plan or a business to accomplish a particular profit or a goal.
The characteristics of a project defined by the PMI are as follows. First, a project has the characteristic of temporariness which means that it has a defined beginning and end. Second, it has uniqueness, which means that there are differences in the final output when compared with another similar project. Third, a project is elaborated progressively. ‘Progress Elaboration’ implies that a project is planned or defined within an early broad spectrum, but it is progressively changed and elaborated over time.
Then, what is the major difference between ‘Operation’ and ‘project’? The latter refers to a temporary (transient) performance which has a goal that fits the nature of the project, while the former refers to the continuous performance of a serialized set of activities in which continuous service is provided. In other words, a project can be temporary or transient, but an operation often involves repetitive and continuous activities. As shown in Table 2, there are various opinions on the definition of ‘Project’.
Table 2.
The Definitions of Project.
There are differences in the definition depending on each researcher. Nevertheless, it is their common opinion that a project is an activity with a distinct and unique purpose and it is not a regular task (operation) but a temporary operation.
2.4. The Concept of Project Management
‘Project Management’ is a task to successfully perform a project by managing it more effectively during the project contract period starting from the point of project planning to the time of completion. Project management includes the entire process of scheduling, risk management, cost management, and resource management. Project management in terms of IT project management can be defined as “A series of activities for the operation that supports an efficient performance of the task within the limit of project requirements, required resources, stakeholders, and given time.” (Lee, Ah-Yeon, 2013). Meanwhile, the PMI’s PMBOK defined project management as a process that applies knowledge, techniques, and technologies to the project to satisfy the project requirements such that satisfying these requirements is an activity to meet the requirements of stakeholders.
Various opinions about project management have been developed over time by different researchers. Table 3 summarizes them, specifically around the year 2000.
Table 3.
Project management.
Comparing the definitions of project management from before and after 2000, the former defined project management as a series of activities to achieve a project objective according to a plan on the basis of a specific schedule, scope, and cost, whereas the latter defined it as a series of activities to systematically plan and implement a plan within the scope of management to achieve the project objective [3].
2.5. The Measuring Elements of Project Performance
Indeed, it is not easy to accurately measure the performance level of a project, as the characteristics and the scale of projects have been changing rapidly since the 2000s. Nevertheless, research into project performance measurement has been continuously carried out as follows.
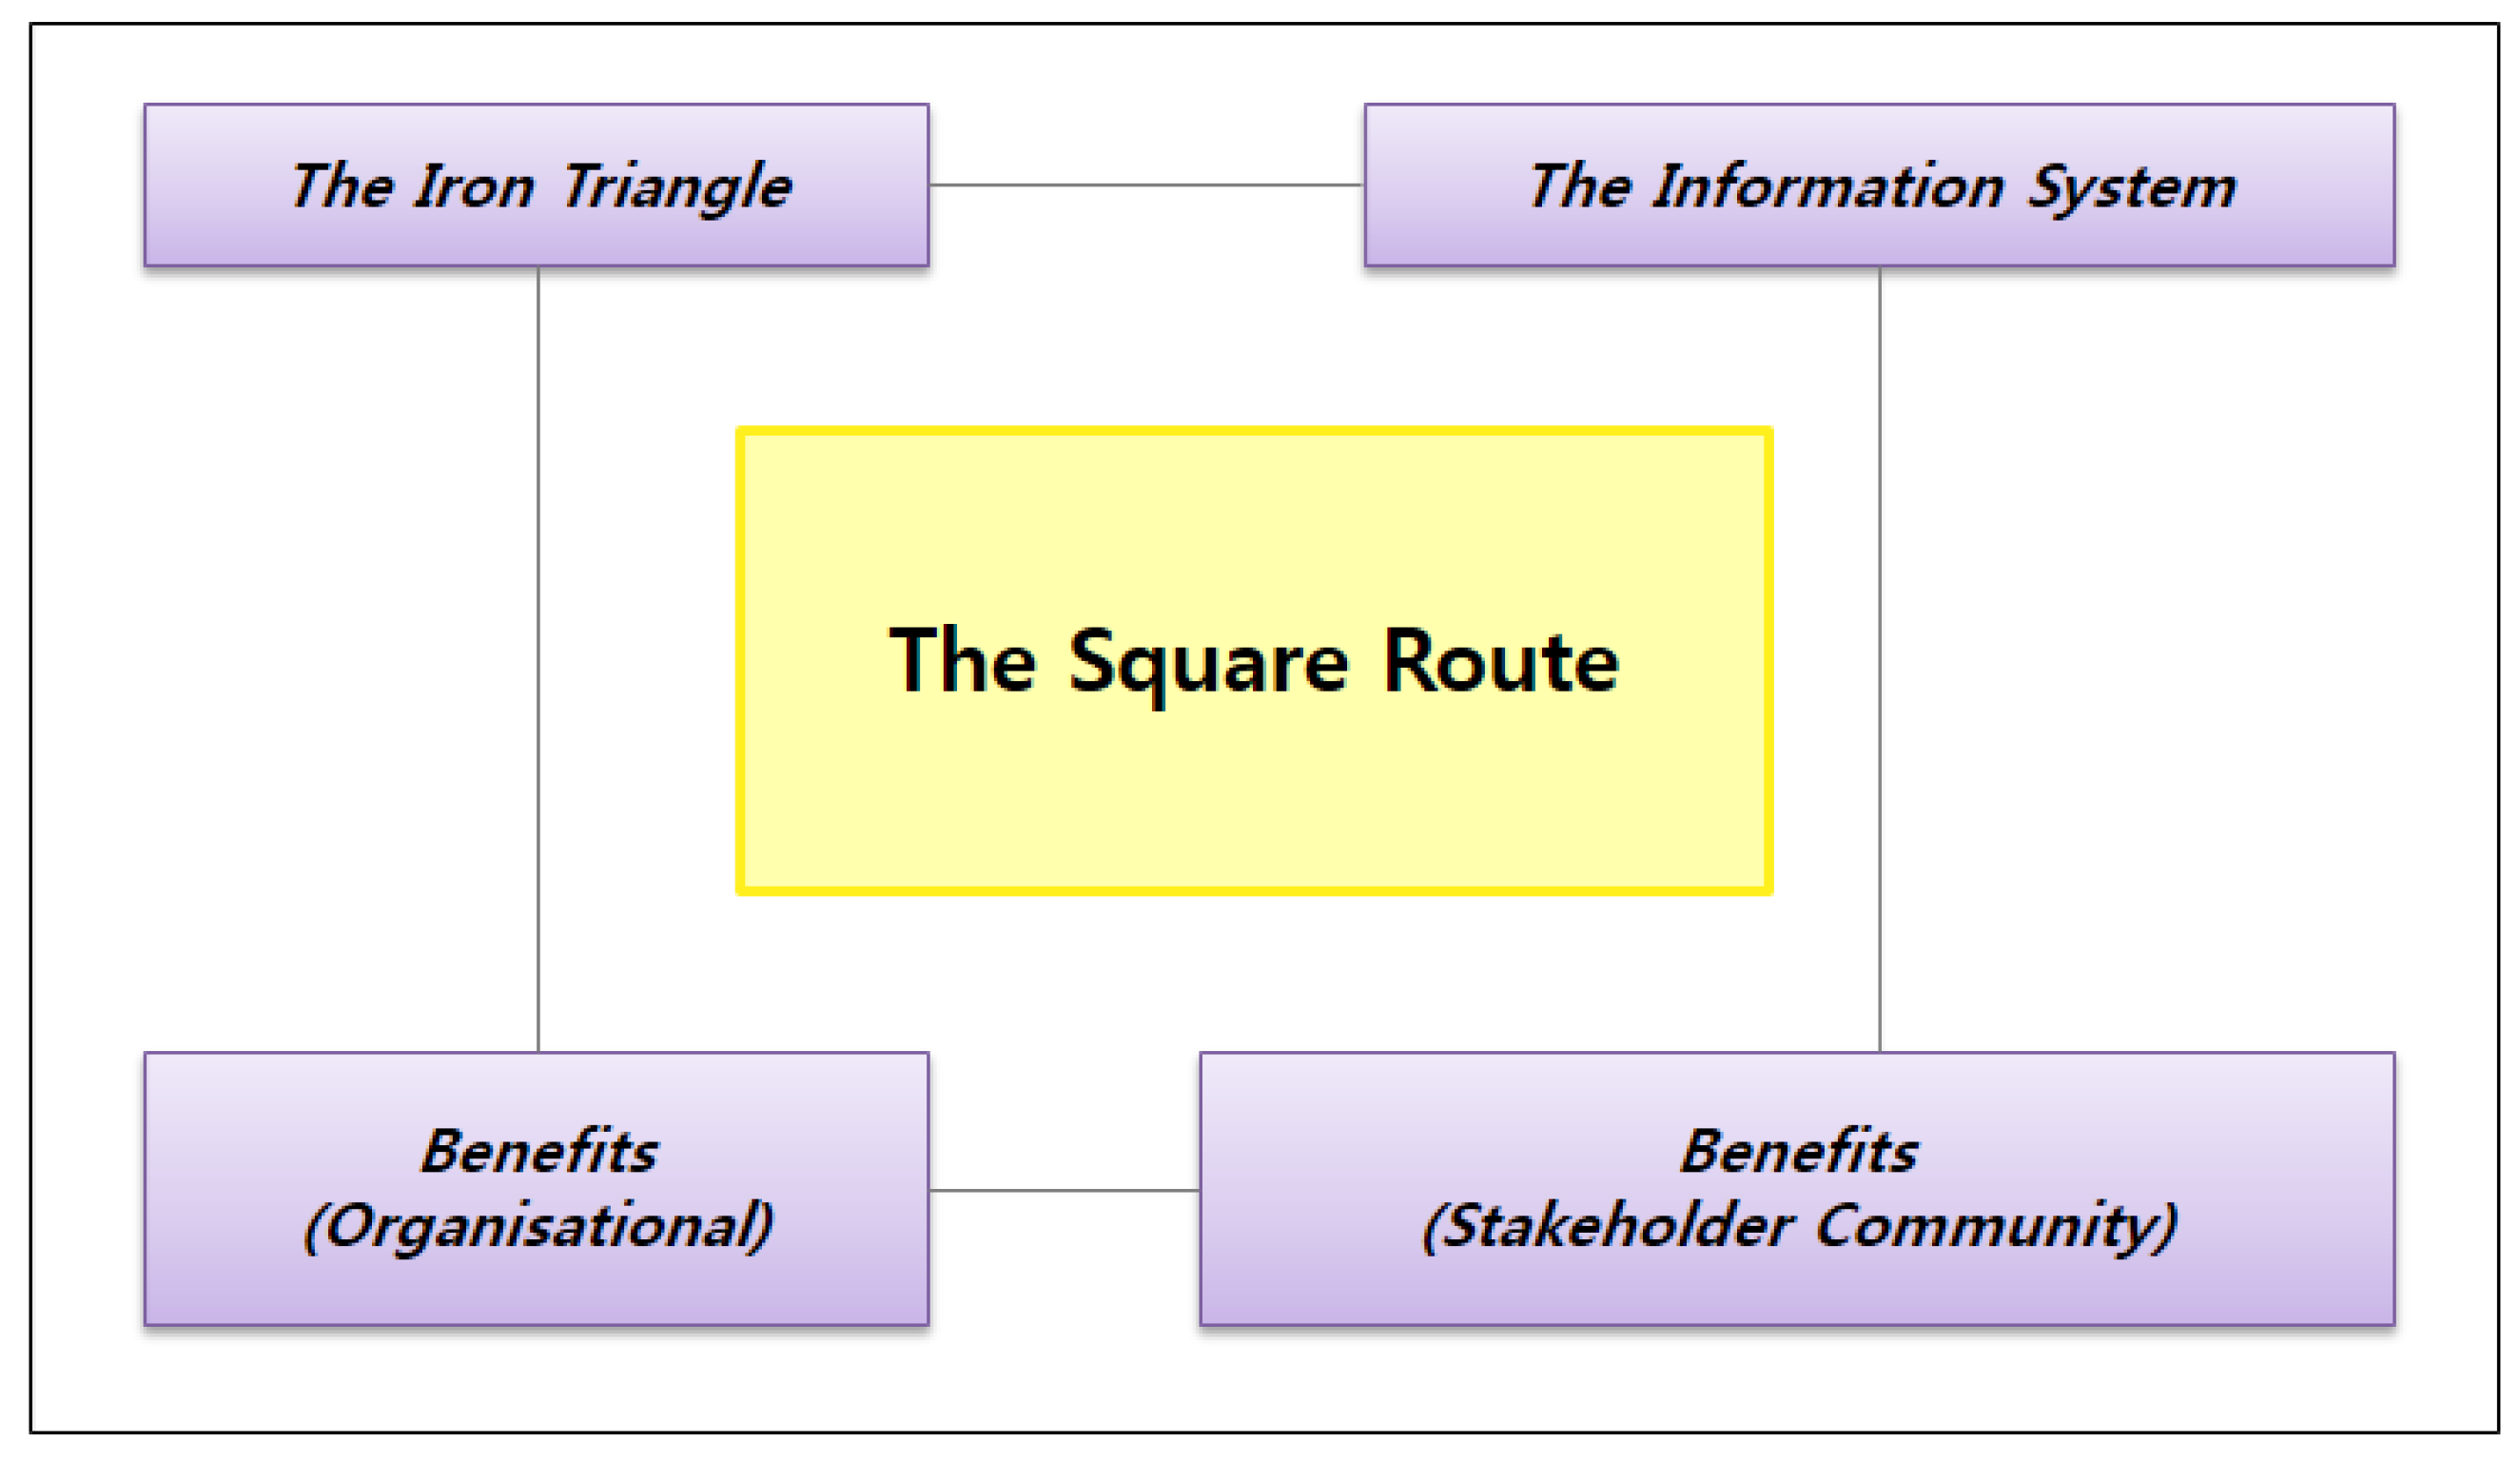
Atkinson represented IT project performance with a square route. As shown in Figure 3, his square route distinguished the conventional project performance measuring elements (i.e., time, quality, and cost) from the quality and performance of the information system, the performance of the stockholders involved in the project, and the performance of the IT system user. In particular, he defined the time, quality, and cost as an Iron Triangle to indicate it as the most important element of the square route.
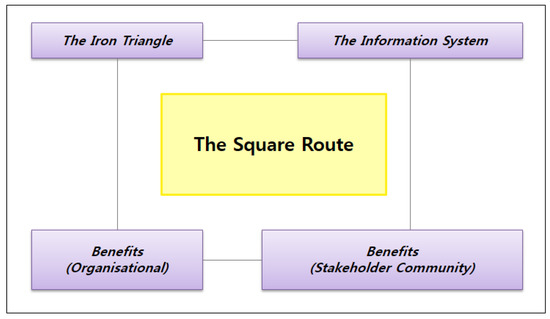
Figure 3.
The Square Route of Atkinson.
O. Zwikaek and S. Globerson (2004) carried out a performance evaluation for the domain of project planning knowledge. The measuring elements of project success included schedule overrun, cost overrun, customer satisfaction, technical performance, and subjective assessment by the project manager.
Baccarini categorized IT project performance as project management performance and project output performance. The former put the emphasis on the project process while measuring the level of achievement in the targeted quality, time, and cost, focusing on how effectively and adequately the project management procedure has been performed. On the other hand, the performance of the project output focused on the effectiveness of the system (final output) constructed by the project (Baccarini, 1999) [4,5].
Meanwhile, H.Y. Yoon (2010) maintained that the performance measurement of an SI project was determined by three key project elements: time, and cost. Interpreting this from a wider perspective, the time is the schedule, the cost is the budget or the prime cost, and the scope is the function or the quality. In this regard, a successful project would refer to a project that has met the planned time, scope, and cost upon completion and therefore gained customer satisfaction and acceptance [5].
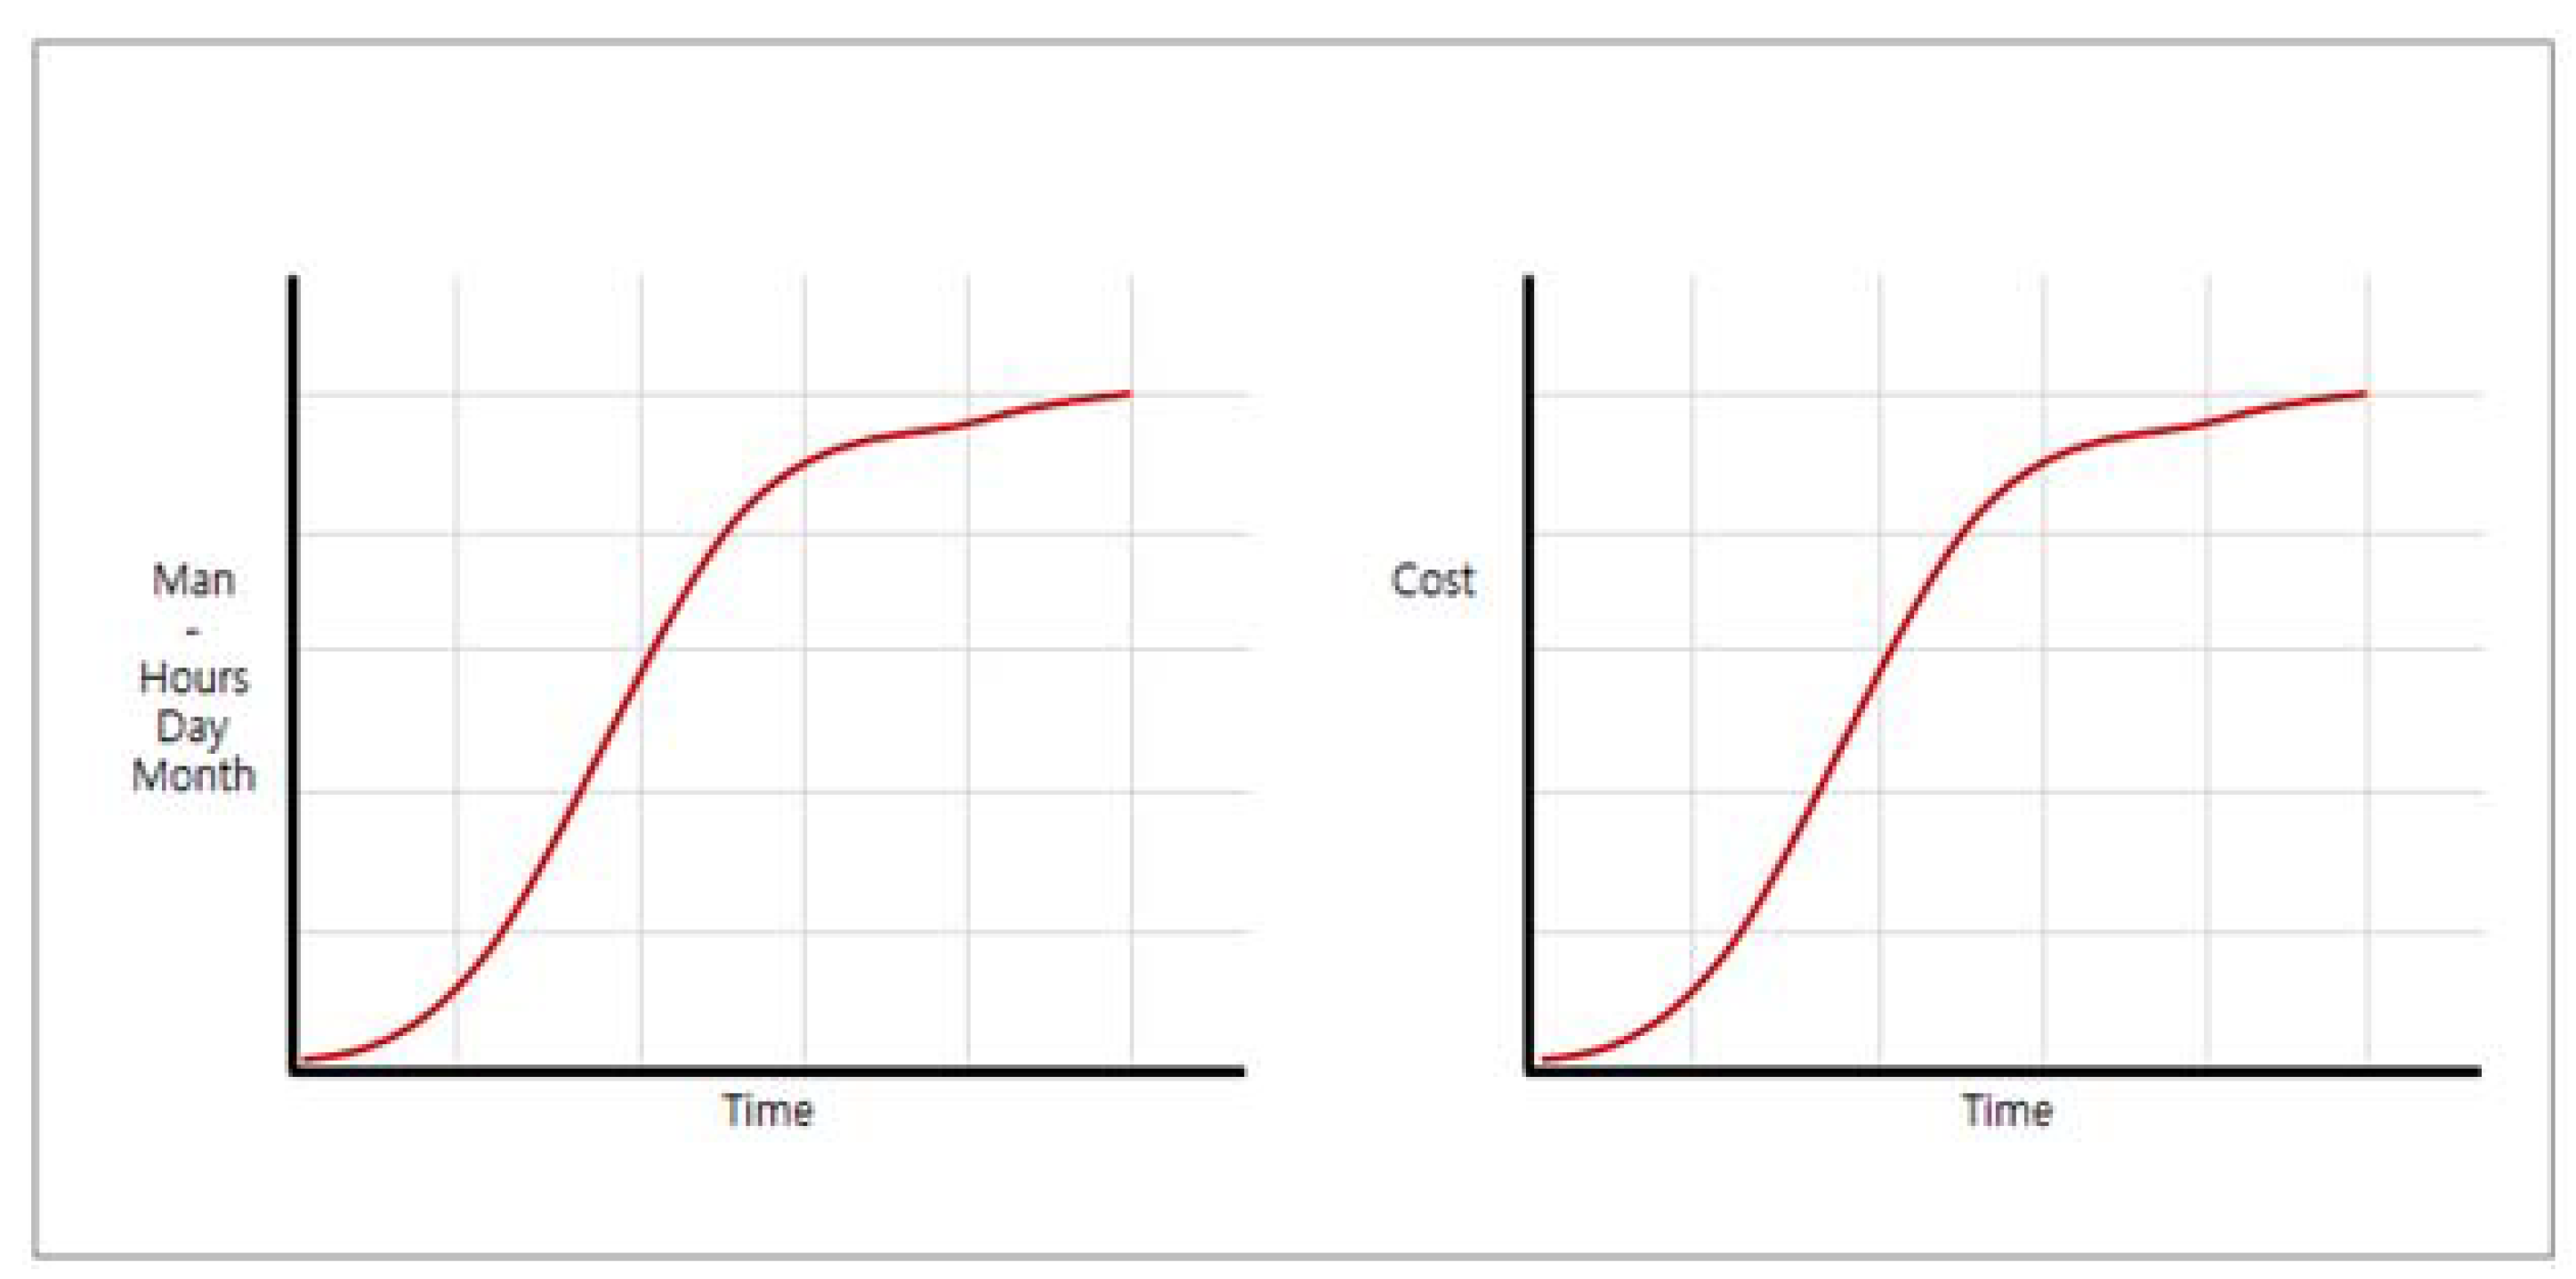
2.6. The Study on S-Curve and P-Value
According to Wideman Comparative Glossary of Project Management Terms, an S-curve refers to a time-based cumulative sum of person-hours or other quantitative aspects. The term S-curve originates from a curve where the slopes are gradual at the beginning and the end and straight in the middle (Wideman, 2002). An S-curve is represented with a 2-dimensional graph (x, y). The x-axis indicates the elapsed time and the y-axis represents the quantitative value. In project management, person-hour/day/month or cost are represented. At this time, the values on the y-axis can be changed into an absolute value or a status value. Figure 4 shows a type of S-curve.
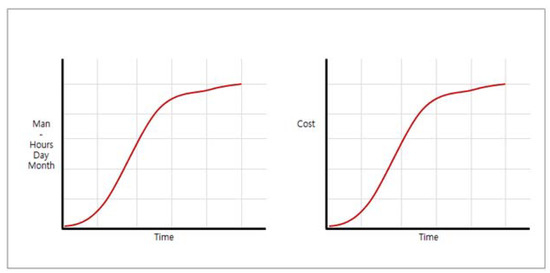
Figure 4.
A type of S-curve.
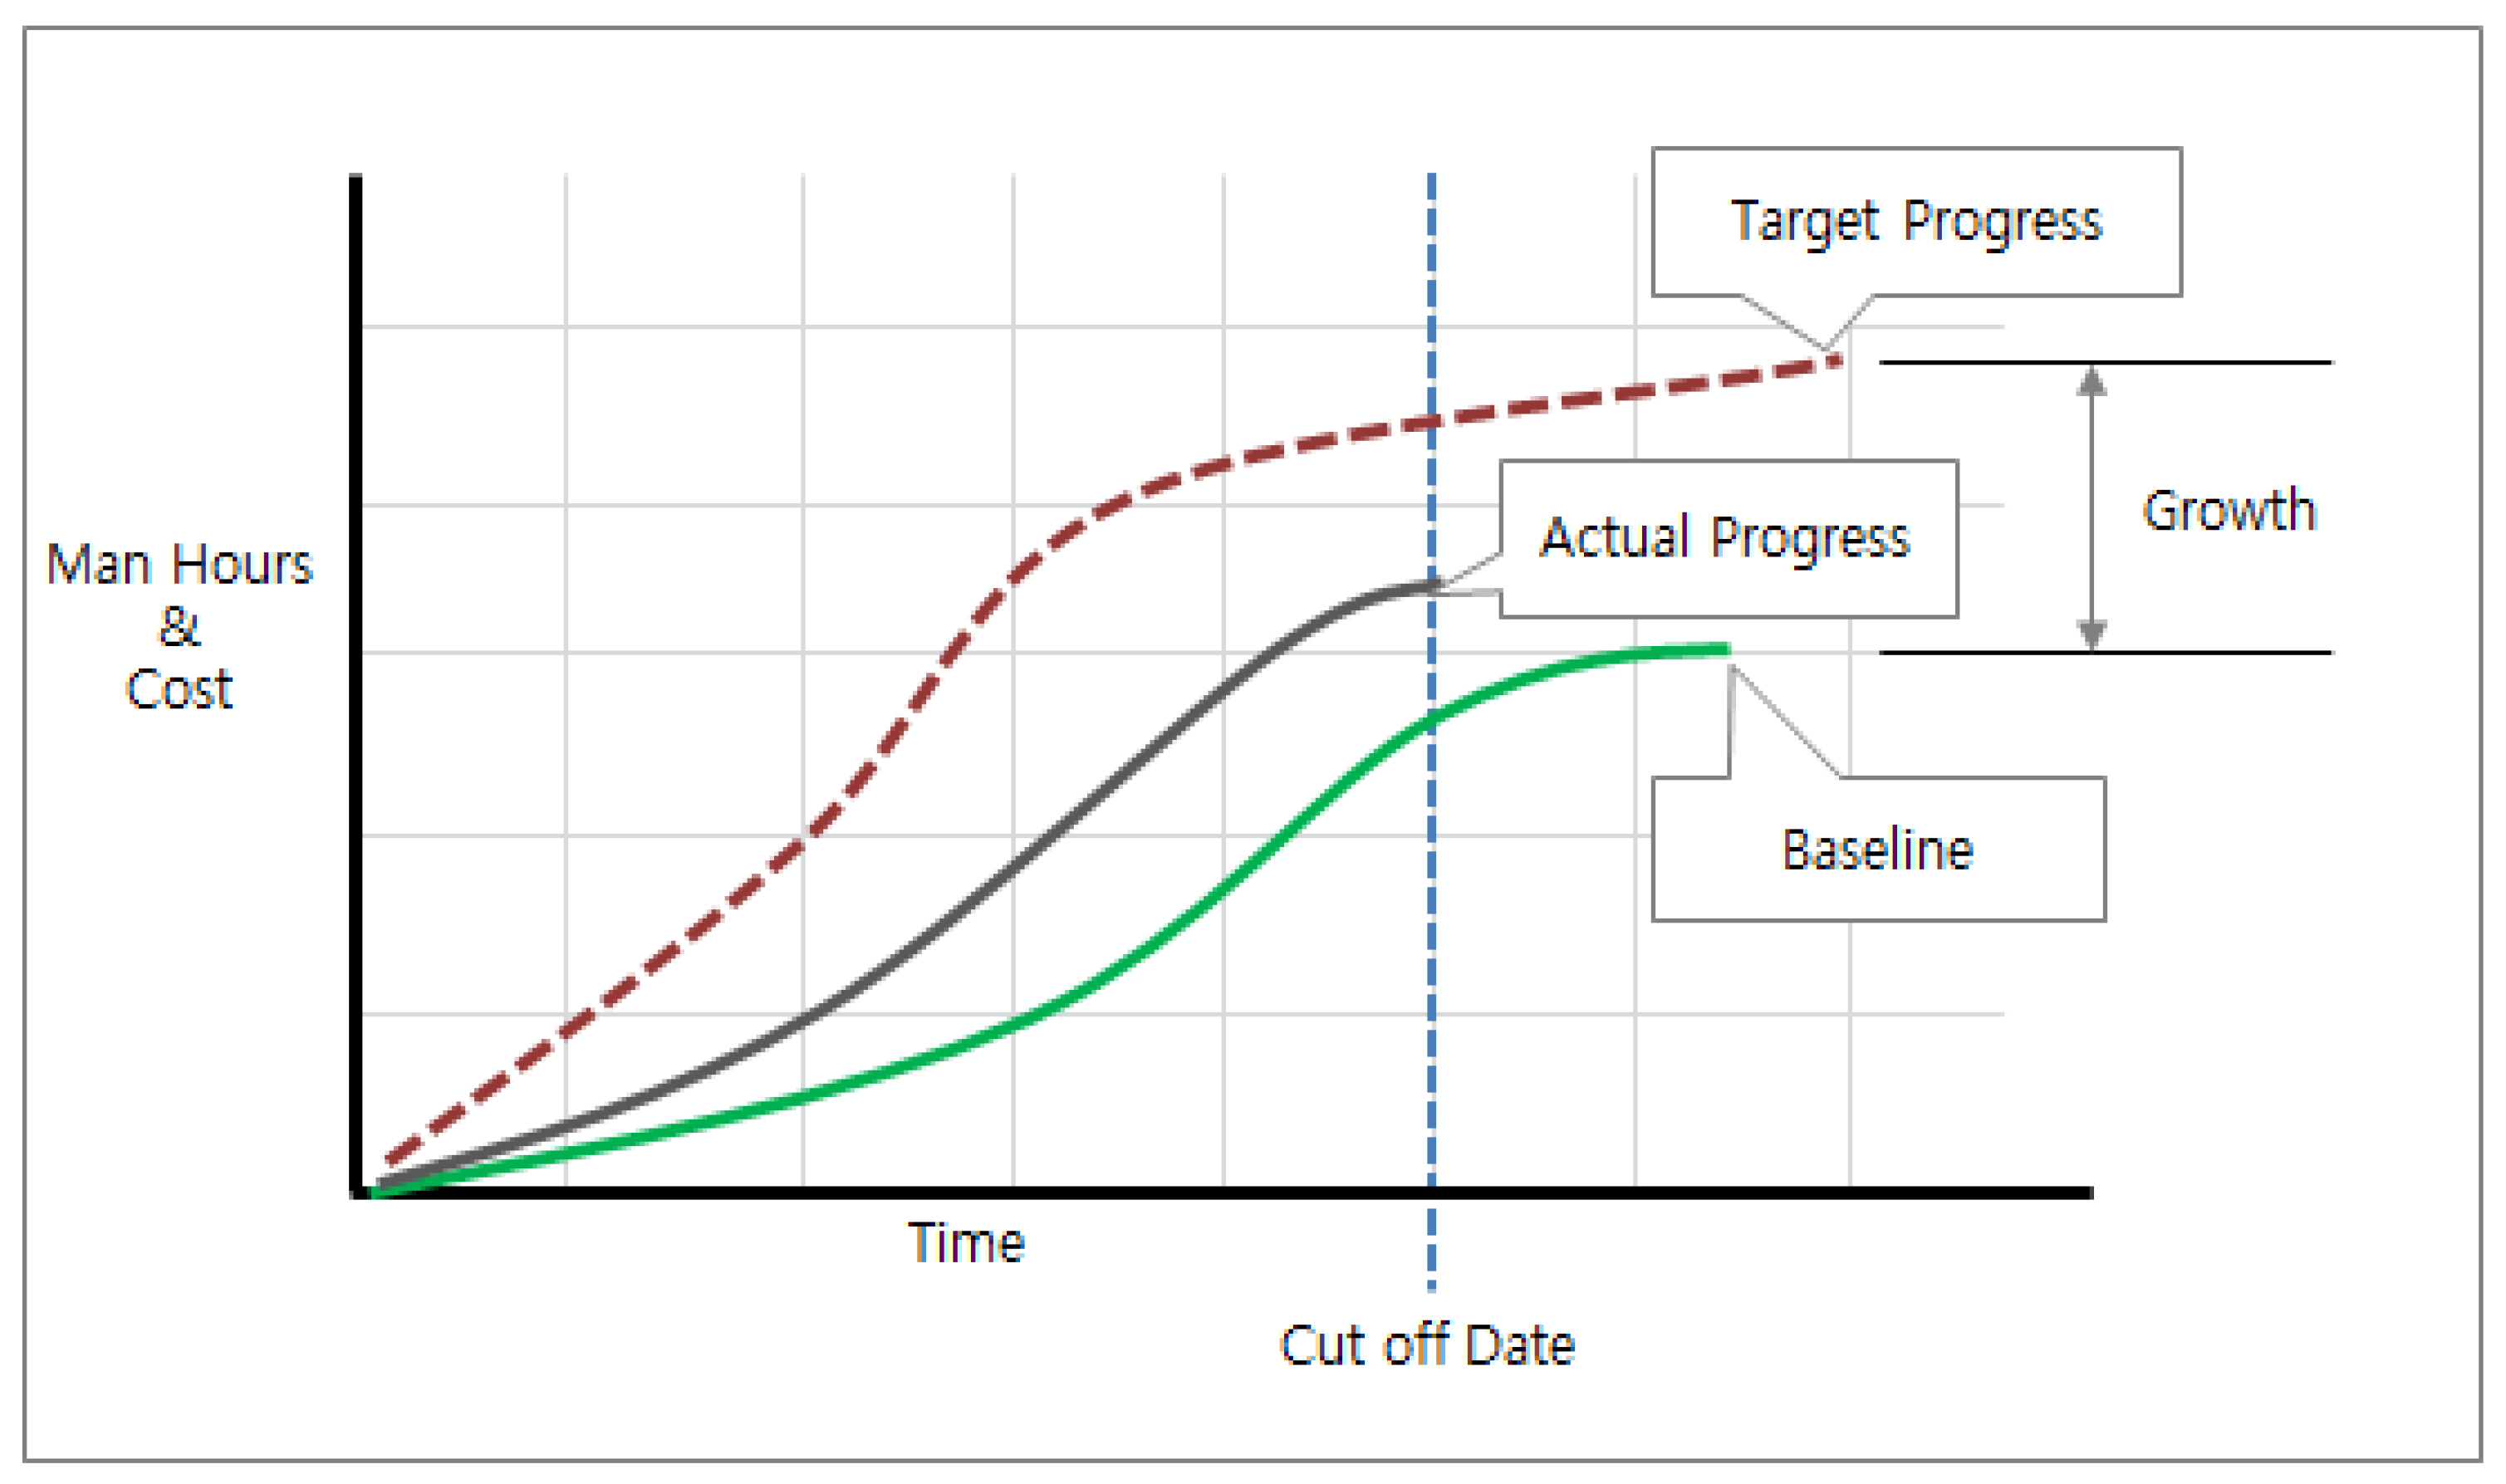
According to ‘Project Success 2597’ [4], the project S-curve allows one to check the flow of project cost input by aggregating the work package costs or the activity costs once a detailed schedule of the project has been confirmed. Also, it is often used to assess the validity of the plan or check if there are any impractical cost inputs. S-curves can be categorized as follows (SJ Lee, 2015 [1]): the first type, Baseline S-curve, is created following the baseline schedule established first; the second type, Target S-curve, is created following the target schedule finally modified, considering the actual progression.; the final type, Actual S-curve, is created based on the actual workload completed. As such, the S-curves play an important role as a project measuring or managing tool for project managers to conveniently recognize various information. The Actual S-curve is commonly located below the Target S-curve, but the two curves meet at the end of the project while converging during the last period of project completion. Figure 5 shows the calculation of project progression using an S-curve.
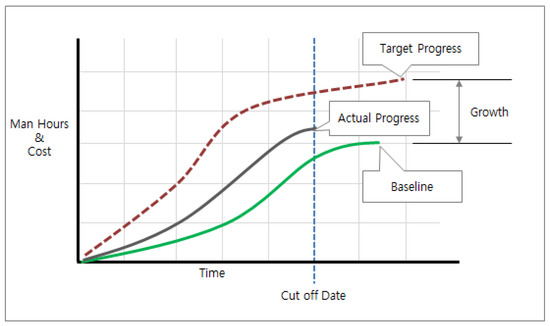
Figure 5.
Calculation of Project Progression using S-curve.
It is possible to verify whether the project scope has been widened or narrowed by comparing the Baseline S-curve with the Actual S-curve. Depending on the changes in initial analysis/requirements/design, the resource inputs will be either increased or reduced, and if the resources are limited, the schedule may be extended or shortened.
Also, it is possible to check whether the project has been delayed more than the initial plan through comparison/verification of these two curves. If the project is being delayed or expected to be delayed in the future, the Target S-curve will end at the right side of the Baseline S-curve.
The p-value refers to the probability of collected statistics being above the actual measurements assuming that the null hypothesis (H0) is true. Normally, the p-value is calculated by pre-supposing a particular hypothesis, and by assuming that the hypothesis is true, it shows the chances that the verified statistics would appear. Commonly, p-value calculation is based on the extracted sample data instead of using the entire data set.
2.7. Understanding SI and DevOps
2.7.1. The Study on SI Project
The concept of an SI project has been defined in a variety of ways. According to the National Computerization Agency in 1998, an SI project is a system business different from product purchase or facility construction, combining intangible elements with tangible elements. Based on tangible elements such as computer hardware or network equipment, it is a business where intangible elements such as software development or system integration play an important role. Further, The Korea IT Industry Promotion Agency explains by saying, “In the past, users used to directly plan or design a system and individually procure or order the hardware and software; however, as recent information technology and equipment are diversifying and the systems required by users are becoming larger and more complicated, it is not easy for them to choose which hardware to use or how they should construct the software. One solution to such a problem is the SI project” [1].
According to the Ministry of Information and Communication (MOIC), a SI business refers to the task of performing entire system construction business such as system development, integrated system test, and system installation and distribution in addition to the system operation for a certain period (MOIC, 2004). That is, an SI project is an integrated project performing the tasks of analysis, design, construction, and stabilization, adapting to user demands using hardware and software.
As described in Figure 6, the tasks in SI projects progress in due order from the start to the finish, and they are applied to large-scale and long-term projects which require integrated project management.
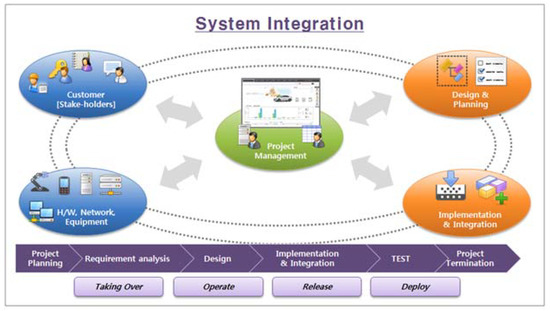
Figure 6.
An SI project management plan.
2.7.2. The Study on Agile Development Methodology
The Agile development method or Agile software development is one that maximizes development productivity by dividing a project into small units and performing repetitive and continuous development, allowing it to rapidly adapt to the market. It is essential to set up a team with a high level of professionalism and cooperation to achieve effective communication and deal with the tasks collaboratively. That is, the key to the Agile development method is to gain customer satisfaction and achieve project success by flexibly dealing with the rapidly moving and changing market or customers. According to Forester Research (2008), over 25% of firms in Europe, US, and Canada have introduced the Agile method, and another 50% are considering adopting it. As such, the Agile method is spreading quickly.
The Agile development method is a development method which attempts to find a compromise between a development method that has too many plans and a method with no plans at all. The latter has the problem of not being able to anticipate future events, and it also lacks efficiency; in the former case, when developers depend on the plans too much, it often requires too much time and money to go through the formalities such that the development flow can be very slow. In this regard, the major difference between the Agile method and the existing waterfall development method or spiral model development method is that the Agile development methodology is not a document-based development but a development method which progresses by actual coding processes [6,7,8].
Different from existing methods, the Agile development method does not perform development by anticipating the entire project. Instead, it continues to create a prototype every short period of time to develop an overall software design by modifying the contents based on the requirements made in every unit. There are a variety of methods in the Agile development method. For example, Extreme Programming performs a test-driven development after conducting repetitive developments over a short period of time (2 to 3 weeks). Scrum typically work out a Sprint which supports the development of unit module software that can be run every month; it is a method for teams who are required to complete their task within a relatively short period of time and in a limited space. The Crystal Family method provides various types of methods depending on the influence and scale of a project. Crystal Clear, which is often applied to the smallest teams, can be applied flexibly and conveniently. Feature-Driven Development performs repetitive developments every 2 to 3 weeks for every feature unit such that it can be efficiently applied after conducting UML (Unified Modeling Language) based designing.
Meanwhile, Adaptive Software Development (ASD) presumes that the development process of software can be confusing and suggests adaptable software. Although this may be similar to other Agile methodologies, the main difference is that it employs the Joint Application Development method for designing. Extreme Modeling is a method of performing a development project using UML. This can be executed at any time, and the process of designing a verifiable model is repeated to develop software from the model as a result.
2.7.3. The Study on DevOps Software Development Methodology
As one of the software development methodologies, DevOps refers to development and operation. In other words, when performing a system development or improvement, the person in charge of development and the person assuming the operation team up together for collaboration. The term DevOps was first used by Andrew Clay Shafer and Patrick Debois who discussed ‘Agile Infrastructure’ at the 2008 Agile Conference. It was then popularized by ‘DevOps Day’ which has been held since 2009 in Belgium.
According to Bas Len (2015), DevOps is a series of practices to reduce time required for changes and requirements to be applied to a system while maintaining a high level of quality. In or words, DevOps is a goal-oriented methodology which does not put much weight on formalities of methods or tools for construction. In or words, if a certain method aims to reduce the time required for planning, construction, and distribution, the relevant practices means that they are DevOps practices regardless of the Agile method, tool, and type of modification. The first characteristic of DevOps is that the opinion of the person in charge of the operation is an important requirement. Second, the development team is also responsible for the errors or problems occurring after distribution. Third, relevant parties must follow all processes involving development, operation, distribution, and management. Fourth, consistently performing the development and operation tasks makes it possible to achieve continuous service [9,10,11,12,13].
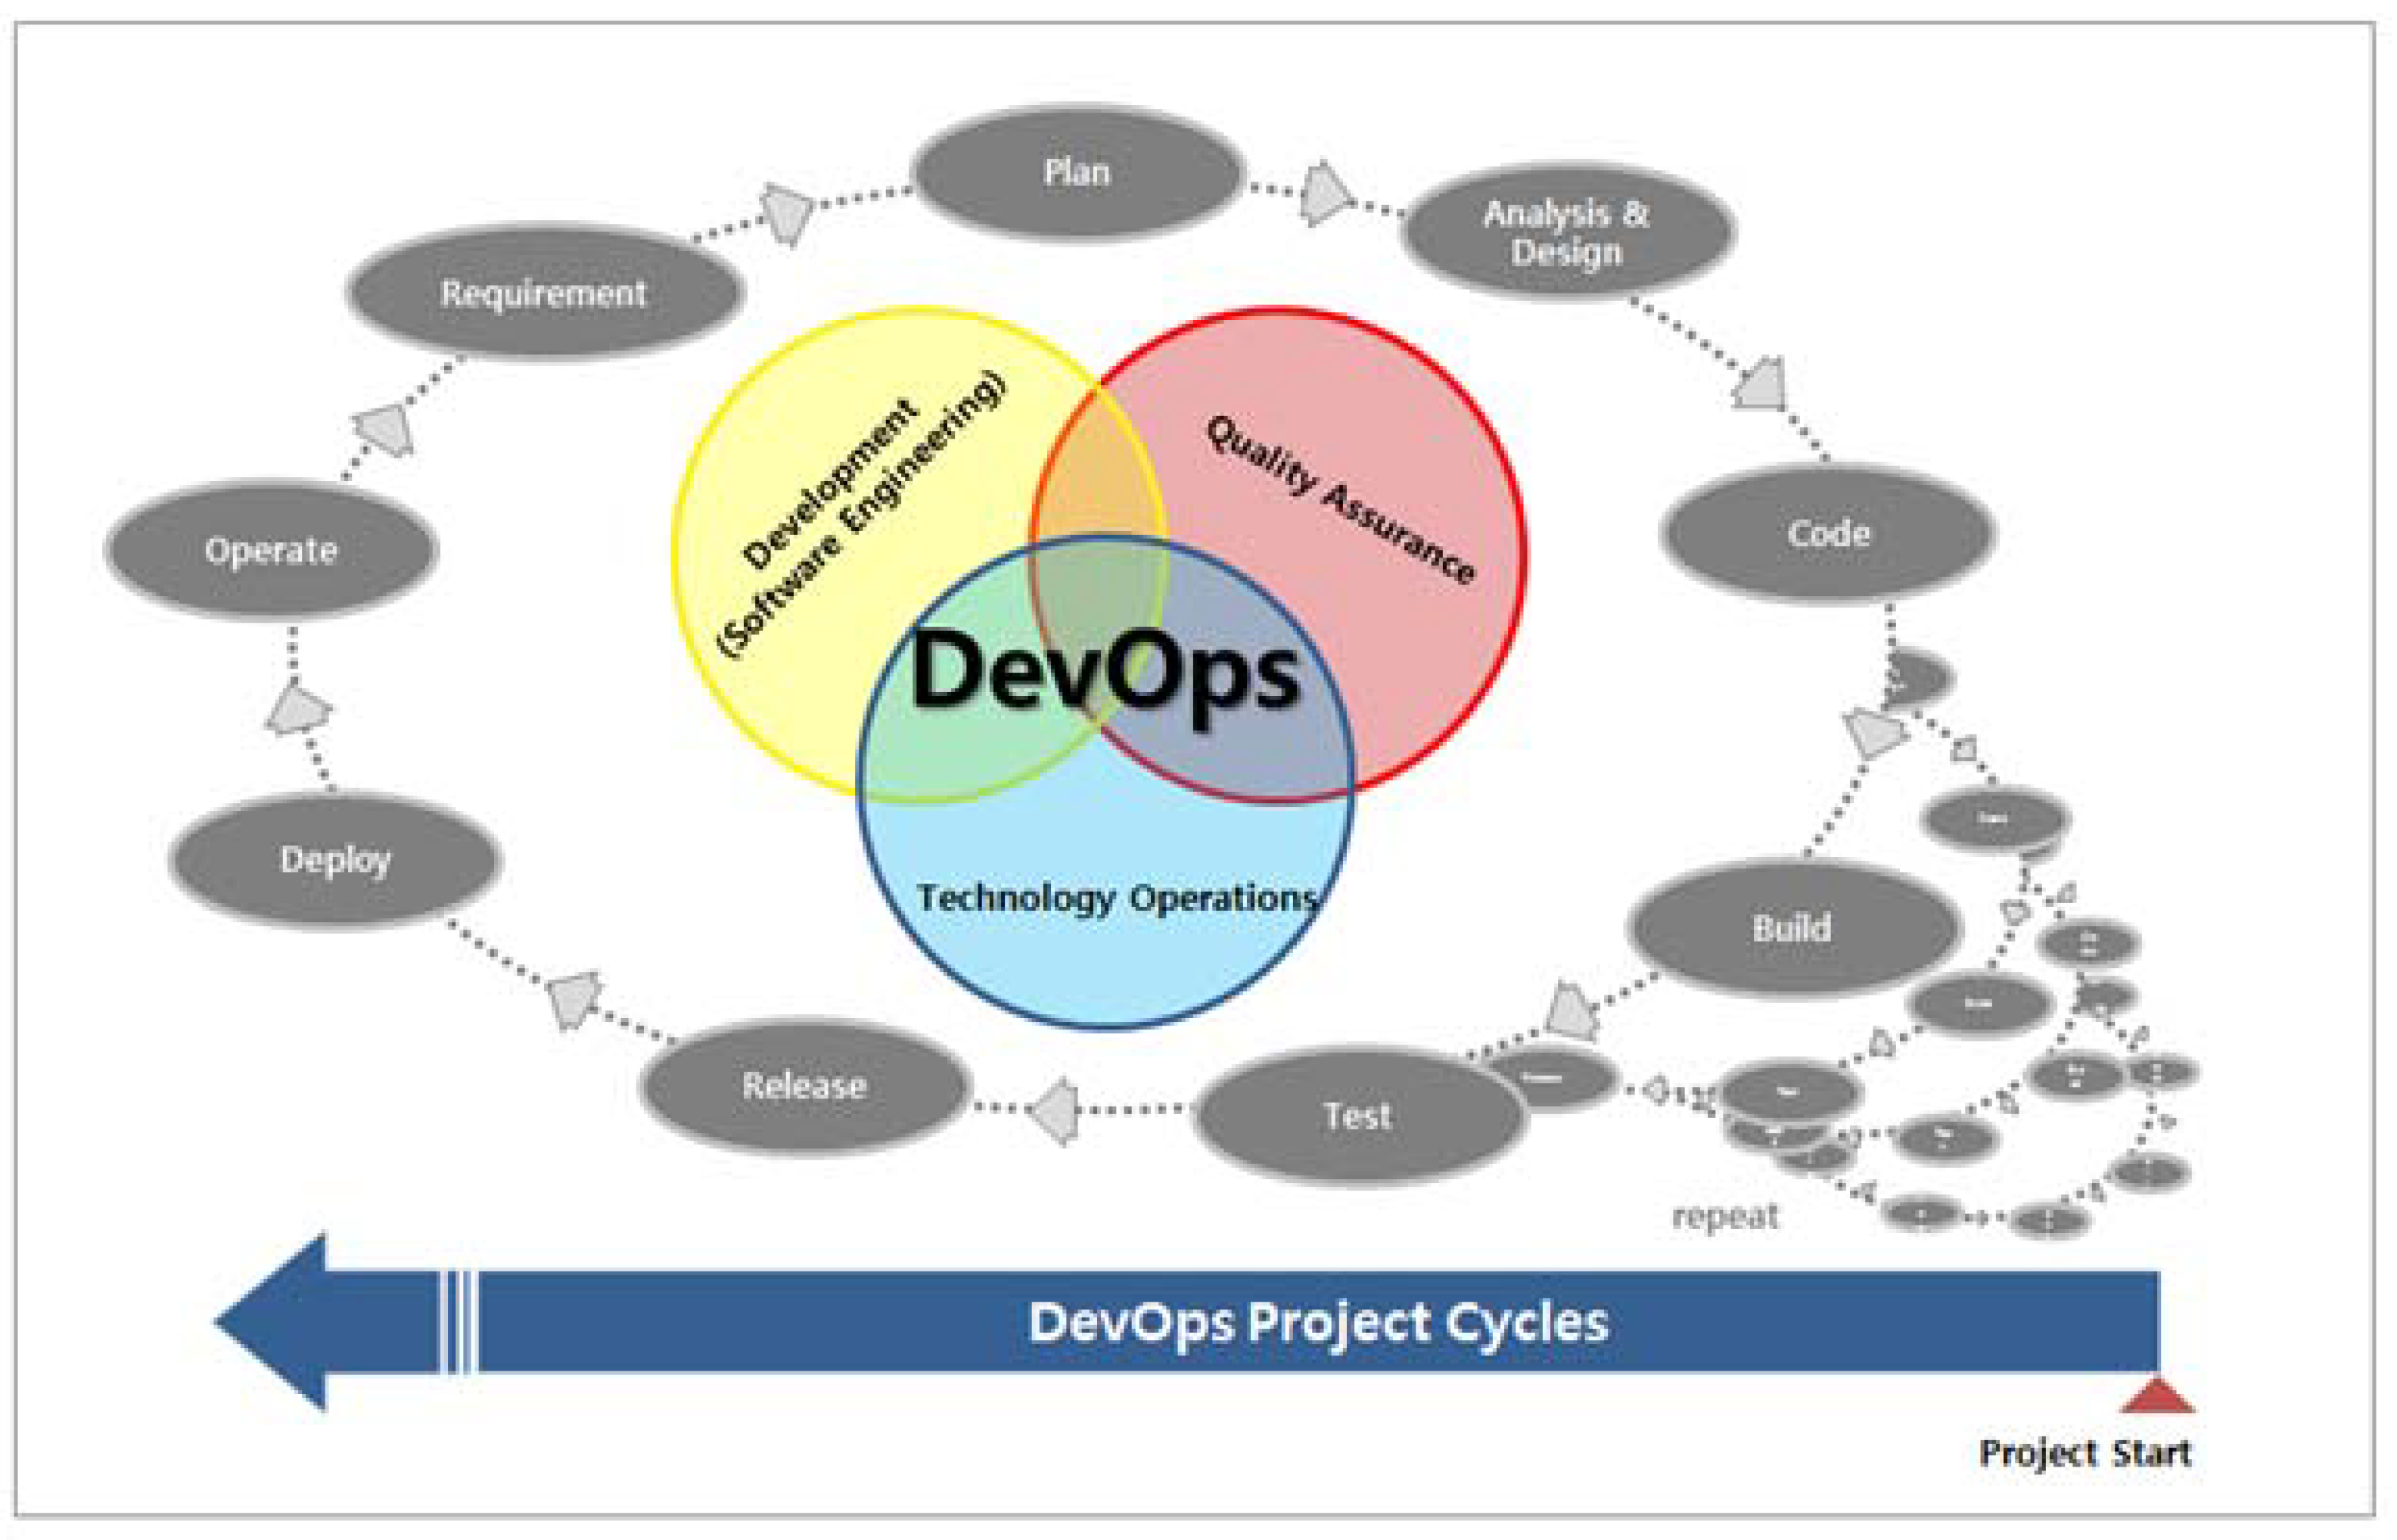
As described in Figure 7, DevOps constructs the system gradually through the repetitive Agile development process and at the same time, the operating personnel participates in the project to swiftly improve the system. Thus, the main idea of DevOps is associated with the Agile software development and Continuous Integration. It does not perform development by forecasting the future based on development models using plans and documents, but it is actually an adaptive development method which continuously creates prototypes on a regular cycle based on practical development and analyzes the requirements for rapid modification. As a result, a single large piece of software is developed. Meanwhile, ‘Continuous Integration’ refers to the task of continuously controlling the quality of the software by continuously performing integration from an early stage. This solves the problem of requiring more time for clearing problems caused by various changes and dependency during the integration process because of variance in coding (i.e., difference between baseline code and final code after completion) [14,15,16,17,18,19,20].

Figure 7.
The operation cycle of a DevOps project.
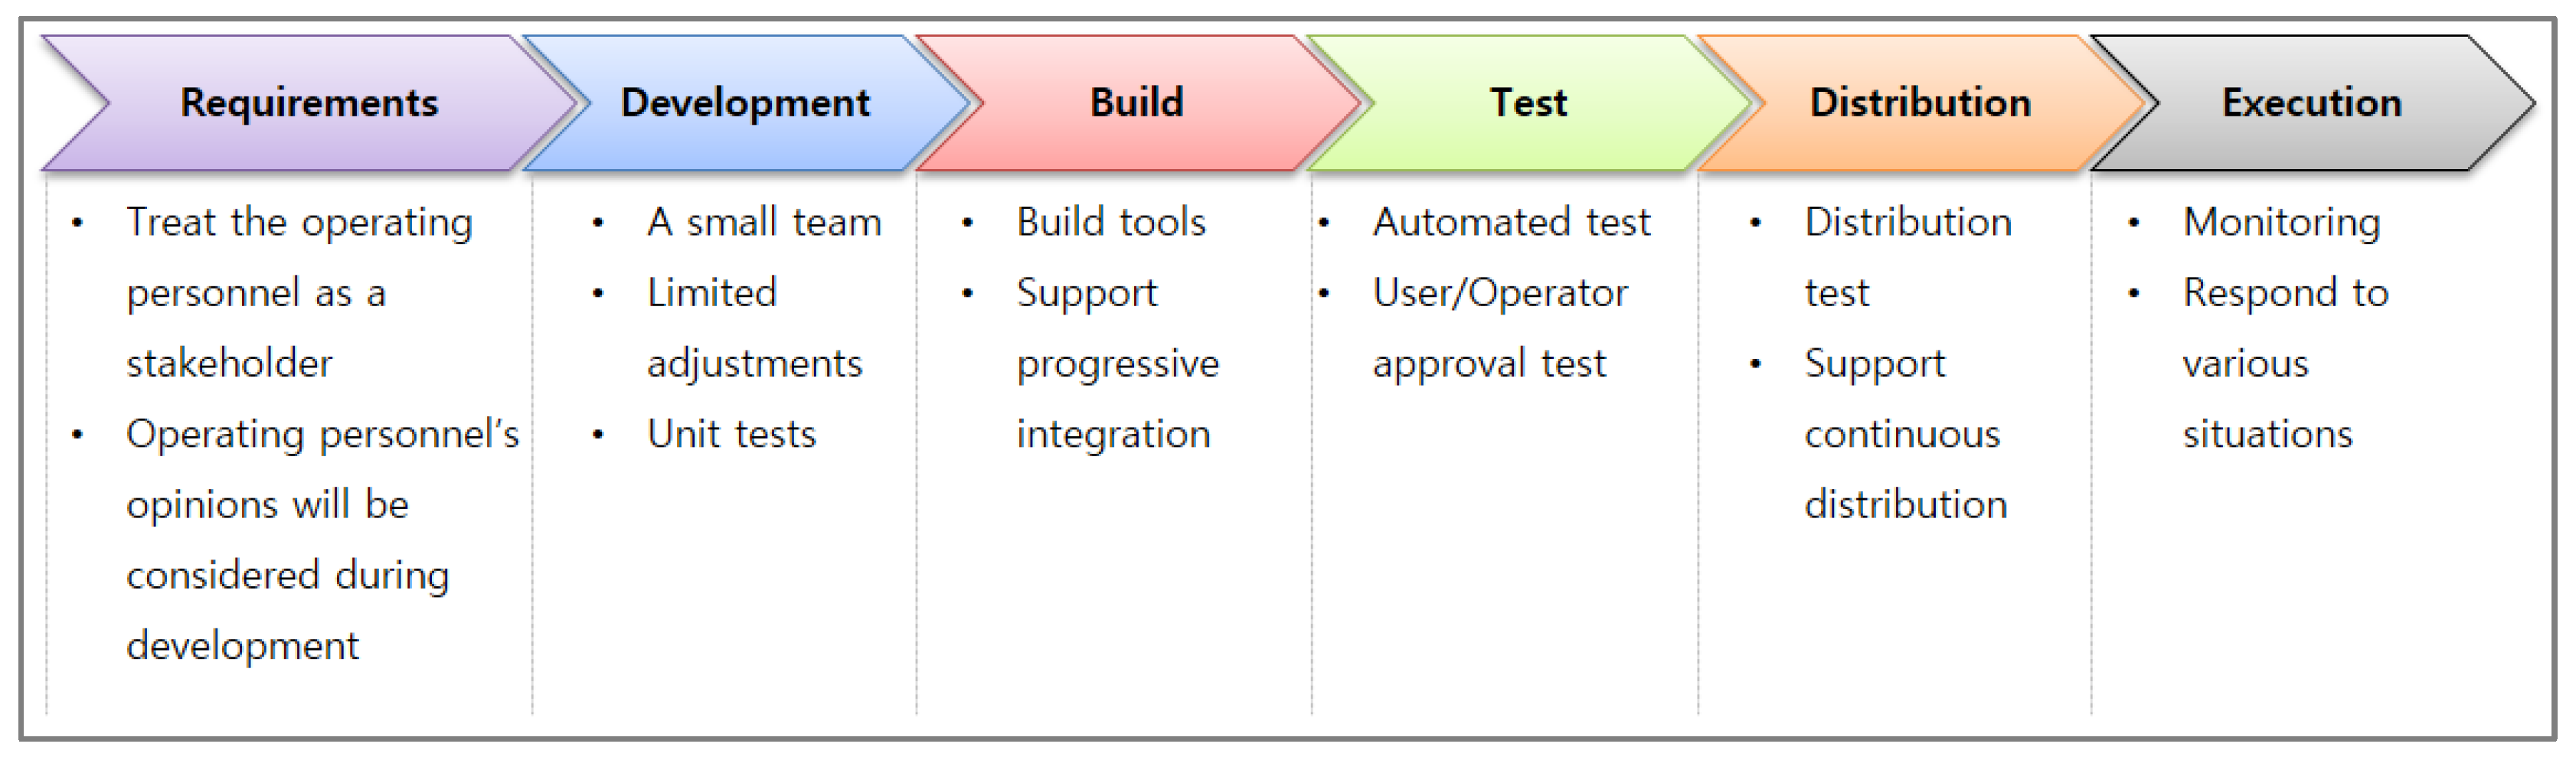
As shown in Figure 8, the operating personnel become major stakeholders in a DevOps project, and they operate in a small team similar to Agile. They participate in the build test together with the development team, and the operation has a characteristic of sustaining it through continuous support in distribution.
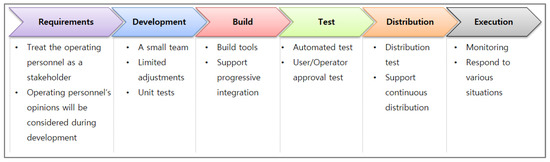
Figure 8.
Life cycle of DevOps (Porter, 2015).
2.7.4. Comparison between SI and DevOps Projects
The most significant difference between an SI project and a DevOps project is in the relationship between the main agents of project development and the operation. In the SI projects, they separately organize their own team, and the developed project is transferred to the operating team once the project development has been completed. Also, the operating team does not participate directly in the project during the development stage. On the other hand, in DevOps, they are partially involved in the project team to perform the project development directly or indirectly such that the operation can start without any transfer process. The operation and distribution are carried out during project development and they adapt to the system quickly. Figure 9 shows the comparison between SI and DevOps projects [21,22,23,24].
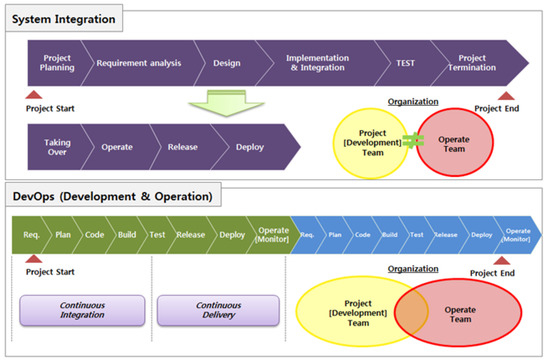
Figure 9.
Comparison between SI and DevOps Project.
2.8. Smart Factory Using Industry 4.0-Based Bluetooth Beacons
Industry 4.0 for the manufacturing sector would mean a more efficient and intelligent automated production system combining some of the advanced ITC technologies which facilitate a reliable network data exchange system. With this system, the production rate could be optimized safely and securely based on a self-controlled process. The current concept and the designs of smart factories seem to fit with such an idea, but a safety management system adaptable to smart factories should be studied through simulations prior to its use [11,12,13]. As with many other modern conventional factories, smart factories emphasize the combination of 4MIE (Man, Machine, Material, Method, and Energy) to achieve effective synergy, but they want to be ‘Smarter’ by being able to raise productivity with the lowest possible amounts of raw materials, energy, and human resource while avoiding producing defective products. The information collected from 4M1E on a real-time basis is sent to the factory management to allow them to make better decisions based on the current factory operation condition [25,26,27]. Meanwhile, the customers are informed of the expected delivery dates for their orders. Again, the workers’ safety and efficiency are essential when a factory system aims for volume production with the minimal amount of human resources. Thus, production technology, factory safety, and security should be seriously considered in the technology-intensive manufacturing industry [28,29,30,31,32].
3. Research and Approach
This chapter studies the research and approaches taken for manufacturing IT projects (OS-AD; DevOps project and SI-AD; SI project) of company A. The study looks at the method of comparing and analyzing the data pertaining to the costs and the workforce input per life cycle.
3.1. Research Method
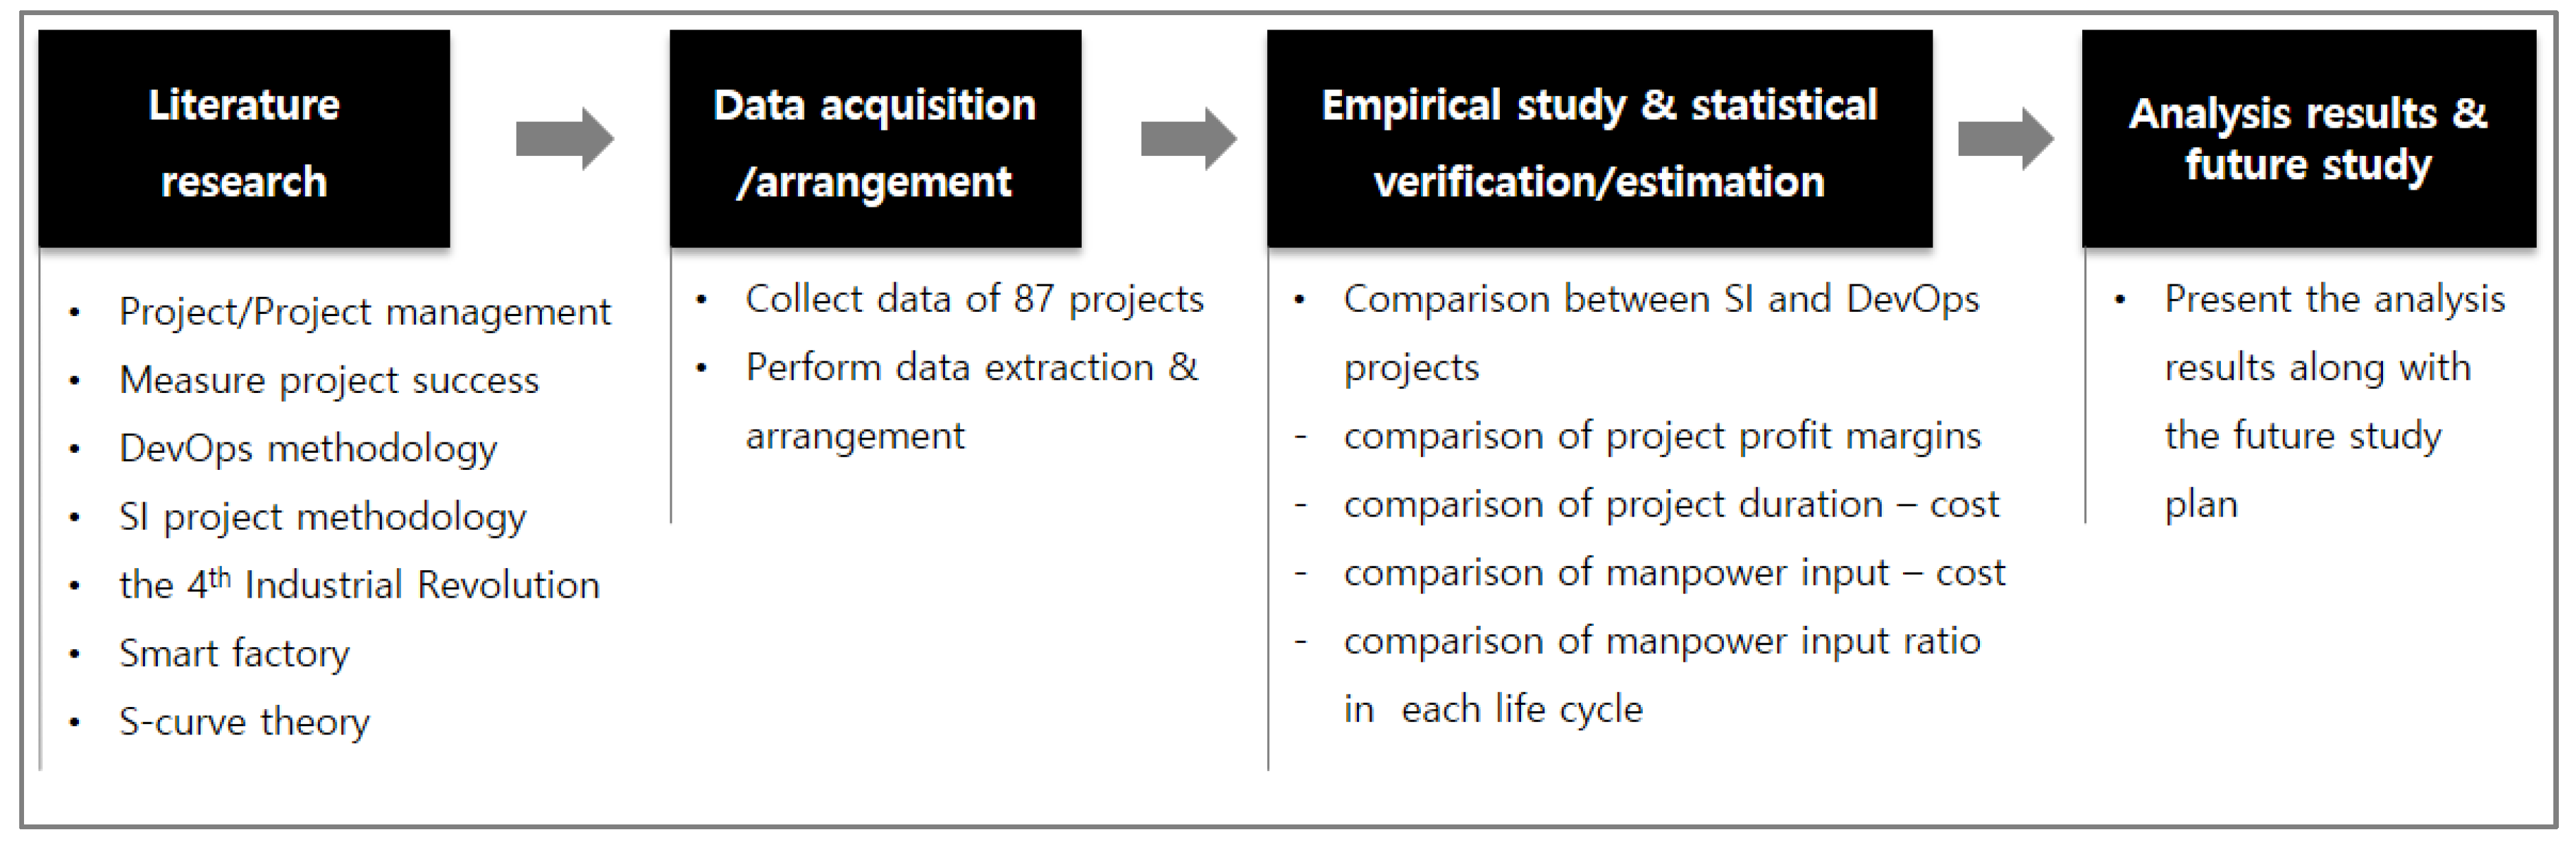
Above, the 4th Industrial Revolution and both manufacturing IT and SI projects were discussed along with the DevOps software development method. In this study, the following research model has been set up by focusing on performing a comparative analysis of an SI project and a DevOps project based on the existing literature. Figure 10 shows the research model.
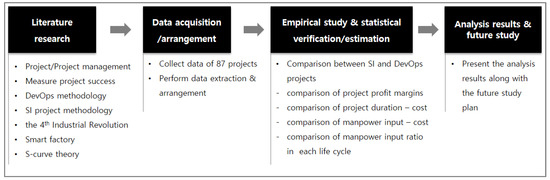
Figure 10.
The Research Model.
An attempt was made for the success of projects by comparing an SI development project, which is a common IT project construction scheme, with an OS development project where the system operator has been deployed.
3.2. Approach
3.2.1. Data Acquisition
The actual performance results from the IT project conducted by domestic company A were selected as samples, especially manufacturing IT projects performed by them in the period from 2010 to 2016. The samples consist of 33 SI projects and 54 DevOps projects, a total of 87 projects. The sample data necessary for the research were extracted from the project data registered in company A’s project management system. Then, among the selected project data, the basic project data, and the success assessment data, which allow the level of project success, were collected. For the former, the project name, period, contract amount, and profit rate at the time of contract were collected and for the latter, the status of workforce input per life cycle, project lead time, status of total manpower input, profit rate at the time of project completion, and additional profit rate against the profit rate at the time of contract were collected.
To compare the DevOps projects with the SI projects, both profit rates were compared, and the cost was divided by the project duration to calculate an actual monthly cost input. The cost was also divided by total workforce input to check the cost per workforce and to determine which projects used the workforce with a higher labor cost and by how much. At the end of the research, a comparative analysis will be performed to determine which project used the workforce at a higher rate by analyzing the difference in the workforce inputs between DevOps projects and SI projects.
3.2.2. Method of Analysis
Manufacturing IT projects have been classified as SI project and OS projects to collect the sample data. Based on the data, the below analyses were conducted.
First, for the 87 sample projects, the difference in the workforce inputs between SI and DevOps projects will be investigated by verifying the ratio of workforce input in each development phase (i.e., analysis, designing, implementation, testing, stabilization phases) with a t-test.
Second, based on the verification and the estimation results, the difference between successful SI projects and DevOps projects will be investigated.
3.2.3. Statistical Verification
The purpose of such a verification is to determine whether the difference(s) between SI projects and DevOps projects is statistically significant. For the verification, the profit rates, total person-hours, and person-hours by phase were compared. A matching sample t-test was used as a statistical verification, and for the overall verification, IBM SPSS 22 was used as a tool to perform analysis, mean comparison, and matching sample t-test.
3.3. Analysis and Results of Research
First, the existence of any differences between SI projects and DevOps projects will be estimated and verified by conducting a t-test for the differences in project duration and cost.
Second, based on the data analyzed, a t-test for the workforce input rate in each development phase will be calculated to investigate the difference between the two types of projects.
For this, a few hypotheses are proposed, and they will be verified with the matching sample t-test.
3.3.1. The Characteristics of Samples and Basic Statistical Analysis
The analysis results of 87 samples are shown in Table 4. The DevOps projects account for 57 cases (62%) and the SI projects account for 33 cases (38%). There are slightly more DevOps projects because the participating rate of company A’s operating personnel in the development had increased as they continuously improved their development system. The projects were executed during the period from 2010 to 2016 and some of the highest numbers of projects performed were 21 cases in 2011 (24%) and 20 cases in both 2012 (23%) and 2013 (23%). As for the project sizes, most projects were small projects with a contract amount of 100 to 200 million won (22 cases; 25%) and excluding the cases under 100 million won, all other cases were distributed evenly throughout the range between 200 million to 1 billion won. The largest total workforce input per project was found in the range between 10 to 20 M/M (28%) and 40 to 50 M/M (22%), while most of the other large numbers remained in the range between 10 to 50 M/M. The differences in the costs between the initial expected cost and the actual cost for each project are represented in percentages, all of which remained below 6% and considered not that significant.
Table 4.
The summary of manufacturing IT project sample data analyses.
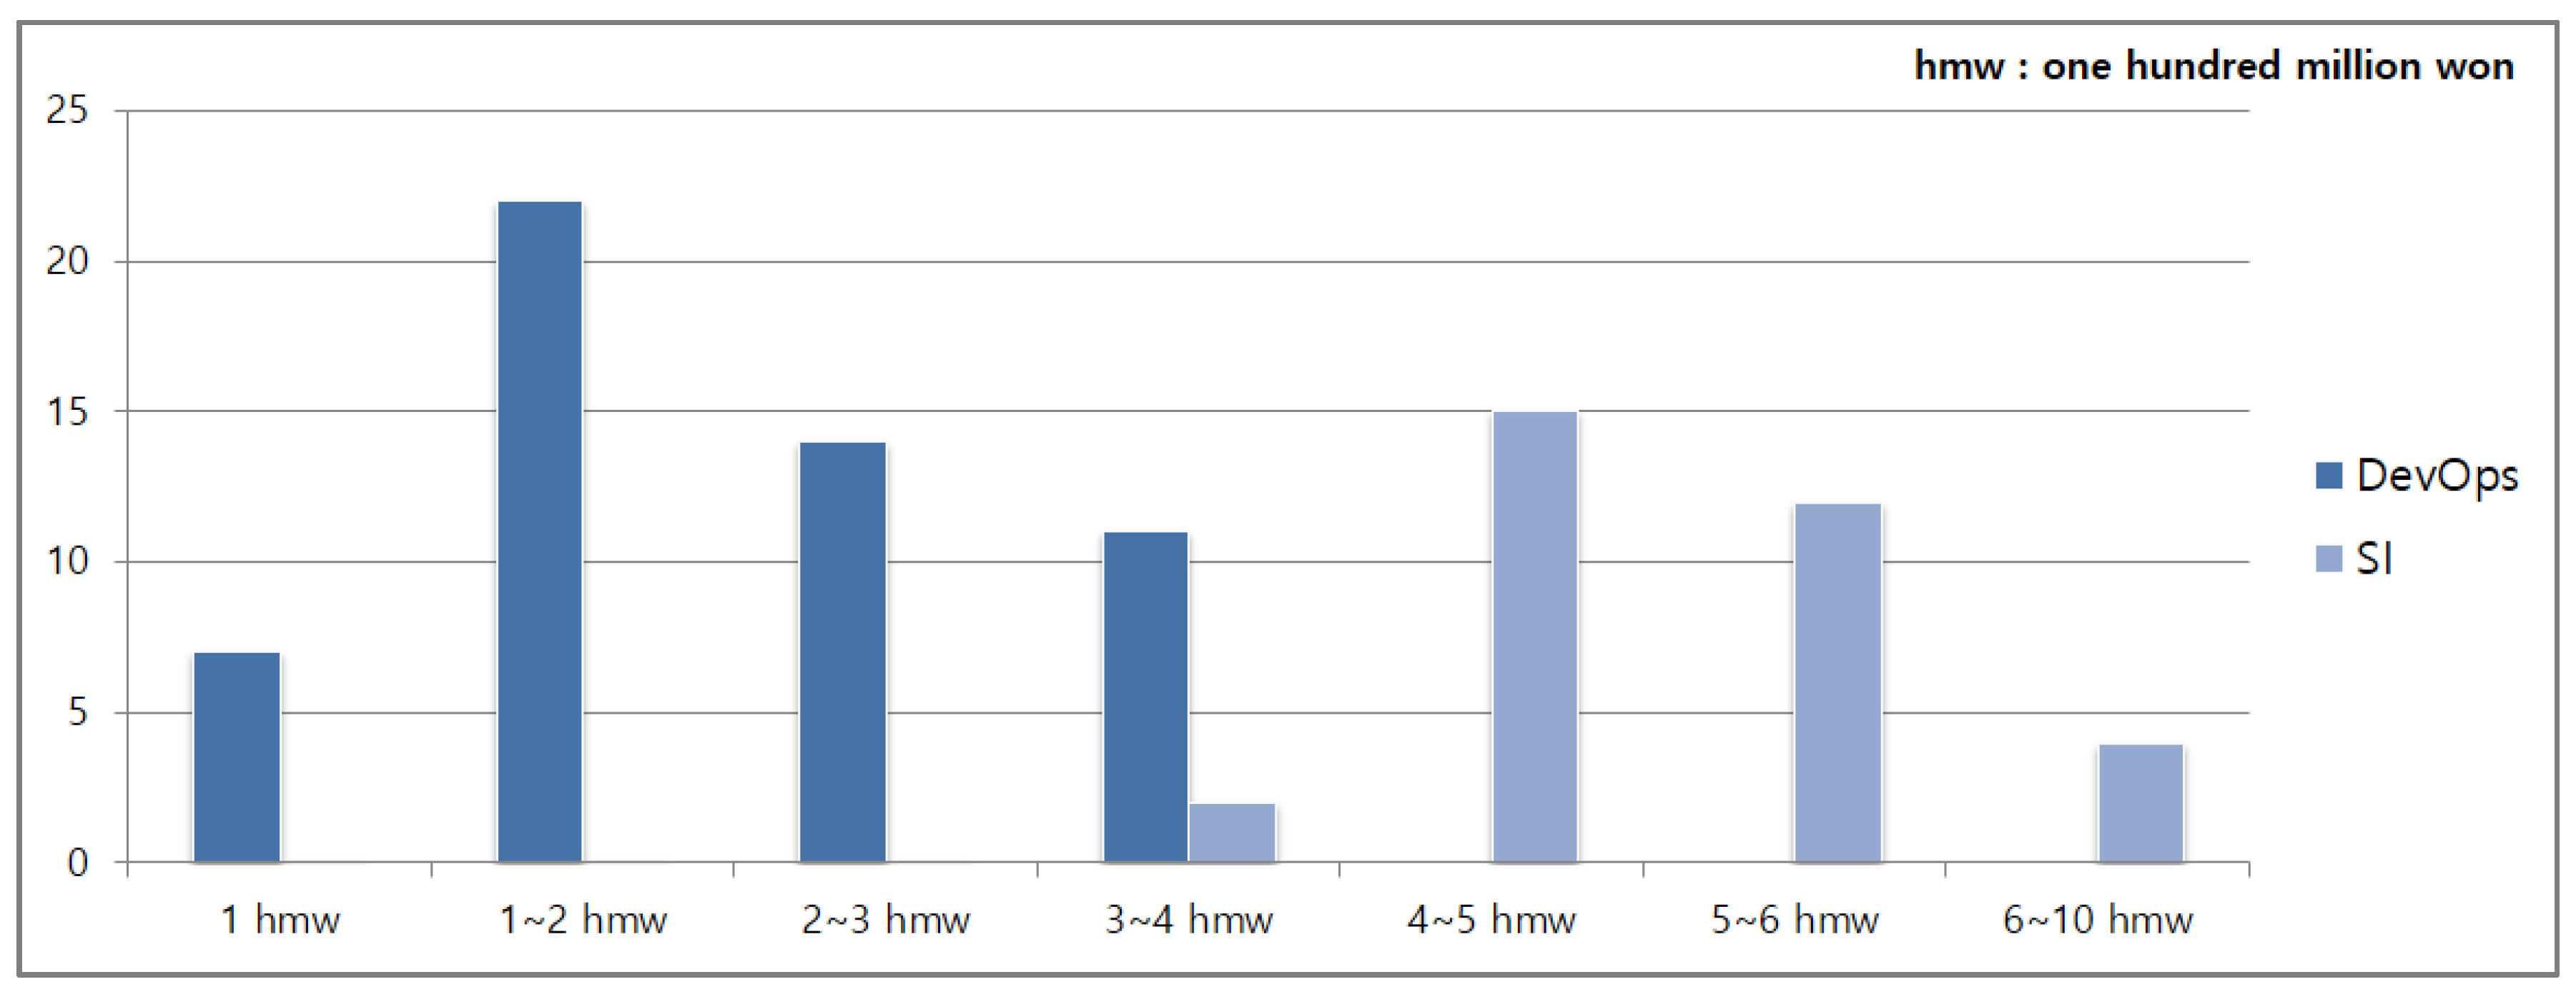
The results of comparative analyses between DevOps projects and SI projects by year and by contract amount are shown in Table 5.
Table 5.
The projects distinguished by year, project type, and contract amount.
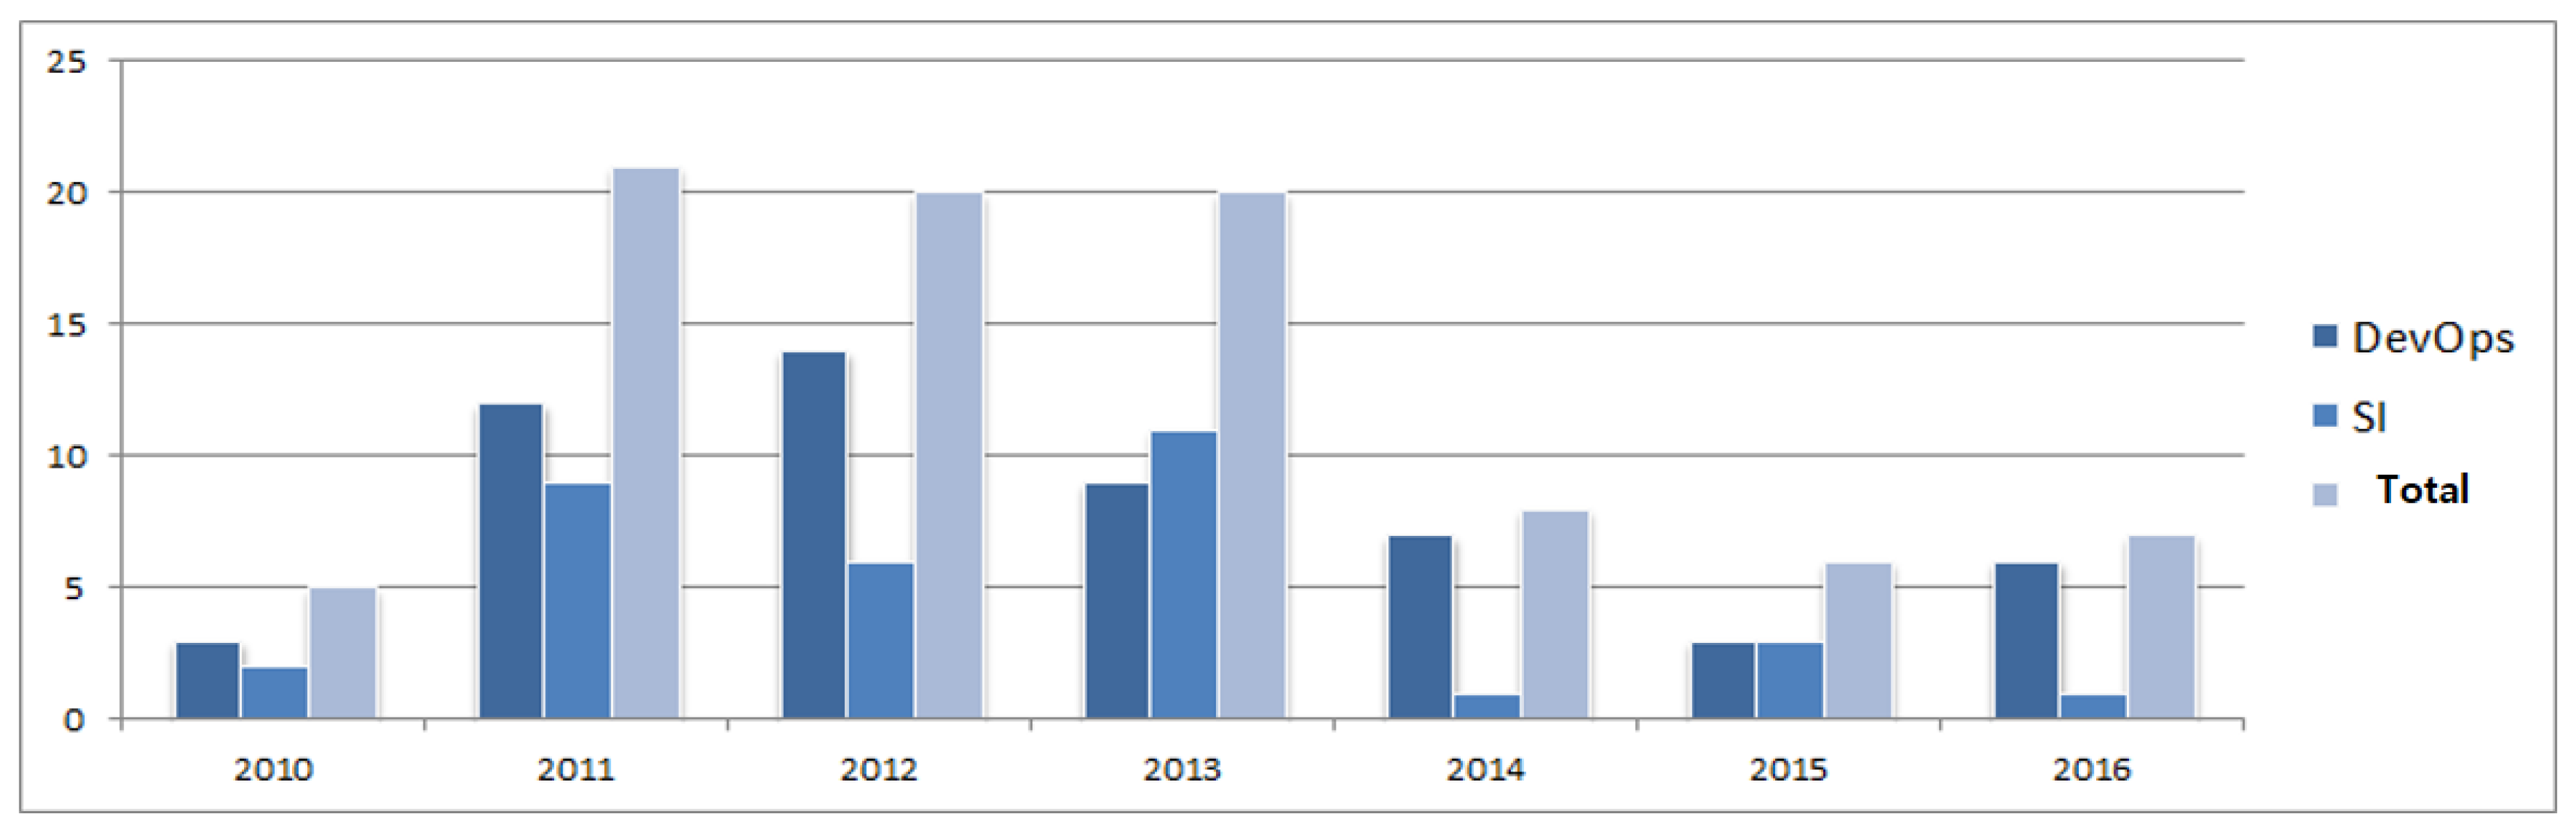
For the former, all 54 cases were projects under 400 million won. 41% of them were projects with cost between 100 and 200 million won and 26% were between 200 and 300 million. Also, the table shows that the scale of the projects has increased in general since 2013. For the SI projects, all 33 cases were distributed between 300 million and 1 billion won. The contract amount between 400 million and 500 million won accounted for 45% followed by projects with a contract amount between 500 million and 600 million (36%). Also, Figure 11 shows the sample data distribution status by year. Meanwhile, Figure 12 shows the distribution of the differences in the expected costs and actual costs.

Figure 11.
Sample data distribution status by year.
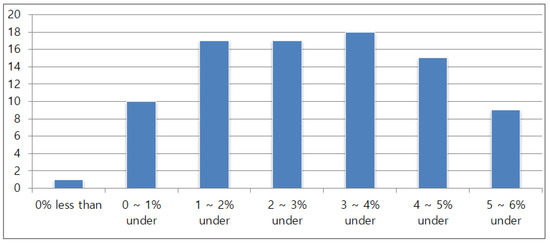
Figure 12.
Distribution of differences in expected costs and actual costs.
The results of comparative analyses between DevOps projects and SI projects by year and by workforce input are shown in Table 6. Also, Figure 13 shows the costs by project.
Table 6.
Workforce input by year, project type.
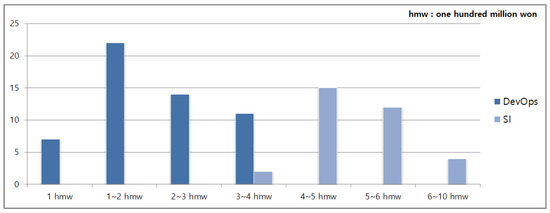
Figure 13.
Costs by project.
For the former, all 54 samples were under 50 M/M, and ones that stayed between 10 to 20 M/M accounted for 44% of the entire distribution followed by 22% for 20 to 30 M/M. As the scale of the projects had become larger since 2014, the overall workforce input increased as well. For the SI projects, all 33 sample data were distributed between 30 and 70 M/M. 55% of them stayed between 40 and 50 M/M followed by 21% for 50 to 60 M/M. from this, it seems that the workforce inputs were distributed similarly to the cost distribution.
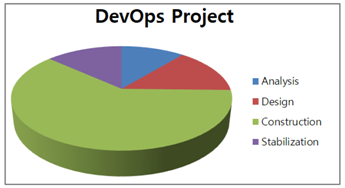
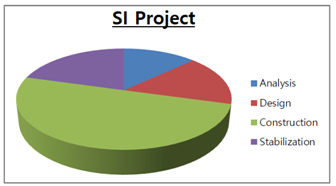
Figure 14 shows workforce input by project. Also, the results of comparative analyses between DevOps projects and SI projects by workforce input per life cycle are shown in Table 7. It showed that the proportion of workforce input was predominant in the project construction process for both types of projects at 61% and 50% respectively, but DevOps (SI) showed that the next largest workforce input was for the designing (stabilization) stage, accounting for 14% (DevOps) and 21% (SI). Also, DevOps projects used much more workforce in the construction, but the rest of the tasks (i.e., analysis, designing, and stabilization) had similar proportions, while the SI projects used more workforce for analysis, designing, and stabilization rather than construction, especially for the stabilization process.
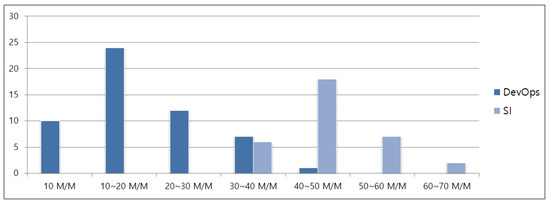
Figure 14.
Workforce input by project.
Table 7.
Workforce input per life cycle by project.
3.3.2. Research and Analysis
Hypothesis
In this research, several hypotheses were formulated based on questions such as “Is there any significant difference in the profit margins of DevOps and SI projects?”, “Is there any significant difference between project duration and actual execution cost in each DevOps and SI project?” “Is there any significant difference between workforce input and actual execution cost of each DevOps and SI project?” and “Is there any significant difference between the workforce inputs in each DevOps and SI project?” as shown in Table 8.
Table 8.
Formulation of hypotheses.
Verification of Difference in Profit Margins Between Expected Cost and Actual Execution Cost
To verify the difference in profit margins between expected cost and actual execution cost of each DevOps and SI project, a matching sample t-test was used.
Null hypothesis (H0): There is no significant difference in the profit margins between expected and actual execution costs. Table 9 shows the statistics for matching samples (expected profit margin—actual execution profit margin).
Table 9.
Statistics of matching samples (expected profit margin–actual execution profit margin).
Alternative hypothesis (H1): There is a significant difference in the profit margins between expected and actual execution costs. The verification results by function are organized as below.
According to Table 10 where the verification results of profit margins (expected profit margin—actual execution profit margin) have been analyzed with a matching sample t-test, the verification value of both types of projects is equally 0.000 (T ≤ t, significance level 95%) and has resulted in p-Value < 0.01. Therefore, the null hypothesis was rejected in favor of the alternative hypothesis, which means that there is a significant difference in the profit margins between them. The statistical analysis also revealed the same result, that the DevOps projects’ profit margins were higher on average.
Table 10.
Verification of matching samples (expected profit margin—actual execution profit margin).
3.3.3. Verification of Difference in Project Duration—Actual Execution Cost
To determine the difference in the costs (actual execution cost—duration of the project) between DevOps and SI projects, the actual execution cost has been divided by the project duration to calculate an average monthly expenditure. With the results obtained, the following hypotheses have been formulated and by using a matching sample t-test, verification was conducted. Table 11 shows the statistics for matching samples (project duration—execution cost).
Table 11.
Statistics of matching samples (project duration—execution cost).
Null hypothesis (H0): There is no difference in the costs (project duration—execution cost) for both types of projects.
Alternative hypothesis (H1): There is a difference in the costs (project duration—execution cost) for both types of projects. The test results according to the project type are organized as below.
Table 12 shows that the matching sample t-test for the verification results resulted in 0.000, satisfying p-Value < 0.01 at the significance level of 95%. Thus, the null hypothesis was rejected in favor of the alternative hypothesis, which means that there is a significant difference in the execution cost against the project duration between the two types of projects.
Table 12.
Matching sample test.
Observing the average actual monthly execution costs, DevOps projects used 28,932,761 won compared to 39,795,057 won by the SI projects. The DevOps projects used less to perform the project, and the verification test proved the significance in the difference.
3.3.4. Verification of Difference in Manpower Input—Actual Execution Cost
To verify the difference in workforce input—actual execution costs between DevOps and SI projects, the actual execution cost was divided by the workforce input to calculate an average workforce input cost and a matching sample t-test was used for their verification. Table 13 shows the matching sample statistics of workforce input—actual execution cost.
Table 13.
Matching sample statistics of workforce input—actual execution cost.
Null hypothesis (H0): There is no difference in the workforce input-actual execution costs between the two types of projects.
Alternative hypothesis (H1): There is a difference in the workforce input-actual execution costs between the two types of projects.
By performing the matching sample t-test for the verification results of the difference in workforce M/M as shown in Table 14, the significance level for both was 0.021, satisfying p-Value < 0.05. Thus, the null hypothesis was rejected in favor of the alternative hypothesis which had assumed that there was a significant difference. The average monthly workforce input of DevOps projects was 7,900,760 won compared to 8,308,568 won for SI projects. The verification found the significance in such a difference.
Table 14.
Matching sample test.
3.3.5. Verification of Difference in Manpower Input Per Life Cycle
To verify the difference in the workforce inputs per project life cycle for both types of projects, the entire project duration (100%) was classified into the analysis, designing, construction, and stabilization/test phases. The workforce inputs in these phases are calculated and represented in percentages. Hypotheses were formulated for these phases, and verification was performed with a matching sample t-test.
Null hypothesis (H0): There is no difference in the workforce inputs for every life cycle between DevOps and SI projects. Alternative hypothesis (H1): There is a difference in the workforce inputs for every life cycle between DevOps and SI projects. The test results for these phases in every life cycle are organized as follows.
According to Table 15, the verification values for the analysis and design phases were 0.28 and 0.159, respectively, and higher than 0.05. Therefore, the null hypothesis was accepted, that there is no significant difference between the two types of projects. On the other hand, the verification values for the construction and stabilization phases were both 0.000 satisfying p-Value < 0.05 such that the null hypothesis was rejected in favor of the alternative hypothesis, meaning that there is a significant difference in the workforce inputs in every life cycle between them. In conclusion, in terms of the workforce input in every life cycle there was no significant difference in the analysis and design phases but there was significant difference in the rest of the phases, for both types of projects.
Table 15.
Test results of workforce input rates in each life cycle.
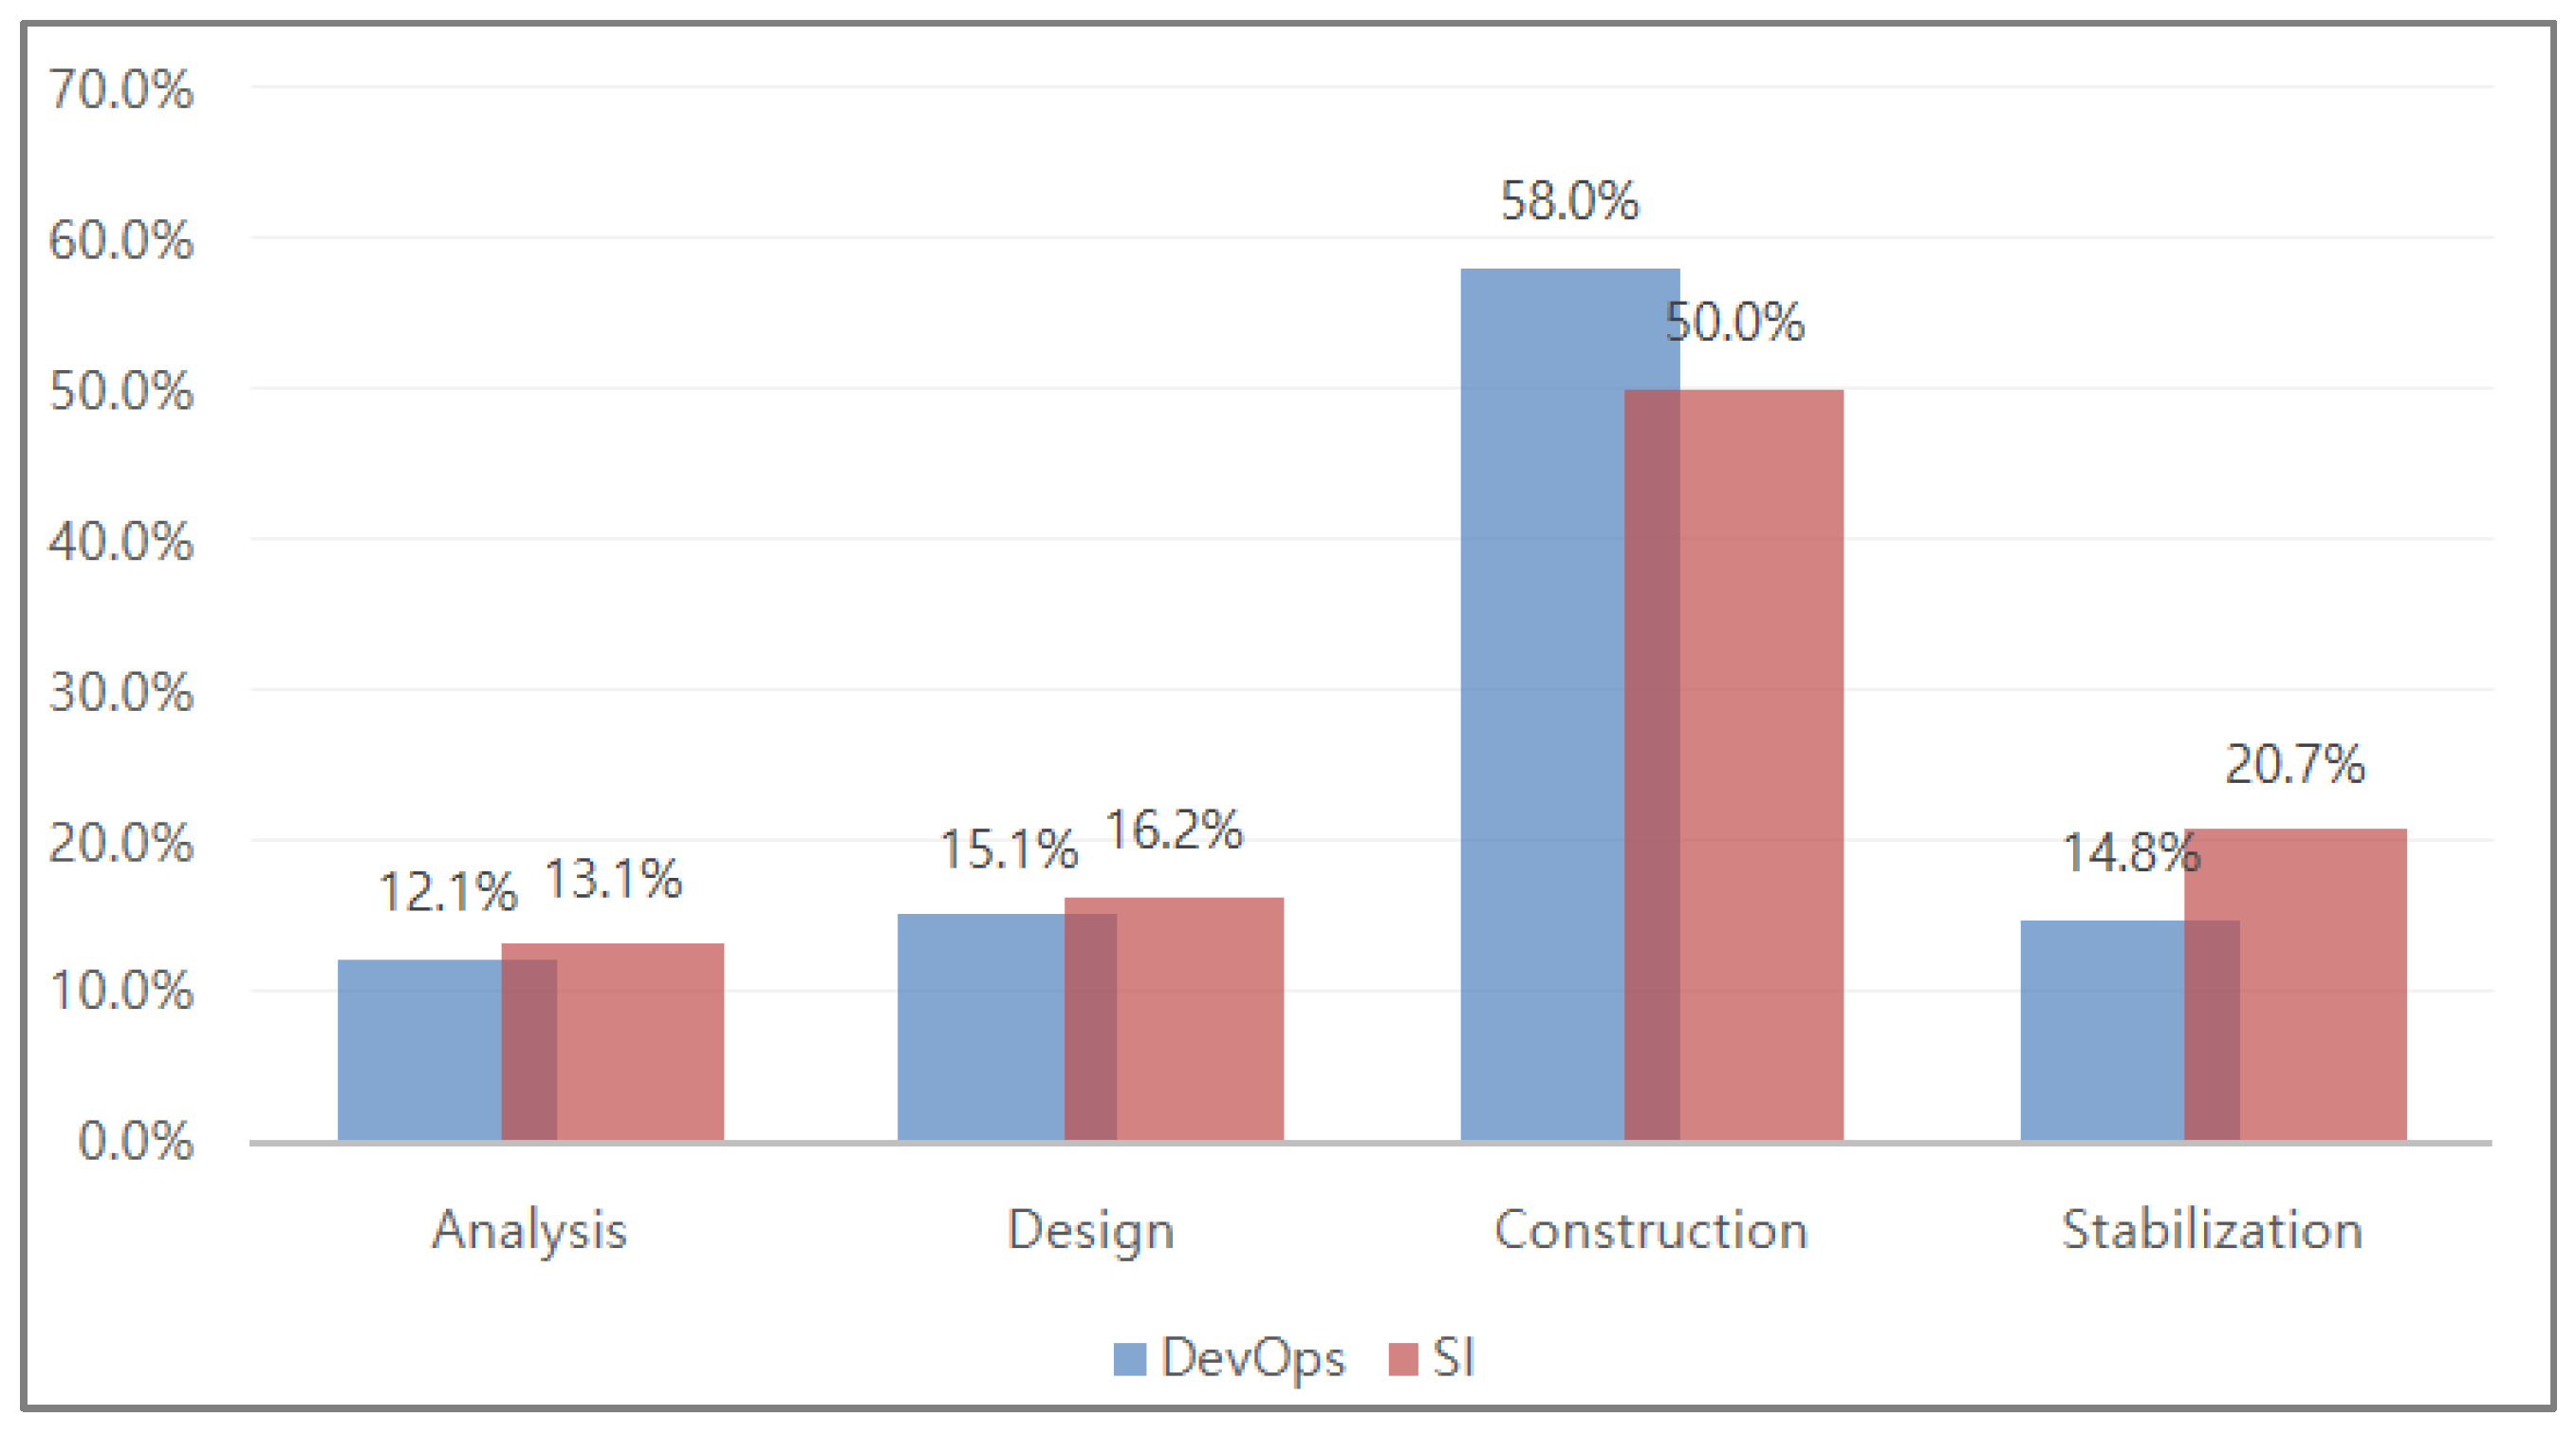
If the above results are to be interpreted in terms of the input ratios, all the projects used workforce at a high rate for the construction phase, but the DevOps projects’ rate was higher (ave. 58%) than the SI projects’ rate (50%). On the other hand, for the stabilization phase, SI projects’ input rate was ave. 20.7% which was the second highest rate behind the construction phase. Meanwhile, the DevOps projects’ average input rate for the stabilization phase was 14.8%, similar to 12.1% and 15.1% for the analysis and design phases, respectively. That is, the DevOps projects used more workforce for the construction task but spend less time for stabilization. On the contrary, SI projects used more workforce than the DevOps projects for the stabilization. Therefore, there is a significance in such differences in the construction/stabilization phases. Figure 15 shows workforce input in each life cycle.
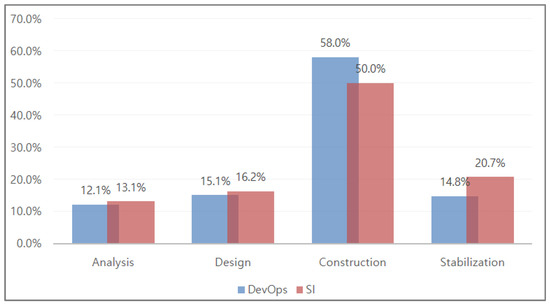
Figure 15.
Workforce input in each life cycle.
3.4. Verification/Estimation Results of Research Hypotheses
The following results can be obtained based on the verification/estimation of the hypotheses using the sample data.
The verification results for both projects shown in Table 16 revealed that all 87 manufacturing IT projects had significant differences statistically in terms of the differences in profit margins, project duration-actual execution costs, workforce input—actual execution costs, and workforce inputs per life cycle.
Table 16.
Verification/Estimation results of hypotheses.
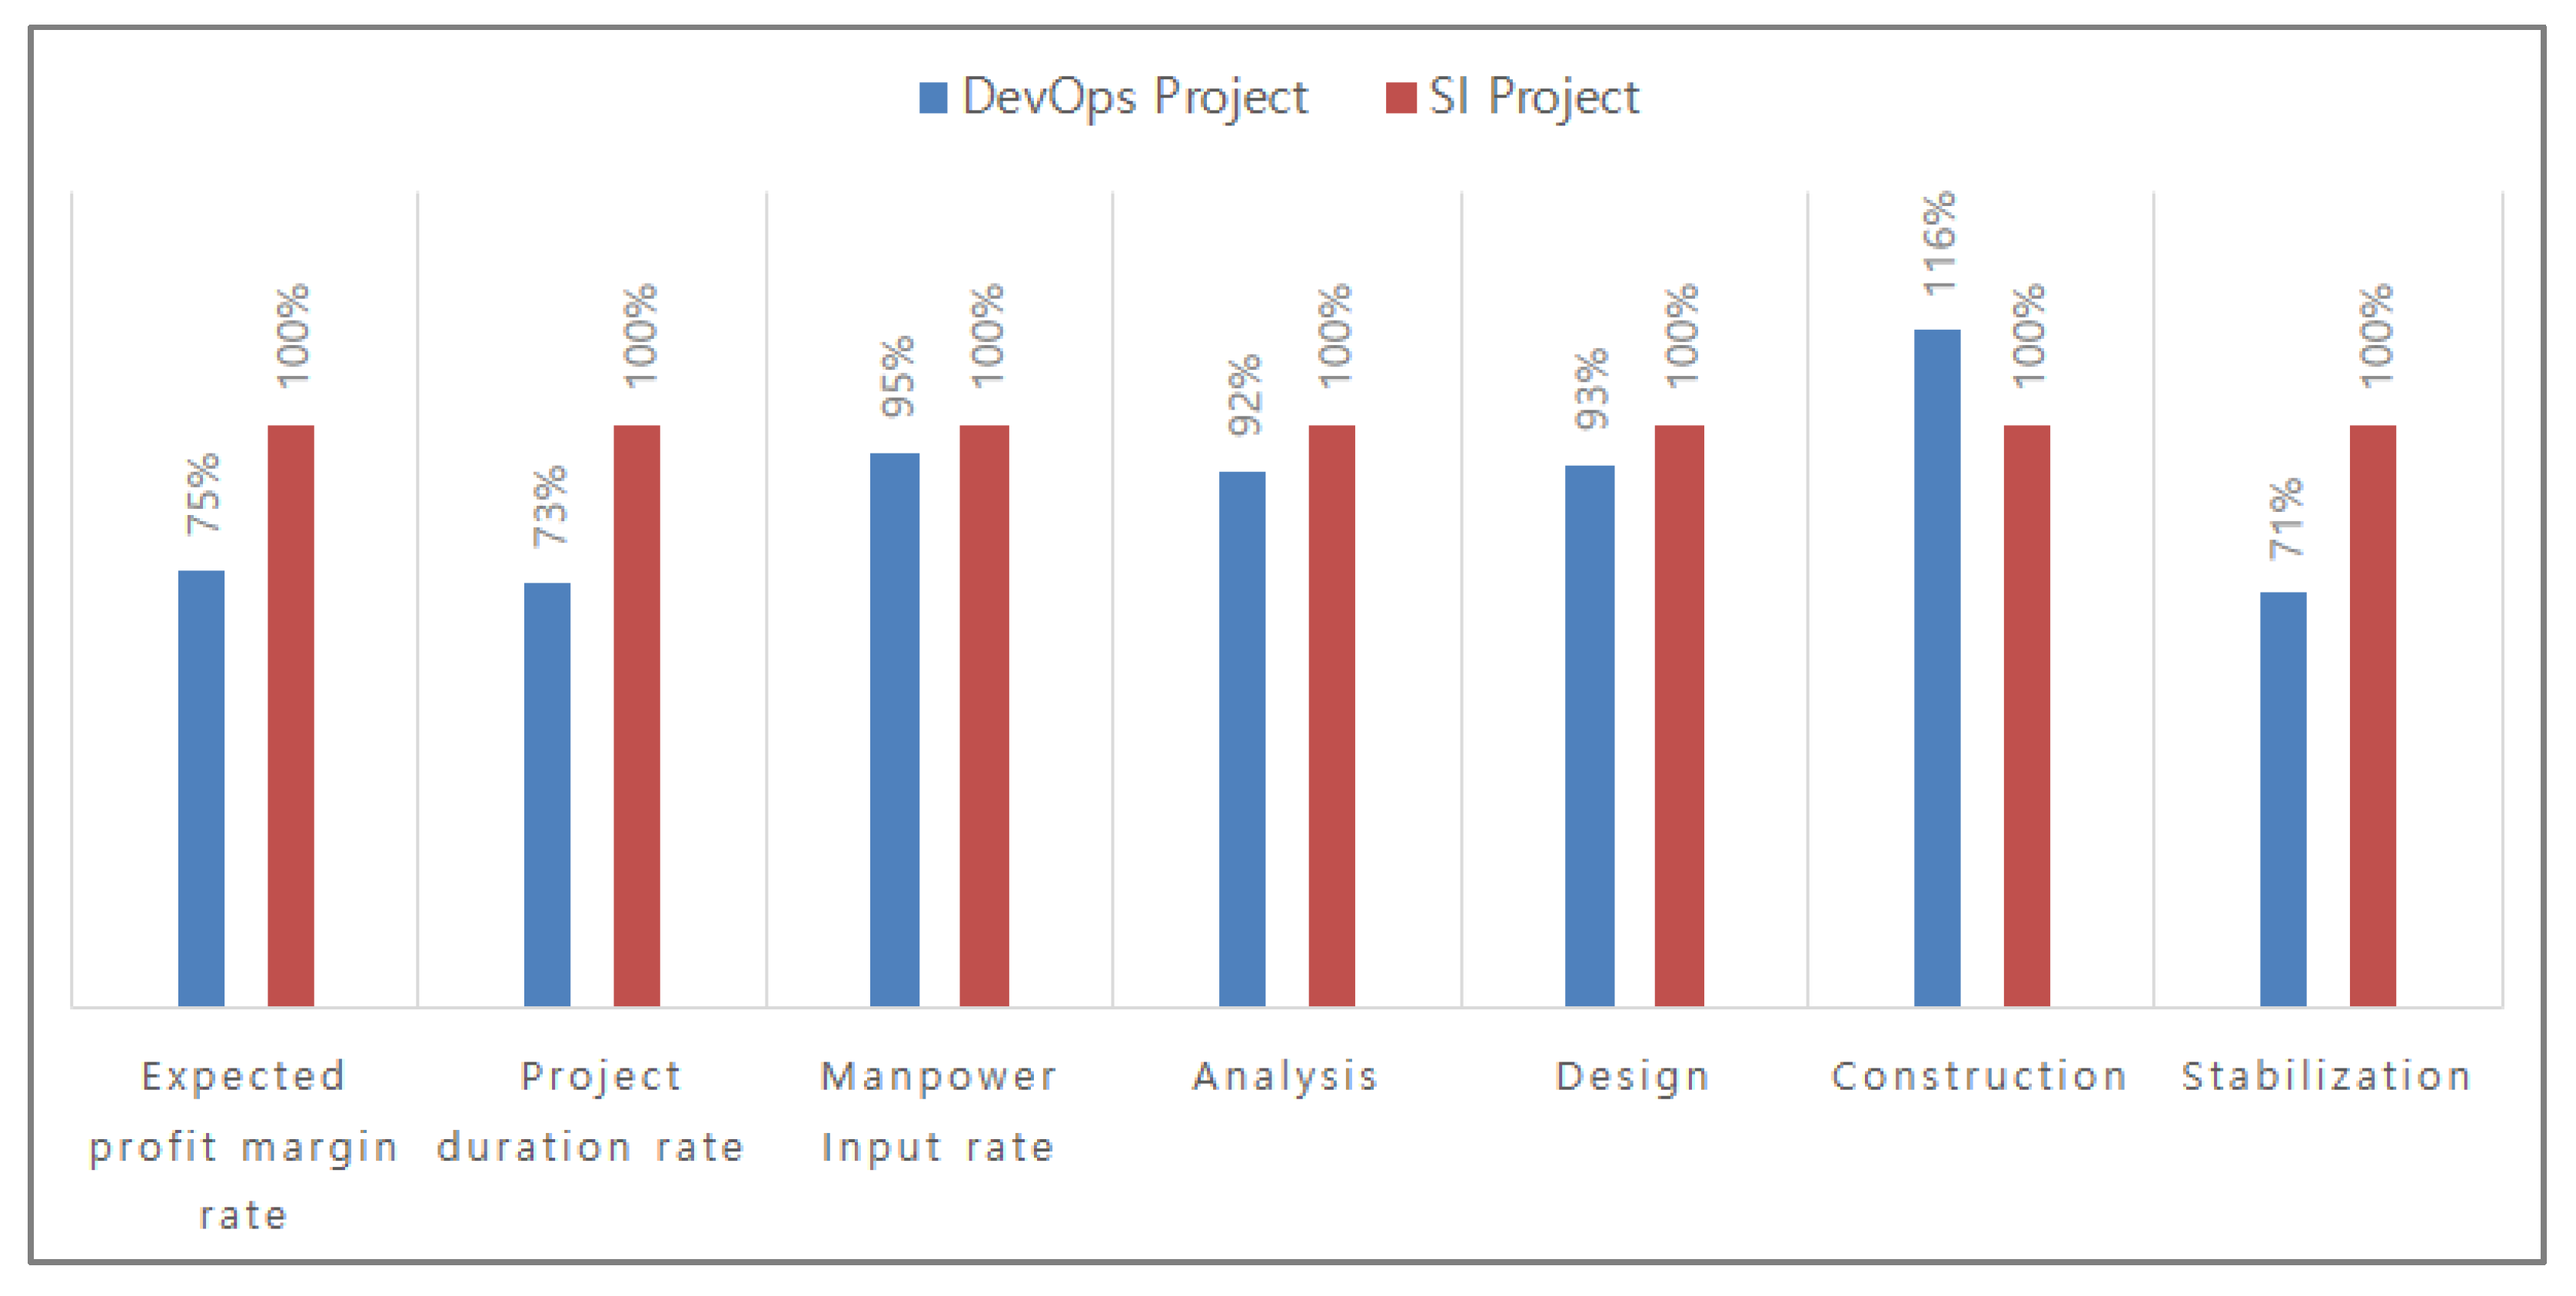
As shown in Figure 16, the execution profit margin of DevOps projects was higher by about 57% on average at the time of project completion compared to SI projects while the actual execution cost during the project period was lower by an average of 17%. The difference in the workforce input cost was not high (5%) but it was higher as well. Also, during the construction phase, the DevOps projects used about 17% more workforce than the SI projects but in the stabilization phase, the input was relatively low (29%). Although there were some differences in the analysis and design phases, the t-test has confirmed that the differences in the analysis phase (8%) and the design phase (7%) are not significant enough. In conclusion, DevOps projects use lower costs and offer more efficiency than SI projects. Also, the former inputs the workforce at a higher rate for construction but the latter uses more workforce in the stabilization phase and such results have been proven to be statistically significant. It is possible to assume that the reason for such differences between two types of projects is that there are many small-scale projects such as improvement projects during the operation stage for DevOps projects but for the SI projects, most of them are newly contracted projects or long-term projects. Further, for the DevOps projects, the existing operating personnel usually participate in the project such that the accuracy of analysis and design can be high enough to construct the system reliably with lesser workforce than the SI projects may require.
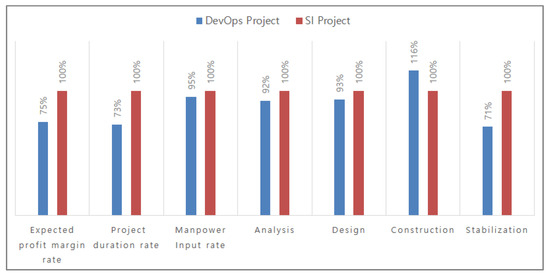
Figure 16.
Comparison of Verification Items by Project.
4. Worker’s Positional Management and Security Reinforcement Scheme Test Bed in Smart Factory Using Industry 4.0-Based Bluetooth Beacons
A Bluetooth beacon system configuration and the position of the Wi-Fi device are being in Figure 17. A series of smart devices or equipment are installed throughout the factory to control overall facility operations involving raw material flow, stock/products management, as well as an understanding of current supply and demand status. Based on the Bluetooth signals, the smart device determines the locations of beacons to estimate their distances from the device. The error range in the distance calculation is about 3 m, and the measurements can be taken for distances from 50 m to 70 m when there are no obstacles, or up to 30 m otherwise. A worker’s exact location can be determined this way.
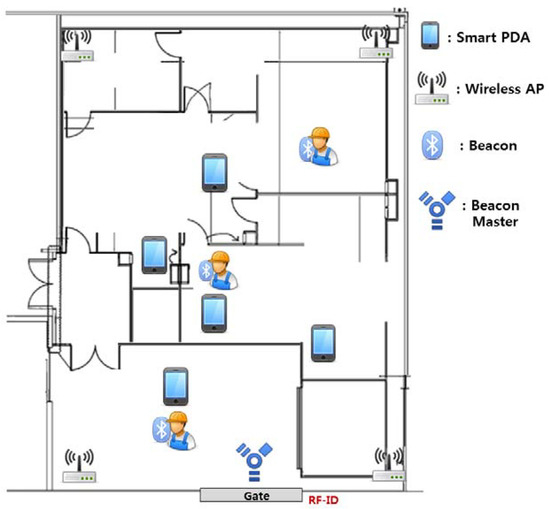
Figure 17.
Bluetooth Beacon System Configuration and Location of Wi-Fi Devices Following Structure of Factory.
The signals originating from the smart device or beacons are stored in the central server at intervals of 3 s, and if a worker has been found in a restricted zone, a warning will be sent to both the worker and the safety manager simultaneously through SMS or E-mail. Also, when a worker tries to log on to a smart device or equipment to initiate operational control, his/her ID signal will be checked by the server and only a device/equipment located within 3 m (i.e., the distance from the smart device to the beacon) will recognize and accept the worker. After the task has been completed and the worker leaves the 3 m range, he/she will be automatically logged off such that others will not be able to resume control. Such a real-time positioning system can be used to analyze and plan the most efficient worker traffic in the factory.
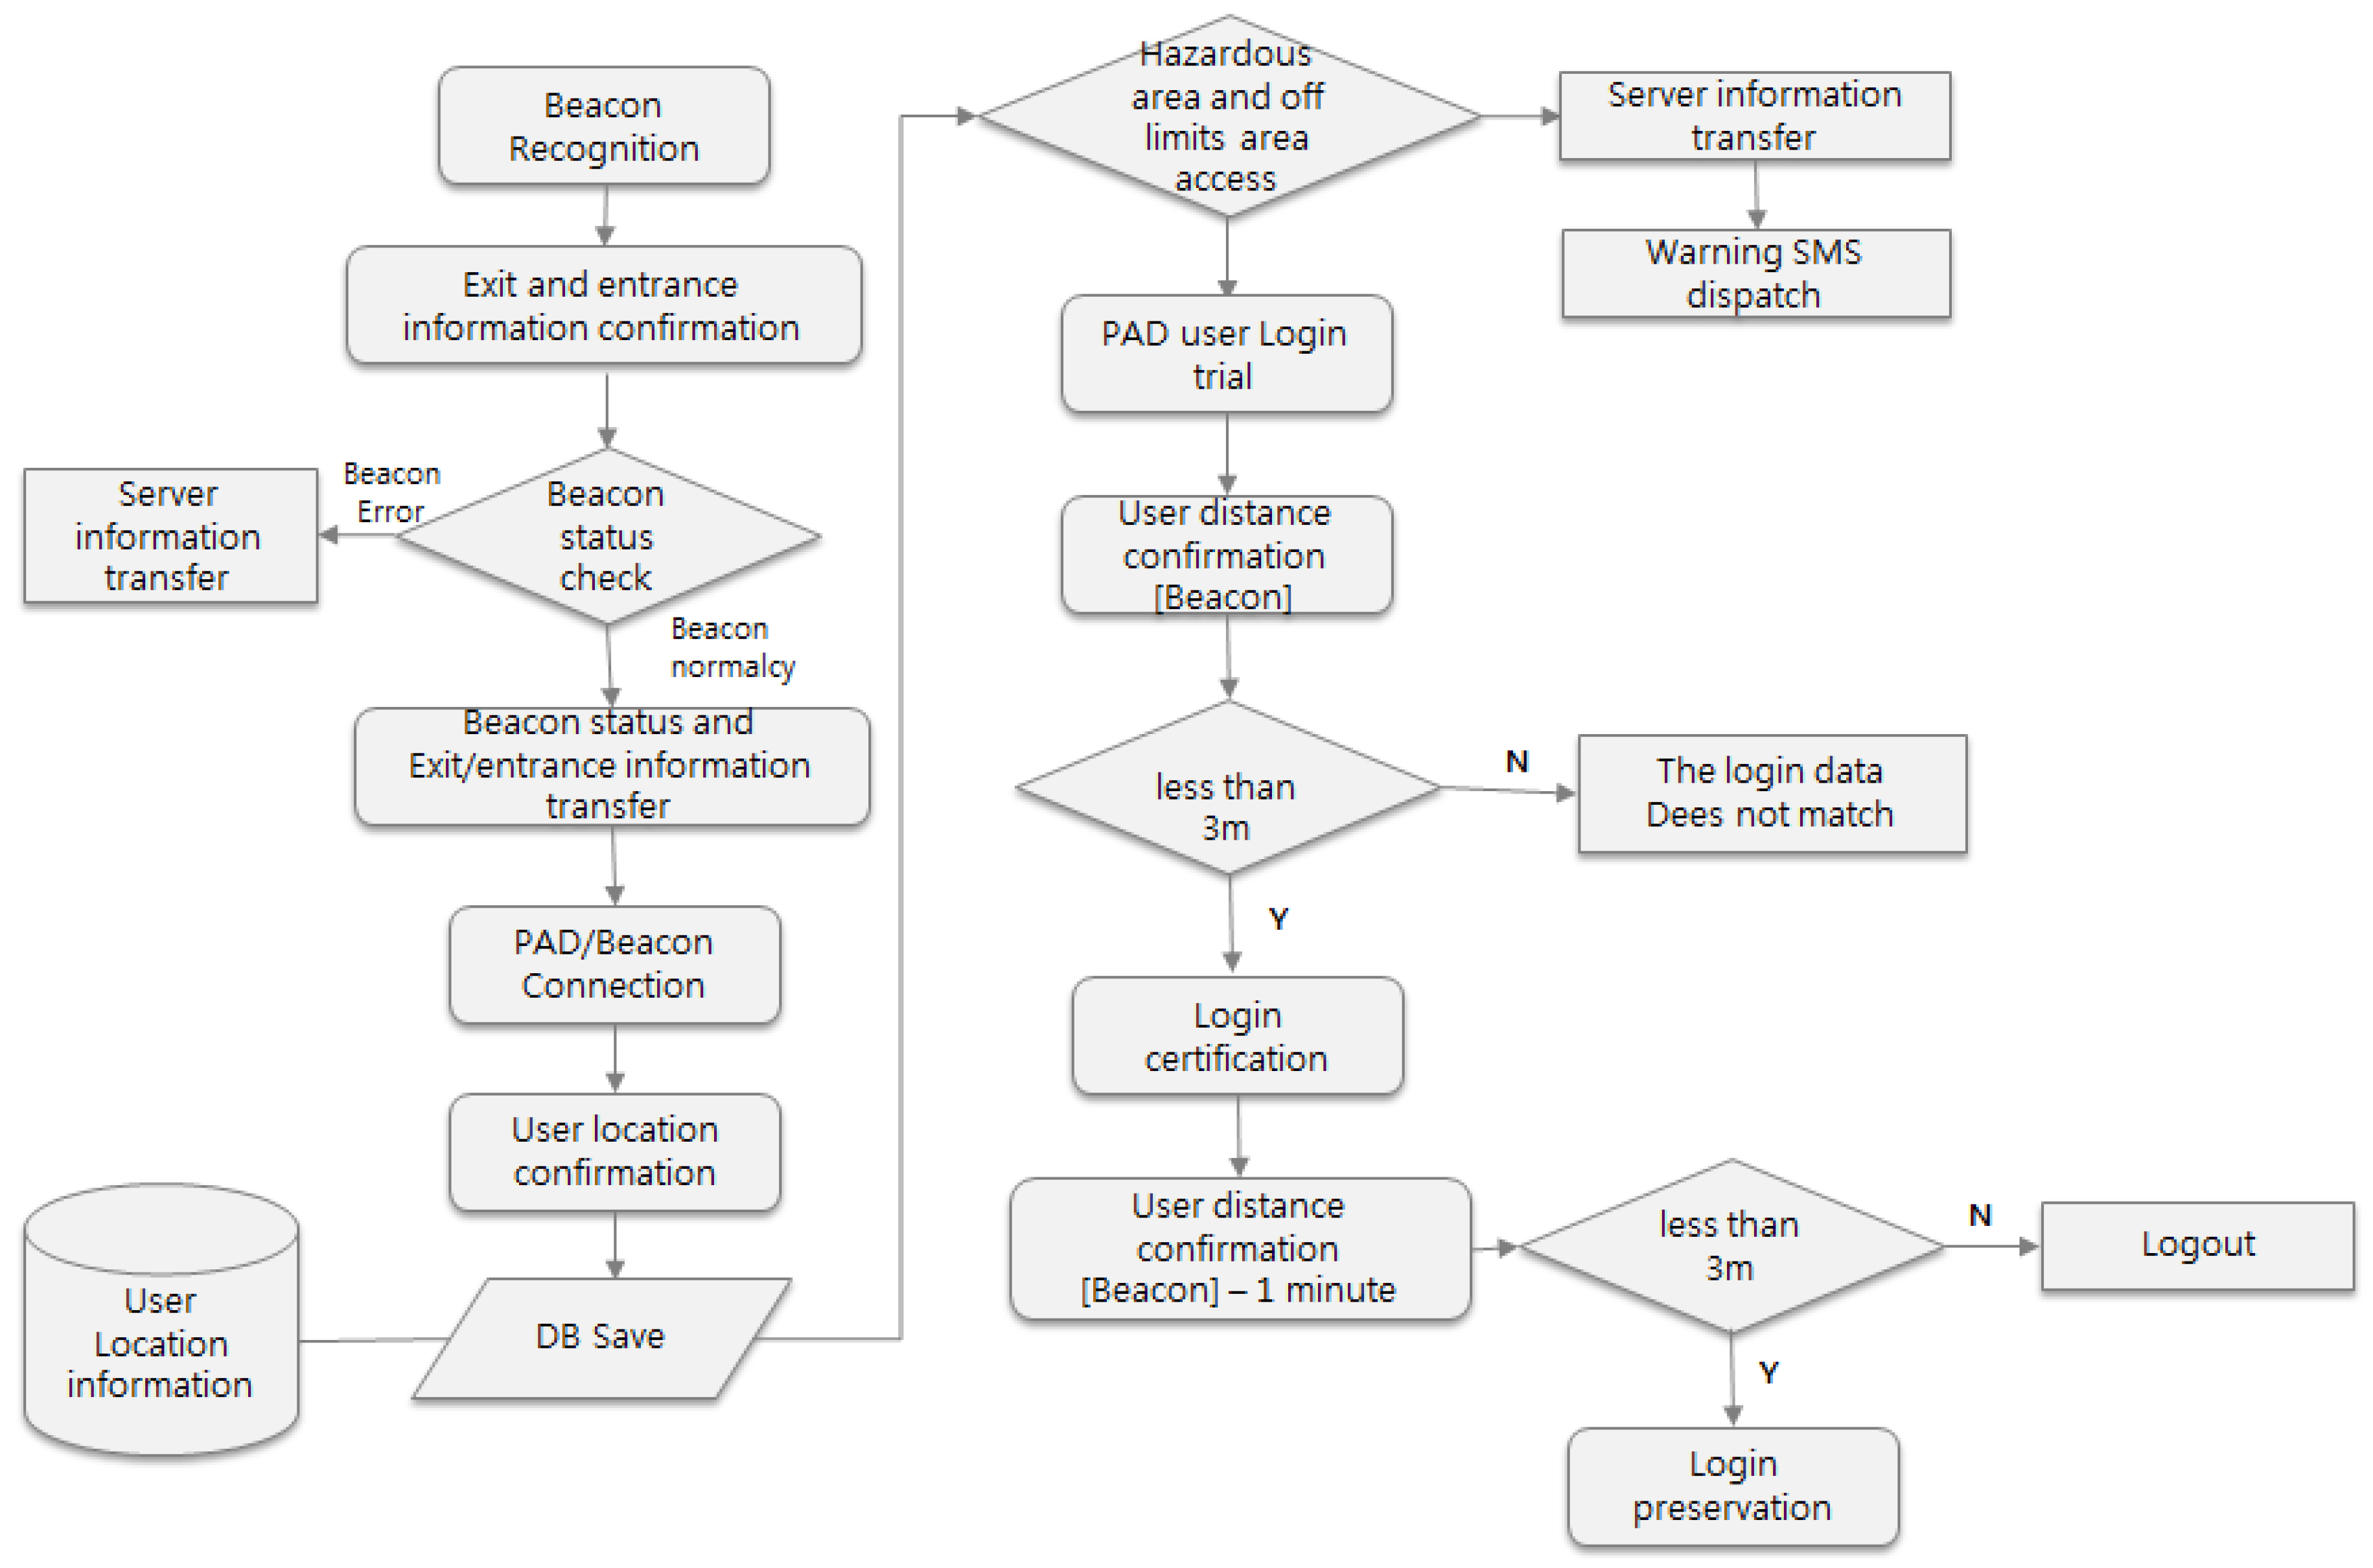
Moreover, the factory manager will be able to perform rescue and accident control immediately when there is an emergency. Workers’ positions and their numbers will be determined for further measures. Figure 18 describes the algorithm developed for the security validation and warning system. The workers’ beacon signals will be checked when they access the factory facilities. The voltage level, beacon ID, RFID, and signal strength of each beacon are checked for analysis by the server so that if the worker has been allowed to access any of the factory facilities in normal working hours, he will be accepted; otherwise, he will need to get special approval. As the current positions of the workers are continuously transmitted to the server through a portable device and the beacons are connected to various smart devices/equipment, the beacon manager can estimate the distances and other necessary data. The position data is then accumulated at the server to generate statistics useful in determining the most efficient worker traffic. If the workers attempt to approach or enter a certain restricted/unauthorized area, a warning SMS will be sent to the worker and the safety manager with alarms.
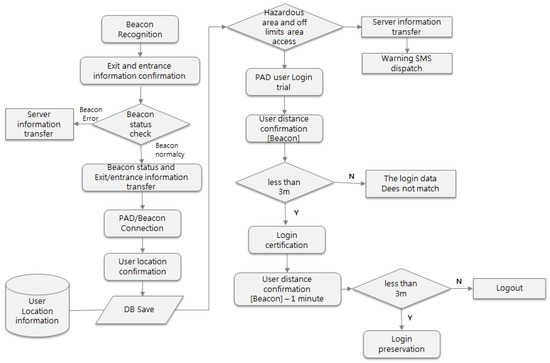
Figure 18.
Algorithm for Worker’s Security Validation and Warning Mechanism.
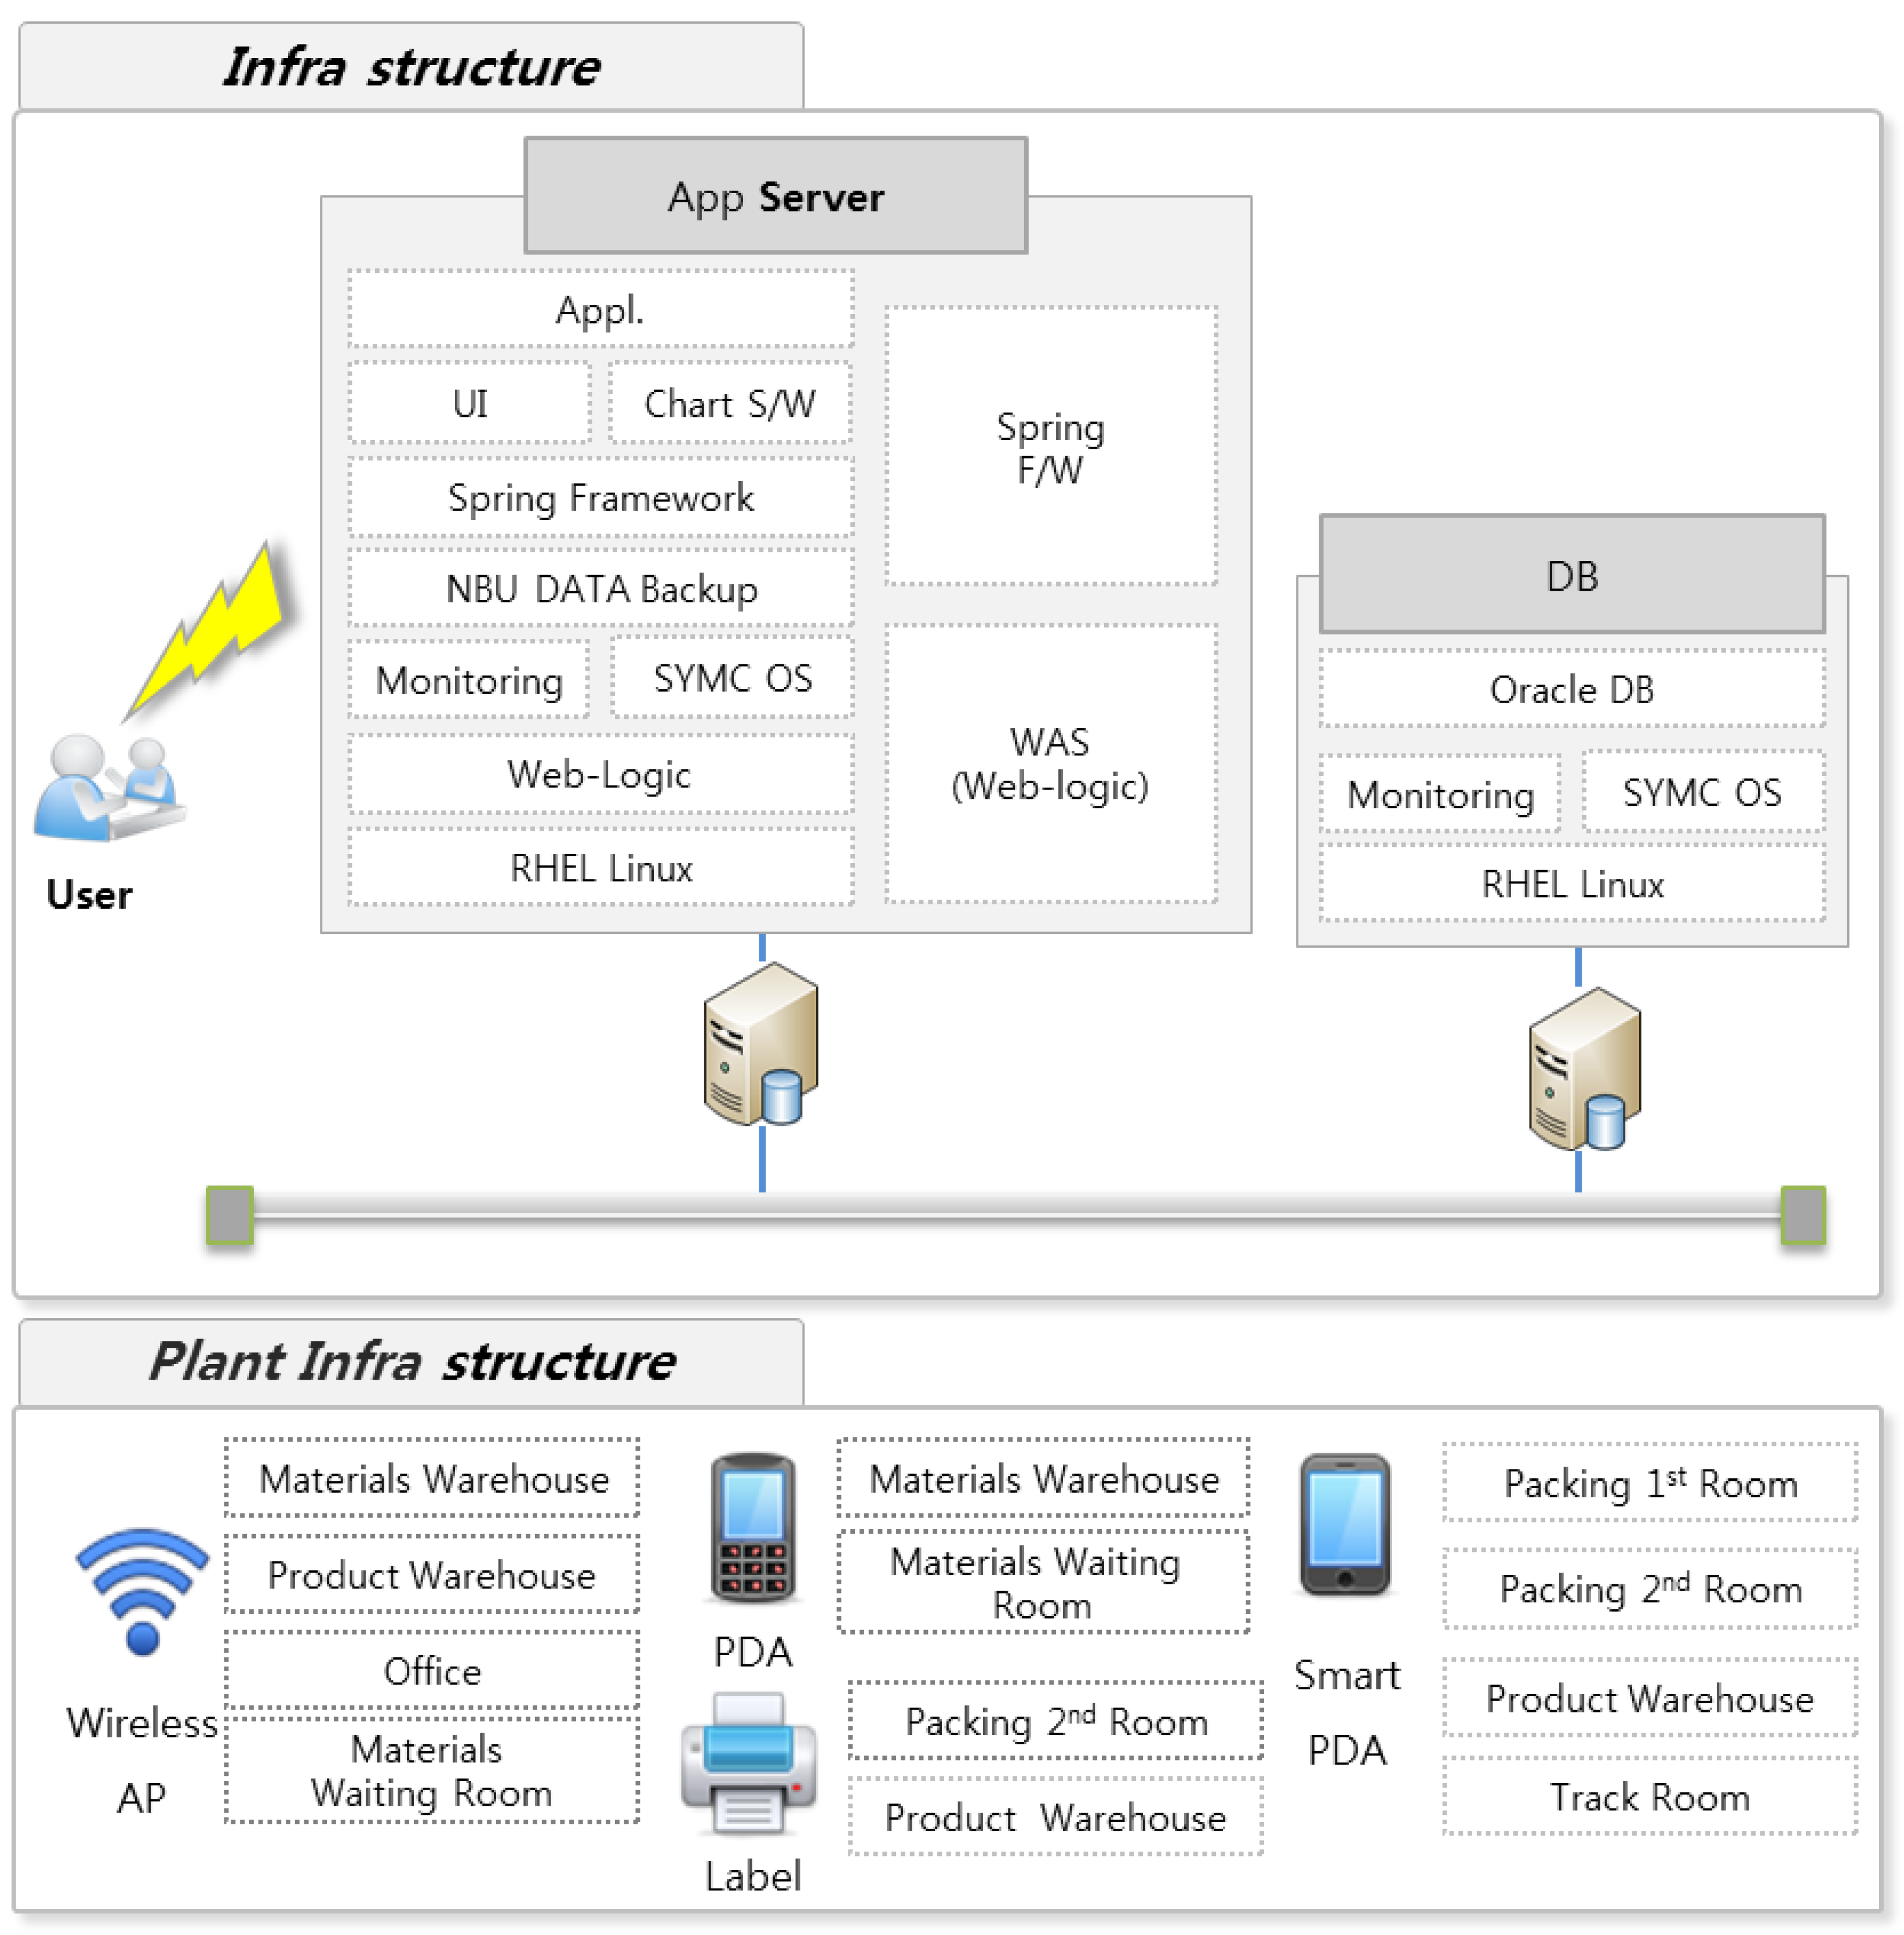
The distance between the worker and the beacon is calculated when a worker tries to log on to a smart device, and if the calculated distance remains within the range of 3 m, he/she will be accepted. However, if there is no signal communication between them, the smart device will repeat the distance calculation at an interval of 1 min. Also, if the calculation result exceeds the 5 m range, the smart device will cease its operation or stay logged in otherwise. As an example, Figure 19 shows an overall production system configuration for the chemicals used to produce semiconductors. The final products are double-packed and delivered to the customers. The primary production process includes solution-mixing and concentration control with 3 or 5 filters while the final process deals with packing, labeling, and wrapping with a sun-blocking film. These products in boxes are then loaded onto pallets and stored in the warehouse waiting for delivery. The packing style will change according to each customer’s requirement. The production line is cleaned once the production task has been completed. Although volumes of required raw materials are rather small in quantity, they should be applied in exact quantities and kept under strict control, separating them into minimum packing units. The quality inspection process is conducted in three steps: inspection of materials, intermediate products, and final products. In the first step, the qualities and the specifications of raw materials are checked while the accuracy of mixing and concentrations are verified in the second step. Finally, the products are re-checked after filtering has been completed. Figure 20. shows the process of network configuration.
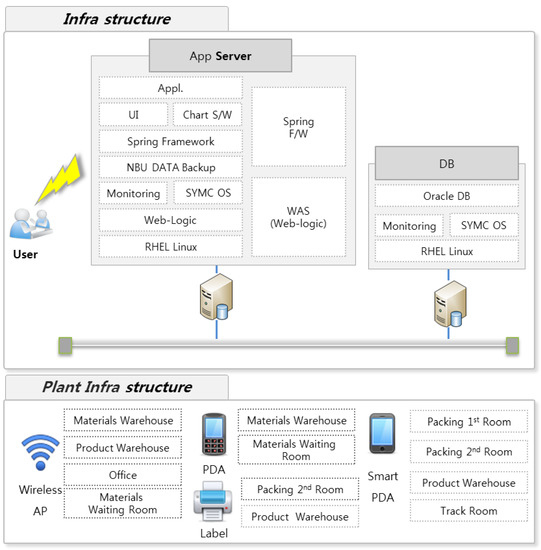
Figure 19.
Infra Structure of Factory.
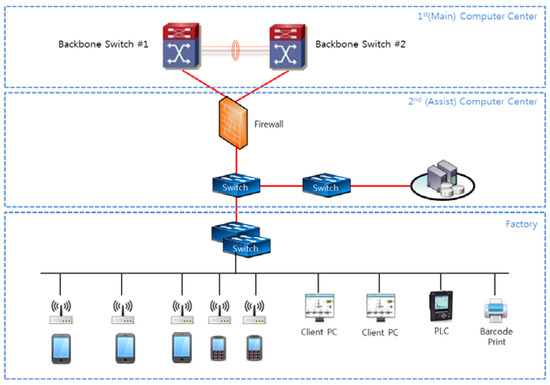
Figure 20.
Process of Network Configuration.
All the data pertaining to the production are then stored under the separate product IDs. Commonly, the greater part of the production facilities management process is carried out with a touch-screen device connected to the PLC network. However, such a device usually provides information about a single facility so that it is inconvenient when performing other tasks simultaneously or during maintenance. It will be quite useful or efficient to use a portable smart PAD (Personal Digital Assistants) when dealing with some problems in the factory where the least amount of pollutants can affect the production process seriously.
Figure 21 describes the system configuration. Workers can be protected in a smart environment by replacing the PC controlling the factory facilities with a smart PAD. By attaching a Bluetooth beacon on the back of an employee card, the distance between the beacon and the smart PAD is estimated but if the smart PAD is not available, a beacon repeater will estimate the distance to let the server determine the location of a specific worker. When a worker approaches a hazard or an unauthorized area, a warning message will be sent to the worker him/herself as well as the manager by SMS. This is to determine an optimal operation traffic line by studying worker’s traffic flow. The log-in can be achieved only when the distance between the smart PAD and the beacon stays within the range of three meters.
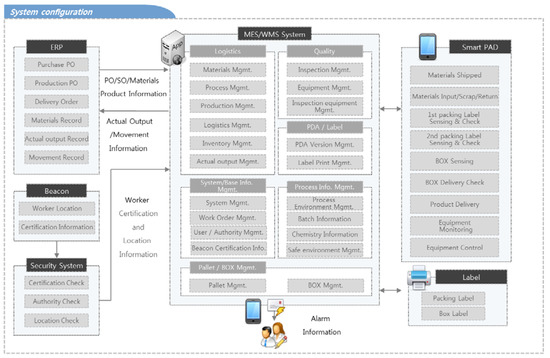
Figure 21.
System Configuration of the Smart Factory Using Smart PAD.
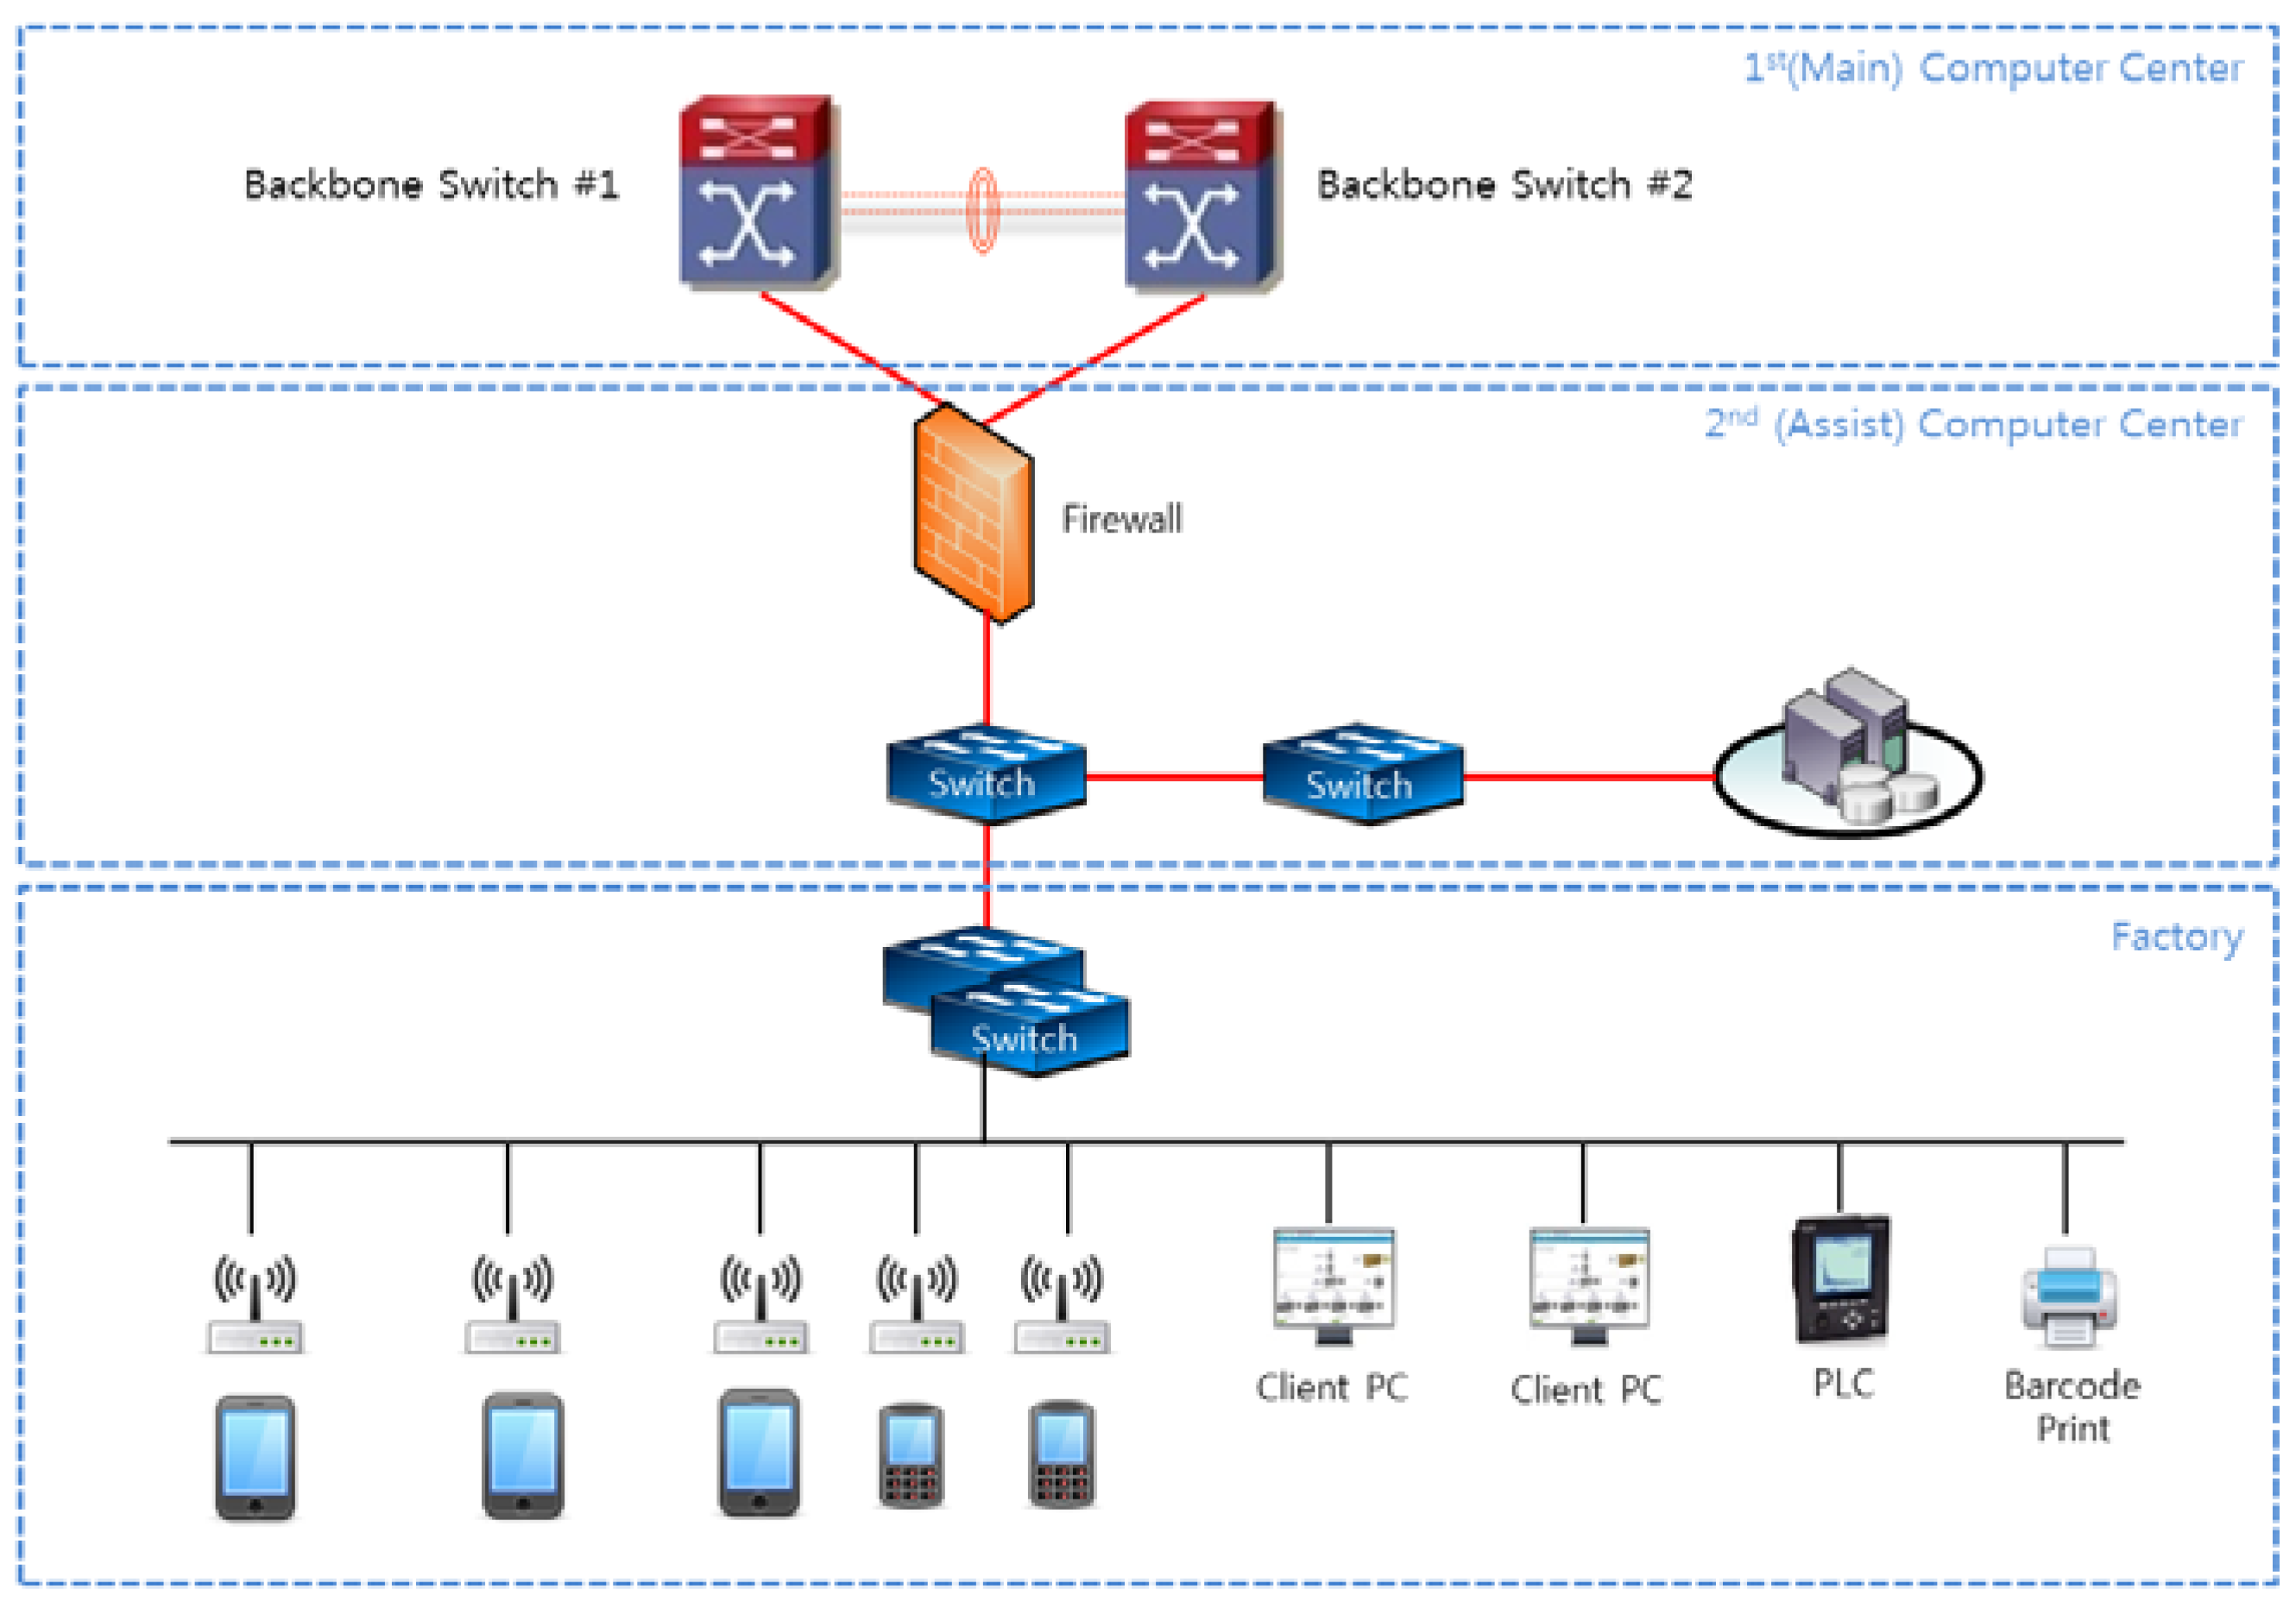
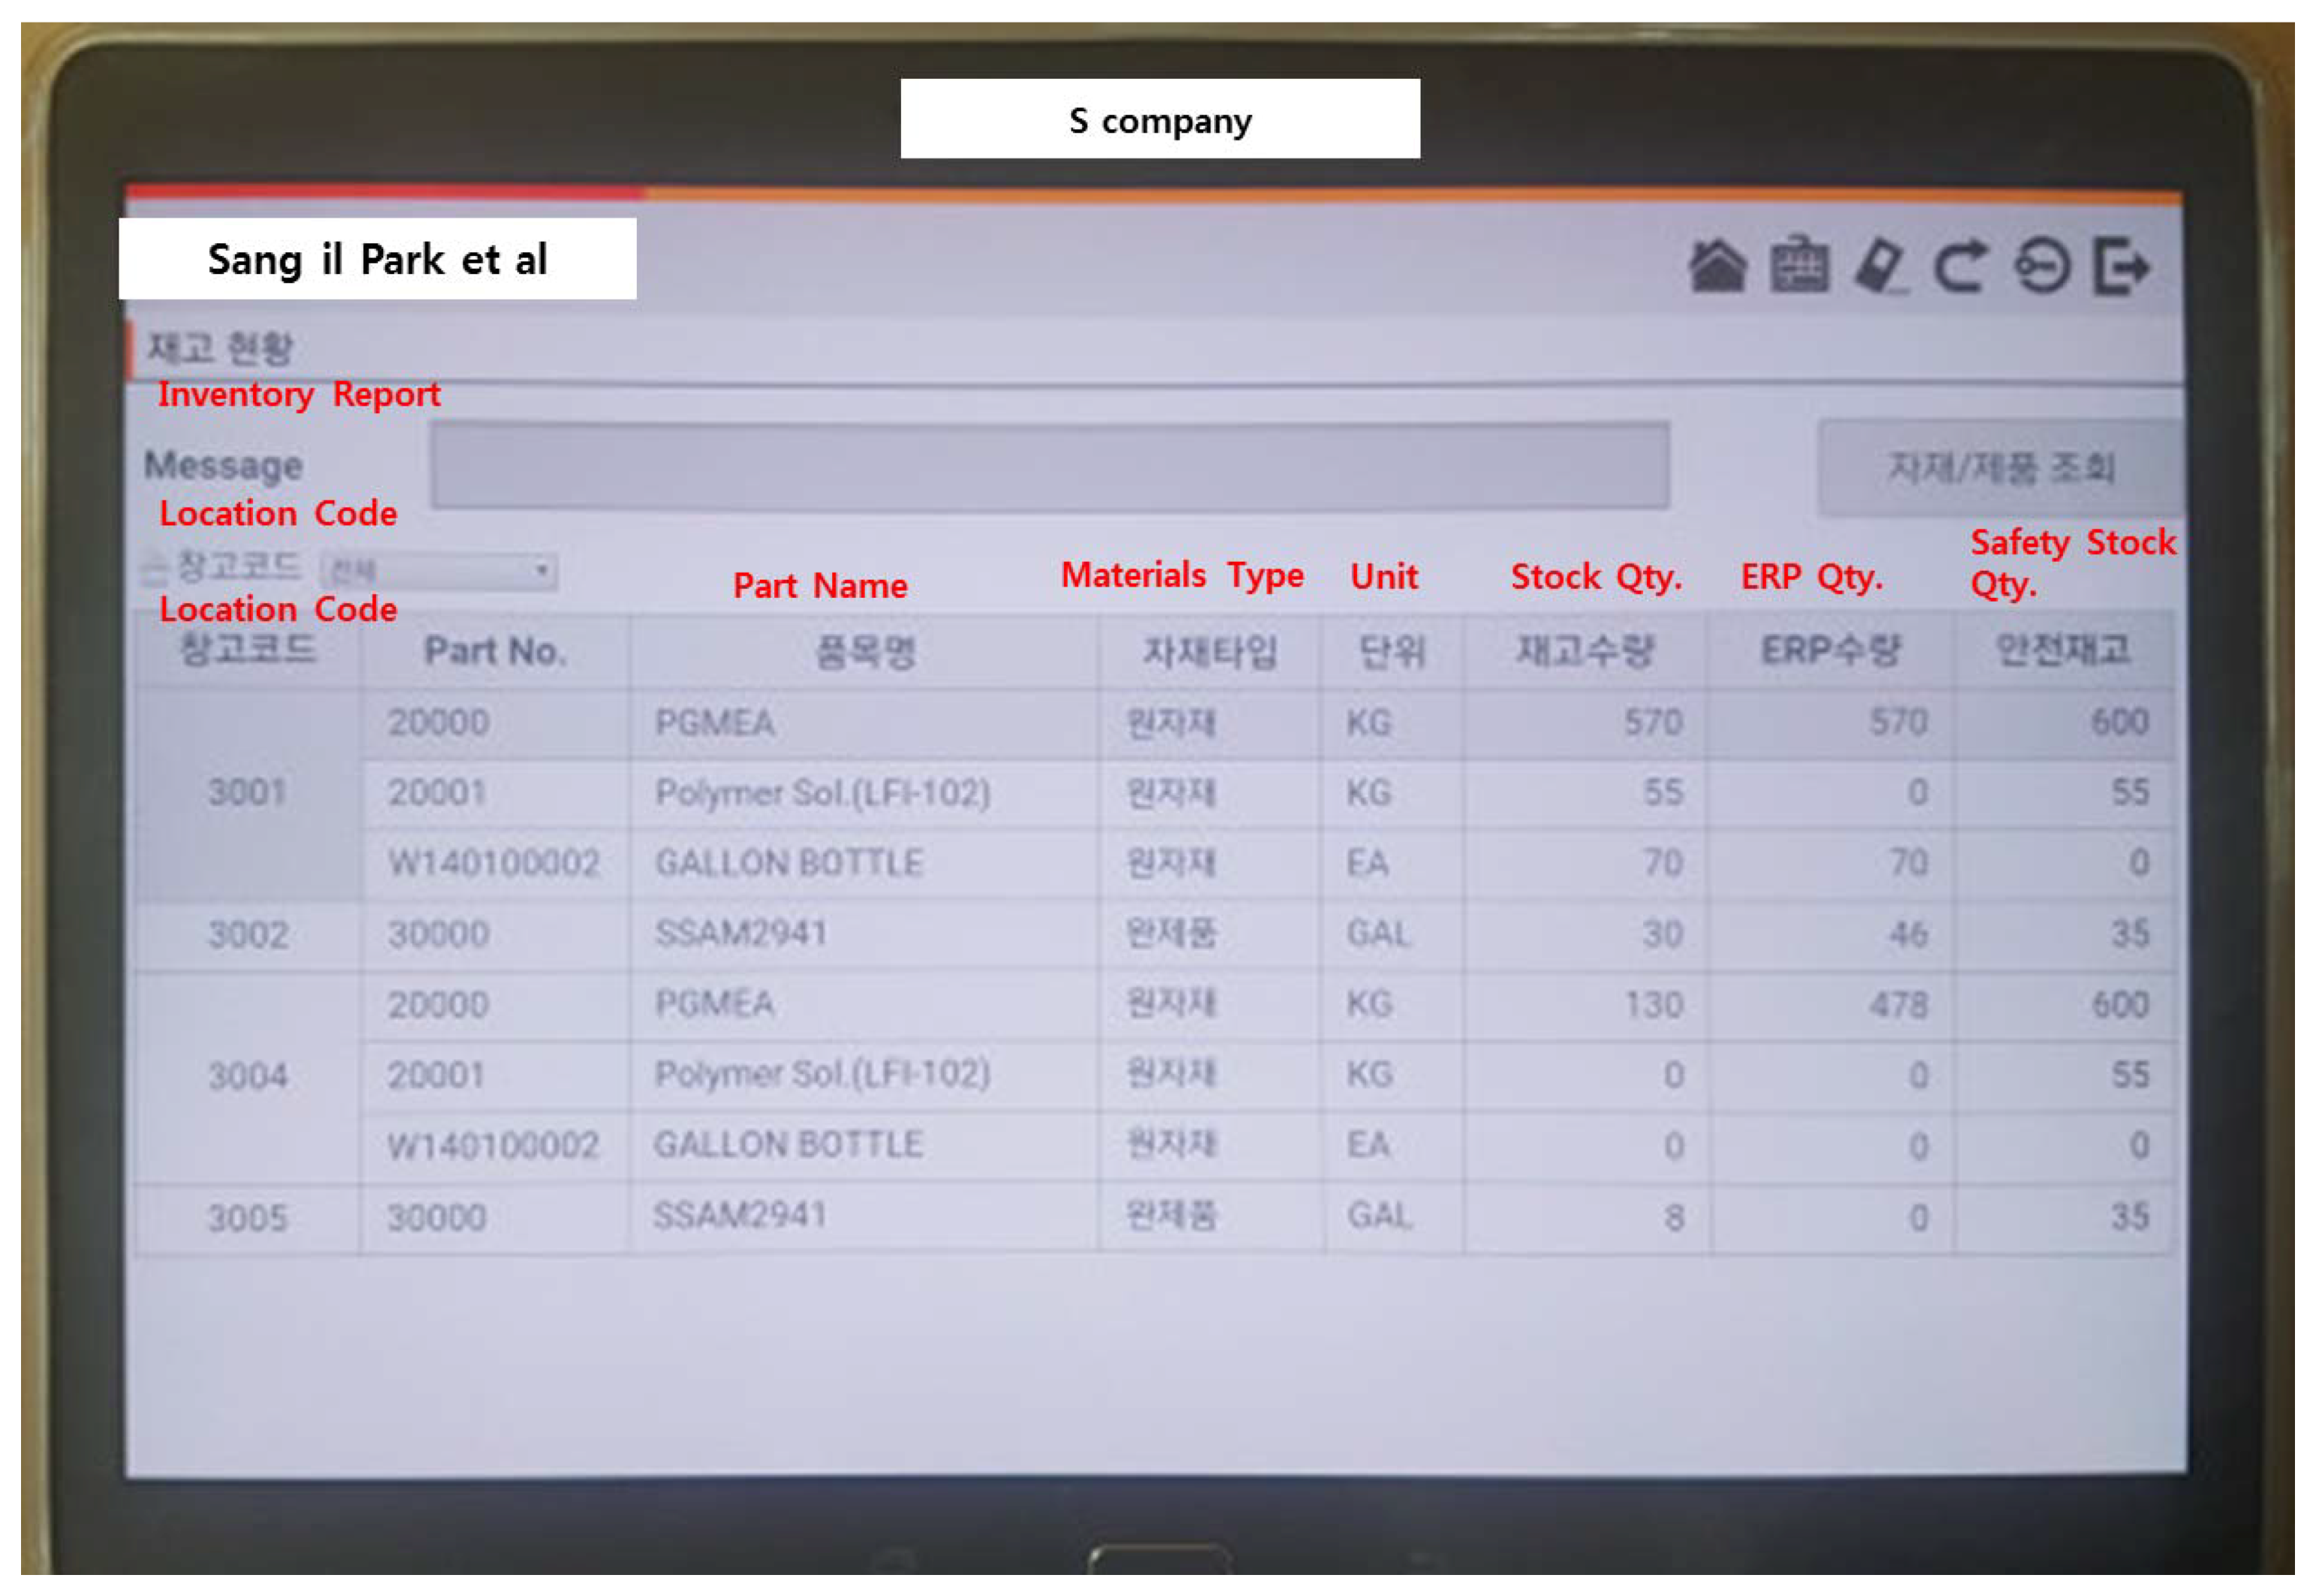
A Smart Factory security management system using a series of Bluetooth beacons has been designed for this study using Java spring. The system is divided into two parts (i.e., a Web UI (User Interface) for MES/WMS and an Android UI for smart PAD). The production information is stored in the Oracle RDBMS (Relational Data Base Management System) along with each worker’s location data. The factory adopts an independent internal network (Factory Area/FA network) that does not have any links with external systems or networks. Also, the wireless equipment/devices (e.g., Smart PAD, Client PC, PLC devices, PDA, and barcode printer) must have a security setting so that all of them must register their MAC (Media Access Control) addresses to access the FA network. The data processing room is connected to the factory network first via firewall and then to the office network (OA network) to physically avoid external influences that could be dangerous to the factory control facilities and information network. This type of structure could also increase the network speed as well. Figure 22 below shows the network configuration.
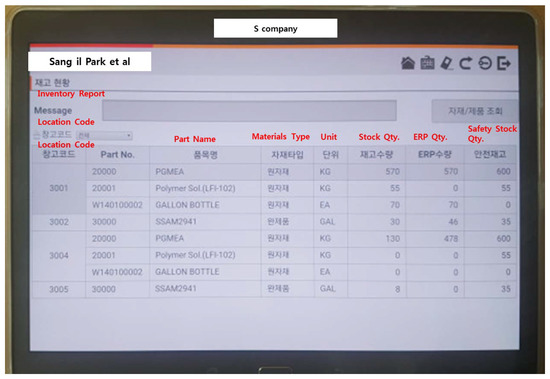
Figure 22.
Taking Inventory of the Smart Factory Using Smart PAD.
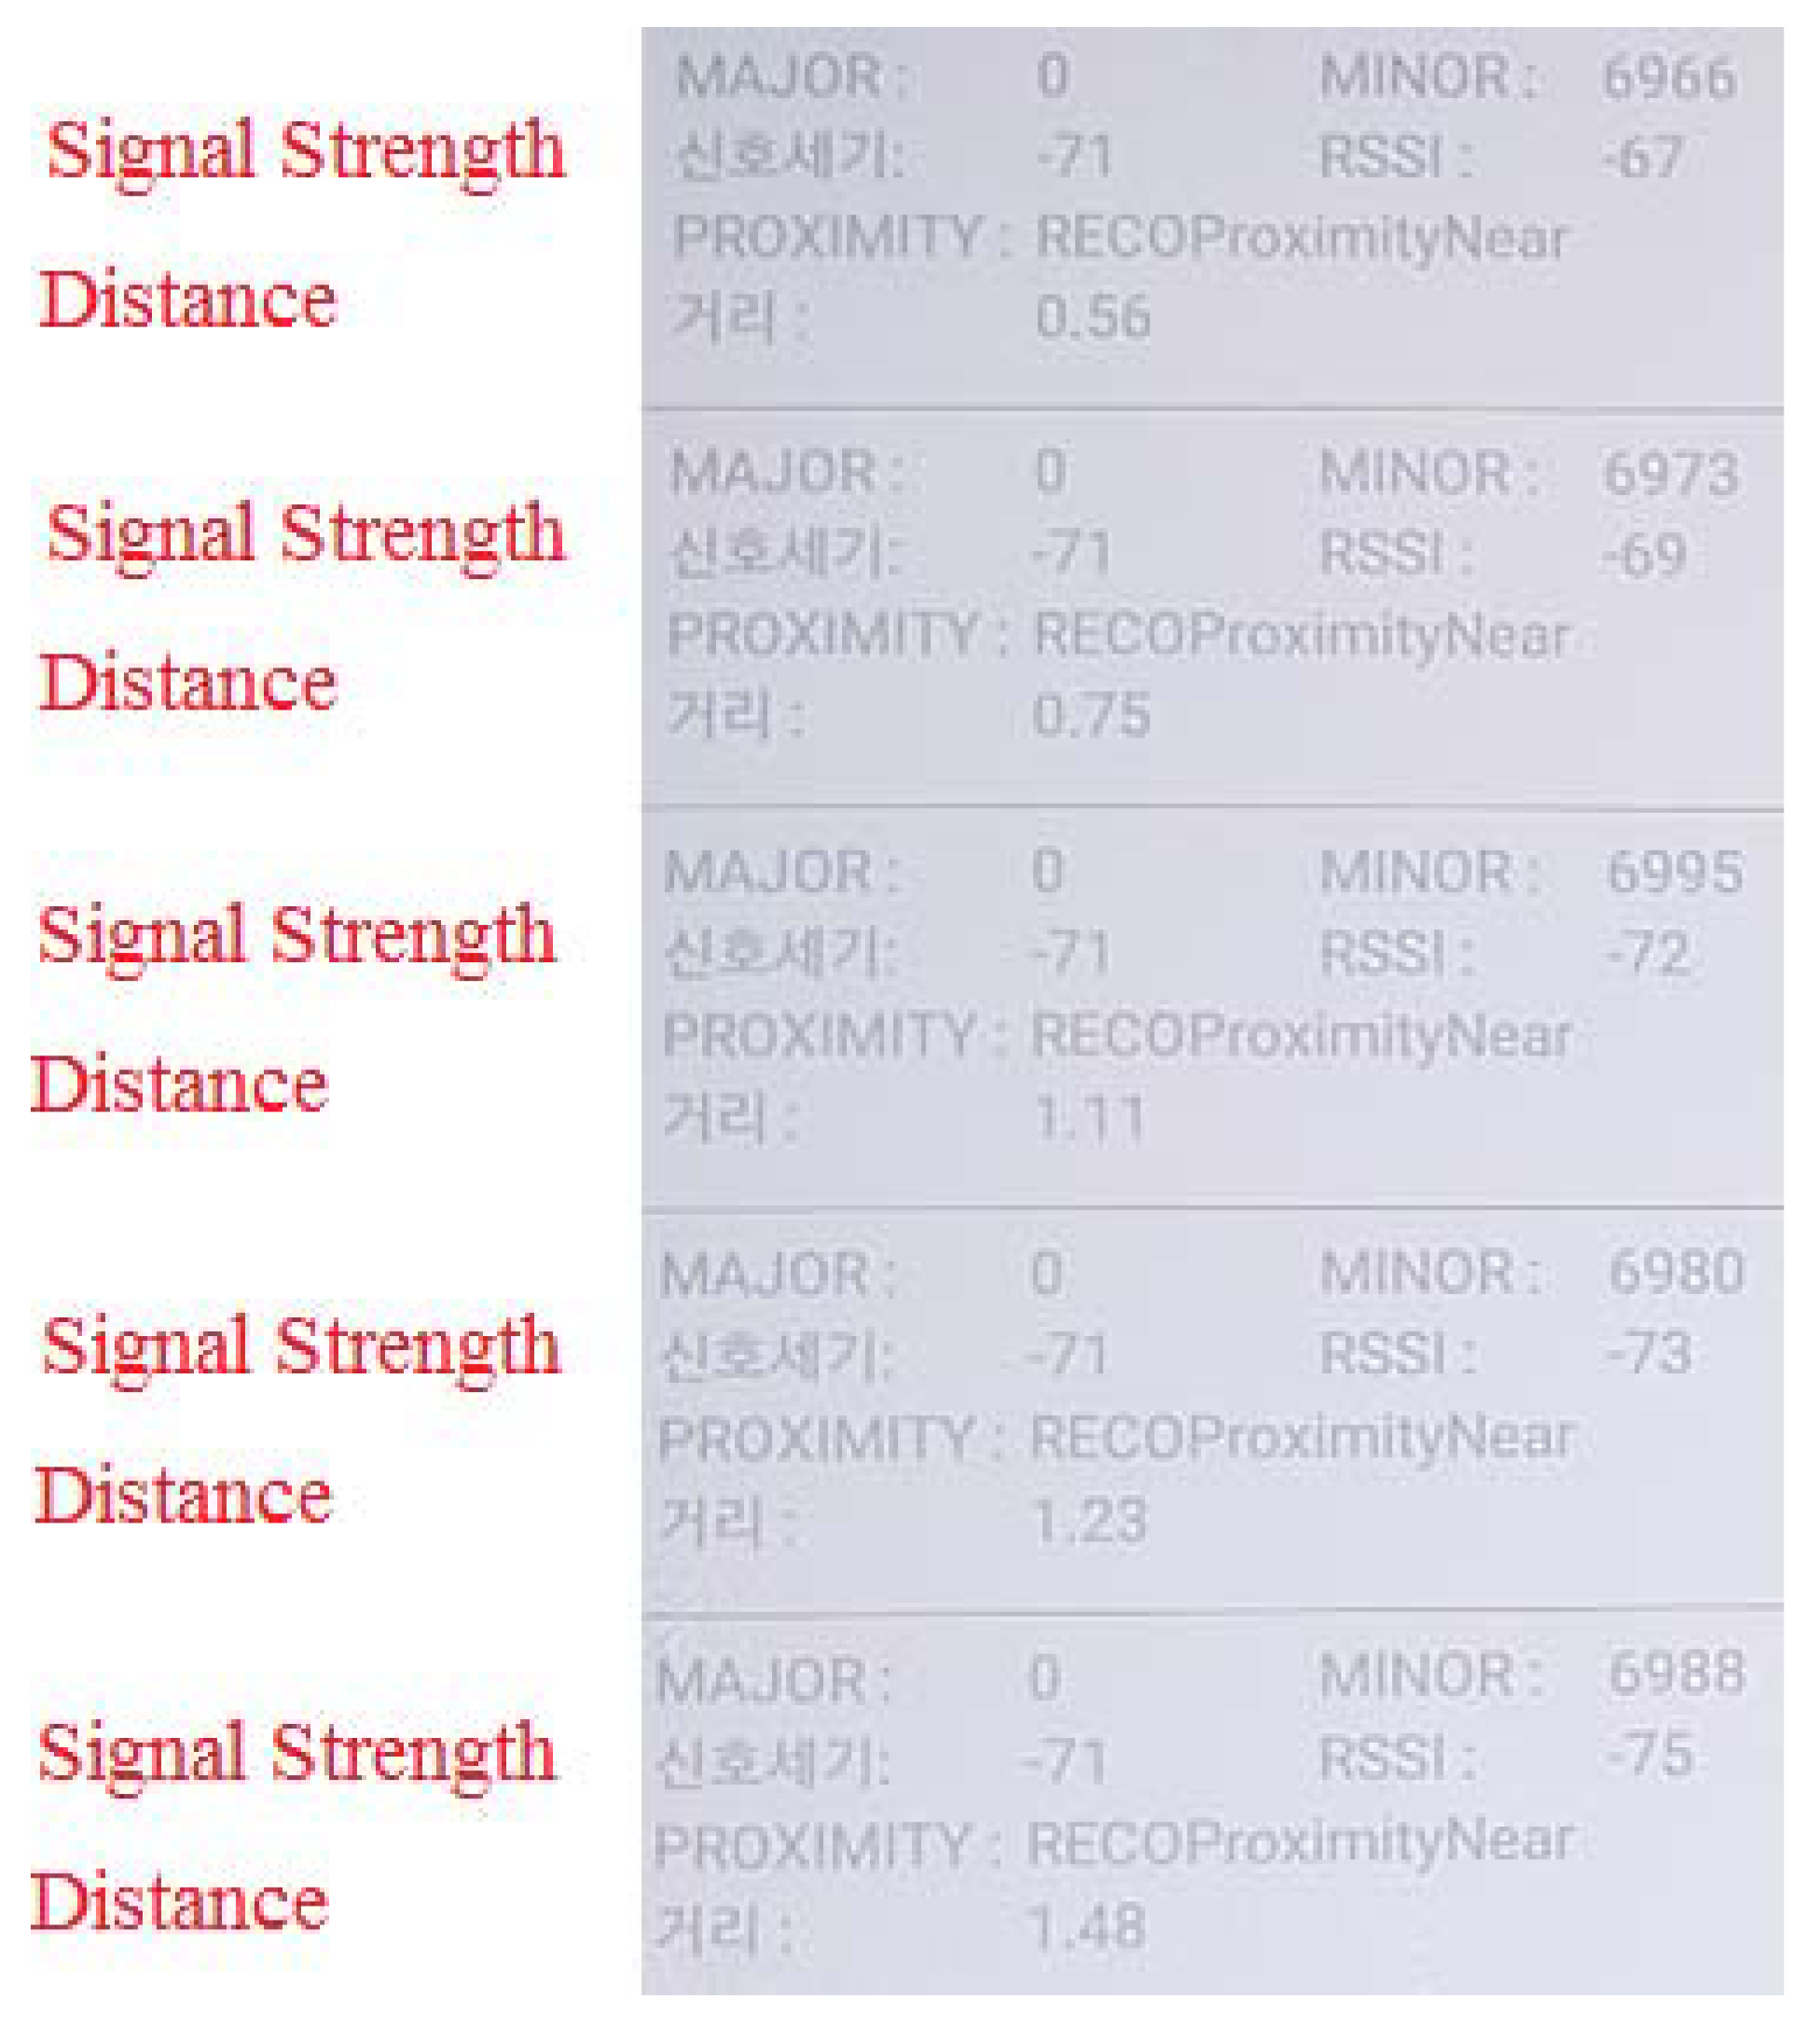
Figure 23 shows the process of tracking each location of the Bluetooth beacon. For authentication, the location will be estimated and for log-in, a calculation is carried out after mapping the distance and the Beacon ID with the user.
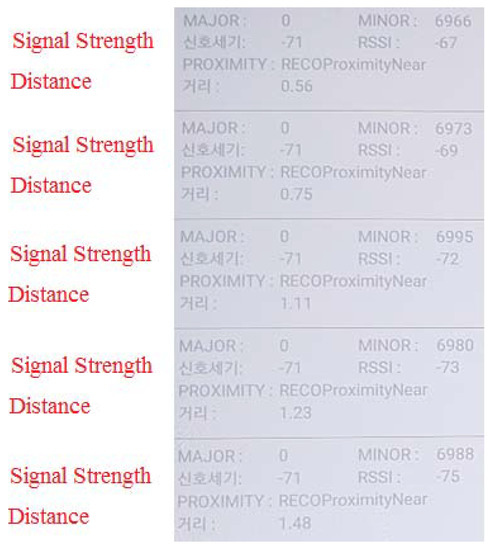
Figure 23.
Process of Tracking each Location of the Beacon.
5. Discussion
IT is playing a vital role in the 4th Industrial Revolution and the related technologies are evolving rapidly. Thus, the operation and project of manufacturing IT should be able to respond to such changes quickly and stably. However, the general IT development methodologies will not be able to deal with the ever-changing situations so that a novel project management method must construct a new reliable manufacturing system which can cover all the current and future IT technologies and manufacturing processes. In that sense, the DevOps method can be quite suitable as an IT operation and system construction project management method in the 4th Industrial Revolution. This research has proven that the project applied with the DevOps method was more effective than the one applied with a common SI method. The 4th Industrial Revolution will impact entire manufacturing, farming, and environment industries which will maintain a close relationship among themselves through organic and systematic communications. In this situation, it is quite clear that IT will increasingly play an important role in the areas where IT services based on the professional skills are demanded. The DevOps can be regarded as a quite interesting method in such an environment considering its possible contribution to the 4th Industrial Revolution, the topic of this special issue. We hope that successful project results can be achieved with the DevOps project management method when carrying out IT projects in this period.
6. Conclusions
The objective of this study was to find a development method which can reliably and rapidly respond to the requirements of manufacturing IT projects following the rapid changes in the manufacturing industry, especially under the influence of the 4th Industrial Revolution. With the existing SI project development method, it is difficult to reflect the improvements until the completion of a project, and the typical operation procedure is not able to accommodate various requirements. Thus, this study compared normal SI projects with DevOps projects, where development and operation are integrated to propose a viable development method suitable to manufacturing IT projects.
From the comparative analysis conducted for the proportions of costs and workforce input, workforce input ratio in each life cycle, and other elements, it has become clear that DevOps projects require less cost and workforce than SI projects but offer more efficiency. Also, DevOps projects use much more workforce in the construction phase compared to SI projects, which put more workforce into the stabilization phase. Such differences have allowed the DevOps development methods to achieve a much higher level of analysis and design which have led to a stable system construction with less workforce.
The manufacturing industry during the 4th Industrial Revolution is expected to change rapidly into a more flexible and efficient form by converging itself with ICT. Keeping the pace with such a change, manufacturing IT should put forth an effort to transform itself to be able to construct fast, reliable, and efficient systems by adopting a development method such as DevOps, which continuously improves projects through repetitive operations and improvement tasks (projects).
Also, by simply wearing a beacon that does not have any complicated application, workers will be able to let the management know where they are. Also, by adopting an independent network, companies can establish their factories anywhere, even in areas far from typical industrial zones. As stressed earlier, smart factories aim to generate a considerable synergy effect in an automated production system by integrating 4M1E. In other words, the major goal of the smart factory is to manufacture products efficiently and consistently through an automated process involving a minimum number of workers and the optimal amount of raw materials and energy with the most effective methods. With such a system, the factory manager will be able to assign a specific task to their workers depending on their positions based on their beacon signals. With the Bluetooth beacon-based worker positioning system, it is possible to deploy an adequate number of workers in different production areas.
It is true that the current manufacturing IT does not employ a complete DevOps method but just allows the operating personnel to participate in a development project or continuously supplement the operation or the development process in terms of software development. Thus, in the future, it will be possible to apply a perfect DevOps method to manufacturing IT projects. Under the DevOps project planned by considering all the IT service resources including hardware, software, network, security, database, and IT project management, such a DevOps method will be able to perform continuous improvement tasks starting from operation to distribution. As such, manufacturing IT projects can be completed efficiently and successfully if the project developers undertake them from the perspective of DevOps.
Author Contributions
Conceptualization, S.P.; Data curation, S.P.; Funding acquisition, J.-H.H.; Project administration, S.P.; Resources, J.-H.H.; Software, S.P. and J.-H.H.; Supervision, S.P. and J.-H.H.; Validation, J.-H.H.; Writing—original draft, J.-H.H.; Writing—review and editing, J.-H.H.
Funding
This work was supported by the National Research Foundation of Korea (NRF) grant funded by the Korea government (MSIT) (No. 2017R1C1B5077157).
Acknowledgments
The first draft of this article was presented in the 11st KIPS International Conference on Ubiquitous Information Technologies and Applications (CUTE 2016) will be held on 19–21 December 2016, Bangkok, Thailand [33].
Conflicts of Interest
The authors declare no conflict of interest.
References
- Park, Y. Research of the Effect on Project Result by Human-Resources for Each Phase of SI Project. Master’s Thesis, Korea University, Seoul, Korea, 2015; pp. 1–43. (In Korean). [Google Scholar]
- Stackpole, C.S. A User’s Manual to the PMBOK Guide; John Wiley & Sons: Hoboken, NJ, USA, 2013. [Google Scholar]
- Yong, H. Research of the features of SI Project Planning and Controlling Processes Using PMMM. Korea Inf. Process. Soc. 2011, 1, 1–43. (In Korean) [Google Scholar]
- Seokju, L. Project Success 2597; Beomhan: Changwon, Korea, 2016; Volume 1, pp. 1–67. (In Korean) [Google Scholar]
- Kim, T. PMO Research to Recognize the Success of the Project on Software Industry. Master’s Thesis, Korea University, Seoul, Korea, 2010; pp. 1–22. [Google Scholar]
- Bae, J.; Kim, J.; Kim, S. An Exploratory Study on the Project Performance by PMO Capability. Asia Pac. J. Inf. Syst. 2008, 18, 55–77. [Google Scholar]
- Kim, M.; Lim, B.W.; Lee, J. A Study on the Project Governance and the Project Performance. Korea Soc. Ind. Inf. Syst. 2008, 13, 115–131. [Google Scholar]
- Lee, S.; Yong, H. Design and Evaluation of Agile Framework for Small Projects. J. KIISE JOK 2009, 15, 851–855. [Google Scholar]
- Kim, J.; Kim, T. SI Industry Trend Report 2002; Korea software Technology Association: Seoul, Korea, 2002. (In Korean) [Google Scholar]
- Choi, S. Smart Industry System; BubBook: Seoul, Korea, 2016; Volume 1, pp. 1–37. (In Korean) [Google Scholar]
- Eagle, N.; Pentland, A. Social serendipity: Mobilizing social software. IEEE Pervasive Comput. 2005, 4, 28–34. [Google Scholar] [CrossRef]
- Lu, M.; Chen, W.; Shen, X.; Lam, H.C.; Liu, J. Positioning and tracking construction vehicles in highly dense urban areas and building construction sites. Autom. Constr. 2007, 5, 647–656. [Google Scholar] [CrossRef]
- Zhu, J.; Zeng, K.; Kim, K.H.; Mohapatra, P. Improving crowd-sourced Wi-Fi localization systems using bluetooth beacons. In Proceedings of the 2012 9th Annual IEEE Communications Society Conference on Sensor, Mesh and Ad Hoc Communications and Networks (SECON), Seoul, Korea, 18–21 June 2012; pp. 290–298. [Google Scholar]
- Chang, Y.J.; Chu, Y.Y.; Chen, C.N.; Wang, T.Y. Mobile computing for indoor wayfinding based on Bluetooth sensors for individuals with cognitive impairments. In Proceedings of the 2008 3rd International Symposium on Wireless Pervasive Computing, Santorini, Greece, 7–9 May 2008; pp. 623–627. [Google Scholar]
- Kajioka, S.; Mori, T.; Uchiya, T.; Takumi, I.; Matsuo, H. Experiment of indoor position presumption based on RSSI of Bluetooth LE beacon. In Proceedings of the 2014 IEEE 3rd Global Conference on Consumer Electronics (GCCE), Tokyo, Japan, 7–10 October 2014; pp. 337–339. [Google Scholar]
- Huh, J.H.; Yohan, B.; Seo, K. Bluetooth-Tracing RSSI Sampling Method as Basic Technology of Indoor Localization for Smart Homes. Int. J. Smart Home 2016, 10, 9–22. [Google Scholar] [CrossRef]
- Huang, H.; Gartner, G.; Schmidt, M.; Li, Y. Smart environment for ubiquitous indoor navigation. In Proceedings of the 2009 International Conference on New Trends in Information and Service Science, Beijing, China, 30 June–2 July 2009; pp. 176–180. [Google Scholar]
- Kalia, M.; Garg, S.; Shorey, R. Efficient policies for increasing capacity in Bluetooth: An indoor pico-cellular wireless system. In Proceedings of the 2000 IEEE 51st Vehicular Technology Conference Proceedings VTC2000-Spring, Tokyo, Japan, 15–18 May 2000; pp. 907–911. [Google Scholar]
- Chawathe, S.S. Low-latency indoor localization using bluetooth beacons. In Proceedings of the 2009 12th International IEEE Conference on Intelligent Transportation Systems, St. Louis, MO, USA, 4–7 October 2009. [Google Scholar]
- Herrera, M.M.; Bonastre, A.; Capella, J.V. Performance study of non-beaconed and beacon-enabled modes in IEEE 802.15. 4 under bluetooth interference. In Proceedings of the Second International Conference on Mobile Ubiquitous Computing, Systems, Services and Technologies, Valencia, Spain, 29 September–4 October 2008; pp. 144–149. [Google Scholar]
- Lee, S.; Huh, J. An Effective Security Measures for Nuclear Power Plant Using Big Data Analysis Approach. J. Supercomput. 2018. [Google Scholar] [CrossRef]
- Inoue, Y.; Sashima, A.; Ikeda, T.; Kurumatani, K. Indoor emergency evacuation service on autonomous navigation system using mobile phone. In Proceedings of the 2008 Second International Symposium on Universal Communication, Osaka, Japan, 15–16 December 2008; pp. 79–85. [Google Scholar]
- Kim, E. The Effects of the Project Managers’ Competency and Leadership Style on the Performance and the Customer Satisfaction of SI Projects. J. Korean Oper. Res. Manag. Sci. Soc. 2006, 13, 295–303. (In Korean) [Google Scholar]
- Rose, K.H. A Guide to the Project Management Body of Knowledge (PMBOK® Guide)—Fifth Edition. Proj. Manag. J. 2013, 44. [Google Scholar] [CrossRef]
- Eom, S.; Huh, J. Group signature with restrictive linkability: Minimizing privacy exposure in ubiquitous environment. J. Ambient Intell. Hum. Comput. 2018. [Google Scholar] [CrossRef]
- Huh, J.; Kim, T. A Location-based Mobile Health Care Facility Search System for Senior Citizens. J. Supercomput. 2018. [Google Scholar] [CrossRef]
- Harold, K.; Kerzner, H.R. Project Management: A Systems Approach to Planning, Scheduling, and Controlling; John Wiley & Sons: Hoboken, NJ, USA, 2017. [Google Scholar]
- Duong, O.T.; Teuteberg, F. Understanding the implications of digitisation and automation in the context of Industry 4.0: A triangulation approach and elements of a research agenda for the construction industry. Comput. Ind. 2016, 83, 121–139. [Google Scholar]
- Sadeghi, A.R.; Wachsmann, C.; Waidner, M. Security and privacy challenges in industrial internet of things. In Proceedings of the 2015 52nd ACM/EDAC/IEEE Design Automation Conference (DAC), San Francisco, CA, USA, 8–12 June 2015. [Google Scholar]
- Wan, J.; Tang, S.; Shu, Z.; Li, D.; Wang, S.; Imran, M.; Vasilakos, A.V. Software-defined industrial internet of things in the context of industry 4.0. IEEE Sens. J. 2016, 16, 7373–7380. [Google Scholar] [CrossRef]
- Huh, J. Server Operation and Virtualization to Save Energy and Cost in Future Sustainable Computing. Sustainability 2018, 10, 1919. [Google Scholar] [CrossRef]
- Huh, J.-H. Smart Grid Test Bed Using OPNET and Power Line Communication; IGI Global: Philadelphia, PA, USA, 2017; pp. 63–78. [Google Scholar]
- Sangil, P.; Lee, S. A Study on Worker’s Positional Management and Security Reinforcement Scheme in Smart Factory Using Industry 4.0-Based Bluetooth Beacons; Advances in Computer Science and Ubiquitous Computing; Springer: Singapore, 2016; pp. 1059–1066. [Google Scholar]


© 2018 by the authors. Licensee MDPI, Basel, Switzerland. This article is an open access article distributed under the terms and conditions of the Creative Commons Attribution (CC BY) license (http://creativecommons.org/licenses/by/4.0/).