Abstract
The myogenic response is a key autoregulatory mechanism in the mammalian kidney. Triggered by blood pressure perturbations, it is well established that the myogenic response is initiated in the renal afferent arteriole and mediated by alterations in muscle tone and vascular diameter that counterbalance hemodynamic perturbations. The entire process involves several subcellular, cellular, and vascular mechanisms whose interactions remain poorly understood. Here, we model and investigate the myogenic response of a multicellular segment of an afferent arteriole. Extending existing work, we focus on providing an accurate—but still computationally tractable—representation of the coupling among the involved levels. For individual muscle cells, we include detailed Ca signaling, transmembrane transport of ions, kinetics of myosin light chain phosphorylation, and contraction mechanics. Intercellular interactions are mediated by gap junctions between muscle or endothelial cells. Additional interactions are mediated by hemodynamics. Simulations of time-independent pressure changes reveal regular vasoresponses throughout the model segment and stabilization of a physiological range of blood pressures (80–180 mmHg) in agreement with other modeling and experimental studies that assess steady autoregulation. Simulations of time-dependent perturbations reveal irregular vasoresponses and complex dynamics that may contribute to the complexity of dynamic autoregulation observed in vivo. The ability of the developed model to represent the myogenic response in a multiscale and realistic fashion, under feasible computational load, suggests that it can be incorporated as a key component into larger models of integrated renal hemodynamic regulation.
1. Introduction
The kidneys are organs in the body of mammals that extract blood waste and regulate the balance of water, electrolytes, acid-base species, etc. [1]. These tasks are crucial for the whole mammalian body and are accomplished by complex processes involving, among others, filtration and reabsorption mechanisms that take place exclusively within the kidney’s nephrons [1]. For these mechanisms to operate properly, the rate of blood volume that is filtered into each of the nephrons must be maintained within a narrow range [1]. Indeed, if the filtration rate is high, nephrons may not have sufficient reabsorbtive capacity and necessary blood substances may be lost in urine. On the other hand, if the filtration rate is low, unnecessary substances or toxic waste may be retained and leak back into the general circulation.
To maintain a stable filtration rate under physiologic conditions, blood supply to the nephrons is regulated individually by a number of autoregulatory mechanisms [2,3,4,5]. All such mechanisms that have been identified to-date share a common effector, namely the afferent arteriole, which is the vessel supplying blood to each nephron [5].
One of the strongest mechanisms acting on the afferent arteriole is the myogenic response [6,7]. This mechanism induces vasoconstriction of the arteriole when blood pressure is elevated and vasodilation when blood pressure is reduced. This way the myogenic response enables the kidney to actively impede or accelerate blood flow and therefore to adjust the filtration rate in response to perturbations of blood pressure that otherwise have huge destabilizing effects [7,8,9,10].
At the organ or vascular levels, the myogenic response in the kidney has been well characterized experimentally in vitro as well as in vivo [11,12,13,14,15,16,17,18]. However, theoretically a deeper understanding of the involved processes is lacking which limits our ability to investigate in silico realistic scenarios under health or disease conditions. For example, although several models accurately represent the myogenic response at the vascular or supravascular levels [2,7,11,19,20,21,22,23,24,25,26,27,28], and few even at the cellular level [6,29,30], none of the existing models attempt to model the myogenic response across multiple scales.
Indeed, multiscale modeling that spans processes ranging from the subcellular up to the organ level is required to elucidate clinical and experimental findings such as the effects of integrins [31,32], epithelial sodium channels (ENaCs) [33,34], angiotensin II (AngII) [35,36,37,38], nitric oxide (NO) [39,40], and an array of other vasomodulators [41,42,43,44], or the pathophysiology associated with certain chronic conditions such as hypertension [45,46], diabetes mellitus [47,48], or chronic kidney disease [49,50]. Most of these previous studies have used simple compartmental models (Windkessels), ordinary or partial differential equations, and more recently, probabilistic methods for reproducing renal vascular networks [28].
Our previous modeling study [29] considered only a single afferent arteriole smooth muscle cell and investigated the myogenic response initiated by pressure changes. In [7], we considered a model exhibiting the myogenic response and consisting of an afferent arteriole segment, glomerular filtration, and a short loop of Henle. The smooth muscle cell in this study is less realistic than the model in [29] since it includes a small number of components, such as membrane potential and calcium concentration. In [30], we extended the model in [29] to a segment of multiple smooth muscle cells connected through gap junctions; one limitation of this model is that the numerical implementation (fractional splitting) did not allow us to consider a realistic cell size.
A goal of this study is to gain a better understanding of the interactions developed between subcellular, cellular, and vascular processes involved in the initiation and development of the myogenic response. Another goal is to formulate a realistic model entailing a feasible computational cost that may be further extended to larger scales. To that end, we expand on our existing, highly detailed mathematical model of Ca signaling within an individual afferent arteriole smooth muscle cell [29] that represents the transmembrane transport of major cytosolic ions, intracellular Ca dynamics, the kinetics of myosin light chain phosphorylation, and the mechanical behavior of the entire cell and local vascular wall. We extend this model to a multi-cell vascular model of the afferent arteriole and couple it with a representation of hemodynamics, i.e., blood flow and pressure, and intercellular conduction that also incorporates a layer of endothelial cells. Our model consists of a mixture of ordinary and partial differential equations and we apply numerical methods for differential-algebraic systems. We use the resulting model to study myogenically induced responses of the entire afferent arteriole to characteristic time-independent and also time-dependent pressure perturbations.
2. Mathematical Model
In this section we describe the model equations, the numerical methods developed for the solution of the model equations, and present values used for the model parameters.
2.1. Model Description
To represent the processes mediating the initiation and progress of the myogenic response in the renal afferent arteriole, we model a segment of the mammalian renal vasculature consisting of multiple cells. We incorporate a simplified geometry (Figure 1) and dimensions consistent with the afferent arterioles associated with the long nephrons of the rat kidney [51,52].
Figure 1.
Model vasculature. Blood flows through the afferent arteriole from the cortical radial artery to the glomerulus and subsequently flows through the efferent arteriole from the glomerulus to the peritubular capillaries.
To obtain reliable predictions of the driving signal of the myogenic response, i.e., blood pressure profile along the model vessel [7], we represent hemodynamics. Vascular diameter across the model vessel greatly impacts hemodynamics [7], and we combine the myogenic mechanisms of a large number of smooth muscle cells that are the main determinants of vascular tone and wall mechanics [3]. For the myogenic mechanism of each smooth muscle cell we adopt a highly detailed model of subcellular dynamics that has been previously applied on the renal afferent arteriole myocytes [29]. Additionally, to represent accurately conducted responses that have been shown, experimentally and theoretically, to have a significant effect on overall autoregulation [17,24,27,53,54], we incorporate gap junction coupling directly among neighboring smooth muscle cells as well as among smooth muscle cells and a layer of endothelial cells. Lastly, in order to maintain a low computational load, we adopt only a simplified representation of the endothelium similar to existing approaches [7,27,55].
The combined submodels are described in detail below.
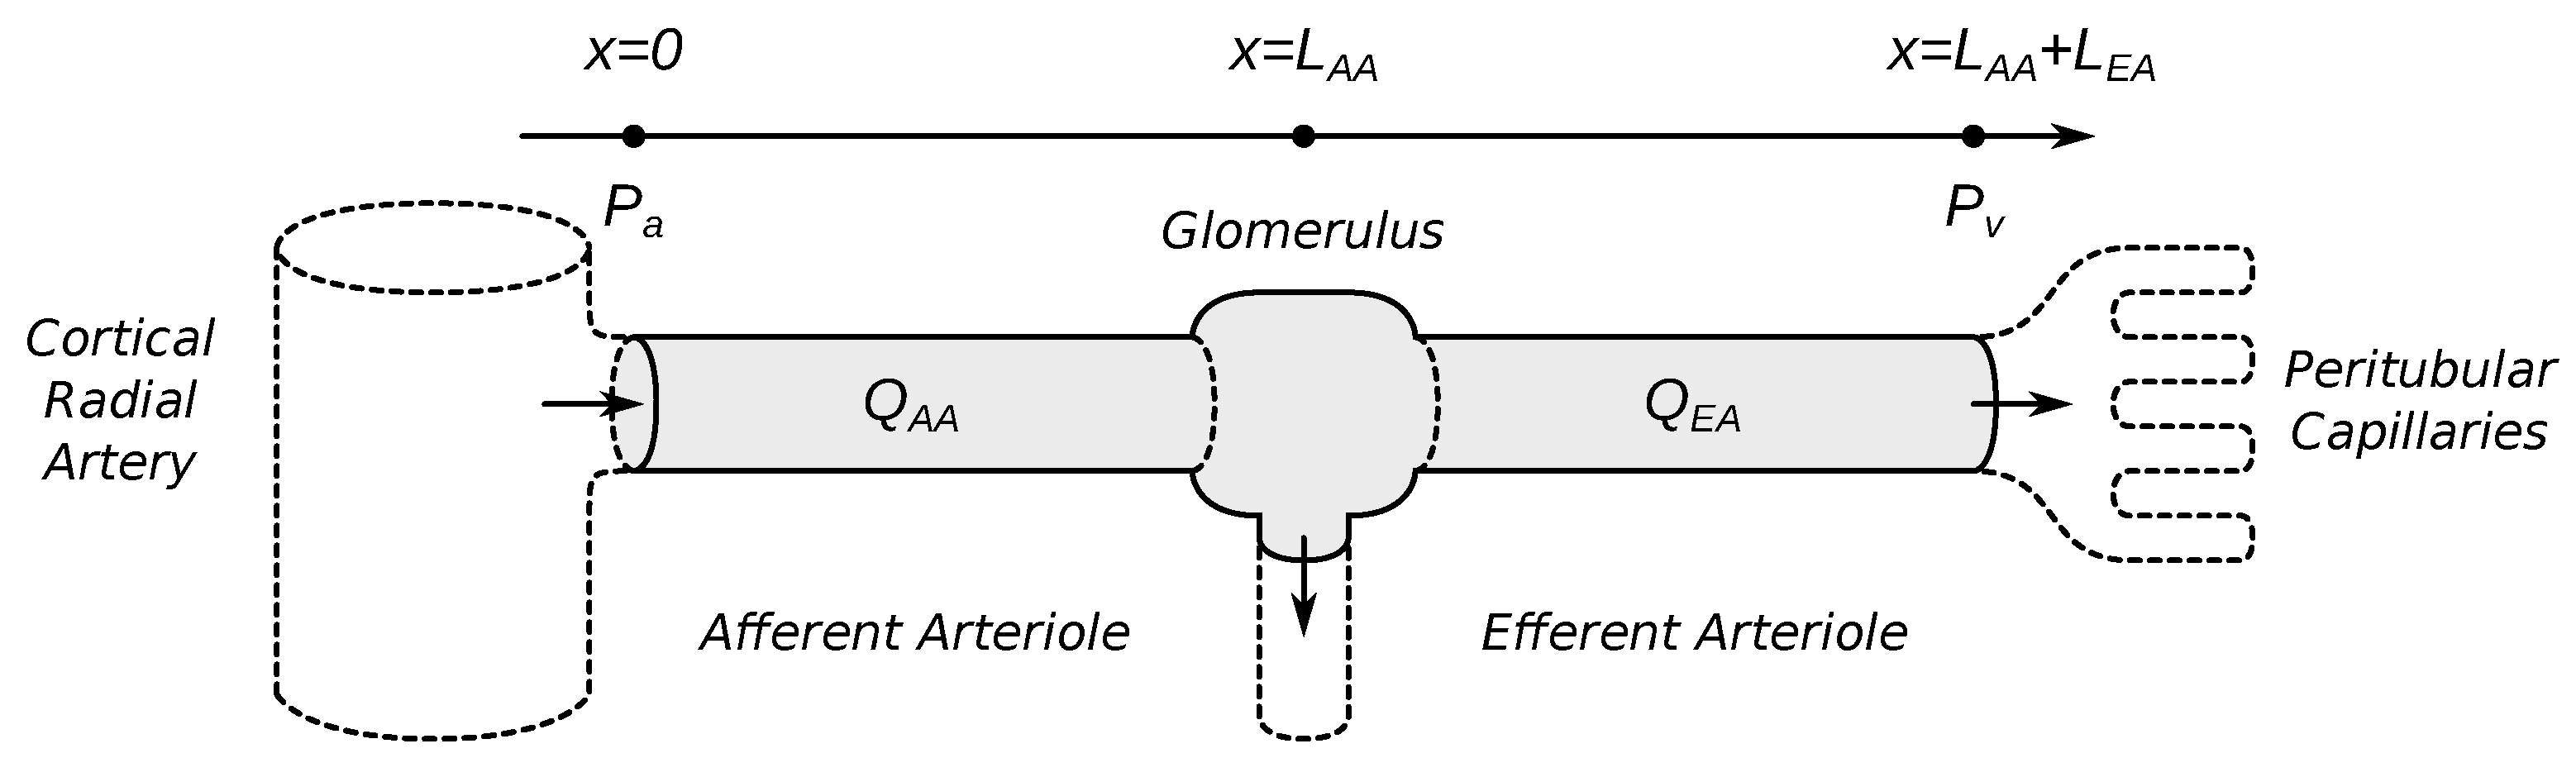
2.1.1. Vascular Blood Flow
To obtain an accurate representation of blood flow, i.e., volume flow and pressure profile, we model a segment of the renal vasculature consisting of an afferent and the associated efferent arterioles as shown in Figure 1. Consistent with the renal microanatomy, we represent the two vessels as consecutive straight tubes that extend from the cortical radial artery () to the glomerulus (), and from the glomerulus to the entrance of the peritubular capillary network (), respectively.
Let and denote the blood flow in the model afferent and efferent arterioles, respectively. In the glomerulus, which is the initial part of the nephron and where filtration takes place [1], a portion of the supplied blood is removed from the bloodstream. To model glomerular filtration, we assume a constant filtration fraction . Hence, the single nephron glomerular filtration rate equals and conservation of mass reads
Blood flow in the model vasculature is assumed to obey Poiseuille’s law [56], which, applied to the two vessels, reads
In the above equations, P and R denote the pressure and radius profiles along the model vasculature, respectively, and denotes the viscosity of blood, which is assumed equal in both vessels despite a minor difference in the hematocrit caused by filtration [57].
Micro-puncture studies indicate minor pressure differences between the renal artery and the entrance of the afferent arteriole, as well as between the peritubular capillaries and the renal vein [58,59]. Therefore, we use the boundary conditions
where and denote the blood pressures in the renal artery and vein, respectively. As in previous modeling studies [7,55,60], we assume is a prescribed function of time serving as the overall input to our model, while is fixed. To facilitate the presentation in Section 3, we refer to the pressures and as afferent arteriole inflow and outflow pressures, respectively.
Conservation of mass (1), Poiseuille’s law (2) and (3), and the boundary conditions (4) and (5) can be combined to yield
where the vascular resistances and are given by
Autoregulatory phenomena in the renal vasculature of mammals typically require 1–60 s to develop [2,3,4]. On this time scale, the radius of the efferent arteriole appears essentially constant [3], therefore for we assume , where is a fixed radius. So (8) reduces to
In contrast, over the same time scale, the radius of the afferent arteriole may change considerably due to either spontaneous contractions of the arteriolar smooth muscles or the operation of the autoregulatory mechanisms [6,7]. Therefore, to accurately predict the evolution of for , we develop a detailed model of the afferent arteriolar wall, including the constituting myocytes, which is described below.
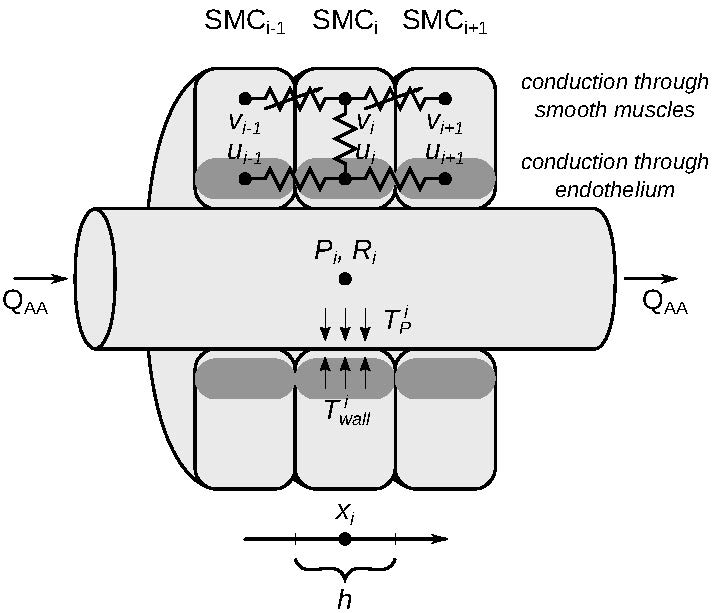
2.1.2. Vascular Wall
The afferent arteriole wall model consists of a chain of smooth muscle cells oriented circumferentially along the vascular lumen as shown in Figure 2. In our formulation, the muscle cells are centered at
where is the axial muscle width, i.e., individual smooth muscles are located between and .
Figure 2.
A segment of the model afferent arteriole. The vascular wall consists of a chain of smooth muscle cells (SMC). The local vascular radius is determined by the balance of and which depend on local blood pressure and the contractile state of the surrounding myocyte, respectively. Along the vascular wall, signals are conducted directly through the smooth muscles () or indirectly through the endothelium (shaded region, ). For simplicity, we only show selected intercellular currents. See Section 2.1.2 for complete equations.
For each smooth muscle cell we adopt the model of [29] which represents in detail subcellular processes such as transmembrane ionic transport, Ca dynamics, and kinetics of myosin light chain phosphorylation. For convenience, we include a schematic of the myogenic mechanism in Figure 3, and refer the reader to [29,30] for complete details on model equations. Among other variables, the smooth muscle cell model predicts muscle membrane potential , cytosolic concentrations for K, Na, Cl, Ca, and the fraction of phosphorylated myosin light chains.
Figure 3.
Illustration of the myogenic mechanism of an individual vascular smooth muscle cell in the renal afferent arteriole. For details on the model compartments and equations see [29,30]. (Figure reproduced with permission from [29]).
Given our focus on the representation of vascular responses, which are greatly influenced by intercellular communication [17,27,53,55,61,62], we modify the model of [29] which studies cells in isolation and so it ignores signals shared between different smooth muscles. In the present study we consider the addition of gap junctional coupling motivated by the models of [27,30,55].
To represent gap junctions, we model two pathways: a direct one where ions pass between the cytosol of adjacent smooth muscles, and an indirect one where electrical currents pass between the smooth muscles and the endothelium [53,61,63,64]. For the former, we compute the ionic fluxes according to the well established Goldman-Hodgkin-Katz model similar to [63]. For the latter, we assume each smooth muscle is associated with a phenomenological endothelial compartment with local membrane potential , and compute the electrical fluxes according to Ohm’s law similar to [27]. We note that on the timescales of the myogenic response that we are interested in, i.e., 1–10 s [3,4,7], the endothelium merely acts as a low-resistance pathway between the membranes of distant cells [3,53,62], and thus we formulate only this aspect. Accordingly, in the present study we ignore vasomodulatory effects mediated by the endothelium such as production and secretion of various vasomodulators such as NO [4,5], which in the mammalian vasculature develop over considerably slower time scales [3,4]. We note that including a full model of the endothelium, for example similar to [63,64,65,66], would considerably add to the computational cost, without providing further autoregulatory insight. Additionally, the experimental observations that exist currently do not suffice for a more elaborate formulation that is specific to the renal microcirculation.
In summary, the modified muscle dynamics are given by
for K, Na, Cl, Ca and the potential dynamics of the endothelial nodes are given by
Above, and denote the capacitances of the smooth muscle membrane and the endothelial compartments, respectively; denotes the volume of the muscle cytosol; denotes the net sum of the currents passing through membrane channels [29]; , , and denote the currents passing through gap junctions developed between muscles and the endothelium [27,63]; and and denote the corresponding ion fluxes [29,63]. For the above equations, we assume no-flux boundary conditions at both end points of the afferent arteriole.
The model muscle cells represent the myogenic response under the assumption that the afferent arteriole responds directly to changes in blood pressure [6]. For this, (11) and (12) incorporate in and , respectively, contributions from pressure sensitive membrane channels whose activation depends on local blood pressure
where is the pressure profile of (2).
We denote the fraction of myosin light chains that are phosphorylated by and refer to [29,30] for its dependence on the model variables. Given and pressure , the model of [29] predicts the local vascular radius in the vicinity of the ith smooth muscle. In particular, is determined by the balance of apparent hoop stresses and (actual hoop stresses are proportional to and ) that are exerted across the muscle,
The transmural pressure depends on and tends to stretch the smooth muscle, causing passive vasodilation. The wall stress depends on and tends to compress the muscle, causing active vasoconstriction [29]. As the pressure decreases along the vessel [55], the stress is lower near the glomerulus than near the cortical radial artery. To achieve a baseline radius profile that is approximately flat, similar to [7,27,60], we introduce a parameter in (15) which downscales similar to a baseline . That is, we set
where and denote reference values for the afferent arteriole inflow and outflow pressures.
2.2. Numerical Methods
To obtain solutions of the model equations presented in the previous section we need to solve a large system of (stiff) ordinary differential equations that describes the combined dynamics of the individual smooth muscle cells. This system can be put in the form
where combines the state variables of the smooth muscle cell (for example combines , , , , , etc.). We implement no-flux boundary conditions assuming ghost cells and .
The system in (17) is coupled to the blood flow representation of Section 2.1.1, which is discretized spatially. For this we assume that the radius profile is locally approximated by the smooth muscle predictions
Pressures at the discrete locations are obtained via (2) using an upwind approximation of the gradient . Namely, the pressures are given by
To compute numerical solutions we cast the resulting system of semi-discrete Equations (17) and (19)–(21) in the differential-algebraic form
where and . For the time evolution of (22) and (23), we apply standard numerical methods for initial value problems in differential-algebraic form [67,68] implemented in MATLAB (The MathWorks, Natick, MA) using implicit solvers that can efficiently treat the stiffness inherent in (17). Specifically, we opt for the solver ode15s, and supply the Jacobian matrix to improve the solver’s efficiency. We note that this built-in MATLAB method is adaptive, so that we expect that the numerical error arising from time discretization is controlled. The absolute and relative tolerances we use for ode15s are both .
2.3. Parameter Values
2.3.1. Vascular Geometry and Hemodynamics
Throughout this study, we consider an afferent arteriole of total length = 60 m that consists of cells with axial length h = 3 m approximately of the same dimensions as reported in [69,70]. Based on the estimated and h, the model afferent arteriole is discretized into cells. We note that while the axial length h used is realistic, in order to keep the overall computational costs low, the vessel length used is near the smallest measured experimentally in the rat kidney.
Values for the model parameters are listed in Table 1. These are chosen based on previous modeling studies or have been computed assuming reference physiological values for the afferent arteriole inflow and outflow pressures and , afferent arteriole radius , afferent arteriole blood flow , and single nephron glomerular filtration rate . We set the radius of the efferent arteriole to 10% larger than as reported in [71], and we compute the length of the efferent arteriole such that the resulting pressure drops along the afferent and efferent arterioles at reference are and , respectively. The value is adjusted to ensure that, for the dimensions of our system and physiological values of the parameters as listed in Table 1, we reproduce a reference pressure drop of mmHg in Equation (19) in agreement with experimental observations [56].
Table 1.
Model parameter values.
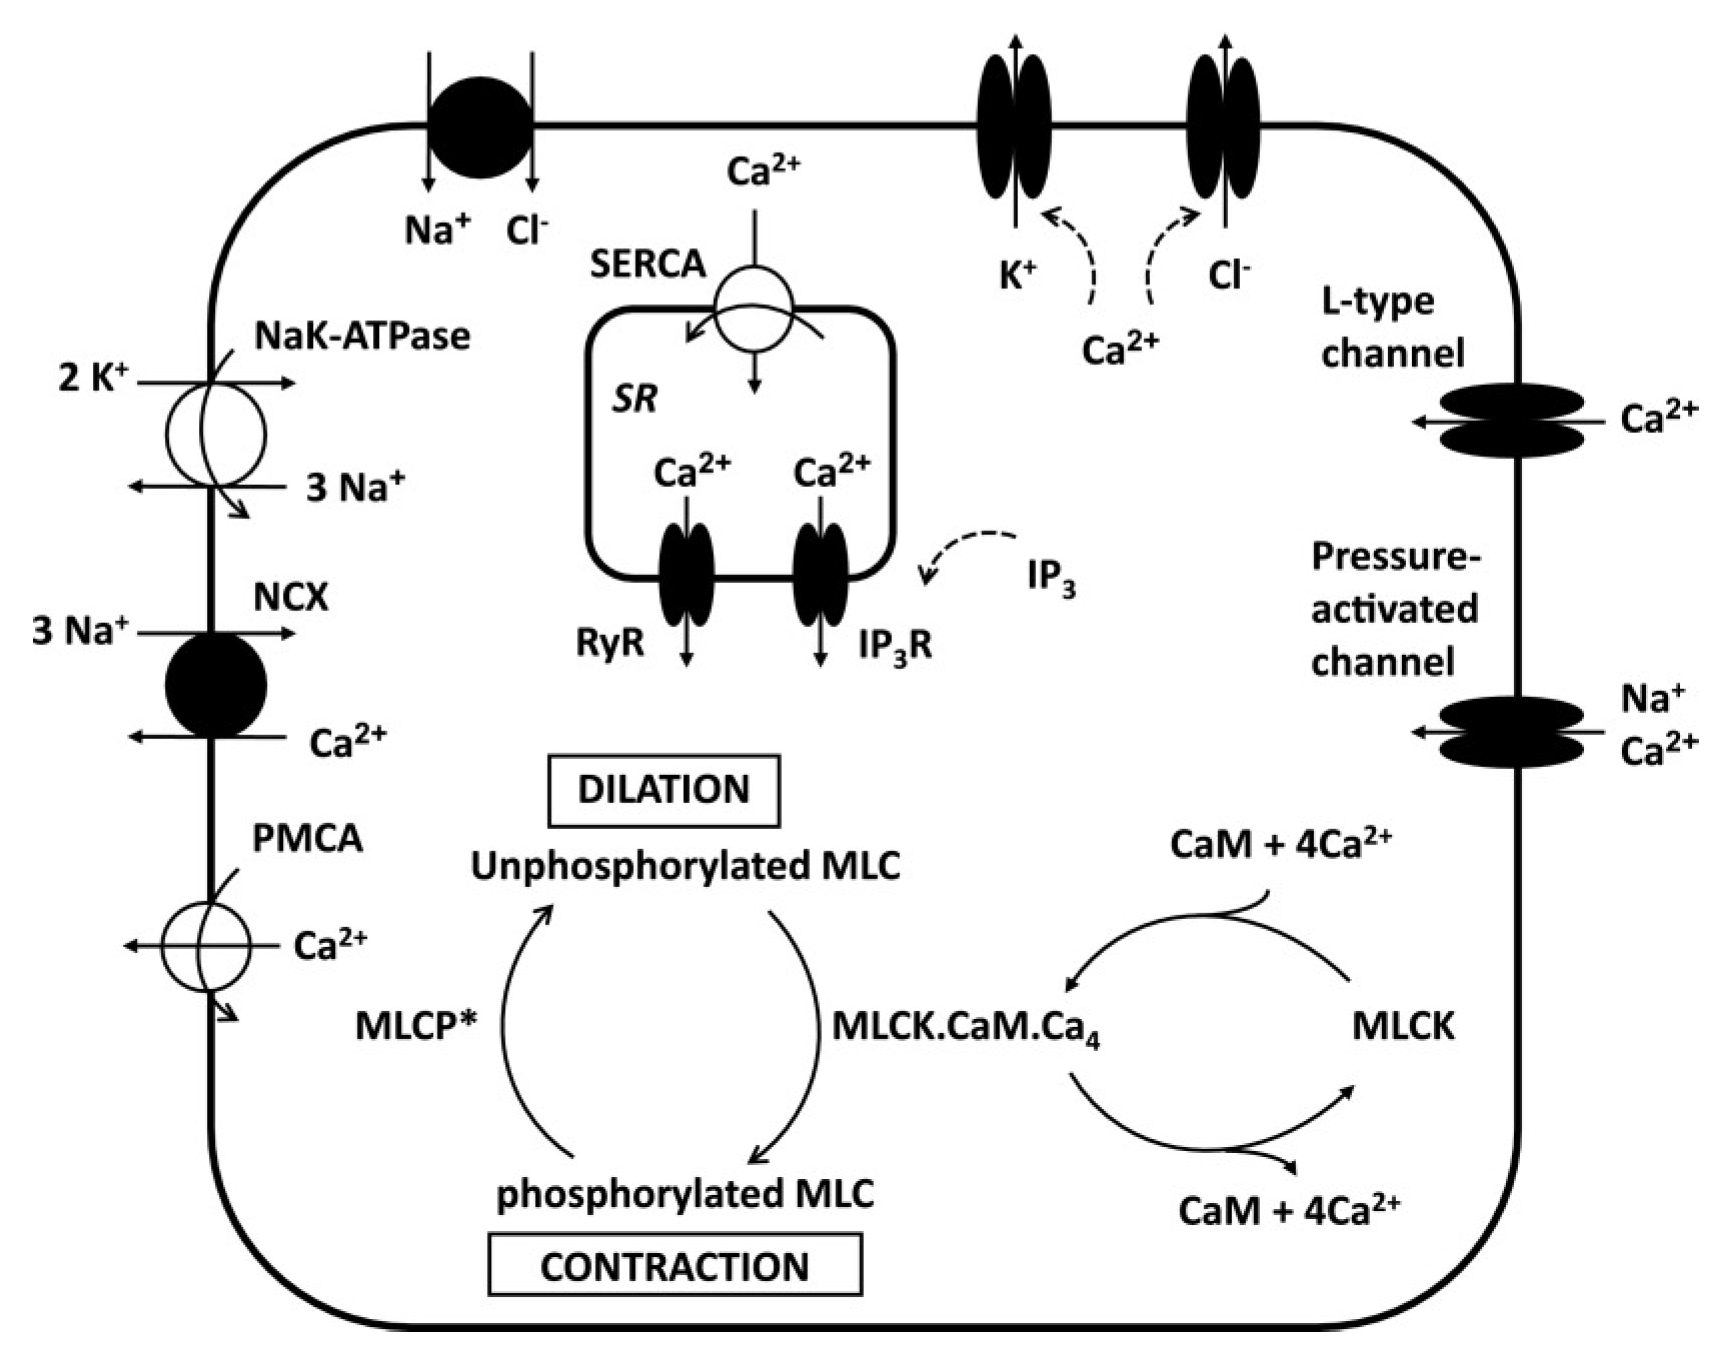
2.3.2. Electrophysiology
Values for the parameters modeling the currents and ion fluxes of (11) and (12) are adopted from [29,30], while values for the parameters modeling and are adopted from [63]. For the currents and modeling endothelial gap junctions, we use Ohmic conductances and , respectively. We compute these values based on the estimated dimensions of the model afferent arteriole, namely
where is the contact area between the muscles and the endothelium, is the endothelial cross-section area, is half of the afferent arteriole wall thickness, and equals h. For the resistivities and we adopt the values from [65].
3. Model Results
Having described the formulation of our model and the necessary numerical methods in the earlier sections, here we show characteristic simulations. Specifically, we examine the model’s behavior when the inflow pressure, denoted , is (i) set to a constant value (time-independent); (ii) perturbed by an instantaneous rise or drop (time-dependent); and (iii) perturbed by sinusoidal oscillations (time-dependent). We focus our presentation only on , which essentially represents the renal perfusion pressure, due to its physiological and experimental importance [2,3,4,5,56].
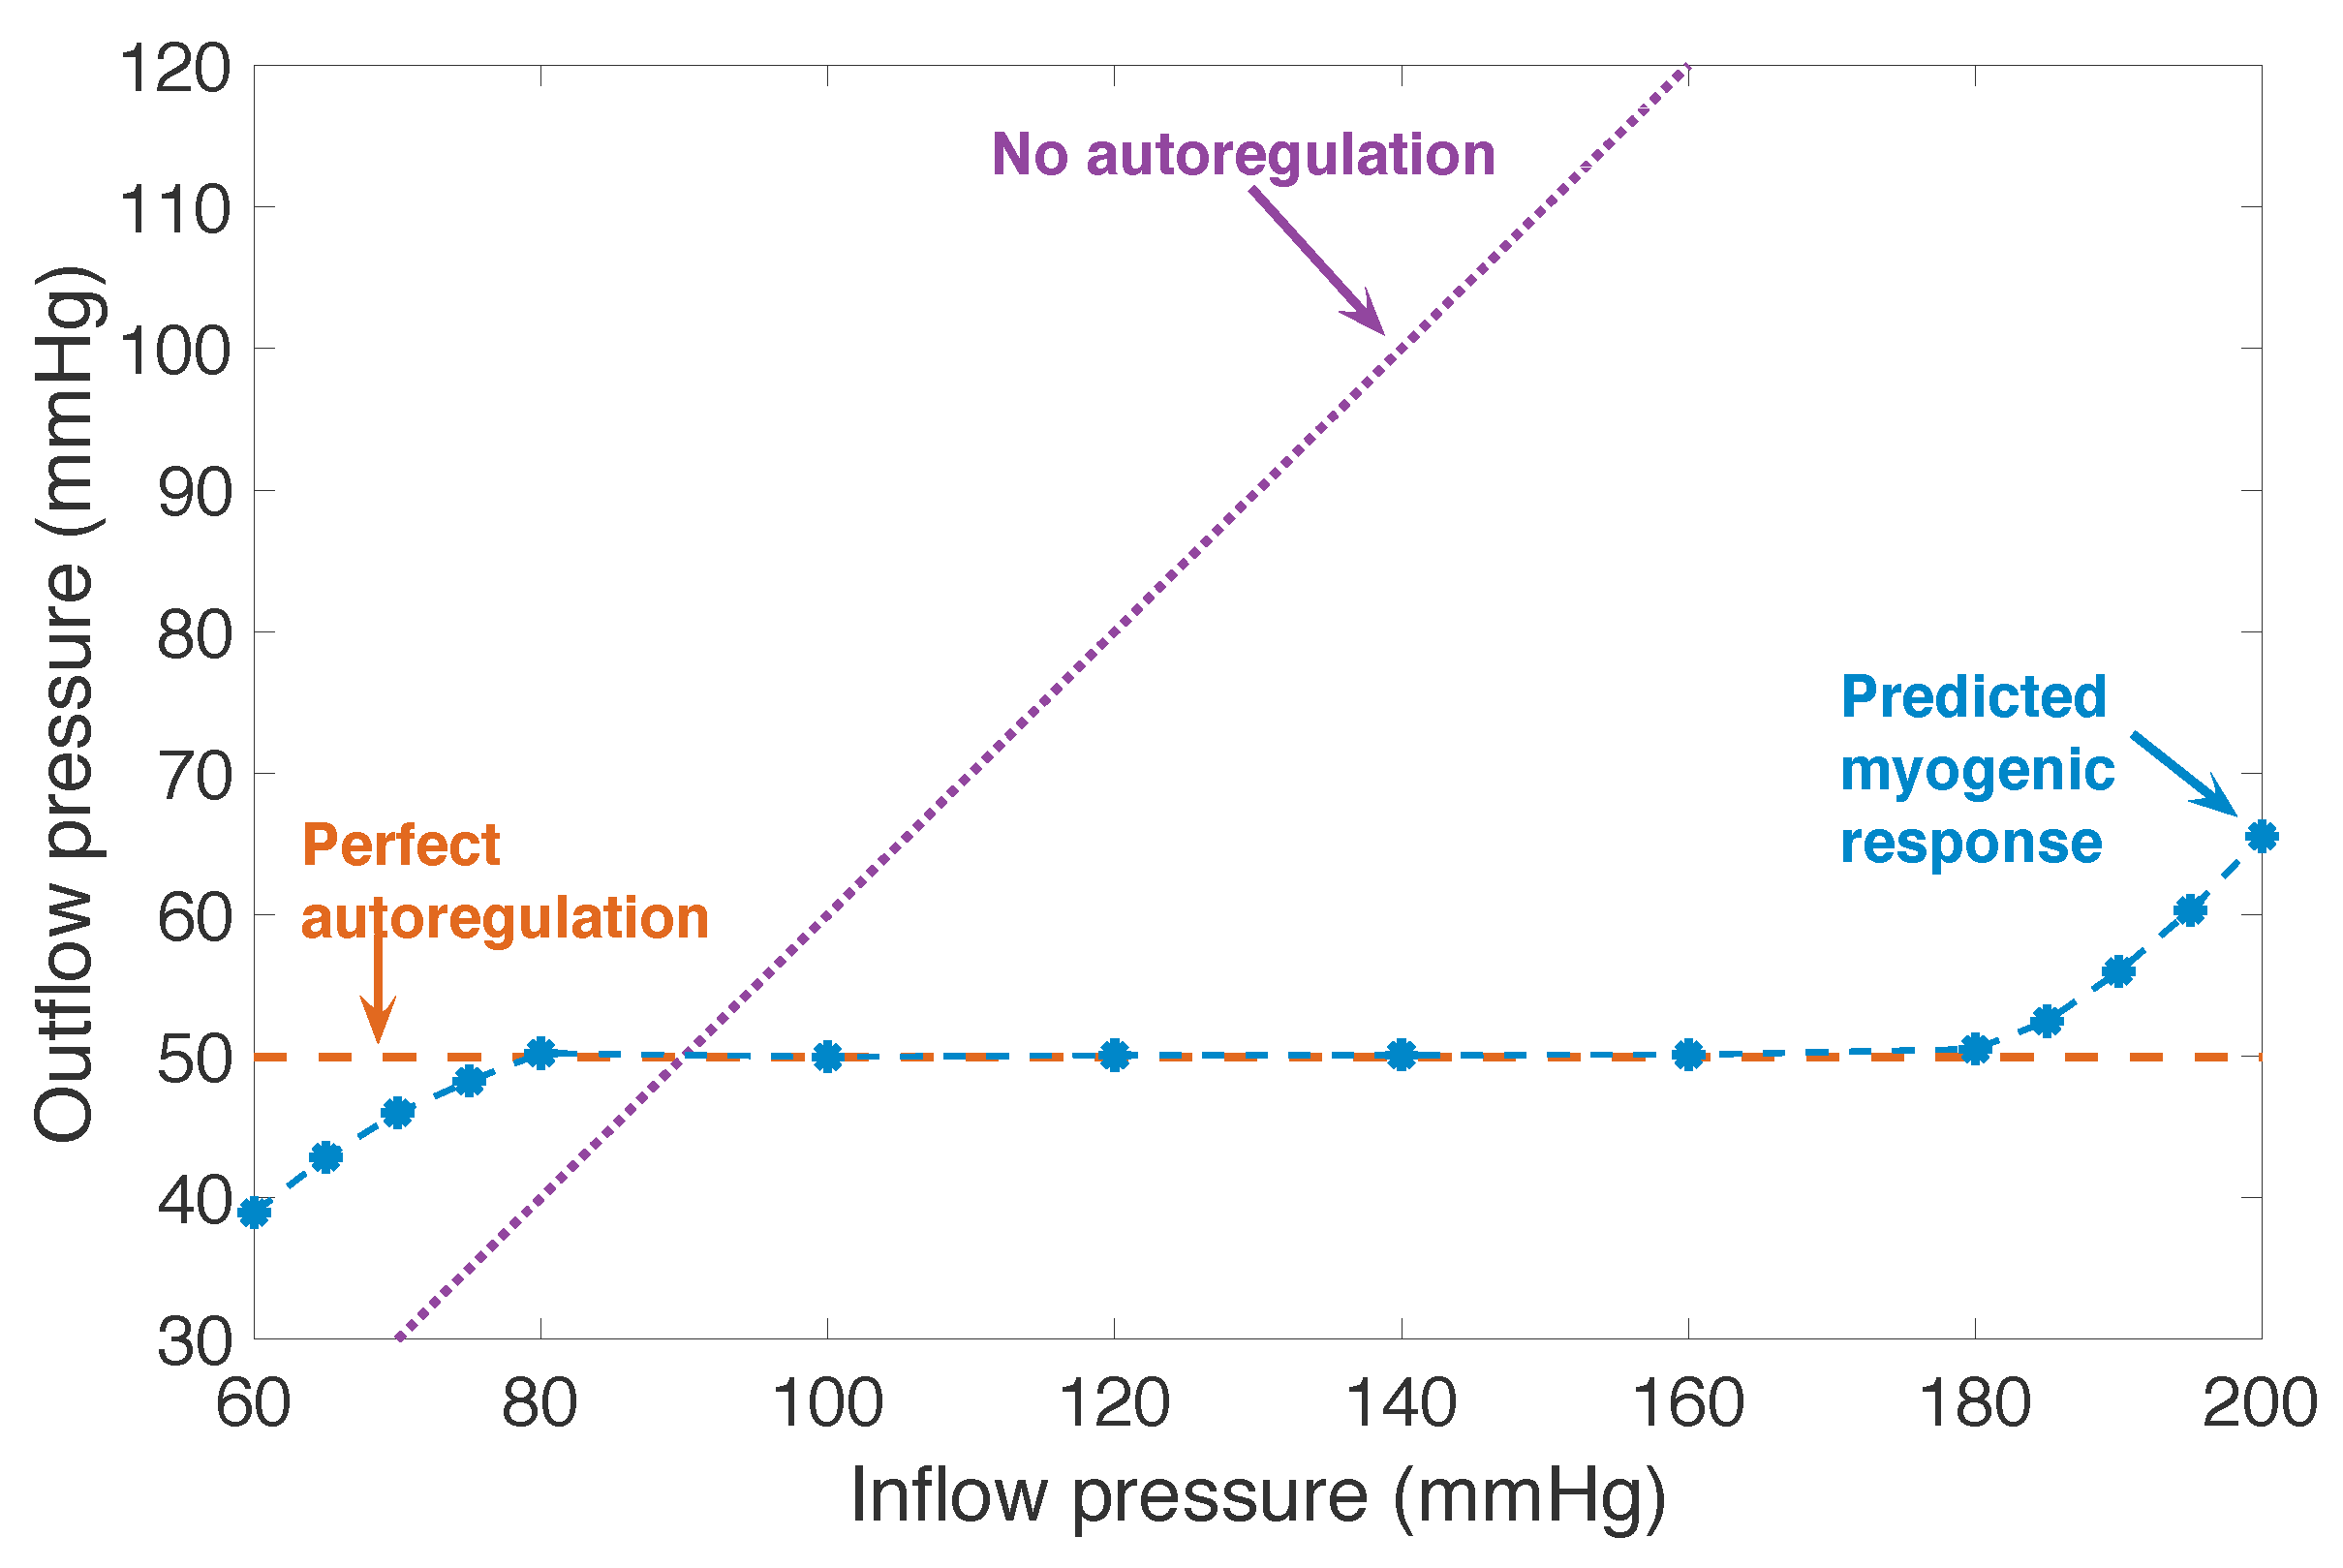
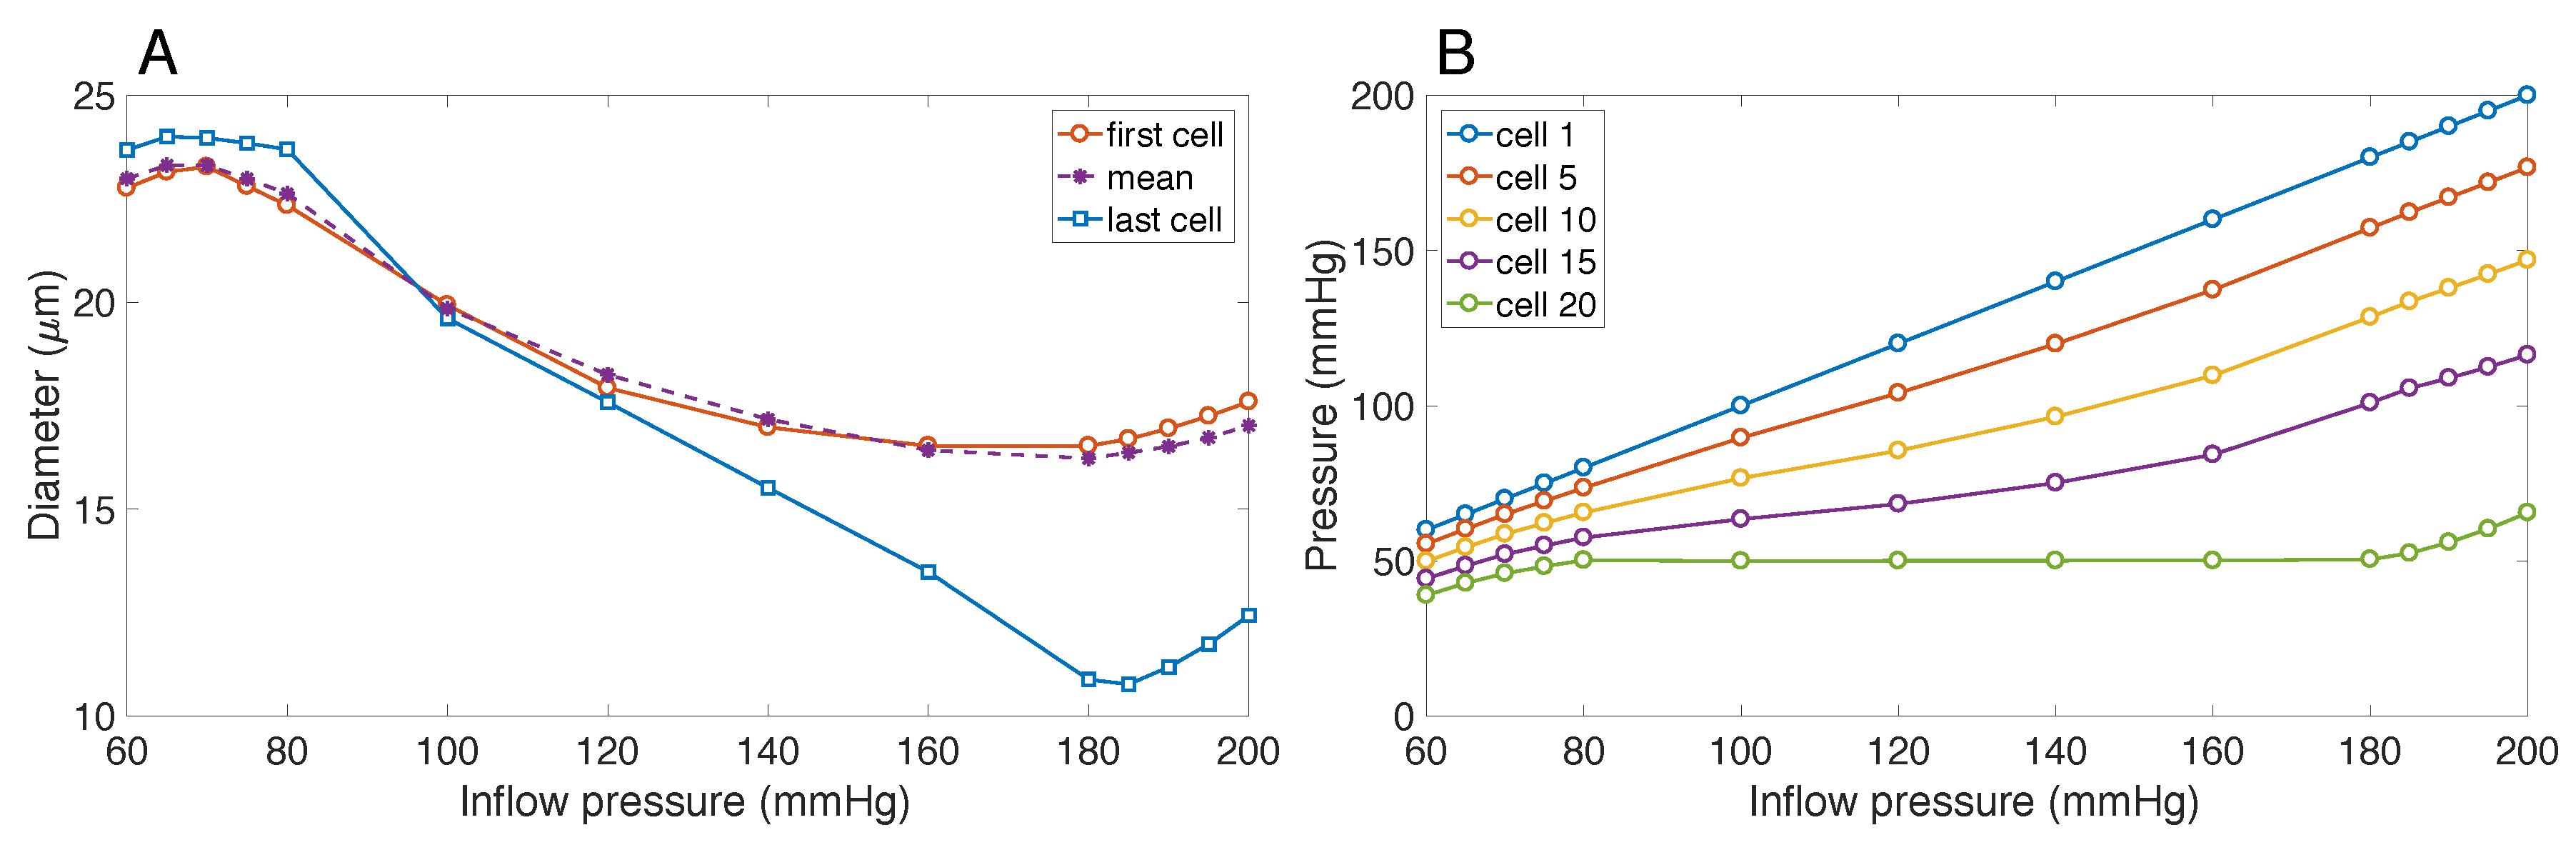
3.1. Responses to Steady Perturbations
We first compare our model to the previous models of [29] and [30] by studying the base case situation when the inflow pressure is set to a constant value of 100 mmHg (baseline). Figure 4A shows predicted oscillations for the first cell in the afferent arteriole for the membrane potential . The mean value is mV, which is similar to the values found in both [29,30] and which approximates the measured value of mV well [73]. Figure 4B shows the cytosolic Ca concentration, which varies between approximately 200 and 360 nM, a somewhat larger range than as predicted in [29,30]. The frequency of the oscillations is 0.15 Hz, the same as in [30] and slightly smaller compared to [29], but well within the range of experimental measurements, for example see [26]. Figure 4C shows the local vascular diameter in the proximity of the first cell of the afferent arteriole, which has an average of 19.7 m with an oscillation amplitude of 0.6 m. Both values are in agreement with previous model predictions [29] and also experimental observations of spontaneous vasomotion, for example [4,71].
Figure 4.
Predicted oscillations for the first cell in the afferent arteriole at an inflow pressure of 100 mmHg for the (A) membrane potential; (B) cytosolic concentration of Ca; and (C) afferent arteriole local diameter.
To investigate the myogenic response of the model’s afferent arteriole, we computed the outflow pressure and time- and space-averaged diameter of the afferent arteriole given different constant inflow pressures . For a comparison, the dotted line in Figure 5 indicates the values expected in the absence of autoregulation (i.e., inflow perturbations are transmitted unattenuated to outflow perturbations) and the dashed line indicates the values expected in the presence of perfect autoregulation (i.e., inflow perturbations are not transmitted to outflow perturbations). We emphasize that, as these lines are shown only for visual purposes, their computation is not based on the present model and instead they can be directly derived from basic principles [56]. As seen in Figure 5, our results indicate that as increases, the predicted outflow pressure of the afferent arteriole increases only when is below ≈80 mmHg or above ≈180 mmHg. The predicted pressure response lies below the line representing perfect autoregulation for low , coincides with the line for a wide range of inflow pressures (≈80–180 mmHg), and then lies above the line for large . A similar autoregulatory plateau is predicted for (not shown). We note that this plateau is in almost complete agreement with Figure 8 in [11], where renal blood flow is measured in vivo over a range of arterial blood pressures in whole kidney preparations. Our model is able to achieve almost perfect autoregulation for a physiologically relevant range of inflow pressures that is larger than the corresponding range predicted by the cellular models of [30,55].
Figure 5.
Predicted myogenic response (blue) compared to perfect autoregulation (red) and no autoregulation (purple) of blood flow through the vessel for a range of blood pressures. For illustrative purposes, we show a straight line for the case of no autoregulation that qualitatively captures the response under this assumption (actual slope may differ).
Figure 6A shows the steady-state diameters (time- and space-averaged across afferent arteriole cells) for different constant inflow pressures. As in [30,55], the model predicts vasodilation for small inflow pressures and vasoconstriction for large inflow pressures. Our model predicts a larger mean diameter for small inflow pressures (≤80 mmHg) than [30,55] and approximately the same mean diameter for large inflow pressures (≥160 mmHg).
Figure 6.
(A) Predicted steady-state diameter (calculated by time-averaging for the first and last cells and calculated by space- and time-averaging for the mean) across the afferent arteriole cells for a range of time independent blood pressures; (B) Predicted myogenic response of blood flow for five cells in the afferent arteriole for a range of blood pressures.
As can be seen from Figure 6A, vasoresponses to either reduced of elevated inflow pressure are considerably stronger near the distal part of the model afferent arteriole. For example, at 180 mmHg, vasoconstriction of the distal cells is nearly twice that of the proximal cells. For all inflow pressures, according to Figure 6B, attenuation of the perturbations occurs throughout the length of the model afferent arteriole. As a result of the stronger distal responses, the attenuation becomes gradually stronger as perturbations travel downstream.
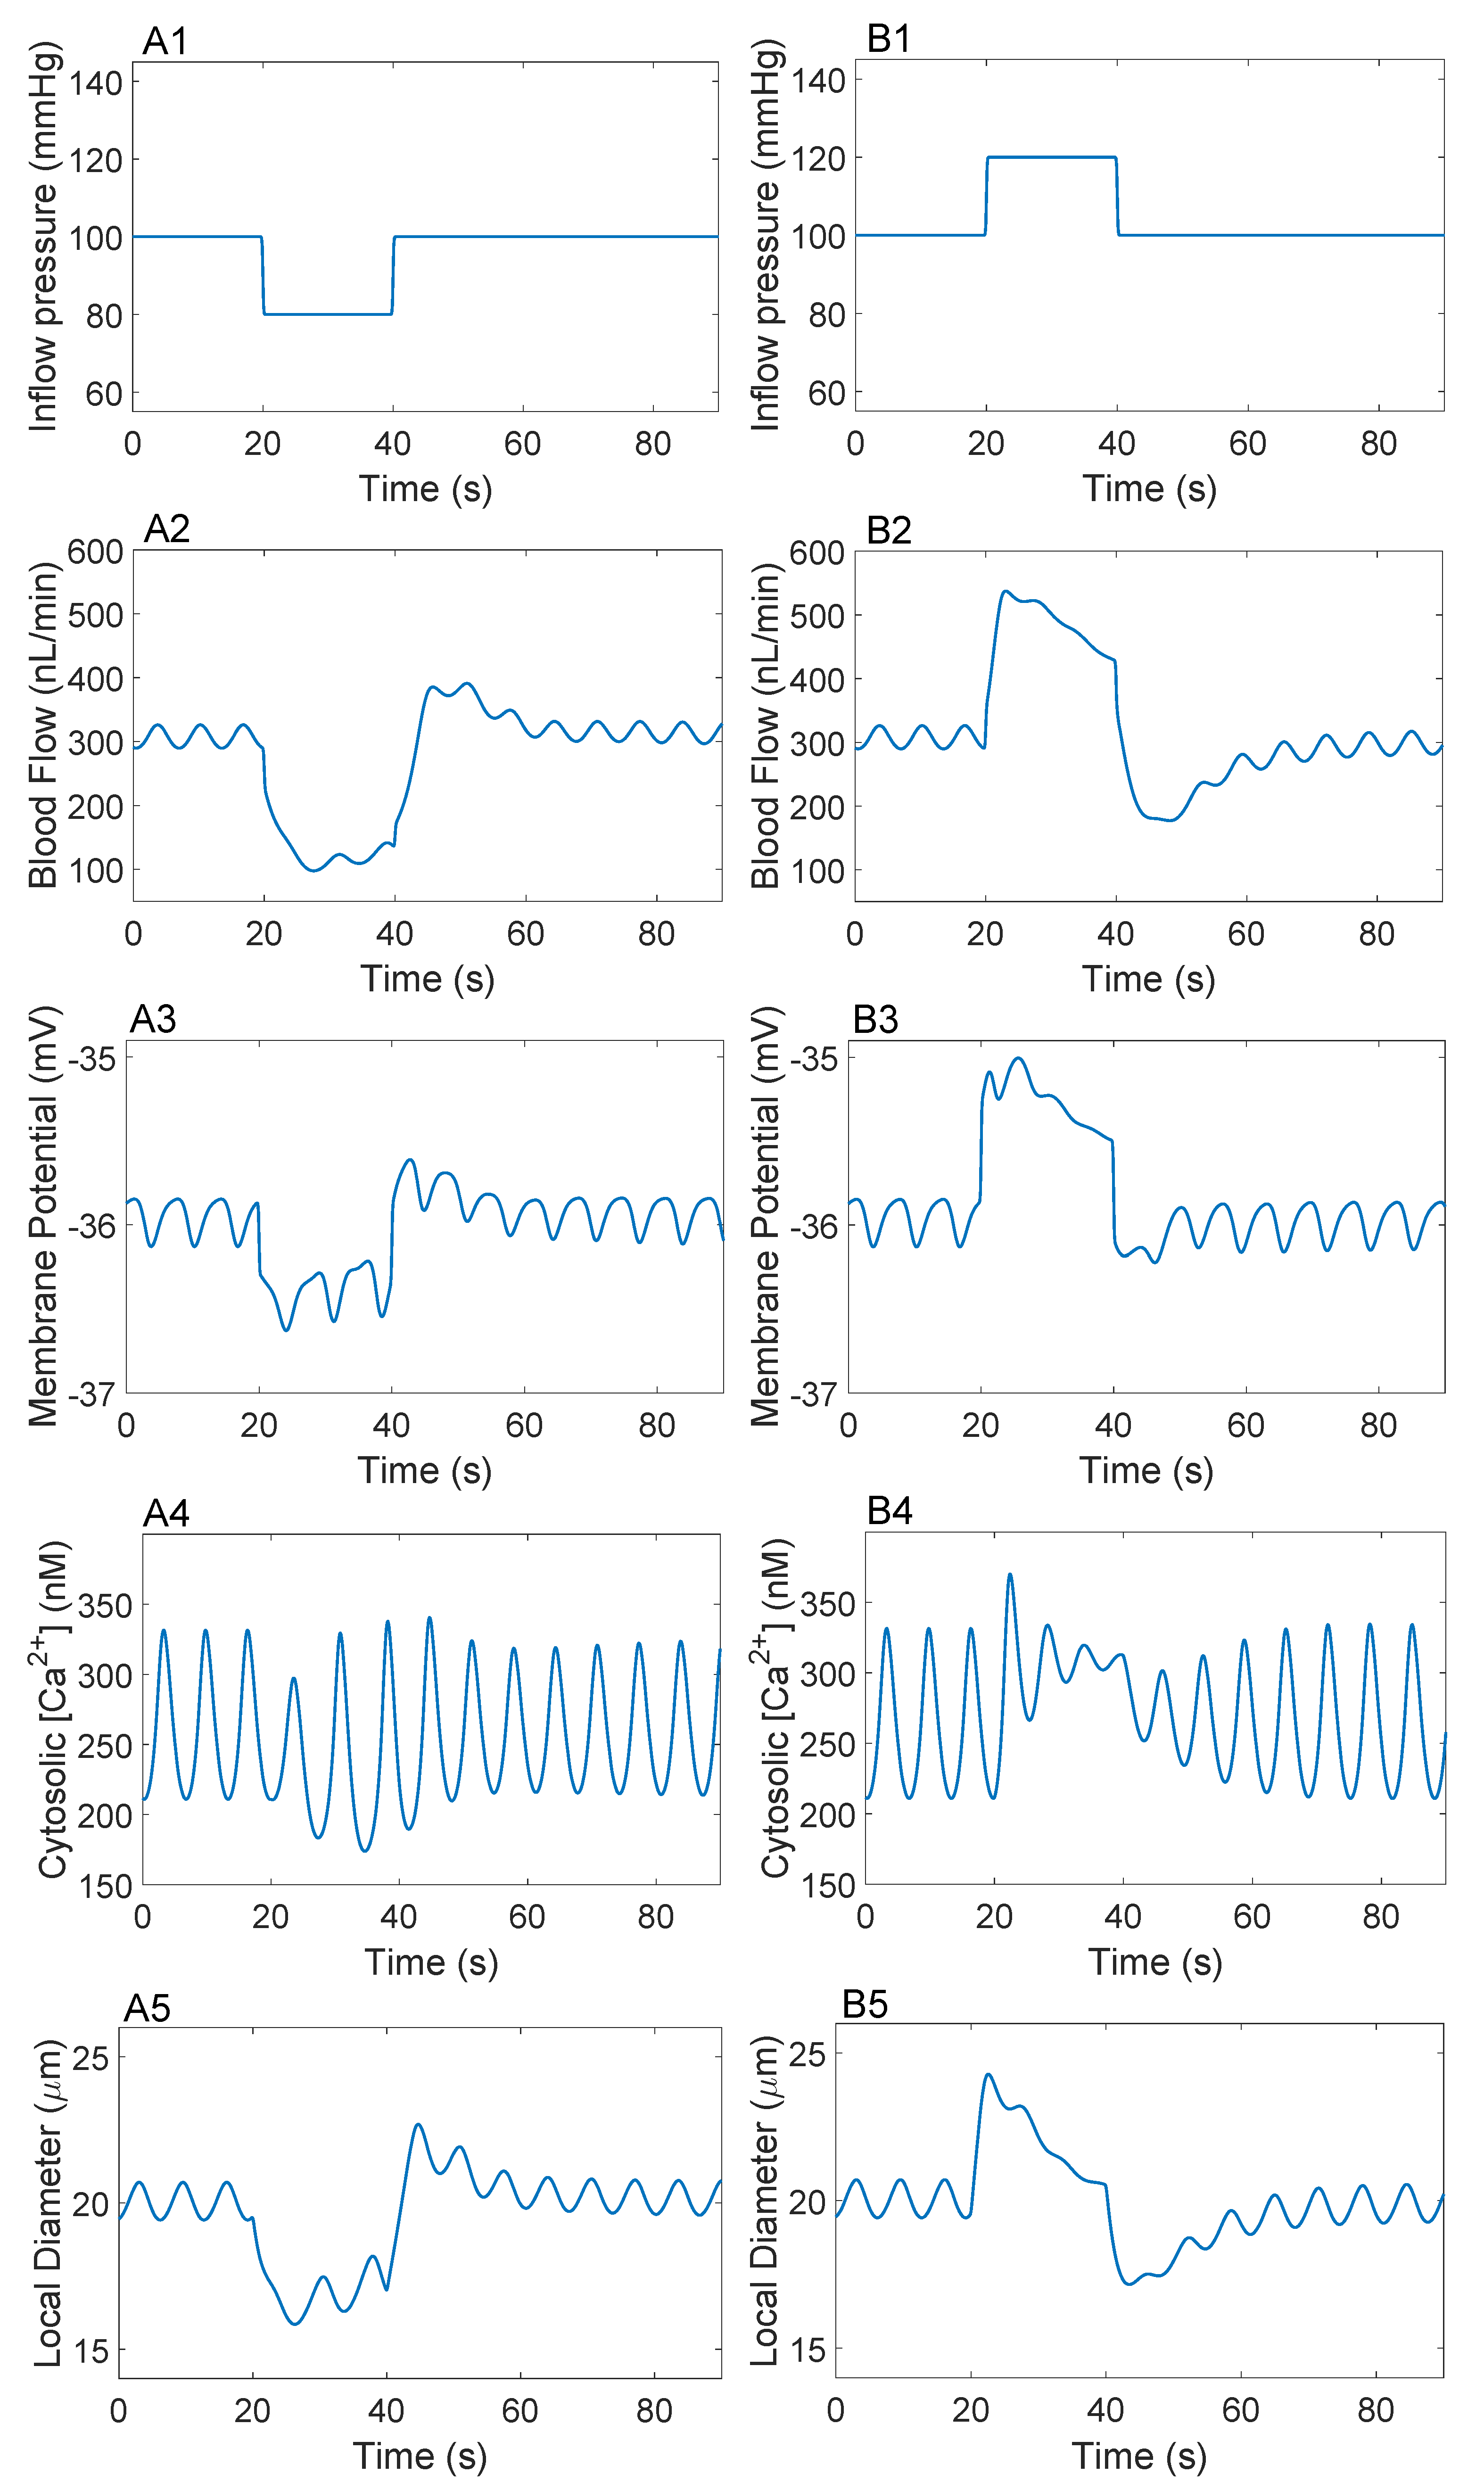
3.2. Responses to a Step Perturbation
To gain insights into the behavior of the model under time-dependent pressure perturbations we simulate changes in inflow pressure as illustrated in Figure 7, first row. We simulate a pressure pulse by introducing an almost instantaneous rise (respectively drop) in inflow pressure, maintaining the pulse pressure for 20 s, and returning back to the baseline through an almost instantaneous drop (respectively rise). The system is then allowed to stabilize after the return to the baseline inflow pressure over a period of 50 s. This framework allows us to analyze the predicted responses of the model afferent arteriole over a short-term period for both increases and decreases in blood pressure and is intended to simulate step-pressure experimental conditions [74].
Figure 7.
Predicted time profiles of (1) inflow pressure; (2) blood flow; (3) membrane potential; (4) cytosolic Ca concentration; and (5) local diameter for the first cell in the model afferent arteriole under (A) pressure pulse decrease to 80 mmHg; and (B) pressure pulse increase to 120 mmHg.
Rows 2–5 of Figure 7 show the evolution of flow , membrane potential, cytosolic Ca concentration, and local vascular diameter for the first cell in the modeled afferent arteriole under a pressure pulse decrease to 80 mmHg (left) and a pressure pulse increase to 120 mmHg (right). The pressure decrease leads to a reduction in membrane potential, which triggers a rapid decrease in the amplitude of the Ca concentration oscillations and subsequently a slower drop in the local vascular diameter [29,30]. This reduction in the local vascular diameter corresponds to passive constriction of the model afferent arteriole due to the sudden pressure drop, which is followed by a slower dilation due to the activation of the myogenic response (Figure 7A5) [29]. The short pressure pulse does not allow the local vascular diameter to fully dilate to a diameter larger than the baseline 20.1 m during the pressure decrease. However, the local vascular diameter returns to a larger mean amplitude of oscillations after the return to baseline pressure at 40 s that stabilizes slowly (≫40 s) to the pre-step value. Qualitatively, our model predicts correctly this active response [3,4]. Furthermore, although somewhat slower than reported in the renal experimental literature [3,4], our predicted time course is also quantitatively similar to the predictions of existing vascular models, for example [23,75,76].
In the pressure pulse increase, pressure-activated Ca and Na membrane channels open up, allowing the influx of cations, which in turn lead to an increase in membrane potential as well as cytosolic Ca concentration [29,30]. Following the initial passive dilation, this triggers a rapid active constriction (Figure 7B4, at 20 s). The short pulse period does not allow us to visualize complete constriction in the case of this pressure up-step.
To investigate the propagation of the pressure pulses (Figure 7, first row) throughout the length of the model afferent arteriole, we show the time evolution of membrane potential, cytosolic Ca concentration, and local vascular diameter of 5 different cells located throughout the length of the model vessel during a pressure pulse increase to 140 mmHg in Figure 8. As a result of including the gap junctions (see Section 2.1.2), the membrane potential profiles are similar for all cells. On the other hand, the Ca concentration oscillation amplitude after the pulse shows that the distal cells (cells spanning the terminal ∼20% of the afferent arteriole) differ considerably from their neighbors. The Ca fluctuations further affect the local muscle dynamics such that the diameters of the last model afferent arteriole cells also illustrate larger differences from the proximal and middle cells.
Figure 8.
Predicted time profiles of (A) membrane potential; (B) cytosolic Ca concentration; and (C) local diameter for five cells in the afferent arteriole at an inflow pressure pulse increase to 140 mmHg. For clarity, we only show one in 5 cells along the AA; the behavior of neighboring cells is summarized in Section 3.2.
Figure 9 further illustrates the effect of the myogenic response on the outflow diameter and pressure for the short pulse simulations. Figure 9A corresponds to the steady-state diameter of the afferent arteriole (calculated by time- and space- averaging across all cells). These predictions show that some vasodilation at small inflow pressure pulses and some vasoconstriction at large inflow pressure pulses are observed even when investigating short-term responses to pressure changes. Figure 9B shows that a similar behavior is observed for the time-averaged diameter of the last cell in the model afferent arteriole, as predicted in [55] as well. These predictions indicate that the autoregulatory plateau is conserved, though to a lesser degree, even when considering short-term responses.
Figure 9.
Predicted (A) steady-state diameter (time- and space-averaged across all cells); and (B) time-averaged outflow pressure (for the last afferent arteriole cell), for a range of luminal pressure pulses.
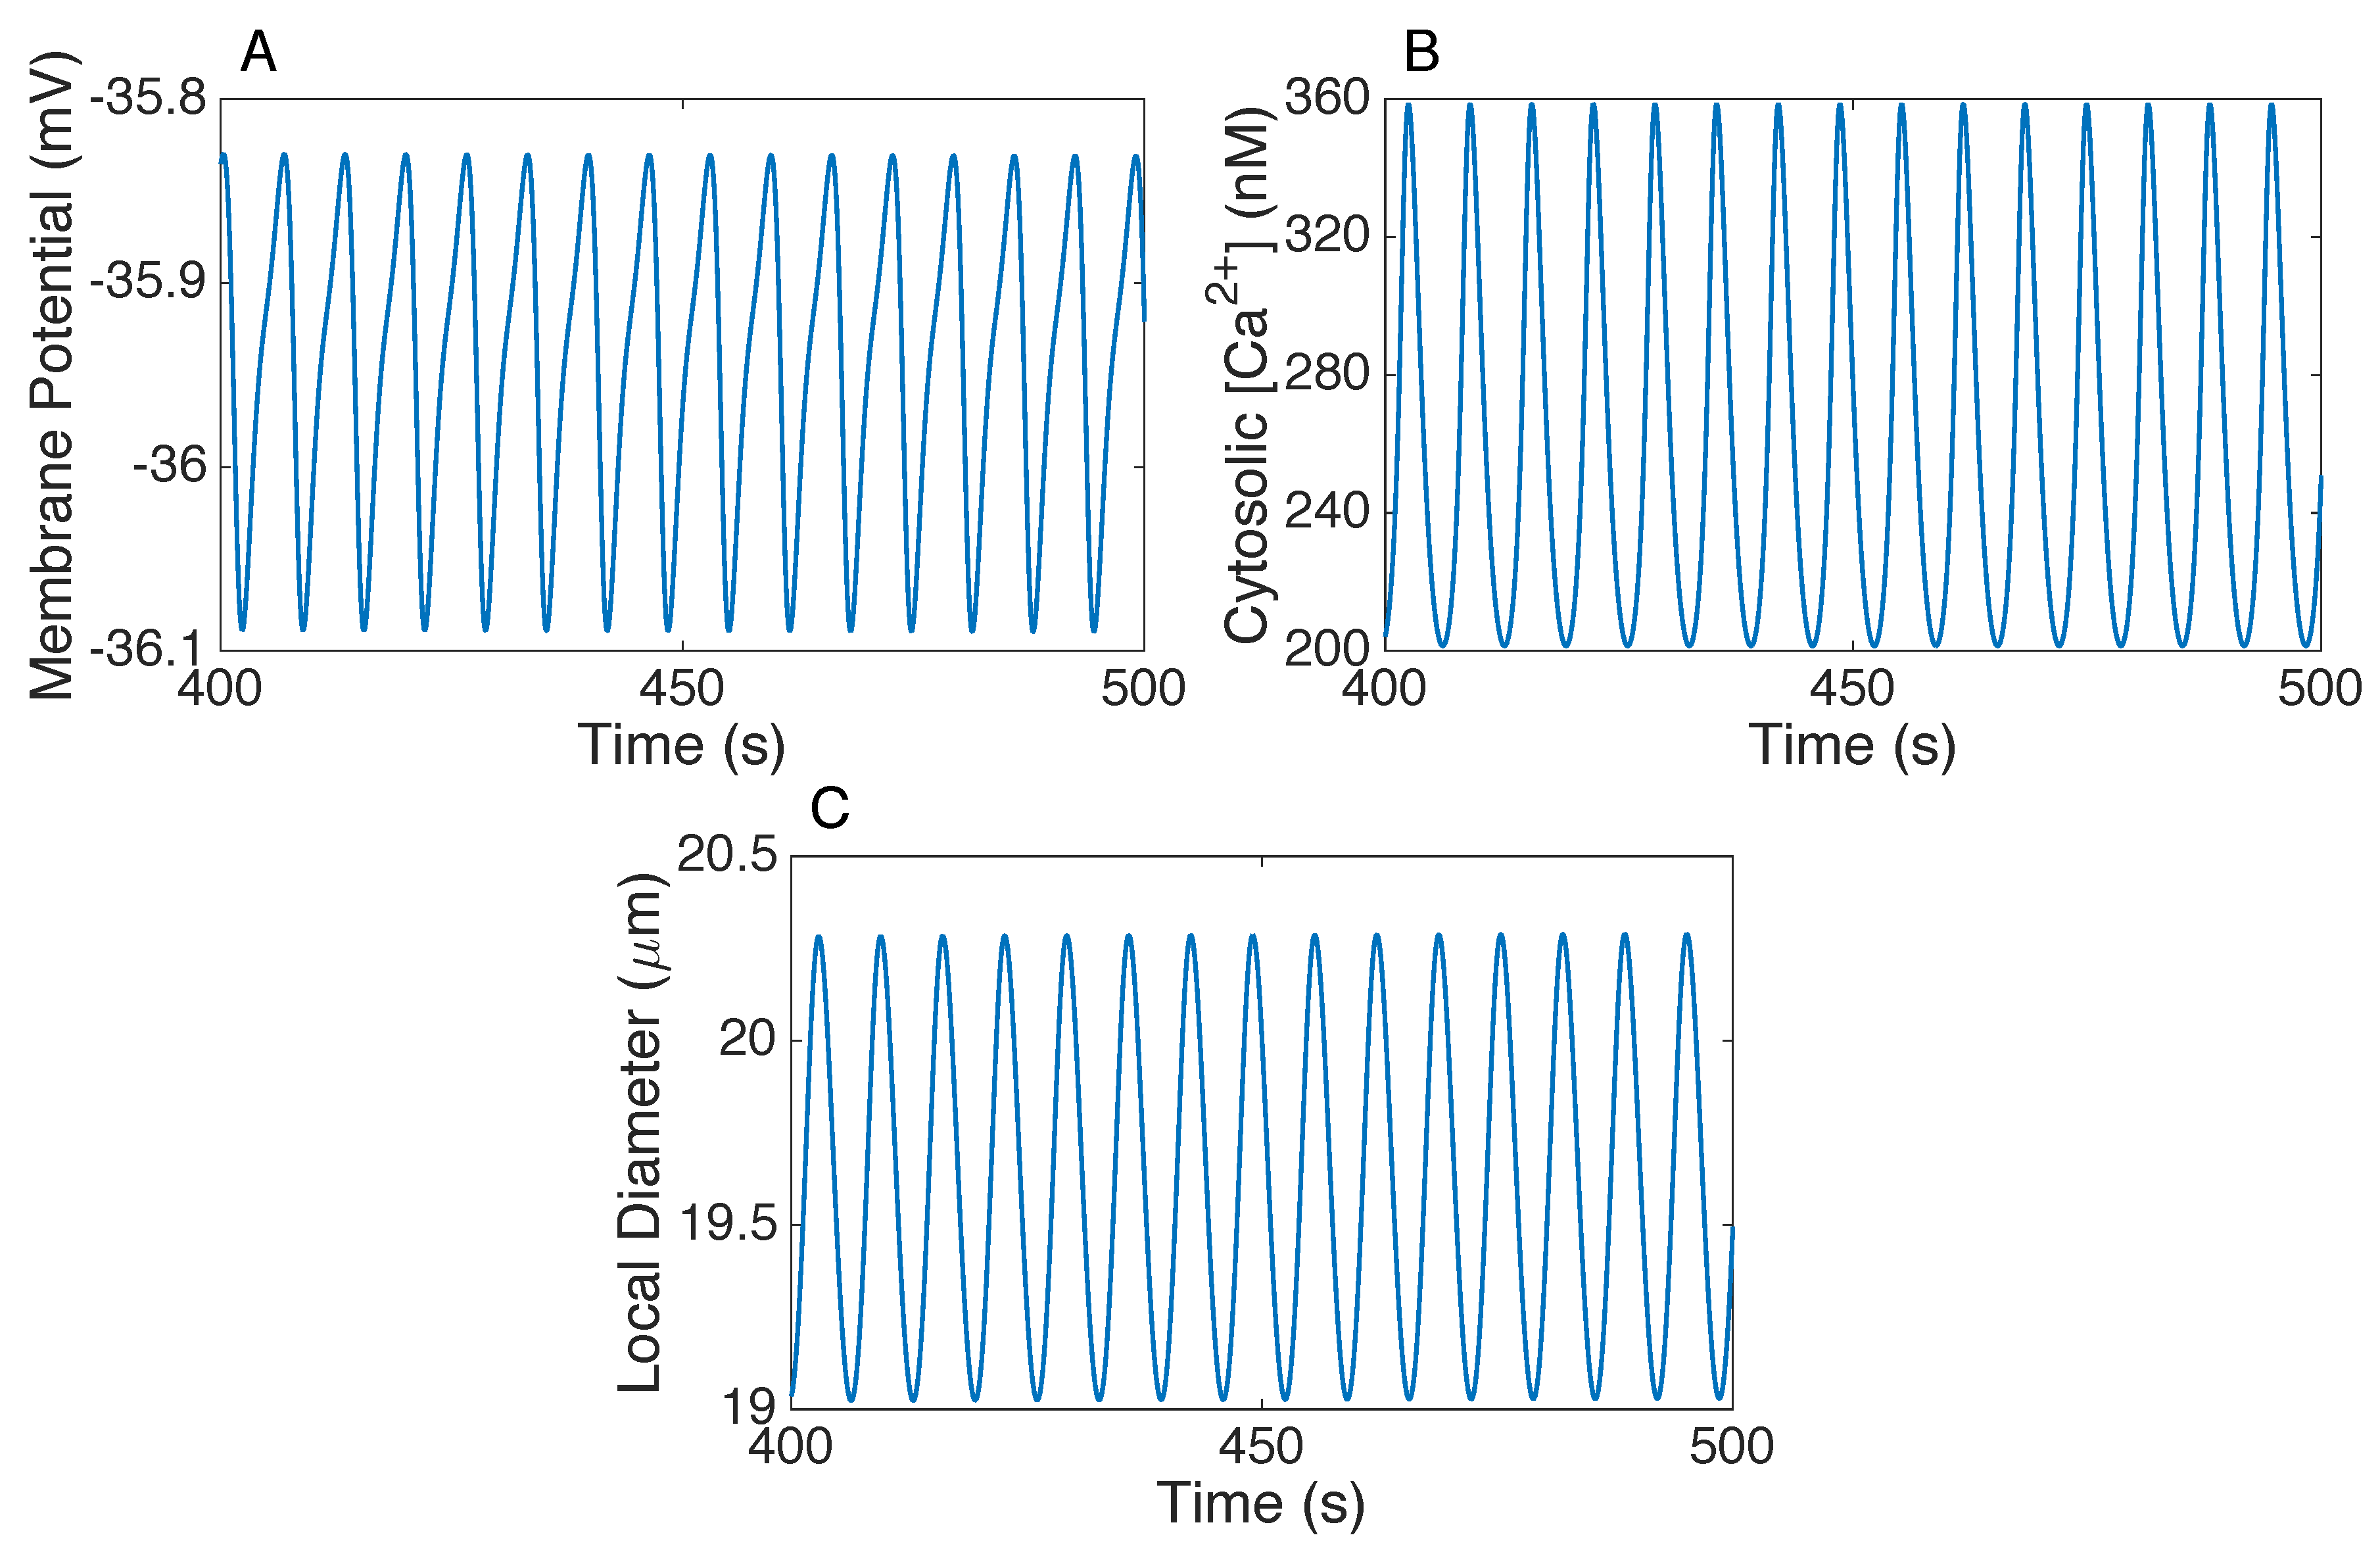
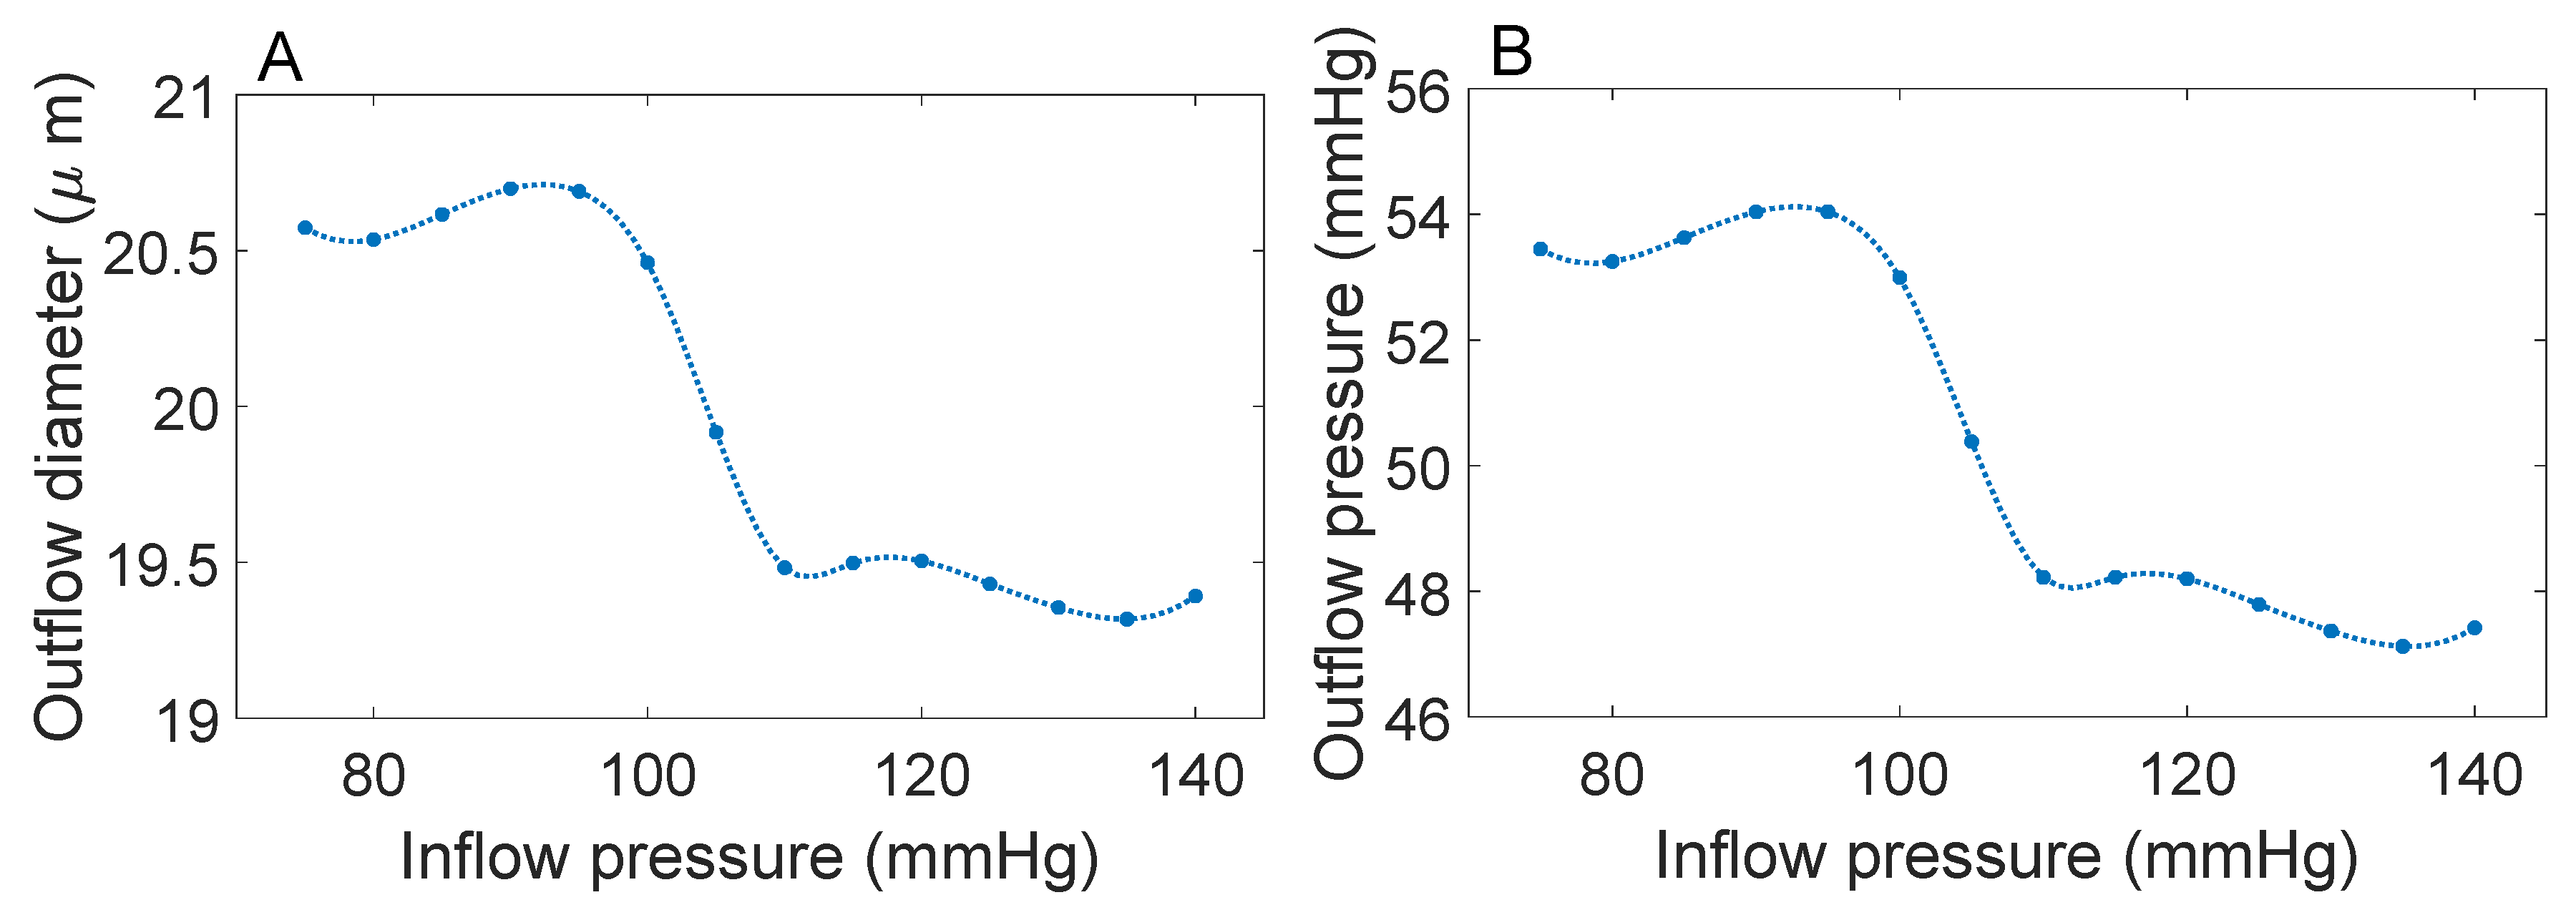
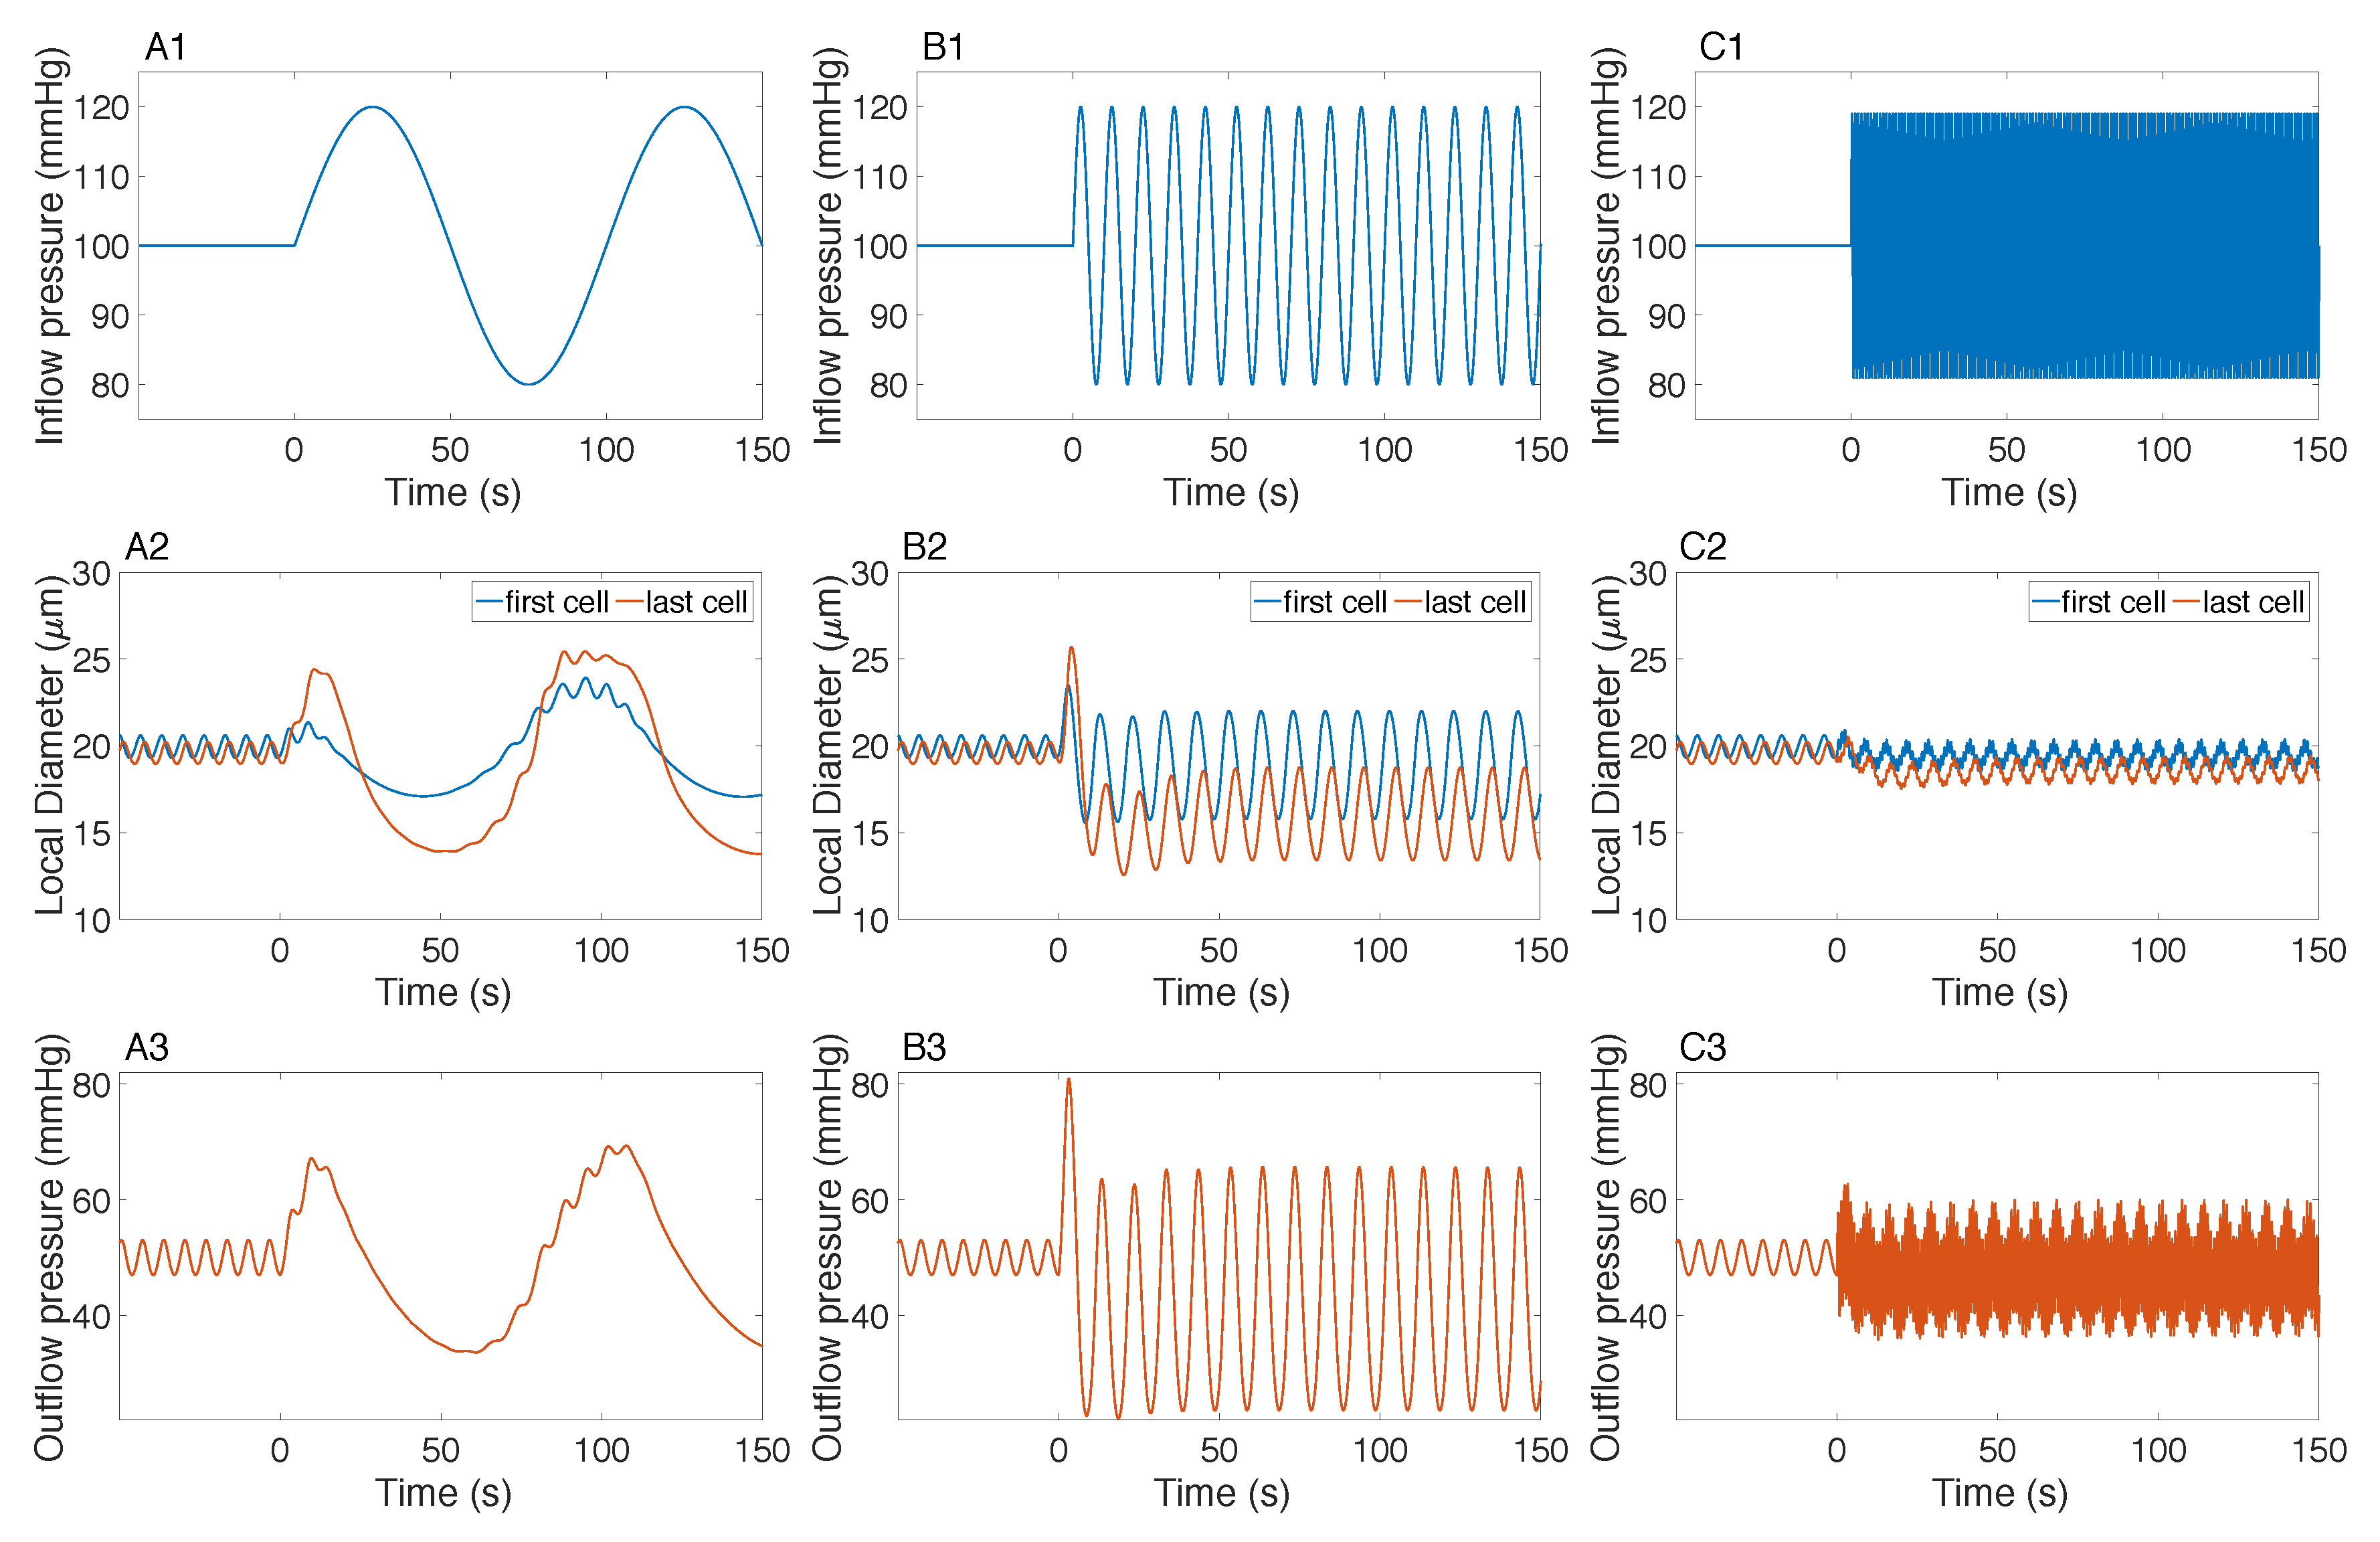
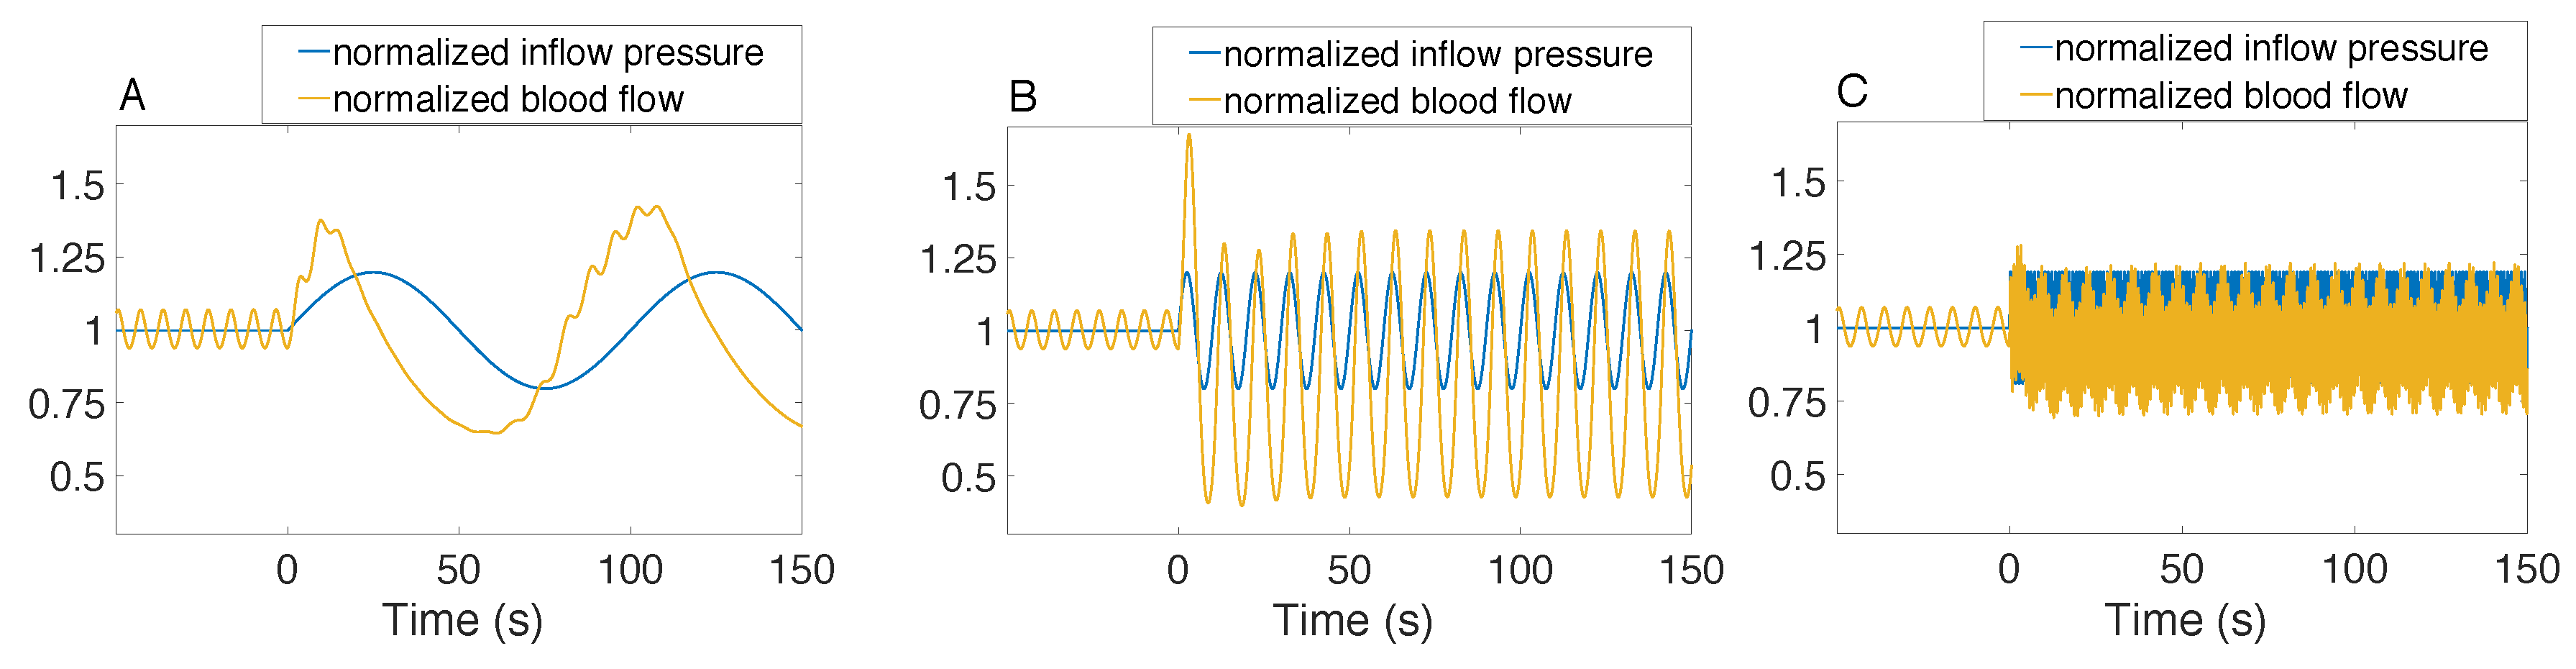
3.3. Responses to Sinusoidal Perturbation
Motivated by experimental studies reporting influences of oscillatory pressure on blood flow [20], we next examined the model afferent arteriole’s behavior under sinusoidal perturbations in the inflow pressure . After setting the inflow pressure to a constant value of for , we perturb the inflow pressure in the form
where A is the amplitude of the sinusoidal inflow pressure and f is the frequency. We studied the model’s response to the perturbations for amplitudes mmHg and mmHg and for a range of frequencies between 0.01 Hz (slower) and 1 Hz (faster).
For each inflow amplitude A and frequency f, we observe that the oscillations in the outflow pressure contain two or more different frequencies. Three such examples are given in Figure 10, where the first row shows the perturbed inflow pressure, the second row shows oscillations in the local vascular diameters for the first and last cells in the afferent arteriole, and the third row shows the resulting outflow pressure. To facilitate the comparison between the induced and predicted perturbations we normalize the corresponding time courses by their respective baseline values and combine them in Figure 11.
Figure 10.
(1) Inflow pressure; and predicted oscillations in (2) local diameter for the first and last cells in the afferent arteriole; and (3) outflow pressure when a sinusoidal perturbation is applied to the inflow pressure with amplitude mmHg and frequency (A) 0.01 Hz; (B) 0.1 Hz; and (C) 1 Hz.
Figure 11.
Normalized inflow pressure and normalized blood flow when a sinusoidal perturbation is applied to the inflow pressure with amplitude mmHg and frequency (A) 0.01 Hz; (B) 0.1 Hz; and (C) 1 Hz.
The larger the frequency f, the more distinct that a “faster oscillation” with a larger frequency as well as a “slower oscillation” with a smaller frequency appears in the outflow pressure curves (Figure 10, third row). The faster oscillation has approximately the same frequency as the inflow frequency f. As f increases the frequency of the slower oscillation increases and then plateaus around the value of approximately 0.15 Hz for Hz (for both amplitudes mmHg and mmHg), which is the natural frequency of the afferent arteriole spontaneous vasomotion reported in Section 3.1.
The amplitude of the outflow pressure is larger or equal to the inflow amplitude A for small frequencies and decreases as the inflow frequency f increases. When the inflow frequency Hz, for mmHg, the outflow amplitude converges to approximately mmHg, and for mmHg, the outflow amplitude converges to approximately mmHg. Thus, for smaller inflow frequencies f, the sinusoidal perturbation leads to irregular oscillations in the local vascular diameters and outflow pressure, and for large inflow frequencies f, the perturbation leads to sustained vasoconstriction [6,20,21,55]. According to the analyses in [26], this behavior is expected since, due to absence of tubuloglomerular feedback (TGF) in the present formulation, dynamic autoregulation at low frequencies f is not incorporated.
Assuming that the afferent arteriole behaved like a rigid tube, a linear relationship between and is expected. To see this, we note that (7) reduces to a constant resistance , and therefore (6) implies the linear dependence. For example, under the assumption of a rigid afferent arteriole, a 10% increase of inflow pressure , as in Figure 10 and Figure 11, would result in a 10% increase of and the sinusoidal oscillations in and would be in phase. However, the afferent arteriole is not a rigid tube, so our simulations indicate a non-linear relationship between these variables. We find that, similar to the outflow pressure amplitude, the amplitude of the normalized blood flow decreases as the inflow frequency f increases and plateaus to approximately for mmHg and approximately for mmHg. Thus, a 10% increase in inflow pressure results in a 17% increase in blood flow rate, and a 20% increase in inflow pressure results in a 29% increase in blood flow rate. The blood flow leads the inflow pressure (Figure 11) since our model does not have a venous system and we have a rigid tube at the end of the afferent arteriole, not a compliant tube. For small input frequencies f, has a phase shift in front of , but as f increases, is shifted after .
4. Discussion
We have developed a multiscale mathematical model of the myogenic response of the mammalian kidney. The model spans subcellular, cellular, and vascular aspects and represents detailed Ca trafficking in each of the afferent arteriole myocytes, as well as the kinetics of myosin light chain phosphorylation, the mechanics of the vascular wall, and blood flow. The developed model is an extension of our preliminary arteriolar model [30], which ignores conduction via the endothelial layer. As of that, the model in [30] might underestimate the effects of conducted myogenic responses [53] and the impact on the overall autoregulatory behavior of the model vessel [55].
Similar to our preliminary model [30], the model of the present study is constructed by connecting a large number of afferent arteriole smooth muscle cells. However, unlike [30], inclusion of the endothelium and intercellular coupling allows a realistic representation of ion diffusion and electric conduction along the afferent arteriole. Further, compared with [30], a fluid dynamics model is also added to relate fluid pressure, fluid flow, and vascular resistance so as to allow accurate predictions of all variables required for the activation of the myogenic response. It is also worth noting that our present model also overcomes a numerical limitation on cell size that restricted our approach in [30].
Characteristic simulations show that at physiologic blood pressure, the model predicts spontaneous oscillations (Figure 4) in cytosolic [Ca] and in vascular diameter consistent with numerous experimental and theoretical findings, for example [2,3,4,26]. Those oscillations arise from the dynamic exchange of Ca between the cytosol and the sarcoplasmic reticulum, coupled to the stimulation of Ca-activated potassium and chloride channels, and the modulation of voltage-activated L-type channels [29,30]. Spontaneous oscillations of the afferent arteriole muscle tone result in oscillations in vascular resistance, fluid pressure, and flow [7].
As in predecessor models such as [7,29], the present model formulates the myogenic response under the assumption that the response is initiated by pressure-activated Ca and Na channels found in the cell membrane of the afferent arteriole myocytes [62]. However, the precise molecular cascade through which pressure changes activate ion channels in renal vascular smooth muscle cells has not been characterized physically yet [4,5]. Hence, our formulation of this aspect remains only phenomenological at this point, constructed in such a way that predicted integrated vasoresponses agree with experimental findings relating luminal blood pressure, cell membrane potential, and cytosolic Ca and Na concentrations [29,55]. Despite this phenomenological assumption, the developed model afferent arteriole is able to stabilize, to a significant degree, outflow pressure for a range of steady-state inflow pressure spanning 80–180 mmHg (Figure 5).
Additionally, the afferent arteriole model described here reproduces the myogenic response even in the dynamic context. Characteristically, the model maintains an autoregulatory plateau even when challenged with short-term pulses in the inflow pressure (Figure 9). Differences in the distal cells in the model vessel are observed, and may be explained by the fluctuations in Ca due to the pressure pulses. Additionally, sinusoidal perturbations in the inflow pressure are also investigated, and the responses are found to depend on the amplitude and frequency of the perturbation. Since the afferent arteriole is an actively compliant tube, the effect of different amplitude oscillations are found to influence both the increase in the blood flow rate and the phase shift between inflow pressure and flow rate.
Among the limitations of the present study is the high computational cost of modeling large vessels consisting of multiple cells. For this reason, we use a simplified endothelium model similar to [7,27,55], although physiologically, a more complex model would be necessary to predict dynamics at slower time scales. The model endothelium compartment does however act as a low-resistance pathway between the membranes of distant cells, as expected, for the time scales of the myogenic response under consideration.
In reality, renal hemodynamics is a significantly more complicated process than modeled here, with dynamics influenced also by inputs from other processes and organs, which we do not currently incorporate into the model. In addition, our model is fully deterministic, and could benefit from a study of more realistic stochastic pressure perturbations. While our results agree with baseline expectations, our work is a modeling study and so it requires experimental validation. Our model allows for carrying out simulations of realistic scenarios and experiments that may not be easily performed otherwise. For example, direct assessment of the myogenic response would require single afferent arteriole or single nephron studies. This requires access to the kidney’s interior, as well as studying afferent arterioles in isolation; these are challenging experiments, partly because preparation procedures may significantly alter the afferent arteriole’s behavior.
Alongside the myogenic response, another major mechanism contributing in renal hemodynamic control is tubuloglomerular feedback (TGF) [1,56]. Independently of the myogenic response which is triggered by local blood pressure perturbations, tubuloglomerular feedback is triggered by salt reabsorption in the downstream nephron that, in turn, depends on filtration rate. As the triggering signals of the two mechanisms are largely independent but interrelated through blood flow which influences both local pressure and filtration rate, highly non-trivial interactions among the two mechanisms are developed [4,7,26,77]. A potential extension of the present afferent arteriole model would be to include a model of nephron transport (e.g., [78,79,80,81,82]) and tubuloglomerular feedback (e.g., [7,83,84,85]). That would result in an integrative model of renal hemodynamics regulation that can be used for studying the interactions between the myogenic and tubuloglomerular feedback mechanisms in the context of renal autoregulation and for investigating changes in renal hemodynamics in pathophysiological conditions, especially under circumstances (e.g., hypertension and diabetes mellitus) involving complex multilevel responses [5].
Author Contributions
M.-V.C., T.L.S., I.S. and A.L. designed research; M.-V.C. and T.L.S. performed numerical simulations; M.-V.C., T.L.S., I.S. and A.L. analyzed results, and M.-V.C., T.L.S., I.S. and A.L. wrote the paper.
Funding
The authors acknowledge support from NSF Award #DBI-1300426 (NIMBioS), National Institutes of Health: National Institute of Diabetes and Digestive and Kidney Diseases grant #DK089066 and National Science Foundation award #DMS-1263995 (AT Layton).
Acknowledgments
This work is the product of a workshop and short-term visits supported by the National Institute for Mathematical and Biological Synthesis (NIMBioS).
Conflicts of Interest
The authors declare no conflict of interest.
References
- Hall, J.E. Guyton and Hall Textbook of Medical Physiology; Elsevier Health Sciences: New York, NY, USA, 2015. [Google Scholar]
- Holstein-Rathlou, N.H.; Marsh, D.J. Renal blood flow regulation and arterial pressure fluctuations: A case study in nonlinear dynamics. Physiol. Rev. 1994, 74, 637–681. [Google Scholar] [CrossRef] [PubMed]
- Just, A.; Arendshorst, W.J. Dynamics and contribution of mechanisms mediating renal blood flow autoregulation. Am. J. Physiol. Regul. Integr. Comp. Physiol. 2003, 285, R619–R631. [Google Scholar] [CrossRef] [PubMed]
- Cupples, W.A.; Braam, B. Assessment of renal autoregulation. Am. J. Physiol. Ren. Physiol. 2007, 292, F1105–F1123. [Google Scholar] [CrossRef] [PubMed]
- Carlström, M.; Wilcox, C.S.; Arendshorst, W.J. Renal autoregulation in health and disease. Physiol. Rev. 2015, 95, 405–511. [Google Scholar] [CrossRef] [PubMed]
- Chen, J.; Sgouralis, I.; Moore, L.C.; Layton, H.E.; Layton, A.T. A mathematical model of the myogenic response to systolic pressure in the afferent arteriole. Am. J. Physiol. Ren. Physiol. 2011, 300, F669–F681. [Google Scholar] [CrossRef] [PubMed]
- Sgouralis, I.; Layton, A.T. Theoretical assessment of renal autoregulatory mechanisms. Am. J. Physiol. Ren. Physiol. 2014, 306, F1357–F1371. [Google Scholar] [CrossRef] [PubMed]
- Casellas, D.; Moore, L.C. Autoregulation of intravascular pressure in preglomerular juxtamedullary vessels. Am. J. Physiol. Ren. Physiol. 1993, 264, F315–F321. [Google Scholar] [CrossRef] [PubMed]
- Aukland, K.; Oien, A. Renal autoregulation: models combining tubuloglomerular feedback and myogenic response. Am. J. Physiol. Ren. Physiol. 1987, 252, F768–F783. [Google Scholar] [CrossRef] [PubMed]
- Moore, L.C.; Rich, A.; Casellas, D. Ascending myogenic autoregulation: Interactions between tubuloglomerular feedback and myogenic mechanisms. Bull. Math. Biol. 1994, 56, 391–410. [Google Scholar] [CrossRef] [PubMed]
- Shipley, R.; Study, R. Changes in renal blood flow, extraction of inulin, glomerular filtration rate, tissue pressure and urine flow with acute alterations of renal artery blood pressure. Am. J. Physiol. Leg. Content 1951, 167, 676–688. [Google Scholar] [CrossRef] [PubMed]
- Rothe, C.F.; Nash, F.D.; Thompson, D.E. Patterns in autoregulation of renal blood flow in the dog. Am. J. Physiol. Leg. Content 1971, 220, 1621–1626. [Google Scholar] [CrossRef] [PubMed]
- Arendshorst, W.J. Autoregulation of renal blood flow in spontaneously hypertensive rats. Circ. Res. 1979, 44, 344–349. [Google Scholar] [CrossRef] [PubMed]
- Kirchheim, H.; Ehmke, H.; Hackenthal, E.; Löwe, W.; Persson, P. Autoregulation of renal blood flow, glomerular filtration rate and renin release in conscious dogs. Pflügers Archiv-Eur. J. Physiol. 1987, 410, 441–449. [Google Scholar] [CrossRef]
- Hayashi, K.; Epstein, M.; Loutzenhiser, R.; Forster, H. Impaired myogenic responsiveness of the afferent arteriole in streptozotocin-induced diabetic rats: role of eicosanoid derangements. J. Am. Soc. Nephrol. 1992, 2, 1578–1586. [Google Scholar] [PubMed]
- Van Dokkum, R.P.; Sun, C.W.; Provoost, A.P.; Jacob, H.J.; Roman, R.J. Altered renal hemodynamics and impaired myogenic responses in the fawn-hooded rat. Am. J. Physiol. Regul. Integr. Comp. Physiol. 1999, 276, R855–R863. [Google Scholar] [CrossRef]
- Mitrou, N.; Braam, B.; Cupples, W.A. A gap junction inhibitor, carbenoxolone, induces spatiotemporal dispersion of renal cortical perfusion and impairs autoregulation. Am. J. Physiol. Heart Circ. Physiol. 2016, 311, H582–H591. [Google Scholar] [CrossRef] [PubMed]
- Moss, N.G.; Gentle, T.K.; Arendshorst, W.J. Modulation of the myogenic mechanism: concordant effects of NO synthesis inhibition and O2- dismutation on renal autoregulation in the time and frequency domains. Am. J. Physiol. Ren. Physiol. 2016, 310, F832–F845. [Google Scholar] [CrossRef] [PubMed]
- Oien, A.; Aukland, K. A mathematical analysis of the myogenic hypothesis with special reference to autoregulation of renal blood flow. Circ. Res. 1983, 52, 241–252. [Google Scholar] [CrossRef] [PubMed]
- Loutzenhiser, R.; Bidani, A.; Chilton, L. Renal myogenic response: Kinetic attributes and physiological role. Circ. Res. 2002, 90, 1316–1324. [Google Scholar] [CrossRef] [PubMed]
- Loutzenhiser, R.; Bidani, A.K.; Wang, X. Systolic pressure and the myogenic response of the renal afferent arteriole. Acta Physiol. Scand. 2004, 181, 407–413. [Google Scholar] [CrossRef] [PubMed]
- Marsh, D.J.; Sosnovtseva, O.V.; Chon, K.H.; Holstein-Rathlou, N.H. Nonlinear interactions in renal blood flow regulation. Am. J. Physiol. Regul. Integr. Comp. Physiol. 2005, 288, R1143–R1159. [Google Scholar] [CrossRef] [PubMed]
- Kleinstreuer, N.; David, T.; Plank, M.J.; Endre, Z. Dynamic myogenic autoregulation in the rat kidney: A whole-organ model. Am. J. Physiol. Ren. Physiol. 2008, 294, F1453–F1464. [Google Scholar] [CrossRef] [PubMed]
- Marsh, D.J.; Wexler, A.S.; Brazhe, A.; Postnov, D.E.; Sosnovtseva, O.V.; Holstein-Rathlou, N.H. Multinephron dynamics on the renal vascular network. Am. J. Physiol. Ren. Physiol. 2012, 304, F88–F102. [Google Scholar] [CrossRef] [PubMed]
- Postnov, D.; Postnov, D.; Marsh, D.; Holstein-Rathlou, N.H.; Sosnovtseva, O. Dynamics of nephron-vascular network. Bull. Math. Biol. 2012, 74, 2820–2841. [Google Scholar] [CrossRef] [PubMed]
- Sgouralis, I.; Maroulas, V.; Layton, A.T. Transfer Function Analysis of Dynamic Blood Flow Control in the Rat Kidney. Bull. Math. Biol. 2016, 78, 923–960. [Google Scholar] [CrossRef] [PubMed]
- Sgouralis, I.; Layton, A.T. Conduction of feedback-mediated signal in a computational model of coupled nephrons. Math. Med. Biol. 2015, 33, 87–106. [Google Scholar] [CrossRef] [PubMed]
- Postnov, D.D.; Marsh, D.J.; Postnov, D.E.; Braunstein, T.H.; Holstein-Rathlou, N.H.; Martens, E.A.; Sosnovtseva, O. Modeling of kidney hemodynamics: Probability-based topology of an arterial network. PLoS Comput. Biol. 2016, 12, e1004922. [Google Scholar] [CrossRef] [PubMed]
- Edwards, A.; Layton, A. Calcium dynamics underlying the afferent arteriole myogenic response. Am. J. Physiol. Ren. Physiol. 2014, 306, F34–F48. [Google Scholar] [CrossRef] [PubMed]
- Ciocanel, M.V.; Stepien, T.L.; Edwards, A.; Layton, A.T. Modeling autoregulation of the afferent arteriole of the rat kidney. In Women in Mathematical Biology; Springer: Berlin, Germany, 2017; pp. 75–100. [Google Scholar]
- Gui, P.; Chao, J.T.; Wu, X.; Yang, Y.; Davis, G.E.; Davis, M.J. Coordinated regulation of vascular Ca2+ and K+ channels by integrin signaling. In Integrins and Ion Channels; Springer: Berlin, Germany, 2010; pp. 69–79. [Google Scholar]
- Pozzi, A.; Zent, R. Integrins in kidney disease. J. Am. Soc. Nephrol. 2013, 24, 1034–1039. [Google Scholar] [CrossRef] [PubMed]
- Hamm, L.L.; Feng, Z.; Hering-Smith, K.S. Regulation of sodium transport by ENaC in the kidney. Curr. Opin. Nephrol. Hypertens. 2010, 19, 98–105. [Google Scholar] [CrossRef] [PubMed]
- Bhalla, V.; Hallows, K.R. Mechanisms of ENaC regulation and clinical implications. J. Am. Soc. Nephrol. 2008, 19, 1845–1854. [Google Scholar] [CrossRef] [PubMed]
- Arendshorst, W.J.; Brännström, K.; Ruan, X. Actions of angiotensin II on the renal microvasculature. J. Am. Soc. Nephrol. 1999, 10, S149–S161. [Google Scholar] [PubMed]
- Yang, R.; Smolders, I.; Dupont, A.G. Blood pressure and renal hemodynamic effects of angiotensin fragments. Hypertens. Res. 2011, 34, 674–683. [Google Scholar] [CrossRef] [PubMed]
- Giani, J.F.; Janjulia, T.; Taylor, B.; Bernstein, E.A.; Shah, K.; Shen, X.Z.; McDonough, A.A.; Bernstein, K.E.; Gonzalez-Villalobos, R.A. Renal generation of angiotensin II and the pathogenesis of hypertension. Curr. Hypertens. Rep. 2014, 16, 477. [Google Scholar] [CrossRef] [PubMed]
- Sparks, M.A.; Crowley, S.D.; Gurley, S.B.; Mirotsou, M.; Coffman, T.M. Classical Renin-Angiotensin System in Kidney Physiology. Compr. Physiol. 2014, 4, 1201–1228. [Google Scholar] [PubMed]
- Majid, D.S.; Navar, L.G. Nitric oxide in the control of renal hemodynamics and excretory function. Am. J. Hypertens. 2001, 14, 74S–82S. [Google Scholar] [CrossRef]
- Mount, P.; Power, D.A. Nitric oxide in the kidney: Functions and regulation of synthesis. Acta Physiol. 2006, 187, 433–446. [Google Scholar] [CrossRef] [PubMed]
- Barber, J.D.; Moss, N.G. Reduced renal perfusion pressure causes prostaglandin-dependent excitation of R2 chemoreceptors in rats. Am. J. Physiol. Regul. Integr. Comp. Physiol. 1990, 259, R1243–R1249. [Google Scholar] [CrossRef] [PubMed]
- Moss, N.G.; Vogel, P.A.; Kopple, T.E.; Arendshorst, W.J. Thromboxane-induced renal vasoconstriction is mediated by the ADP-ribosyl cyclase CD38 and superoxide anion. Am. J. Physiol. Ren. Physiol. 2013, 305, F830–F838. [Google Scholar] [CrossRef] [PubMed]
- Moss, N.G.; Kopple, T.E.; Arendshorst, W.J. Renal vasoconstriction by vasopressin V1a receptors is modulated by nitric oxide, prostanoids, and superoxide but not the ADP ribosyl cyclase CD38. Am. J. Physiol. Ren. Physiol. 2014, 306, F1143–F1154. [Google Scholar] [CrossRef] [PubMed]
- Vogel, P.A.; Yang, X.; Moss, N.G.; Arendshorst, W.J. Superoxide Enhances Ca2+ Entry Through L-Type Channels in the Renal Afferent ArterioleNovelty and Significance. Hypertension 2015, 66, 374–381. [Google Scholar] [CrossRef] [PubMed]
- Loutzenhiser, R.; Griffin, K.; Williamson, G.; Bidani, A. Renal autoregulation: New perspectives regarding the protective and regulatory roles of the underlying mechanisms. Am. J. Physiol. Regul. Integr. Comp. Physiol. 2006, 290, R1153–R1167. [Google Scholar] [CrossRef] [PubMed]
- Inscho, E.W. Mysteries of renal autoregulation. Hypertension 2009, 53, 299–306. [Google Scholar] [CrossRef] [PubMed]
- Montanari, A.; Pelà, G.; Musiari, L.; Crocamo, A.; Boeti, L.; Cabassi, A.; Biggi, A.; Cherney, D.Z. Nitric oxide-angiotensin II interactions and renal hemodynamic function in patients with uncomplicated type 1 diabetes. Am. J. Physiol. Ren. Physiol. 2013, 305, F42–F51. [Google Scholar] [CrossRef] [PubMed]
- Mitrou, N.; Morrison, S.; Mousavi, P.; Braam, B.; Cupples, W.A. Transient impairment of dynamic renal autoregulation in early diabetes mellitus in rats. Ame. J. Physiol. Regul. Integr. Comp. Physiol. 2015, 309, R892–R901. [Google Scholar] [CrossRef] [PubMed]
- Griffin, K.A. Hypertensive kidney injury and the progression of chronic kidney disease. Hypertension 2017, 70, 687–694. [Google Scholar] [CrossRef] [PubMed]
- Bidani, A.K.; Griffin, K.A.; Epstein, M. Hypertension and chronic kidney disease progression: Why the suboptimal outcomes? Am. J. Med. 2012, 125, 1057–1062. [Google Scholar] [CrossRef] [PubMed]
- Moore, L.C.; Casellas, D. Tubuloglomerular feedback dependence of autoregulation in rat juxtamedullary afferent arterioles. Kidney Int. 1990, 37, 1402–1408. [Google Scholar] [CrossRef] [PubMed]
- Nordsletten, D.A.; Blackett, S.; Bentley, M.D.; Ritman, E.L.; Smith, N.P. Structural morphology of renal vasculature. Am. J. Physiol. Heart Circ. Physiol. 2006, 291, H296–H309. [Google Scholar] [CrossRef] [PubMed]
- Casellas, D.; Carmines, P.K. Control of the renal microcirculation: Cellular and integrative perspectives. Curr. Opin. Nephrol. Hypertens. 1996, 5, 57–63. [Google Scholar] [CrossRef] [PubMed]
- Steinhausen, M.; Endlich, K.; Nobiling, R.; Parekh, N.; Schütt, F. Electrically induced vasomotor responses and their propagation in rat renal vessels in vivo. J. Physiol. 1997, 505, 493–501. [Google Scholar] [CrossRef] [PubMed]
- Sgouralis, I.; Layton, A. Autoregulation and conduction of vasomotor responses in a mathematical model of the rat afferent arteriole. Am. J. Physiol. Ren. Physiol. 2012, 303, F229–F239. [Google Scholar] [CrossRef] [PubMed]
- Sgouralis, I.; Layton, A.T. Mathematical modeling of renal hemodynamics in physiology and pathophysiology. Math. Biosci. 2015, 264, 8–20. [Google Scholar] [CrossRef] [PubMed]
- Pries, A.; Secomb, T.; Gessner, T.; Sperandio, M.; Gross, J.; Gaehtgens, P. Resistance to blood flow in microvessels in vivo. Circ. Res. 1994, 75, 904–915. [Google Scholar] [CrossRef] [PubMed]
- Brenner, B.M.; Troy, J.L.; Daugharty, T.M. Pressures in cortical structures of the rat kidney. Am. J. Physiol. 1972, 222, 246–251. [Google Scholar] [CrossRef] [PubMed]
- Leyssac, P.P. Further studies on oscillating tubulo-glomerular feedback responses in the rat kidney. Acta Physiol. Scand. 1986, 126, 271–277. [Google Scholar] [CrossRef] [PubMed]
- Sgouralis, I.; Layton, A.T. Control and modulation of fluid flow in the rat kidney. Bull. Math. Biol. 2013, 75, 2551–2574. [Google Scholar] [CrossRef] [PubMed]
- Brink, P.R. Gap junctions in vascular smooth muscle. Acta Physiol. Scand. 1998, 164, 349–356. [Google Scholar] [CrossRef] [PubMed]
- Davis, M.J.; Hill, M.A. Signaling mechanisms underlying the vascular myogenic response. Physiol. Rev. 1999, 79, 387–423. [Google Scholar] [CrossRef] [PubMed]
- Kapela, A.; Nagaraja, S.; Tsoukias, N.M. A mathematical model of vasoreactivity in rat mesenteric arterioles. II. Conducted vasoreactivity. Am. J. Physiol. Heart Circ. Physiol. 2009, 298, H52–H65. [Google Scholar] [CrossRef] [PubMed]
- Tran, C.H.T.; Vigmond, E.J.; Goldman, D.; Plane, F.; Welsh, D.G. Electrical communication in branching arterial networks. Am. J. Physiol. Heart Circ. Physiol. 2012, 303, H680–H692. [Google Scholar] [CrossRef] [PubMed]
- Diep, H.K.; Vigmond, E.J.; Segal, S.S.; Welsh, D.G. Defining electrical communication in skeletal muscle resistance arteries: A computational approach. J. Physiol. 2005, 568, 267–281. [Google Scholar] [CrossRef] [PubMed]
- Hald, B.O. A generative modeling approach to connectivity? Electrical conduction in vascular networks. J. Theor. Biol. 2016, 399, 1–12. [Google Scholar] [CrossRef] [PubMed]
- Shampine, L.F.; Reichelt, M.W. The MATLAB ODE Suite. SIAM J. Sci. Comput. 1997, 18, 1–22. [Google Scholar] [CrossRef]
- Brenan, K.E.; Campbell, S.L.; Petzold, L.R. Numerical Solution of Initial-Value Problems in Differential-Algebraic Equations; Society for Industrial and Applied Mathematics: Philadelphia, PA, USA, 1996; Volume 14. [Google Scholar]
- Chilton, L.; Loutzenhiser, K.; Morales, E.; Breaks, J.; Kargacin, G.J.; Loutzenhiser, R. Inward rectifier K+ currents and Kir2.1 expression in renal afferent and efferent arterioles. J. Am. Soc. Nephrol. 2008, 19, 69–76. [Google Scholar] [CrossRef] [PubMed]
- Loutzenhiser, K.; Loutzenhiser, R. Angiotensin II-induced Ca2+ influx in renal afferent and efferent arterioles: Differing roles of voltage-gated and store-operated Ca2+ entry. Circ. Res. 2000, 87, 551–557. [Google Scholar] [CrossRef] [PubMed]
- Casellas, D.; Moore, L.C. Autoregulation and tubuloglomerular feedback in juxtamedullary glomerular arterioles. Am. J. Physiol. 1990, 258, F660–F669. [Google Scholar] [CrossRef] [PubMed]
- Thomson, S.C.; Blantz, R.C. Biophysics of glomerular filtration. Compr. Physiol. 2012, 2, 1671–1699. [Google Scholar] [PubMed]
- Loutzenhiser, R.; Chilton, L.; Trottier, G. Membrane potential measurements in renal afferent and efferent arterioles: Actions of angiotensin II. Am. J. Physiol. Ren. Physiol. 1997, 273, F307–F314. [Google Scholar] [CrossRef] [PubMed]
- Bidani, A.K.; Hacioglu, R.; Abu-Amarah, I.; Williamson, G.A.; Loutzenhiser, R.; Griffin, K.A. “Step” vs. “dynamic” autoregulation: Implications for susceptibility to hypertensive injury. Am. J. Physiol. Ren. Physiol. 2003, 285, F113–F120. [Google Scholar] [CrossRef] [PubMed]
- Carlson, B.E.; Arciero, J.C.; Secomb, T.W. Theoretical model of blood flow autoregulation: Roles of myogenic, shear-dependent, and metabolic responses. Am. J. Physiol. Heart Circ. Physiol. 2008, 295, H1572–H1579. [Google Scholar] [CrossRef] [PubMed]
- Arciero, J.; Secomb, T. Spontaneous oscillations in a model for active control of microvessel diameters. Math. Med. Biol. 2010, 29, 163–180. [Google Scholar] [CrossRef] [PubMed]
- Versypt, A.N.F.; Makrides, E.; Arciero, J.C.; Ellwein, L.; Layton, A.T. Bifurcation study of blood flow control in the kidney. Math. Biosci. 2015, 263, 169–179. [Google Scholar] [CrossRef] [PubMed]
- Layton, A.; Vallon, V.; Edwards, A. Modeling oxygen consumption in the proximal tubule: Effects of NHE and SGLT2 inhibition. Am. J. Physiol. Ren. Physiol. 2015, 308, F1343–F1357. [Google Scholar] [CrossRef] [PubMed]
- Layton, A.; Vallon, V.; Edwards, A. Predicted Consequences of diabetes and SGLT inhibition on transport and oxygen consumption along a rat nephron. Am. J. Physiol. Ren. Physiol. 2016, 310, F1269–F1283. [Google Scholar] [CrossRef] [PubMed]
- Layton, A.; Vallon, V.; Edwards, A. A computational model for simulating solute transport and oxygen consumption along the nephron. Am. J. Physiol. Ren. Physiol. 2016, 311, F1378–F1390. [Google Scholar] [CrossRef] [PubMed]
- Layton, A.; Laghmani, K.; Vallon, V.; Edwards, A. Solute transport and oxygen consumption along the nephrons: Effects of Na+ transport inhibitors. Am. J. Physiol. Ren. Physiol. 2016, 311, F1217–F1229. [Google Scholar] [CrossRef] [PubMed]
- Layton, A.T.; Edwards, A.; Vallon, V. Adaptive changes in GFR, tubular morphology, and transport in subtotal nephrectomized kidneys: Modeling and analysis. Am. J. Physiol. Ren. Physiol. 2017, 313, F199–F209. [Google Scholar] [CrossRef] [PubMed]
- Layton, A. Feedback-mediated dynamics in a model of a compliant thick ascending limb. Math. Biosci. 2010, 228, 185–194. [Google Scholar] [CrossRef] [PubMed]
- Layton, A.; Moore, L.; Layton, H. Multistable dynamics mediated by tubuloglomerular feedback in a model of coupled nephrons. Bull. Math. Biol. 2009, 71, 515–555. [Google Scholar] [CrossRef] [PubMed]
- Ryu, H.; Layton, A. Effect of tubular inhomogeneities on feedback-mediated dynamics of a model of a thick ascending limb. Med. Math. Biol. 2012, 30, 191–212. [Google Scholar] [CrossRef] [PubMed]
© 2018 by the authors. Licensee MDPI, Basel, Switzerland. This article is an open access article distributed under the terms and conditions of the Creative Commons Attribution (CC BY) license (http://creativecommons.org/licenses/by/4.0/).