Abstract
The spinner flask bioreactor has been widely used in in vitro cell culturing processes due to its superiority in providing a homogeneous culture environment compared to traditional culturing methods. However, there is limited understanding of the flow fields in these bioreactors, and optimum culture conditions are yet to be determined. This article presents the experimental characterization of the flow field within a spinner flask at varying speeds (10 RPM to 80 RPM) and impeller positions. An optical, non-invasive measurement technique, Particle Image Velocimetry (PIV), was employed to illustrate the fluid flow and calculate the stresses and vorticity associated with the flow within the flask. The largest recirculation structure was observed in the meridional plane at the highest impeller position while the highest shear stress region was observed at the base of the spinner flask. The study provides an overview of the fluid structure within the spinner flask in the meridional and azimuthal planes. Furthermore, the results presented in this study give an accurate quantification of the range of stresses for the given impeller speeds. These results provide estimates of the biomechanical properties within the type of spinner flask used in many published cell studies.
1. Introduction
Stem cells have great potential in regenerative medicine due to their ability to differentiate to multiple lineages. The self-renewal ability possessed by these cells is highly suitable to replenish damaged cells, which could be caused by injury or degeneration due to age. When the cells divide, they could produce either a similar cell type or differentiated cells [1].
Stem cells inherently exist in all organisms and serve as an internal repair mechanism for damaged tissue. However, the number of stem cells present in organisms is very low. Before any cell therapy can be realized, an optimized cell culture system is required to increase the number of cells for clinical treatment. A high-throughput bioreactor is essential to ensure that optimum level of cell expansion can be achieved while maintaining its genetic stability at the end of the culture process.
The static culture system using petri dishes and T-flasks has been the classical method for cell expansion since the early work by Dexter et al. [2]. The simplicity of the setup is the main attraction for many research studies. Media were replenished after a specific time to allow continuous nutrient supply. Although being the most prominent method in cell culture, this technique nevertheless has several limitations including lack of mixing, which causes concentration variance in culture condition, and limited surface area to support the number of cells in the system [3,4].
The dynamic culture system offers homogeneous culture environment and enhanced mass transfer. The lower oxygen and nutrients gradient in the system provide cell culture results superior to the static culture system. Additionally, the reduced waste concentration prevents cell damage due to waste intoxication. Many cell studies have used a dynamic culture system that includes the rotating wall bioreactor [5,6,7] and more commonly, the spinner flask bioreactor [8,9,10]. Several novel dynamic culture bioreactors have also been developed such as spinning lid [11], spinning base [12] and bi-axial rotating bioreactors [13], to name a few, in an effort to obtain maximum number of cells at the end of the culture period.
The most widely used suspension bioreactor is the magnetic- or motor-driven impeller spinner flask. Microbial and mammalian cells have been extensively grown in stirred culture systems. The agitation or mixing rate can be easily controlled by changing the speed of the driving motor or the magnetic stirrer. The culture medium is partially replenished after a number of days to maintain nutrient supply and keep the waste concentration at an acceptable margin. Furthermore, spinner flasks are available in various sizes and impeller shapes depending on the culture size. Previous studies have demonstrated the efficiency of suspension bioreactors for undifferentiated mammalian stem cell expansion [8,9,14,15].
The use of constructs and microcarriers has been proven to aid cell growth in dynamic culture systems. The construct is typically made of polymers and consists of micropores to support the growth of cells. It has been heavily used to assist osteogenic differentiation from adult and embryonic cells [16,17,18,19]. On the other hand, microcarriers provide higher surface area-to-volume ratio to accommodate higher cell densities. It also provides versatility by allowing various surface coatings and treatments to support a wide range of cell growth. Specially conditioned medium or coating, such as murine embryonic fibroblast (MEF) and Matrigel, were typically used to ensure cell adherence to the microcarriers in previous culturing procedures [20,21]. Microcarriers have been demonstrated to be able to support positive cultivation of retinal pigment epithelial [22], adult progenitor [23,24] and human embryonic [20,21,25] cells when they are used in the spinner flask. By varying the spinning rates in the spinner flask, the use of microcarriers in suspension culture covers a wide-range of cell types in culture protocol, making them the frequently-used method for cell growth [26,27].
However, the homogeneous culture condition in the spinner flask is at the expense of hydrodynamic force introduced in the system caused by the rotating impeller. Mechanical force, such as shear stress, could alter the behavior of cell growth; a high shear environment could be damaging to the cells and the microcarriers [28]. Although spinner flasks are widely used in biological applications, the flow characteristics within the system are not well understood. Studies that analyze the underlying flow mechanics in biological applications are limited, especially in the spinner flask. Additionally, hydrodynamic force is often ignored in cell culture protocol and bioreactor design aspects, thus limiting the understanding of how mechanical force affects the cell culture.
Optimization through continuous cell experiment testing would be inefficient and costly. An optical based and therefore non-intrusive flow measurement technique, known as Particle Image Velocimetry (PIV), has been widely utilized in an effort to quantitatively characterize the mechanics behind cell culture. By capturing sequential images of moving seeded particles in the fluid, the displacement of the particles between images can be computed through the use of cross correlation analysis. Having been developed for more than two decades, the technique provides accurate measurements in a variety of flow applications.
Using this technique, Sucosky et al. [29] previously measured the flow characteristics around arrays of construct for cartilage culture. Furthermore, Dusting et al. [12] presented an extensive flow profile in a disk-driven bioreactor, Meunier and Hourigan [30] investigated the mixing properties, and Mununga et al. [31] studied the control of flow in such bioreactors. The characterization of commercial bioreactors has not been conducted until recent years [32,33,34]; furthermore, only limited mechanical parameters at a few speeds were investigated in these studies. Recently, Gupta et al. [35] showed that the high rotational speeds could damage the microcarriers. The study also highlighted the optimum rotational speed corresponds to the highest mouse induced pluripotent cell yield. Understanding the flow properties associated to the culture condition would enable researchers to gain advantage in optimising the culture process [35].
The knowledge gained through flow profiling, together with numerous published cell experiments results, would help define the design parameters and accelerate the improvement of bioreactor design process. This study provides a detailed quantitative investigation of velocity, shear stress and vorticity in the spinner flask through the use of the PIV measurement technique in meridional and azimuthal planes, to extensively highlight the flow feature that may improve cell growth in culture procedure. Although most spinner flasks have fixed impeller positions, some designs allow the change of impeller height. The present study investigates the effect of impeller position on the flow features within the reactor. Additionally, by varying the impeller position and rotational speed, we are able to cover a wide-range of experiment variables that can be of benefit to many research groups. With this information, the study is aimed at providing a mechanical property datasheet as a reference for previous and future works, to systematically improve the bioreactor design for cell applications.
2. Experimental Section
2.1. Experimental Setup
Figure 1 illustrates the general layout of the experiments. A 100 mL BellCo spinner flask (BellCo Glass Inc., Vineland, NJ, USA), filled with 100 mL of water, was used throughout the experiments. The working water was seeded with 31 μm diameter fluorescent particles, at 1 mg/mL seeding density. The fluid was agitated by a stepper motor (Sanyo Denki America Inc., Torrance, CA, USA), connected through a motion controller (National Instrument North Ryde, New South Wales, Australia) to accurately control the speed of the motor. To ensure a smooth rotation of the impeller, the motor was attached to a worm wheel gear that provides a further reduction factor of 30. The speeds were varied between 10 RPM and 80 RPM, which equates to a Reynolds number (Re) between 668 and 5341. Here, Re is defined as Re = ΩR2/ν, where Ω is the angular velocity in radian per second, R is based on the radius of the flat impeller (R = 25.3 mm), and ν is the kinematic viscosity (dynamic viscosity, μ per unit density, ρ) of the water. The flask was placed inside a square tank filled with water to minimize the lensing effect, due to the curvature of the flask wall during the image acquisition process.
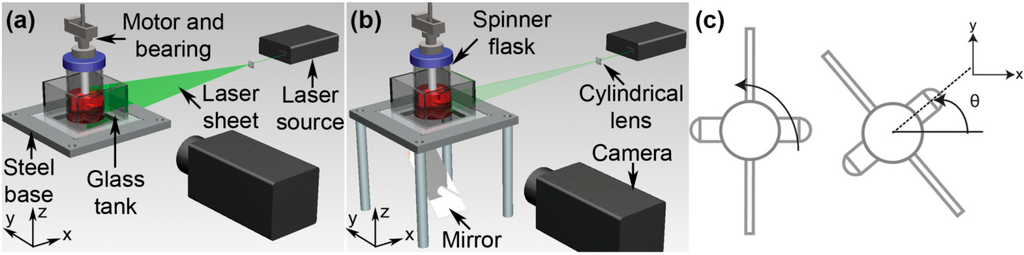
Figure 1.
Apparatus arrangement for flow imaging in spinner flask. Throughout the experiment, the spinner flask was placed in a glass tank, filled with water to reduce the optical distortion caused by the curvature of the flask. (a) To image the flow in the meridional plane, the laser sheet was aligned vertically and positioned at the middle of the flask. (b) For azimuthal plane measurement, the laser sheet was aligned horizontally and the position was adjusted at several measurement heights. To allow a better view for the azimuthal measurement, a mirror was placed underneath the flask and the camera captured the images reflected by the mirror. (c) The impeller is constructed from a rectangular shape Teflon sheet and a magnetic stirring bar. The angular position is defined as the angular distance from the horizontal datum point to the center of the bar throughout the manuscript.
An Nd:YAG laser source and a cylindrical lens were used to create a thin laser sheet that illuminated the imaging plane. For meridional plane analysis, the laser sheet was aligned vertically (Figure 1a), whereas for azimuthal image acquisition procedure, the laser sheet was in a horizontal plane and a mirror was placed underneath the flask to reflect the scattered light in the fluid flow onto the camera sensor as shown in Figure 1b.
A high-speed CMOS camera (Y4, IDT Inc., Tallahassee, FL, USA) fitted with a Nikkor 105 mm f/2.8 G lens (Nikon, Tokyo, Japan) was used throughout the experiment to sequentially capture the scattered light reflected by the seeding particles at 300 μs exposure time. The acquisition rate of the camera was set so that the images were captured at one-degree spatial increments of the impeller. One complete rotation consisted of 360 images and at each speed, 12 sets of data were gathered for averaging purposes. The required acquisition rate can be calculated by multiplying the rotational speed (in RPM) by 6. This means the images were captured between 60 Hz and 480 Hz for 10 RPM and 80 RPM, respectively.
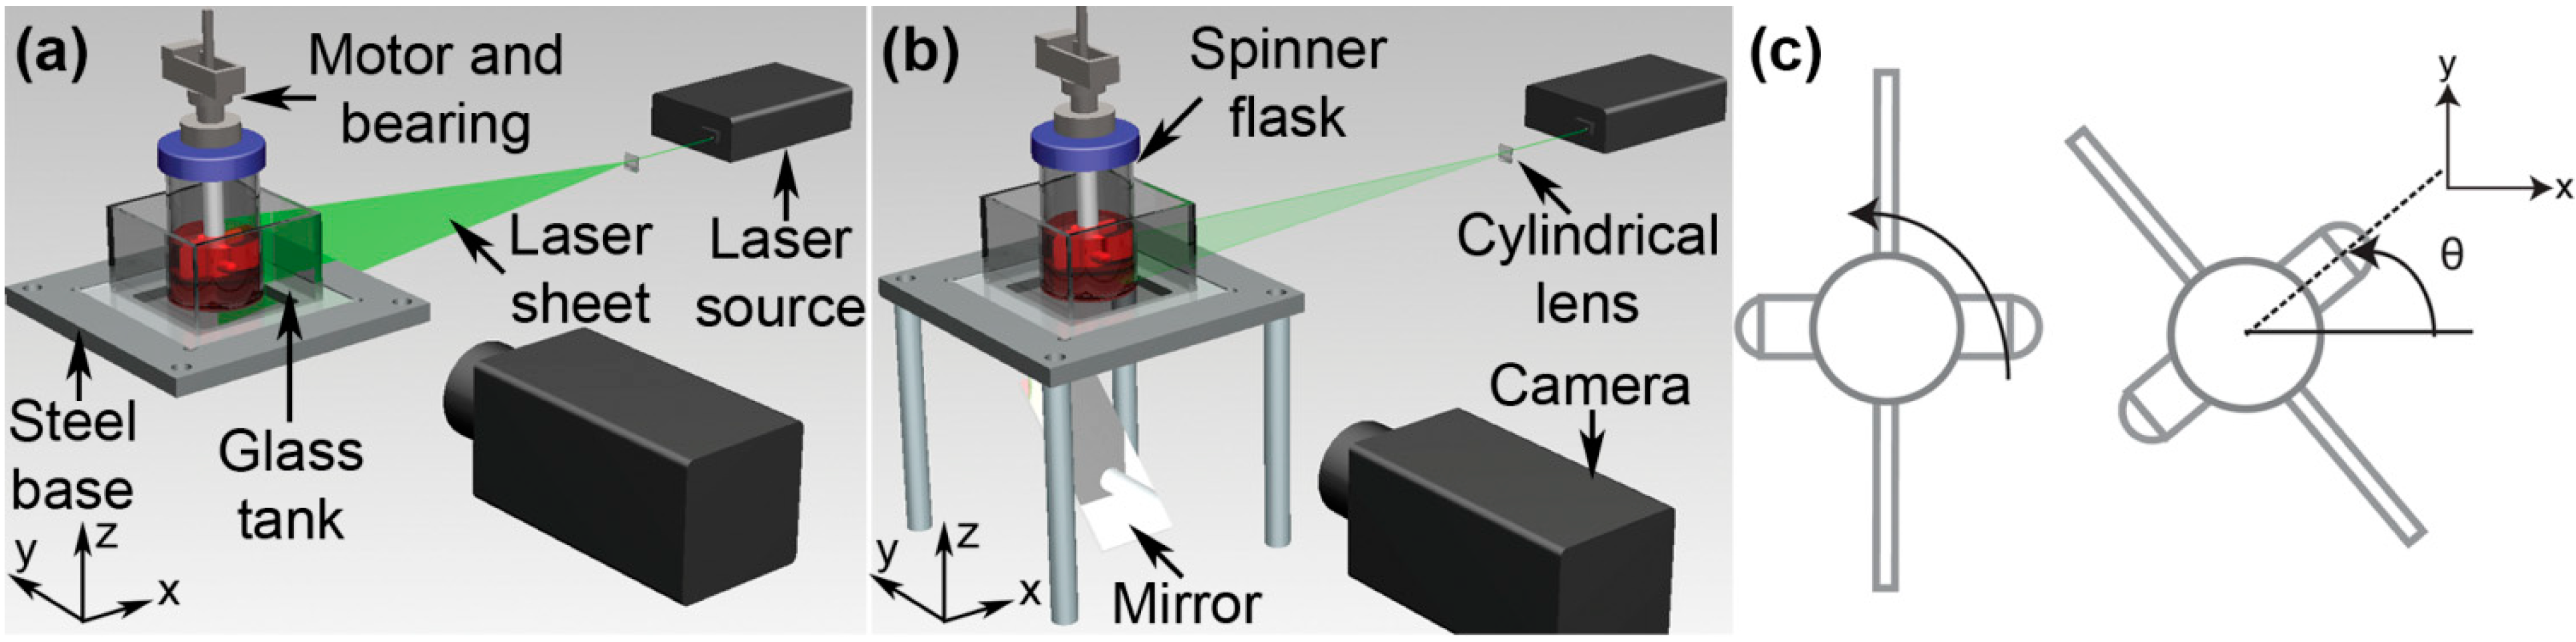
The stepper motor was set to turn in a counter-clockwise direction, viewed from the top. In order to keep track of the impeller position, the angular coordinate system was introduced and is illustrated in Figure 1c. Figure 2 depicts the dimensions of the flask and impeller used throughout the experiments.

Figure 2.
Dimensions of the impeller blade and inner wall of the spinner flask bioreactor.
Figure 2.
Dimensions of the impeller blade and inner wall of the spinner flask bioreactor.
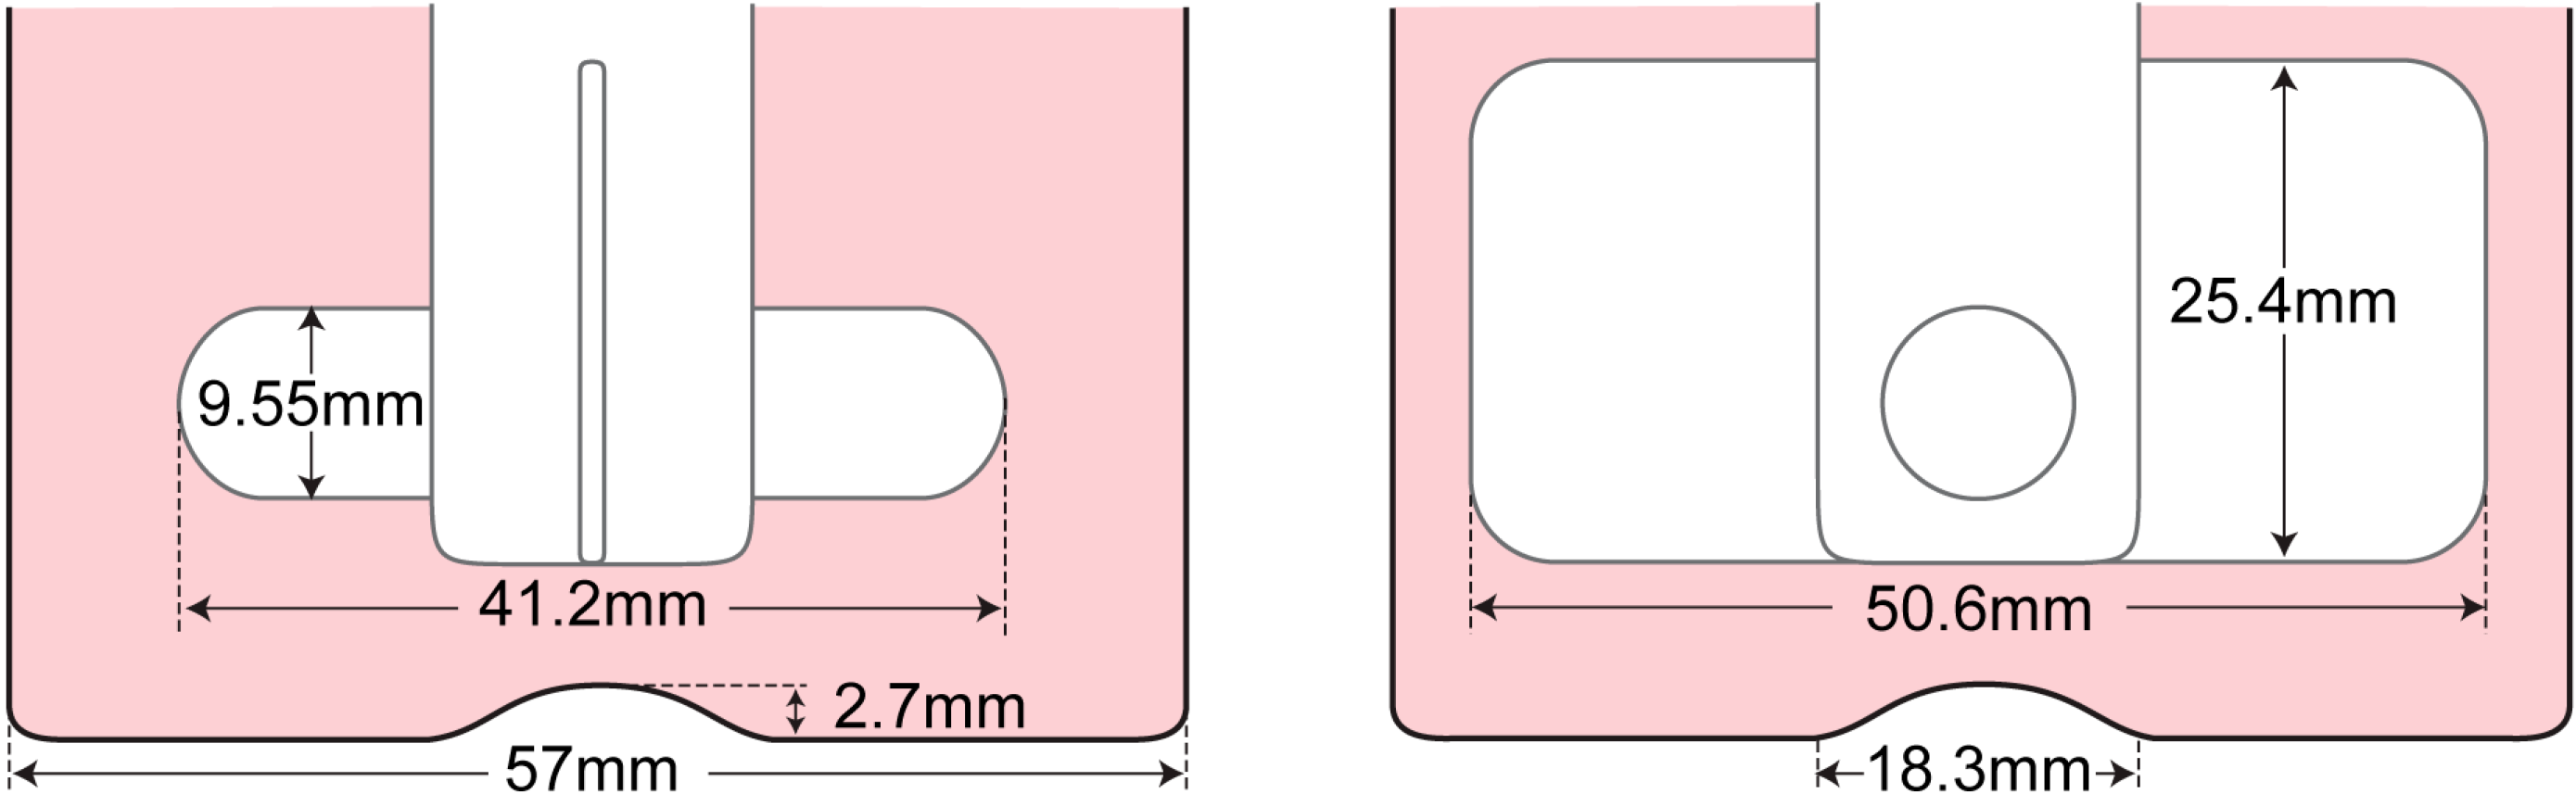
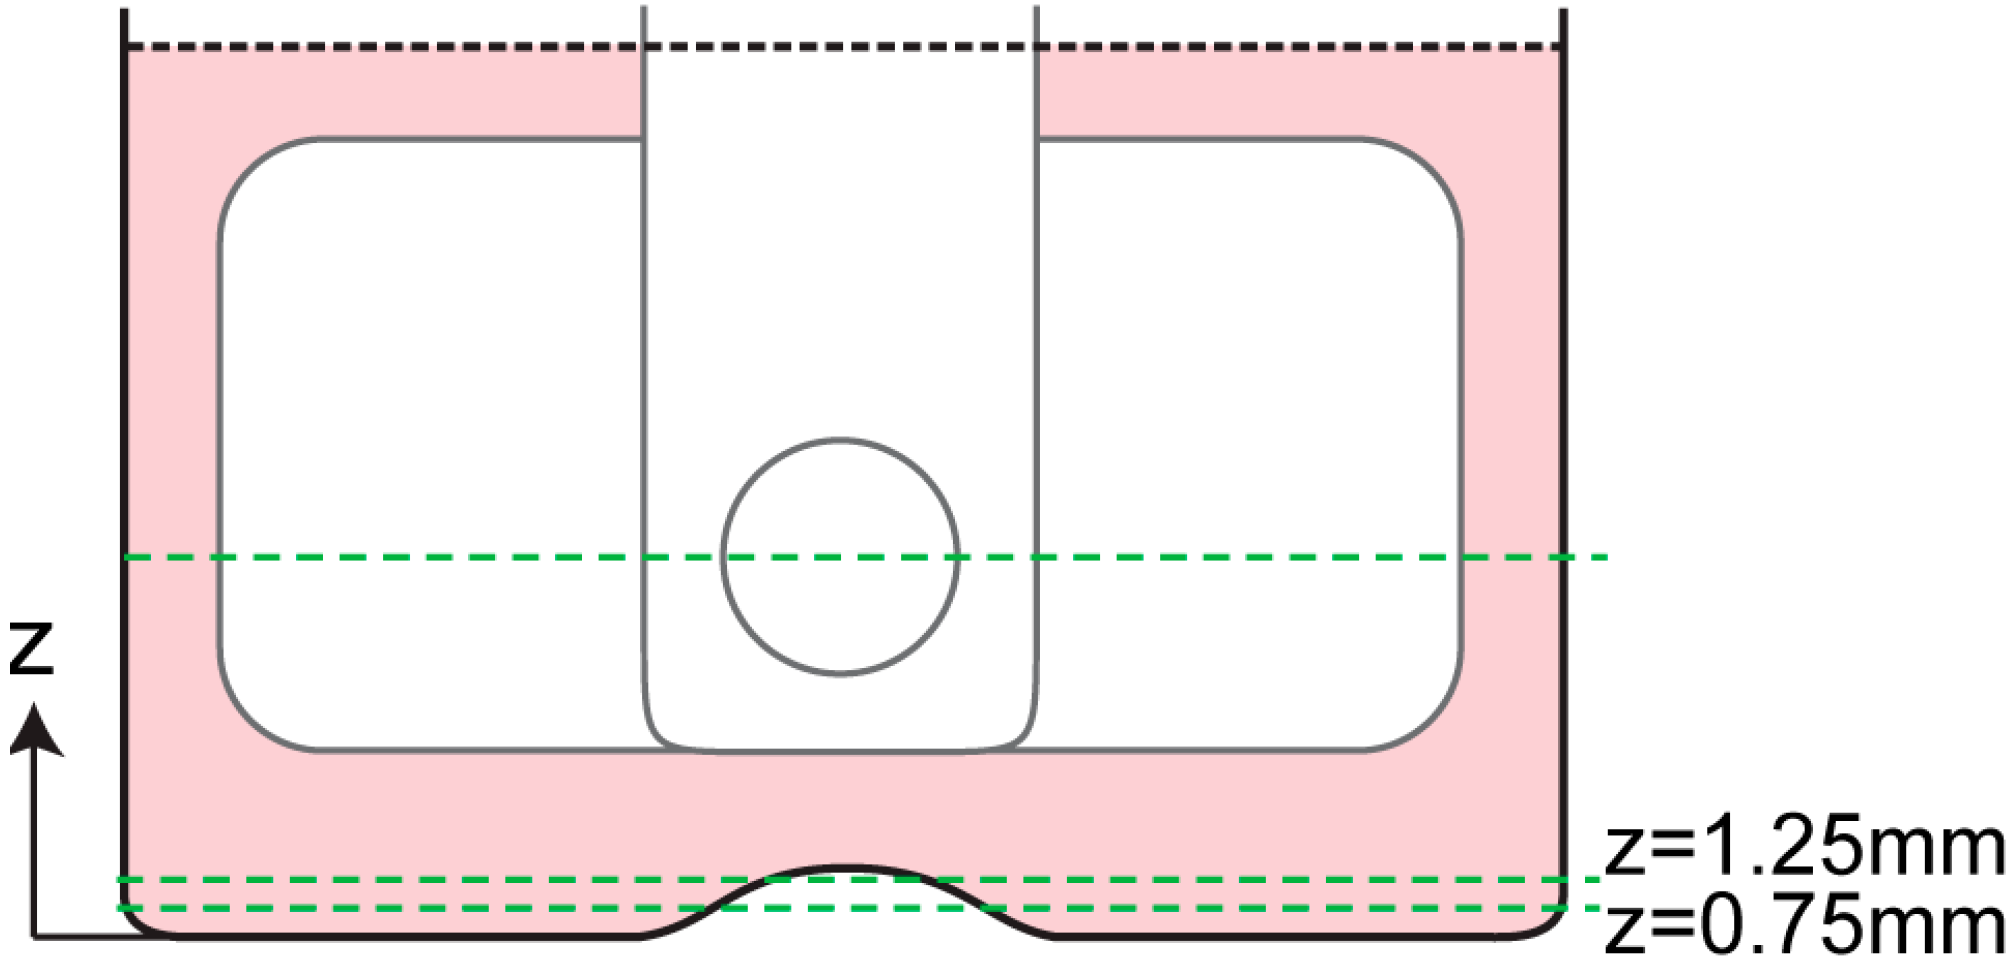
In this study, apart from varying the speed, the impeller height was varied at three positions, defined as low, middle and high as presented in Figure 3. We conducted measurements in the meridional and azimuthal planes. In the azimuthal plane, two main analyses were conducted—the flow profile at the middle height of the stirrer bar, and the fluid- wall interaction at the bottom surface of the flask (Figure 4). To analyze the shear profile at the bottom surface, two measurements at different heights were conducted near the bottom surface. An accurate approximation of shear rate at the bottom surface could be calculated by fitting a parabolic function to the three data points—two experimental measurements plus the no-slip condition at the wall.
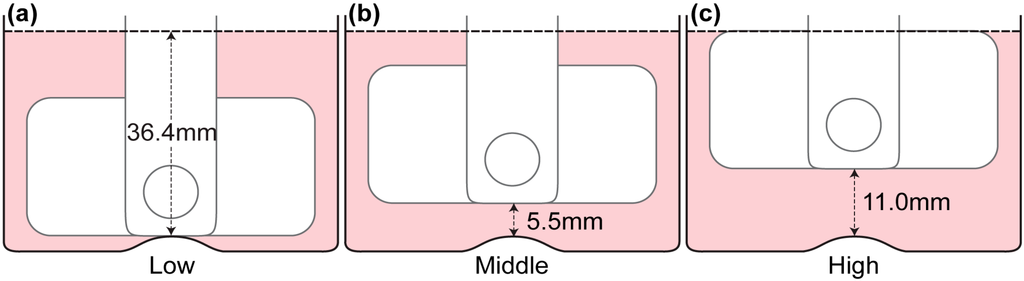
Figure 3.
Impeller positions in the spinner flask. Throughout the experiment, the impeller height was varied at low, middle and high positions. (a) The impeller was positioned at its lowest possible location where the bottom of the impeller touches the bump at the bottom of the flask. (b) The impeller was placed at middle height where the distance of the bump to the impeller’s bottom edge is similar to the distance of the impeller’s top edge to the free surface at 5.5 mm. (c) The impeller is in “high” position when the top edge of the impeller is at the free surface and the bottom edge is 11 mm from the bump.


Figure 4.
Locations of azimuthal measurements. A measurement was conducted at mid-height of the stirrer bar and two measurements were conducted near the bottom wall of the bioreactor, as represented by the dashed lines. Using the two velocity profiles at z = 0.75 mm and z = 1.25 mm, a parabolic profile was fitted and the velocity gradient near the bottom wall was estimated.
2.2. Data Analysis
In-house PIV software was used to analyze the datasets. The software has been rigorously tested and improved over a number of years [36,37]. To improve the computing efficiency, a mask file was generated to define the area outside of the flask, where no flow existed. This area was excluded from the calculation. The images were divided into 128 by 128 pixel sub-windows and the computation was performed at 8 by 8 pixel spacing, in x and y directions, correspondingly. A full rotation comprised 360 phases (one phase per one degree spacing). To enhance the signal-to-noise ratio of the analysis, the results were phase-averaged over 12 rotations. Based on the displacement obtained from PIV analysis, gradients were computed, then the shear stress (τ), and vorticity (ω), were calculated using the following equations:
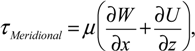
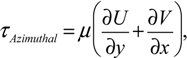
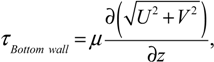
 where U, V and W are the velocity components in x, y and z directions, respectively. To avoid skewing of the data by outliers, the maximum shear stress was defined as the 99th percentile of the distribution in any given imaged plane.
3. Results and Discussion
The results are split into 3 s—meridional plane, azimuthal plane analysis and flow profile near the bottom surface of the flask. As there are minimal changes to flow structure at different rotational speeds, only one speed of the results is presented for visualization purposes in each section to highlight the main flow feature within the flask, due to the significant number of variables in the study. The analyses mainly focus on velocity profile, shear stress distribution and vorticity. In imaging planes where the impeller was present, the impeller was masked out and excluded in the PIV calculation.
3.1. Fluid Flow in Meridional Plane
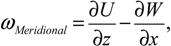
Measurements were conducted for three impeller heights and eight rotational speeds at each impeller location in meridional plane. For the purpose of visualization, Figure 5, Figure 6 and Figure 7 show the velocity, shear and vorticity profiles at 60 RPM rotational speed. The rows and columns present the different angular positions and impeller locations, correspondingly. The impeller rotated into the page in all of results for the meridional plane.
As shown in Figure 5, the rotation of the impeller created significant recirculation behind the flat impeller due to the adverse pressure region behind the impeller paddle. The acceleration of fluid from the top and bottom part of the impeller towards the centre region gives rise to two counter rotating vortices in all impeller arrangements. However, when the impeller is placed at a higher position, the bottom vortex, which rotates in a clockwise direction, becomes more dominant than the top counter clockwise vortex. At 99 degrees, the case of a high position of the impeller records the highest velocity magnitude compared to other arrangements. As the impeller rotates, the velocity magnitude reduces while the vortices travel to the sidewall and away from the impeller towards the top or bottom corner of the imaged window. Although the fluid velocity decreases further downstream of the flat impeller, there is a slight increase in velocity of the top vortex at the high impeller position from 99 degrees to 135 degrees. Additionally, notable flow can be seen at the bottom surface of the bioreactor. In this region, the fluid moves radially inwards towards the centre of the flask before moving upwards. The upward velocity provides lift, ensuring the microcarriers are in suspension in the flask. Unlike the flow in the low and middle impeller positions, the velocity near the bottom surface does not drop significantly throughout the rotation period shown. These results are comparable to the characterisation study in single-use spinner flask, conducted by Kaiser et al. [32]. Maximum velocity was obtained at the tip of the flat impeller. Furthermore, the flow moved radially inwards at the bottom of the flask. However, without any additional view in meridional plane at different rotation angles in the study, we are unable to compare the flow features behind the flat impeller. On the other hand, the use of multiple axial impellers in a large scale flask in a study undertaken by Schirmaier et al. [38] creates high-velocity flow at the center of the flask. However, without any vector field presented in the study, it is not possible to determine whether the flow is primarily in the vertical or the radial direction.

Figure 5.
Evolution of velocity magnitude contour overlaid on the velocity vectors for three impeller positions at 60 RPM. Highest velocity magnitude was achieved at the region downstream of the flat impeller at 99 degrees for all impeller arrangements.
Figure 5.
Evolution of velocity magnitude contour overlaid on the velocity vectors for three impeller positions at 60 RPM. Highest velocity magnitude was achieved at the region downstream of the flat impeller at 99 degrees for all impeller arrangements.
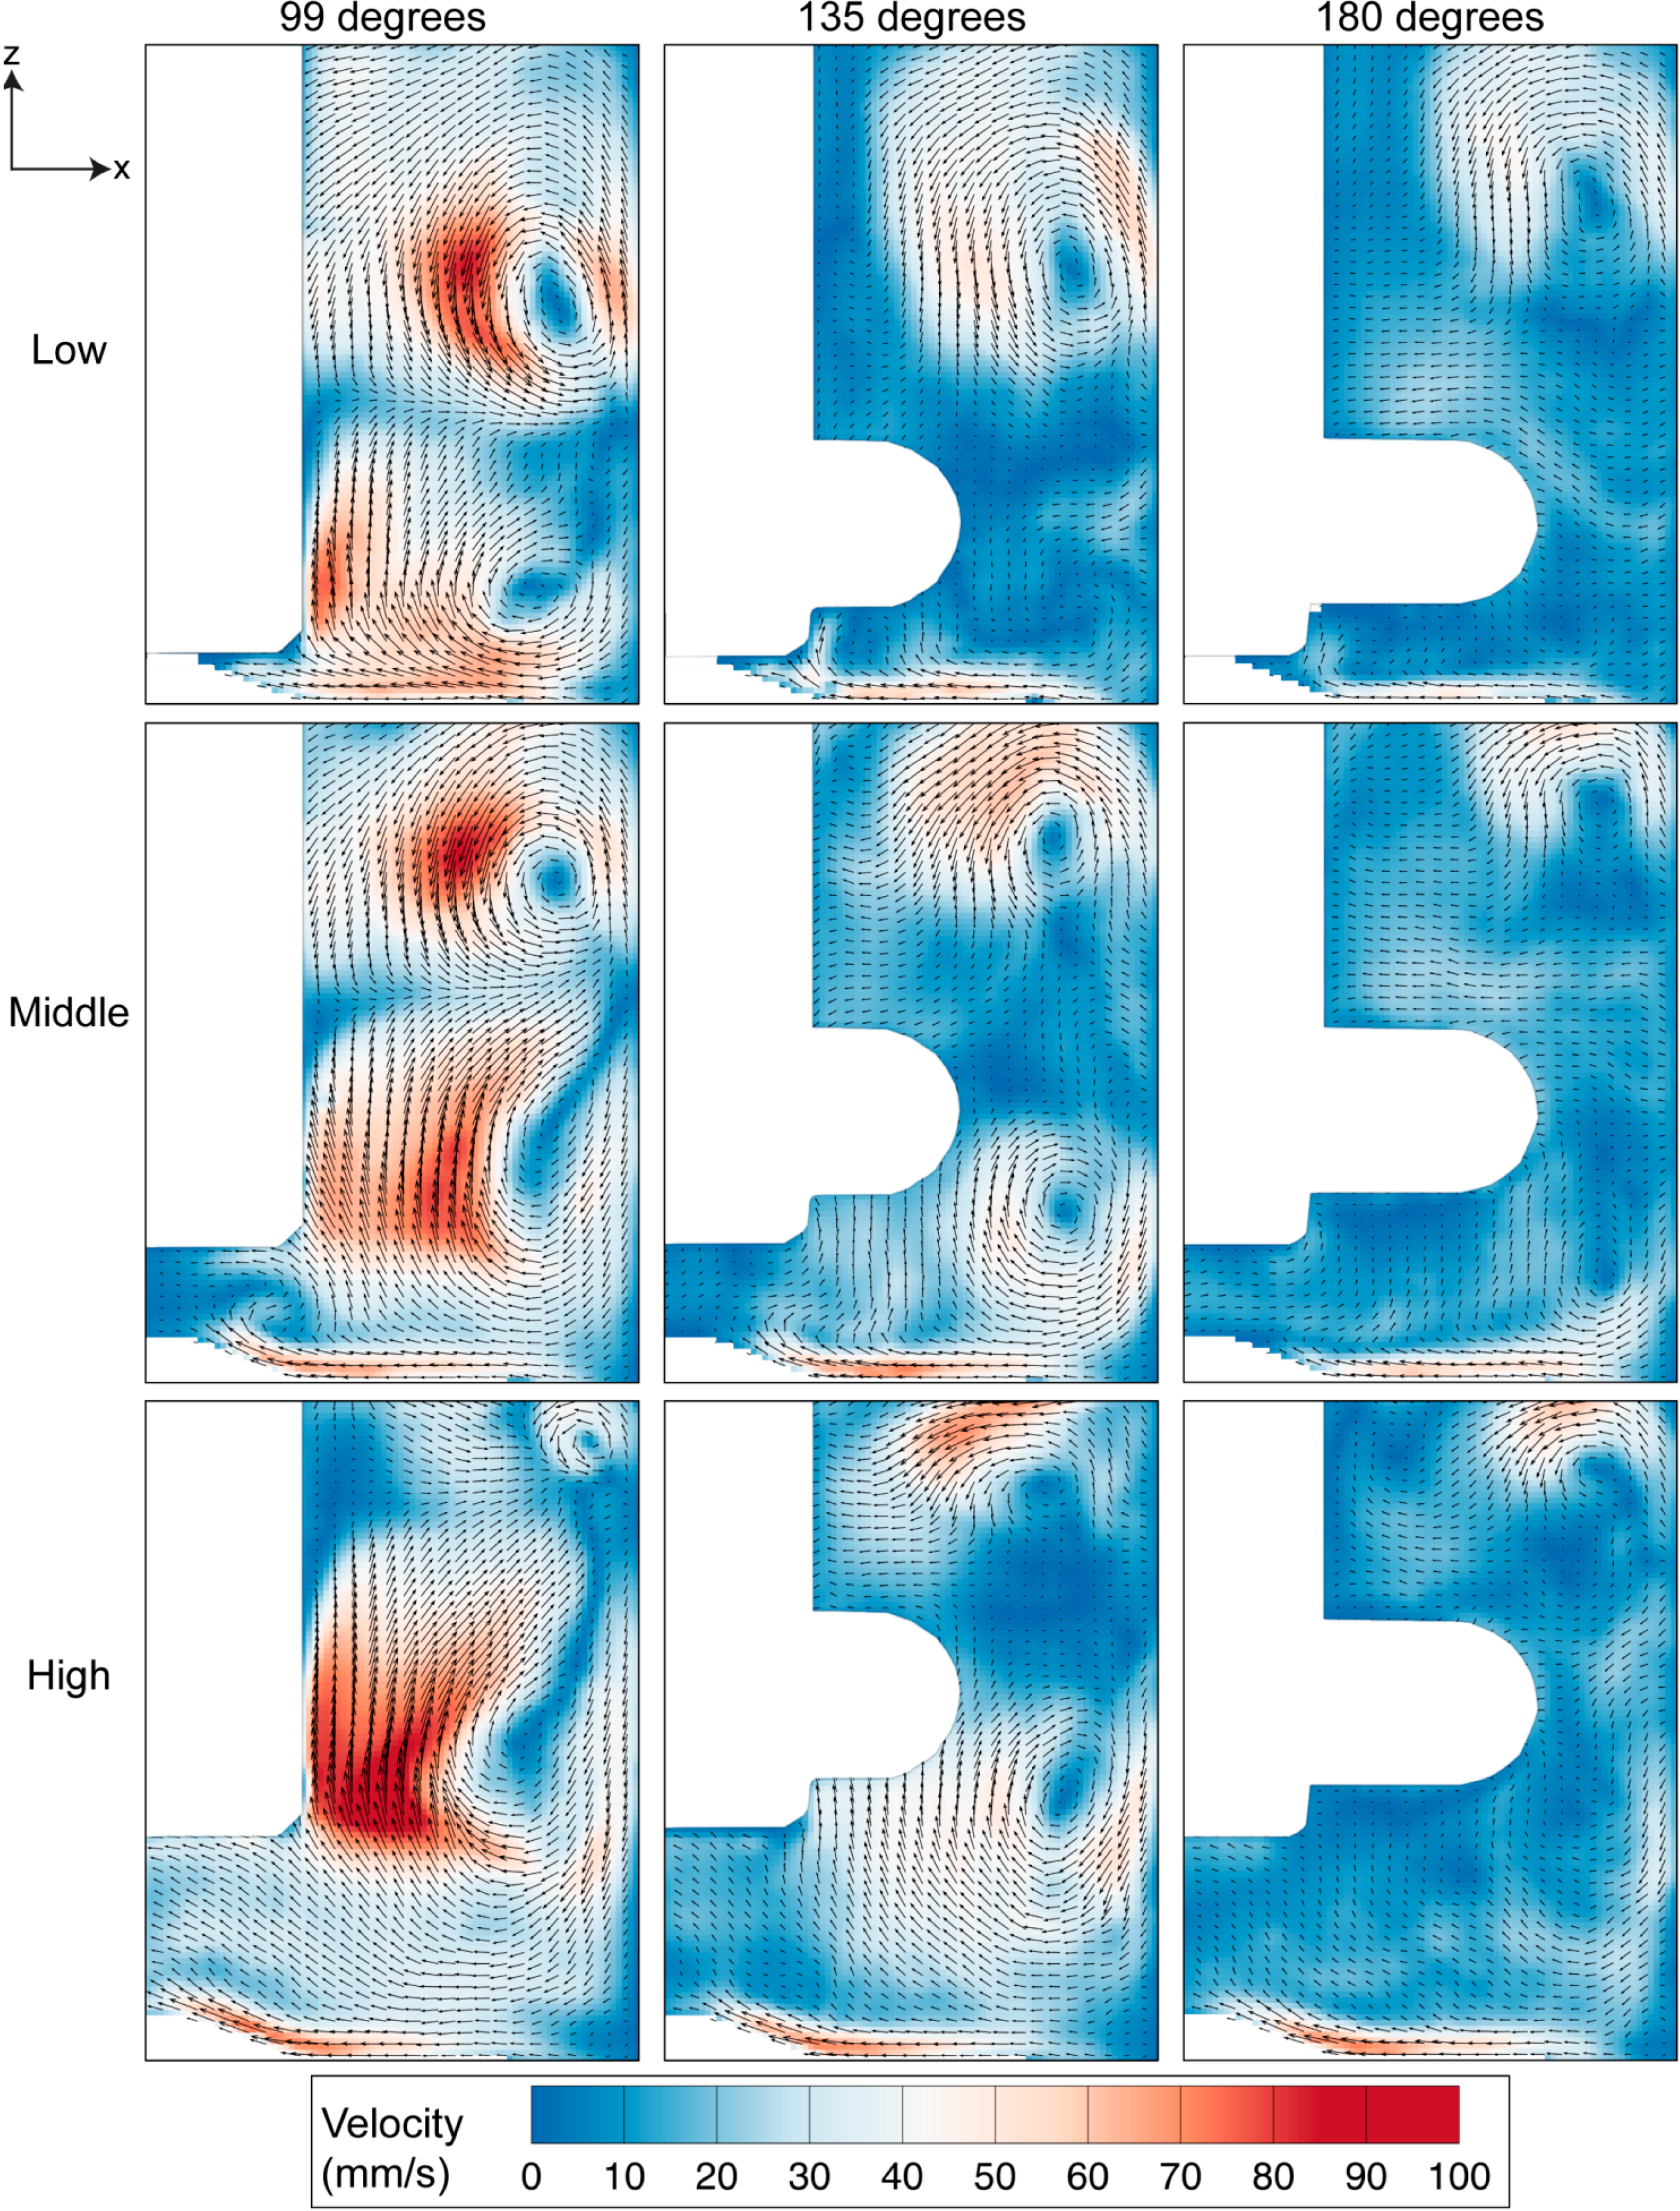
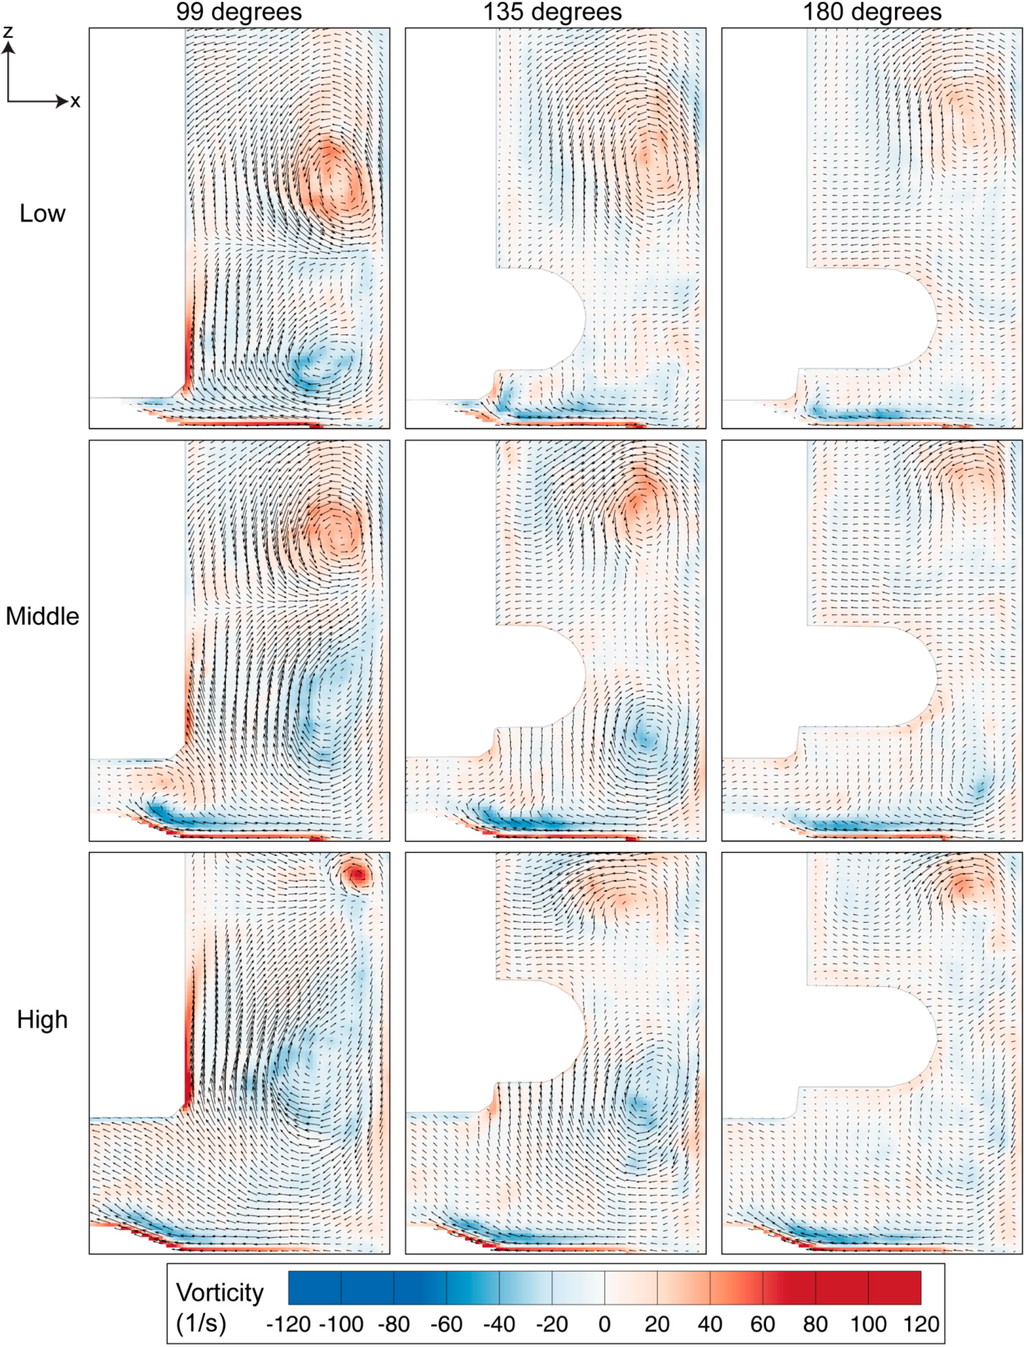
Figure 6.
Vorticity evolution for three heights of the impeller, spun at 60 RPM. The magnitude of the vorticity reduces as the impeller rotates from 99 degrees to 180 degrees, with the highest vorticity strength occurring for the high impeller location.
Figure 6.
Vorticity evolution for three heights of the impeller, spun at 60 RPM. The magnitude of the vorticity reduces as the impeller rotates from 99 degrees to 180 degrees, with the highest vorticity strength occurring for the high impeller location.
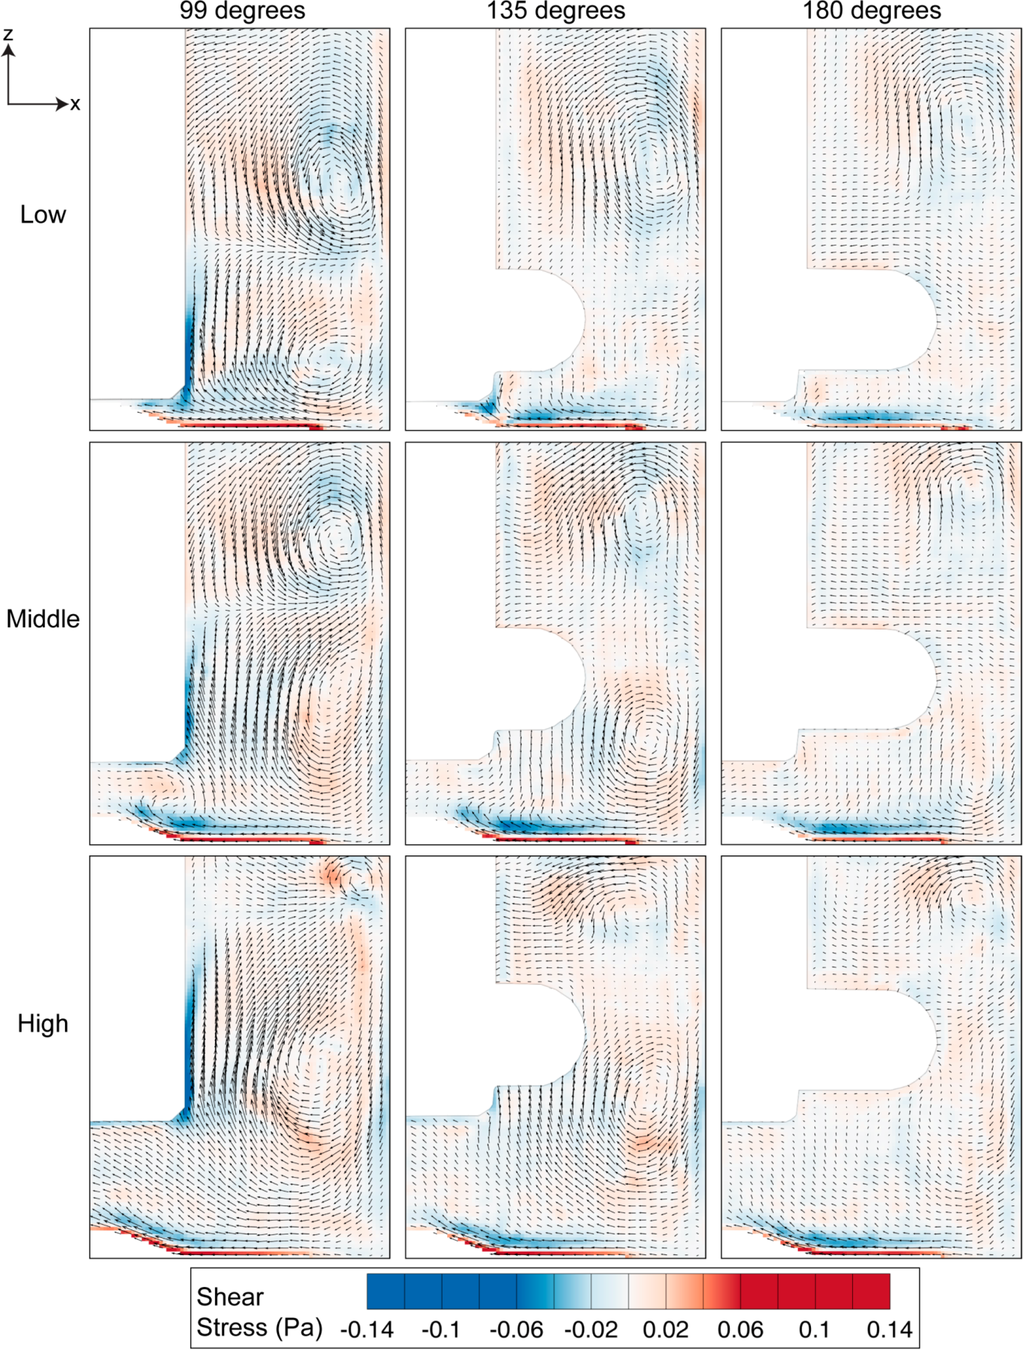
Figure 7.
Shear stress distribution at three angular positions for 60 RPM. High stress region can be observed at the bottom wall and near the impeller, caused by the fluid-wall interaction.
Figure 7.
Shear stress distribution at three angular positions for 60 RPM. High stress region can be observed at the bottom wall and near the impeller, caused by the fluid-wall interaction.

Vortices provide a mixing mechanism that creates homogeneous environment in the spinner flask bioreactor. Throughout our analysis, as per convention, counter-clockwise vorticity is defined as positive. The two counter rotating vortices that exist in the flask therefore represent positive and negative vorticity values. The maximum vorticity magnitude occurs at 99 degrees and the magnitude decays as the impeller rotates to 180 degrees. At each impeller arrangement, the positive vorticity above the top half of the impeller is more dominant and clearly visible at 180 degrees compared to the clockwise rotating vortex near the bottom part of the impeller, which was not visible at a similar angular position. Although the size of the top vortex at the high impeller position is small, it has the highest vorticity magnitude that arose, due to the high velocity gradient in that region.
In the meridional plane, the shear stress is significant at the bottom surface of the flask and around the impeller shaft, as illustrated in Figure 7. With the highest fluid velocity occurring at 99 degrees, it is also clear that the magnitude of shear stress at this angular position is the most prominent relative to other angles. Additionally, the figure shows that the shear readings are strongly influenced by the fluid rotation in the lower part of the vessel. However, as the impeller is positioned at higher levels, the vortex is also located farther from the wall. With the vortex developed at a higher location, the fluid near the end wall is not severely affected by the recirculation phenomenon, thus producing lower shear margin at the base. The distribution of stress has not been presented in previous characterization studies [32,38]. The shear stress distribution within the spinner flask presented here would enable researchers to determine the critical location at which the shear stress is significant and its variation at different impeller angular positions.
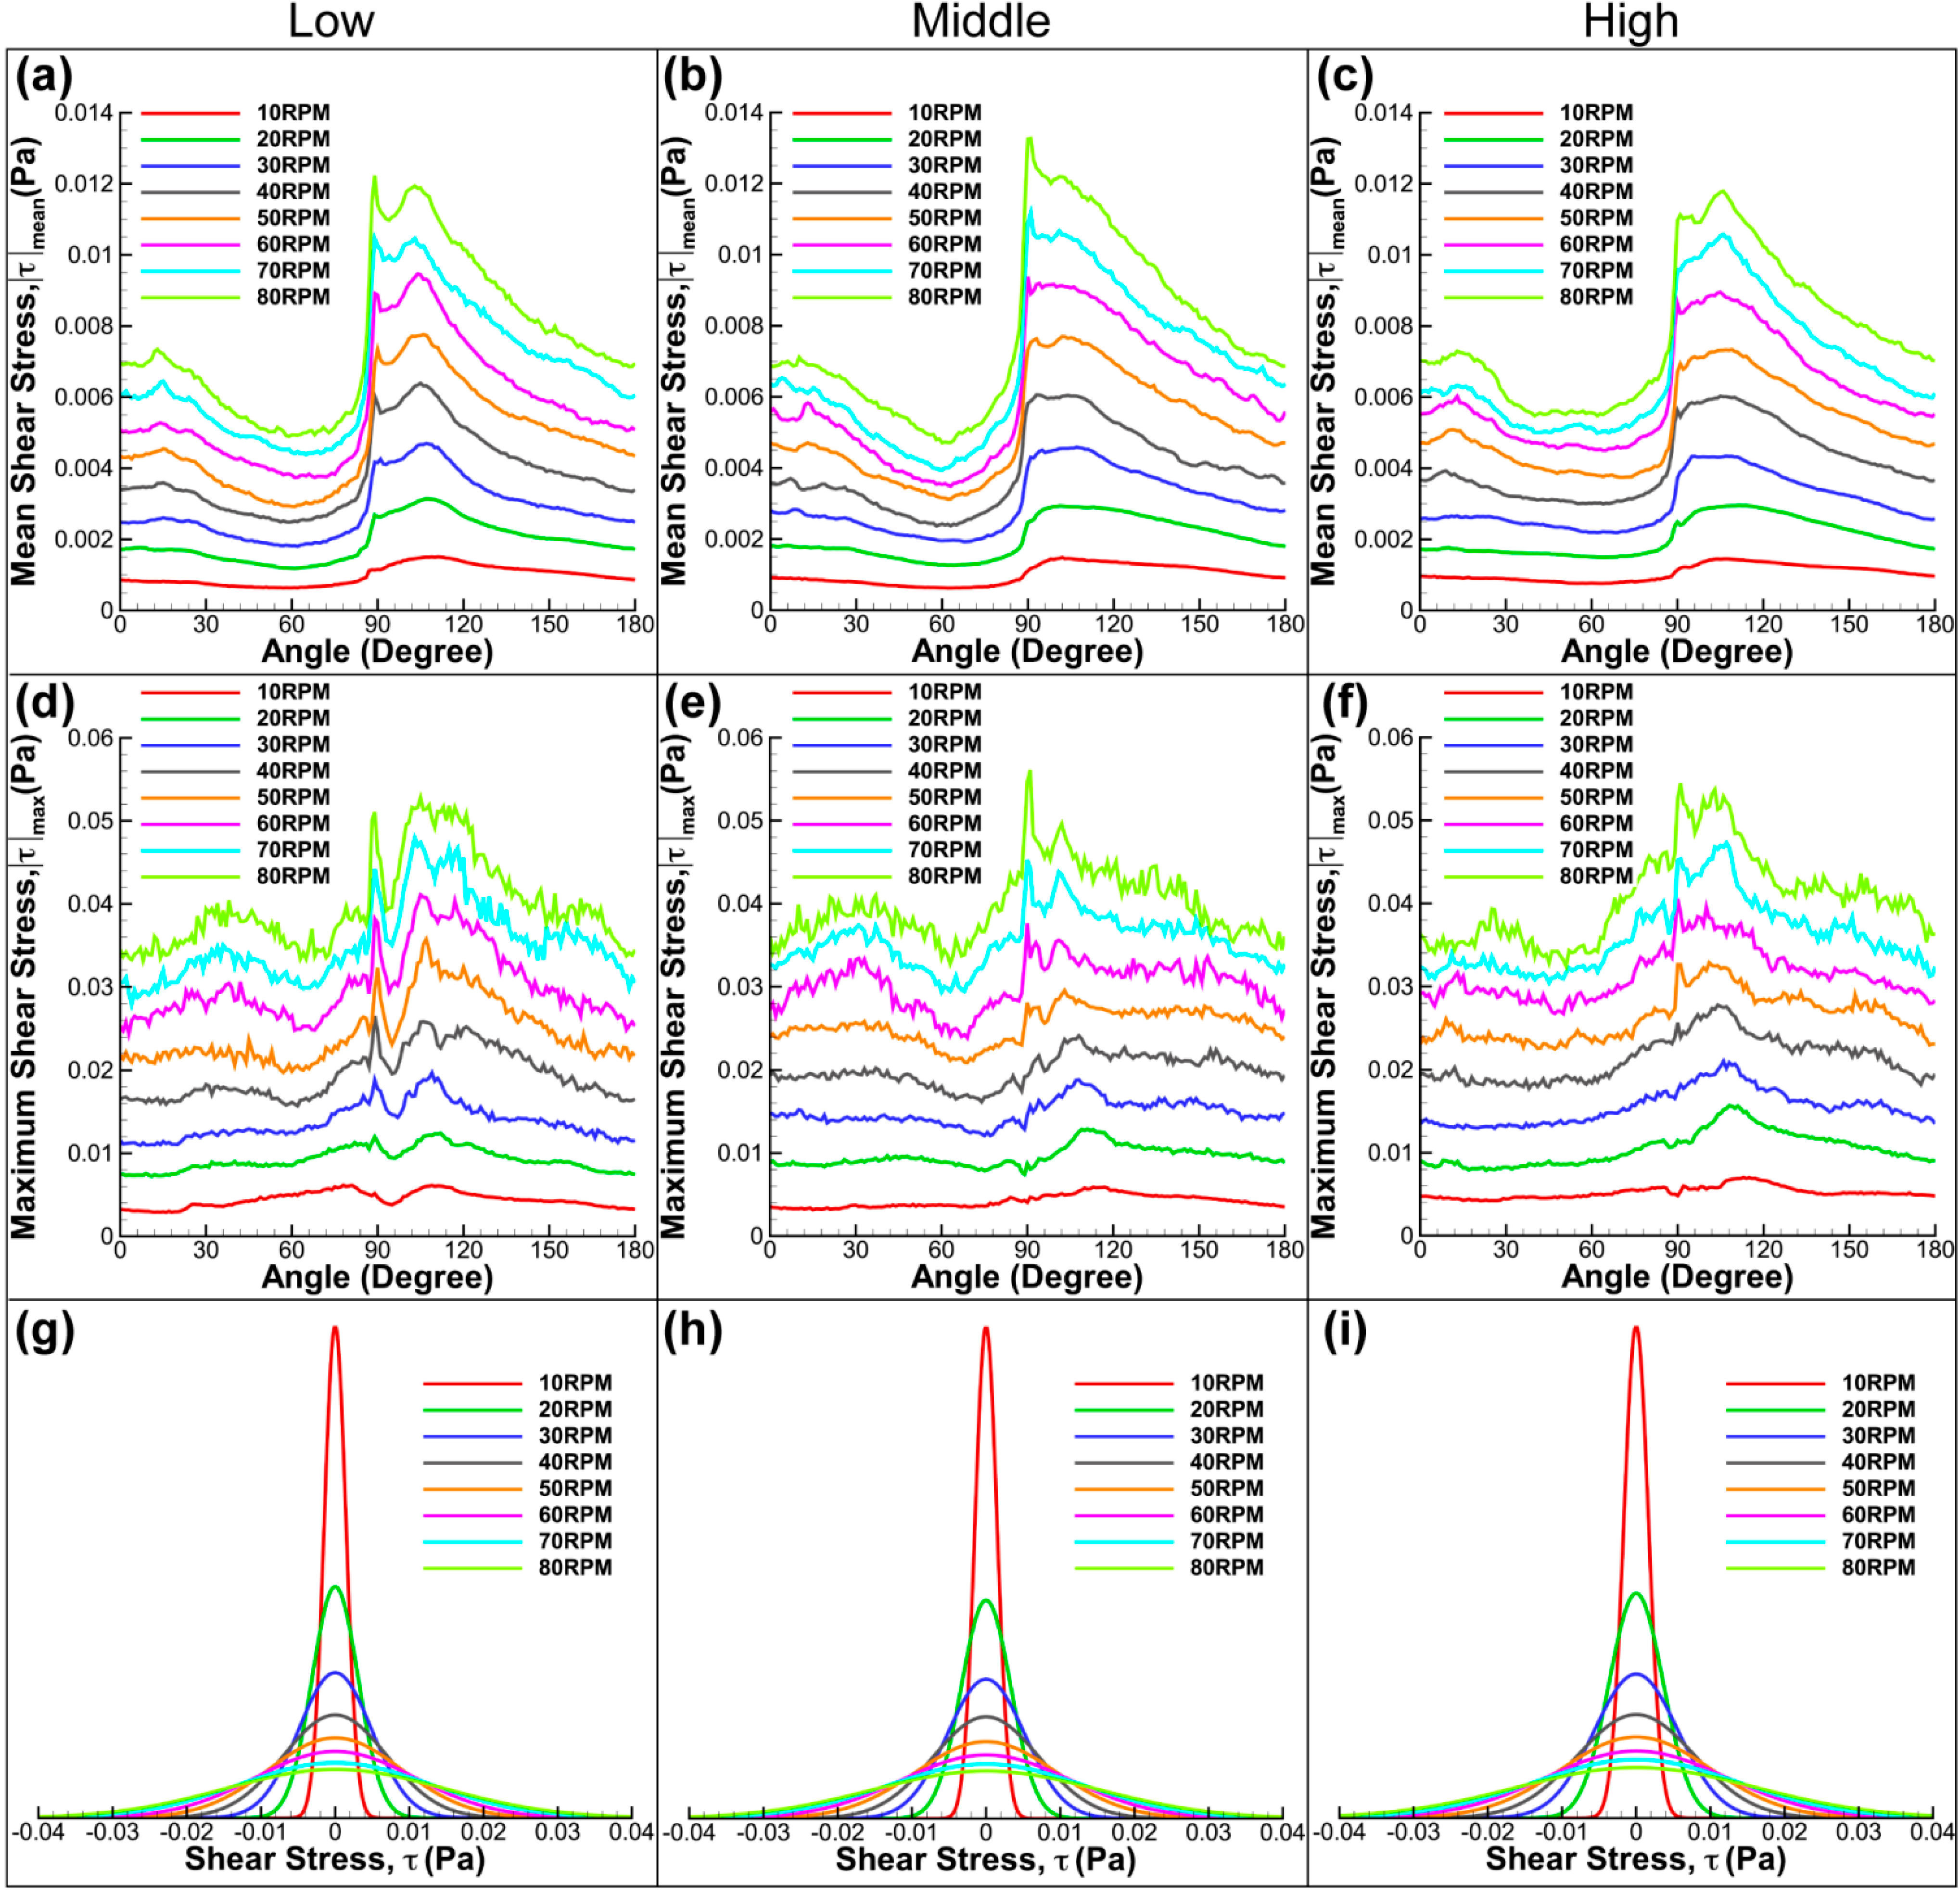
Figure 8 shows the summary of the shear stress determined in the meridional plane for diverse impeller arrangements and speeds. Overall, it can be seen that the average and maximum shear stresses increase with rotational speed. Although the graphs are slightly different to each other at varying impeller positions, the main feature of the graph is maintained at increasing stirring speed, which confirms the consistency of the measurement. All graphs show similarity by having a sudden increase in shear stress at 90 degrees. At this angular position, the fluid achieves its highest velocity when the flat paddle passes the imaging plane. The rapid increase in velocity generates a high shear stress environment in the flask. Our results show that the middle impeller height has marginally higher mean and maximum stress magnitude. Furthermore, there is a significant drop in shear stress for low impeller alignment after the spike at 90 degrees. The observed behaviour results from the different position of vortices generated at varying impeller height that alters the velocity magnitude at the bottom wall. Although the graphs have some minor feature difference, there was not any prominent dissimilarity in terms of the stress distribution in the meridional flow profile for the given impeller locations.
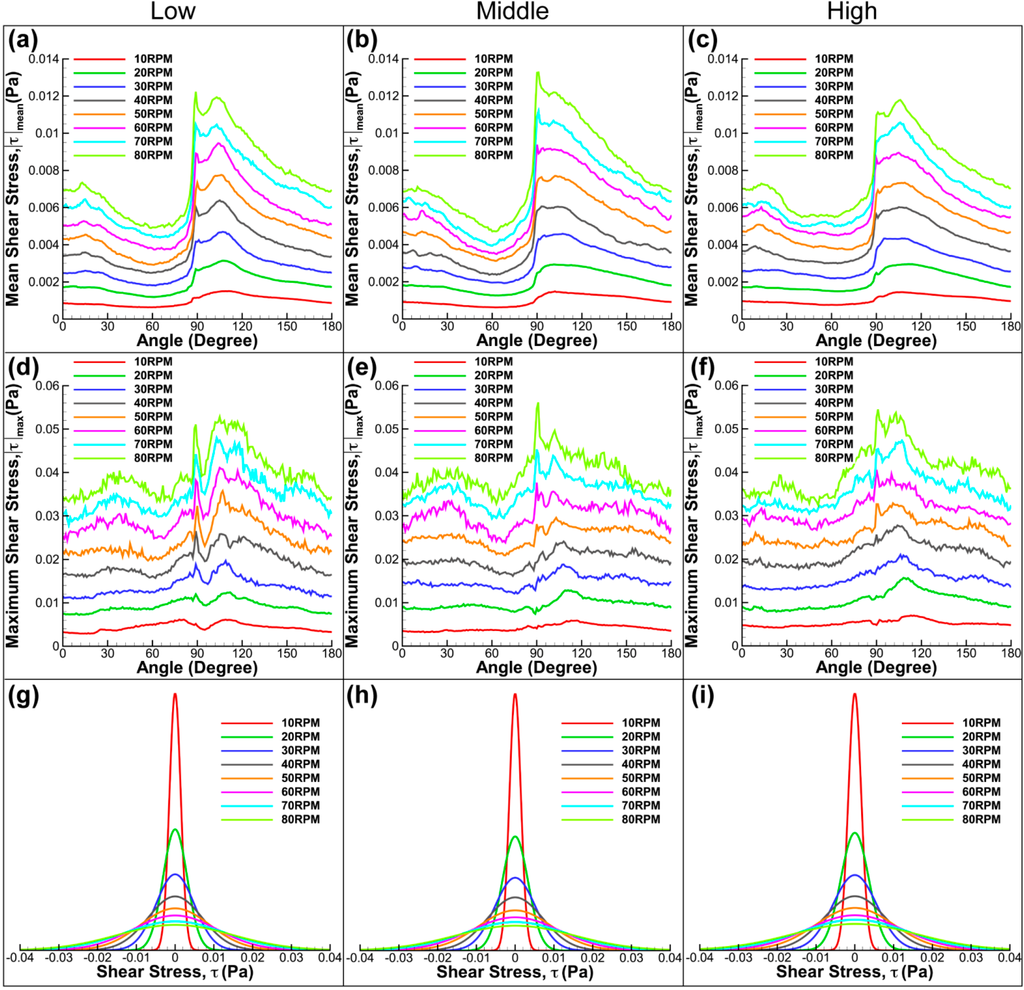
Figure 8.
Shear stress plots for three impeller arrangements and spun at speeds varying from 10 RPM to 80 RPM. Evolution of mean (a–c) and maximum shear stress (d–f) for various speeds and rotation angles. In all plots, significant increase in shear stress magnitude was obtained at 90 degrees, an angle at which the flat impeller is in the imaging plane. (g–i) Distribution functions of shear stress at speeds between 10 RPM and 80 RPM for different impeller heights.
3.2. Fluid Behaviour at Middle Height of the Impeller in Azimuthal Plane
Velocity and shear stress profiles at middle height of the stir bar impeller are presented in Figure 9 and Figure 10, respectively. As the impeller was present in the imaging plane during the image acquisition process, the impeller was masked and removed from the PIV calculation. Figure 9 shows that the fluid flow increases with increasing stirring speed. Due to the fact that the azimuthal velocity is a function of radius and angular speed, it is not surprising to see that the maximum velocity is located at the tip of the flat paddle, similar to the findings in the literature [32,33]. As the main velocity component in the system, the velocity magnitude in the azimuthal plane is generally far greater than that in the meridional velocity. Minor radial motion can also be seen behind the impeller, which corresponds to the location of recirculation.
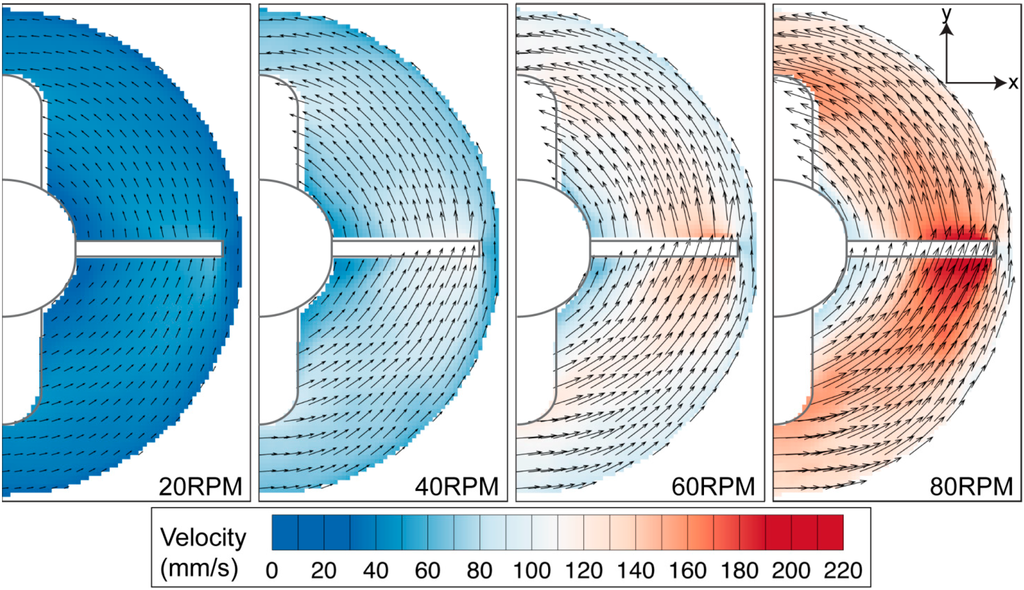
Figure 9.
Velocity profile in azimuthal plane at middle height of the stirrer bar. The velocity magnitude increases with increasing impeller speed. Highest velocity is observed at the tip of the flat impeller for all rotational speeds.
Figure 9.
Velocity profile in azimuthal plane at middle height of the stirrer bar. The velocity magnitude increases with increasing impeller speed. Highest velocity is observed at the tip of the flat impeller for all rotational speeds.

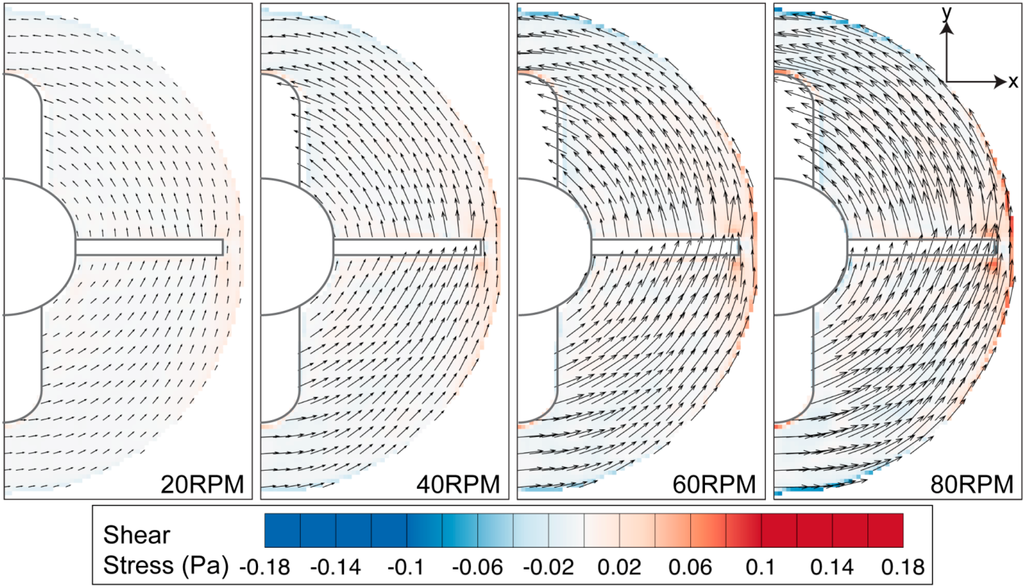
Figure 10.
Azimuthal shear stress contour overlaid on velocity vectors. High stress region can be seen near the flask sidewall and around the impeller tip.
Figure 10.
Azimuthal shear stress contour overlaid on velocity vectors. High stress region can be seen near the flask sidewall and around the impeller tip.

The high tangential velocity creates a high velocity gradient at the sidewall, as illustrated in Figure 10. Furthermore, noticeable shear can also be observed at the edge of the stirring bar. Overall, the shear magnitude is greatly dependent on the rotational speed. Figure 11 shows that the maximum shear stress of each speed varies linearly to the stirring rate of the impeller.
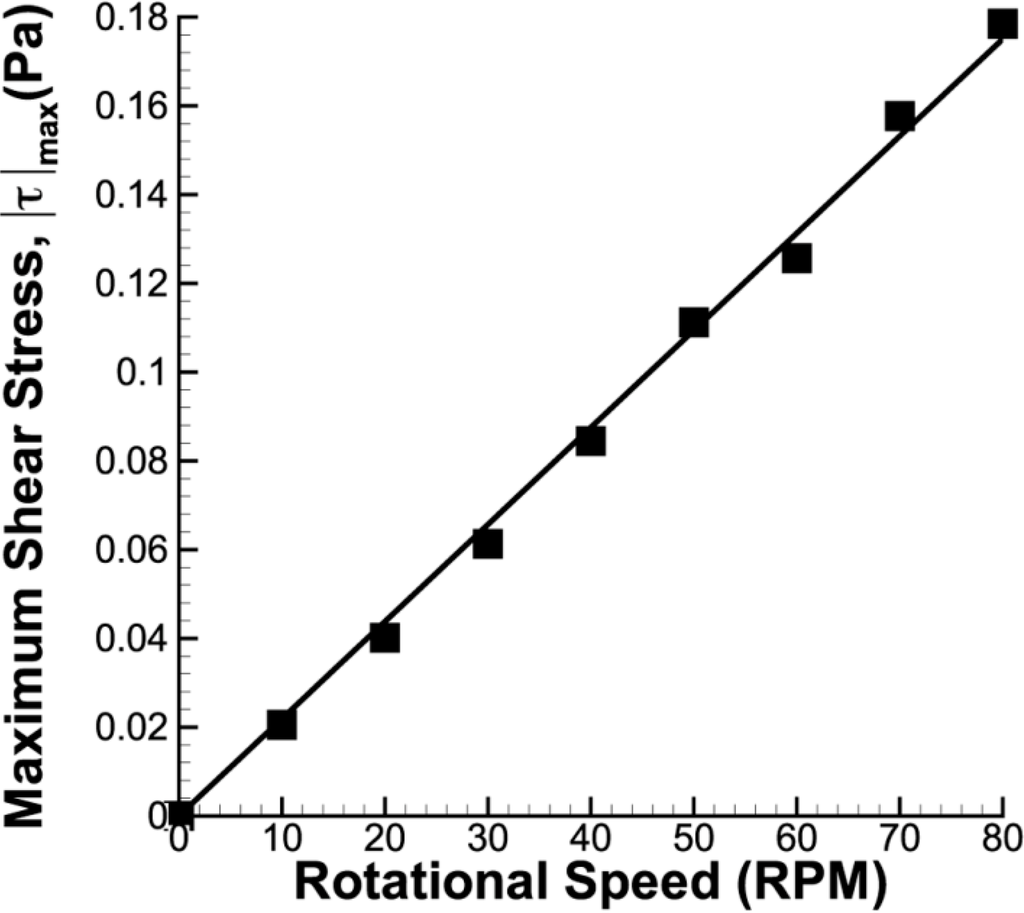
Figure 11.
Maximum shear stress plot for azimuthal imaging plane at half of the stirrer bar height. The maximum shear stress varies linearly to the rotational speed.
Figure 11.
Maximum shear stress plot for azimuthal imaging plane at half of the stirrer bar height. The maximum shear stress varies linearly to the rotational speed.

3.3. Fluid–Wall Interaction at the Bottom Surface of the Flask
To estimate the shear stress at the bottom wall, two measurements were conducted at z = 0.75 mm and 1.25 mm. The velocity close to the bottom surface was calculated by fitting a parabolic curve to the two velocity profiles, measured at two heights, and the no slip boundary condition at z = 0 mm. Using the estimated velocity, the velocity gradient and shear stress between the fluid in azimuthal plane and end wall was calculated. For the purpose of visualization, only the velocity and shear characteristic for 40 RPM is presented. Because the impeller does not present in the imaging plane for this analysis, the impeller is represented as dashed lines to show the rotation phase in each figure.
Figure 12 shows the velocity contour map of the fluid near the bottom surface. Being closer to the boundary, the flow at z = 0.75 mm has lower velocity than the flow at z = 1.25 mm. Additionally, unlike the flow profile in the middle height of the stirring bar, the vectors in Figure 12 showed that the fluid travels inwards towards the centre of the rotation and the flow then moves upwards in the meridional plane. Thus, higher radial velocity is observed at the bottom of the spinner flask.
Due to the flow in the flask being primarily in the azimuthal direction, the shear stress associated with interaction between the fluid flow and bottom surface, shown in Figure 13, is of a larger scale compared to previous shear analyses in the meridional plane (Figure 7) and at middle-impeller height (Figure 10). Figure 13 shows that vortex development, highlighted in meridional plane characterisation at different impeller heights, has minimal effect on the magnitude of the shear.
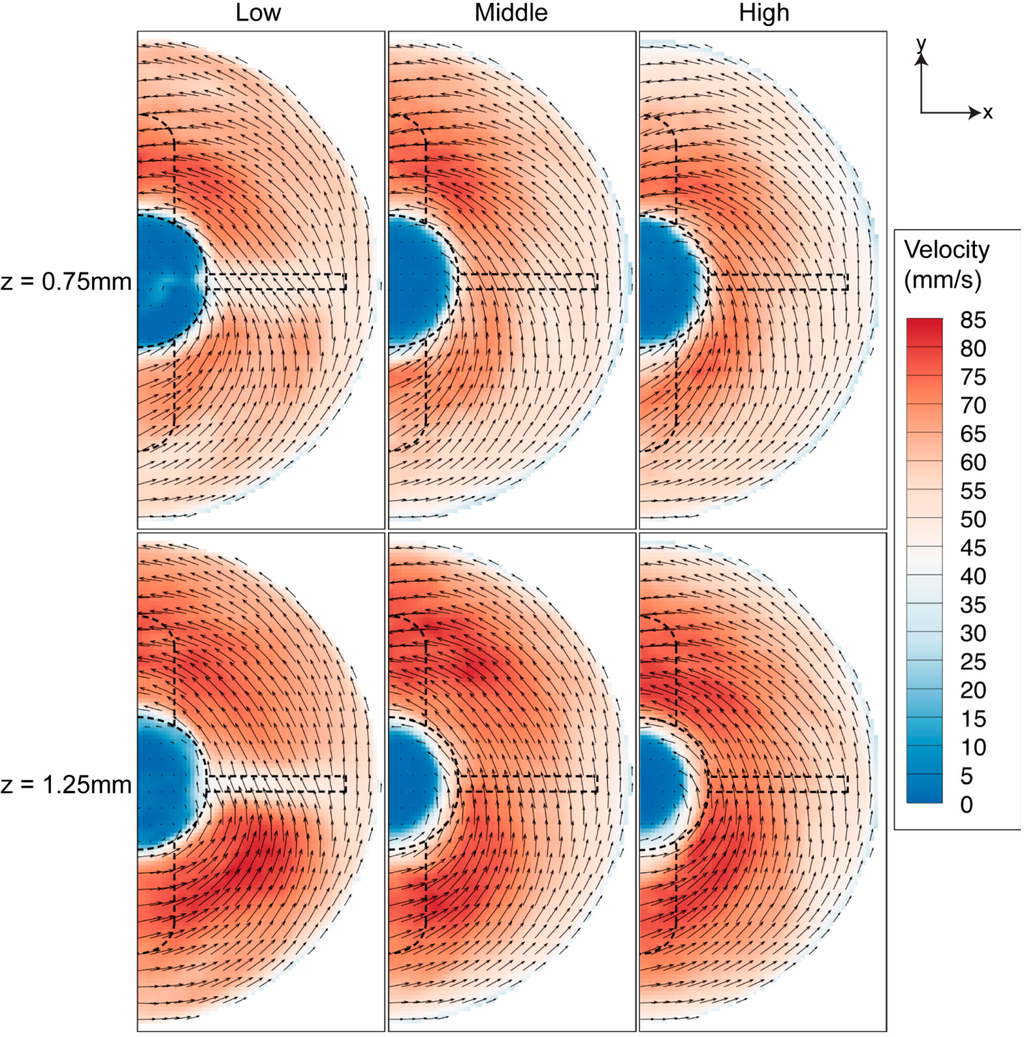
Figure 12.
Velocity profiles near the bottom wall at 40 RPM spinning rate. The velocity near the wall (z = 0.75 mm) is lower than the velocity at location farther from the bottom wall (z = 1.25 mm).
Figure 12.
Velocity profiles near the bottom wall at 40 RPM spinning rate. The velocity near the wall (z = 0.75 mm) is lower than the velocity at location farther from the bottom wall (z = 1.25 mm).

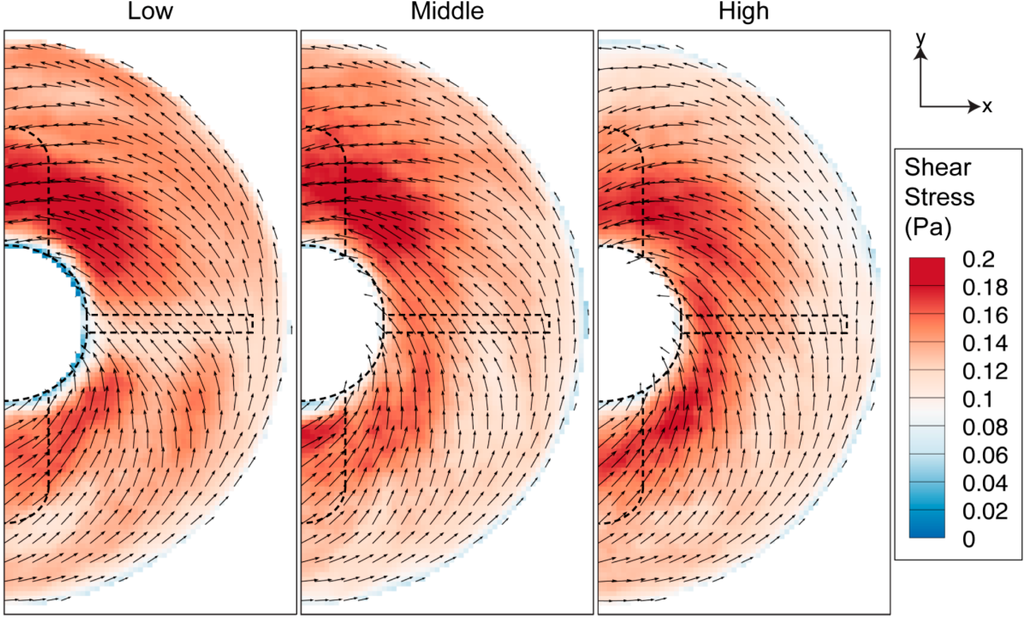
Figure 13.
Shear stress contour near the bottom wall for 40 RPM rotational speed. The stress near the wall is higher in magnitude compared to other azimuthal measurement.
Figure 13.
Shear stress contour near the bottom wall for 40 RPM rotational speed. The stress near the wall is higher in magnitude compared to other azimuthal measurement.

In terms of the shear stress magnitude caused by the fluid-wall interaction at the base, both mean and maximum stresses, presented in Figure 14, are significantly larger than those generated in the meridional plane (Figure 8) and fluid-sidewall interaction at the middle of the impeller (Figure 11). The mean and maximum shear stresses showed similar characteristics with lower gradients at lower speeds while evolving to higher gradients at higher speeds. Hemrajani et al. (2004) [39] mentioned that turbulent conditions are achieved at Reynolds number higher than 104, given that the Reynolds number is defined as Re = ΩD2/ν. As the Reynolds number in our study is based on radial length, Re = ΩR2/ν, similar conditions are achieved at a Reynolds number of 2500 and higher. The change in gradient may be caused by the transition from a laminar to turbulent flow regime, which occurs at around 37 RPM (Re = 2500) for the given flask dimensions. In the case where the impeller was positioned near the base, the mean and maximum shear stresses were found to be marginally higher than those for the lower impeller locations. In general, the impeller position has minimal effect on the shear stress at the bottom surface of the flask, although the difference in mean shear stress is more significant at higher speeds in the analysis. Overall, the shear stress magnitude is significant at high spinning rates, which will cause damage to the cells and limit the efficiency of the culture.
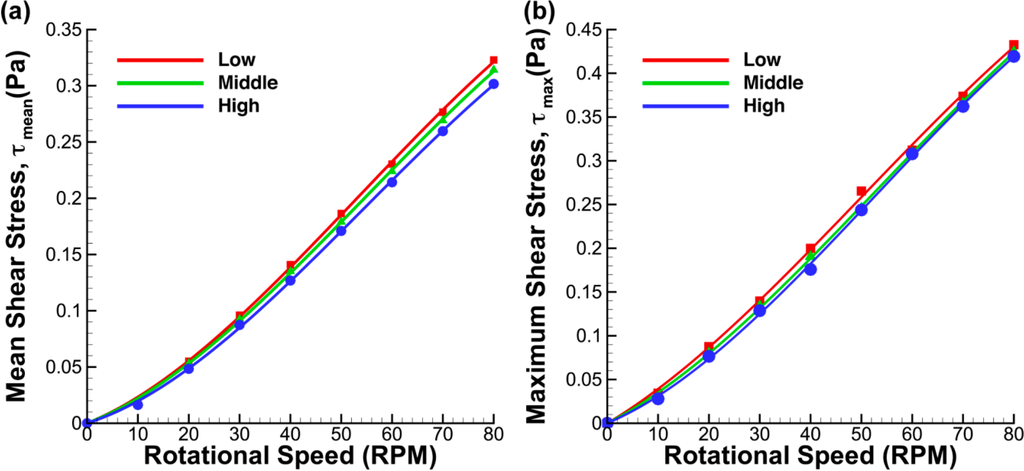
Figure 14.
Shear stress plots for three impeller arrangements at varying impeller speed. The (a) mean and (b) maximum shear stresses increase with rotational speed. The magnitude obtained for the low impeller position is higher than for the other impeller locations.
Figure 14.
Shear stress plots for three impeller arrangements at varying impeller speed. The (a) mean and (b) maximum shear stresses increase with rotational speed. The magnitude obtained for the low impeller position is higher than for the other impeller locations.
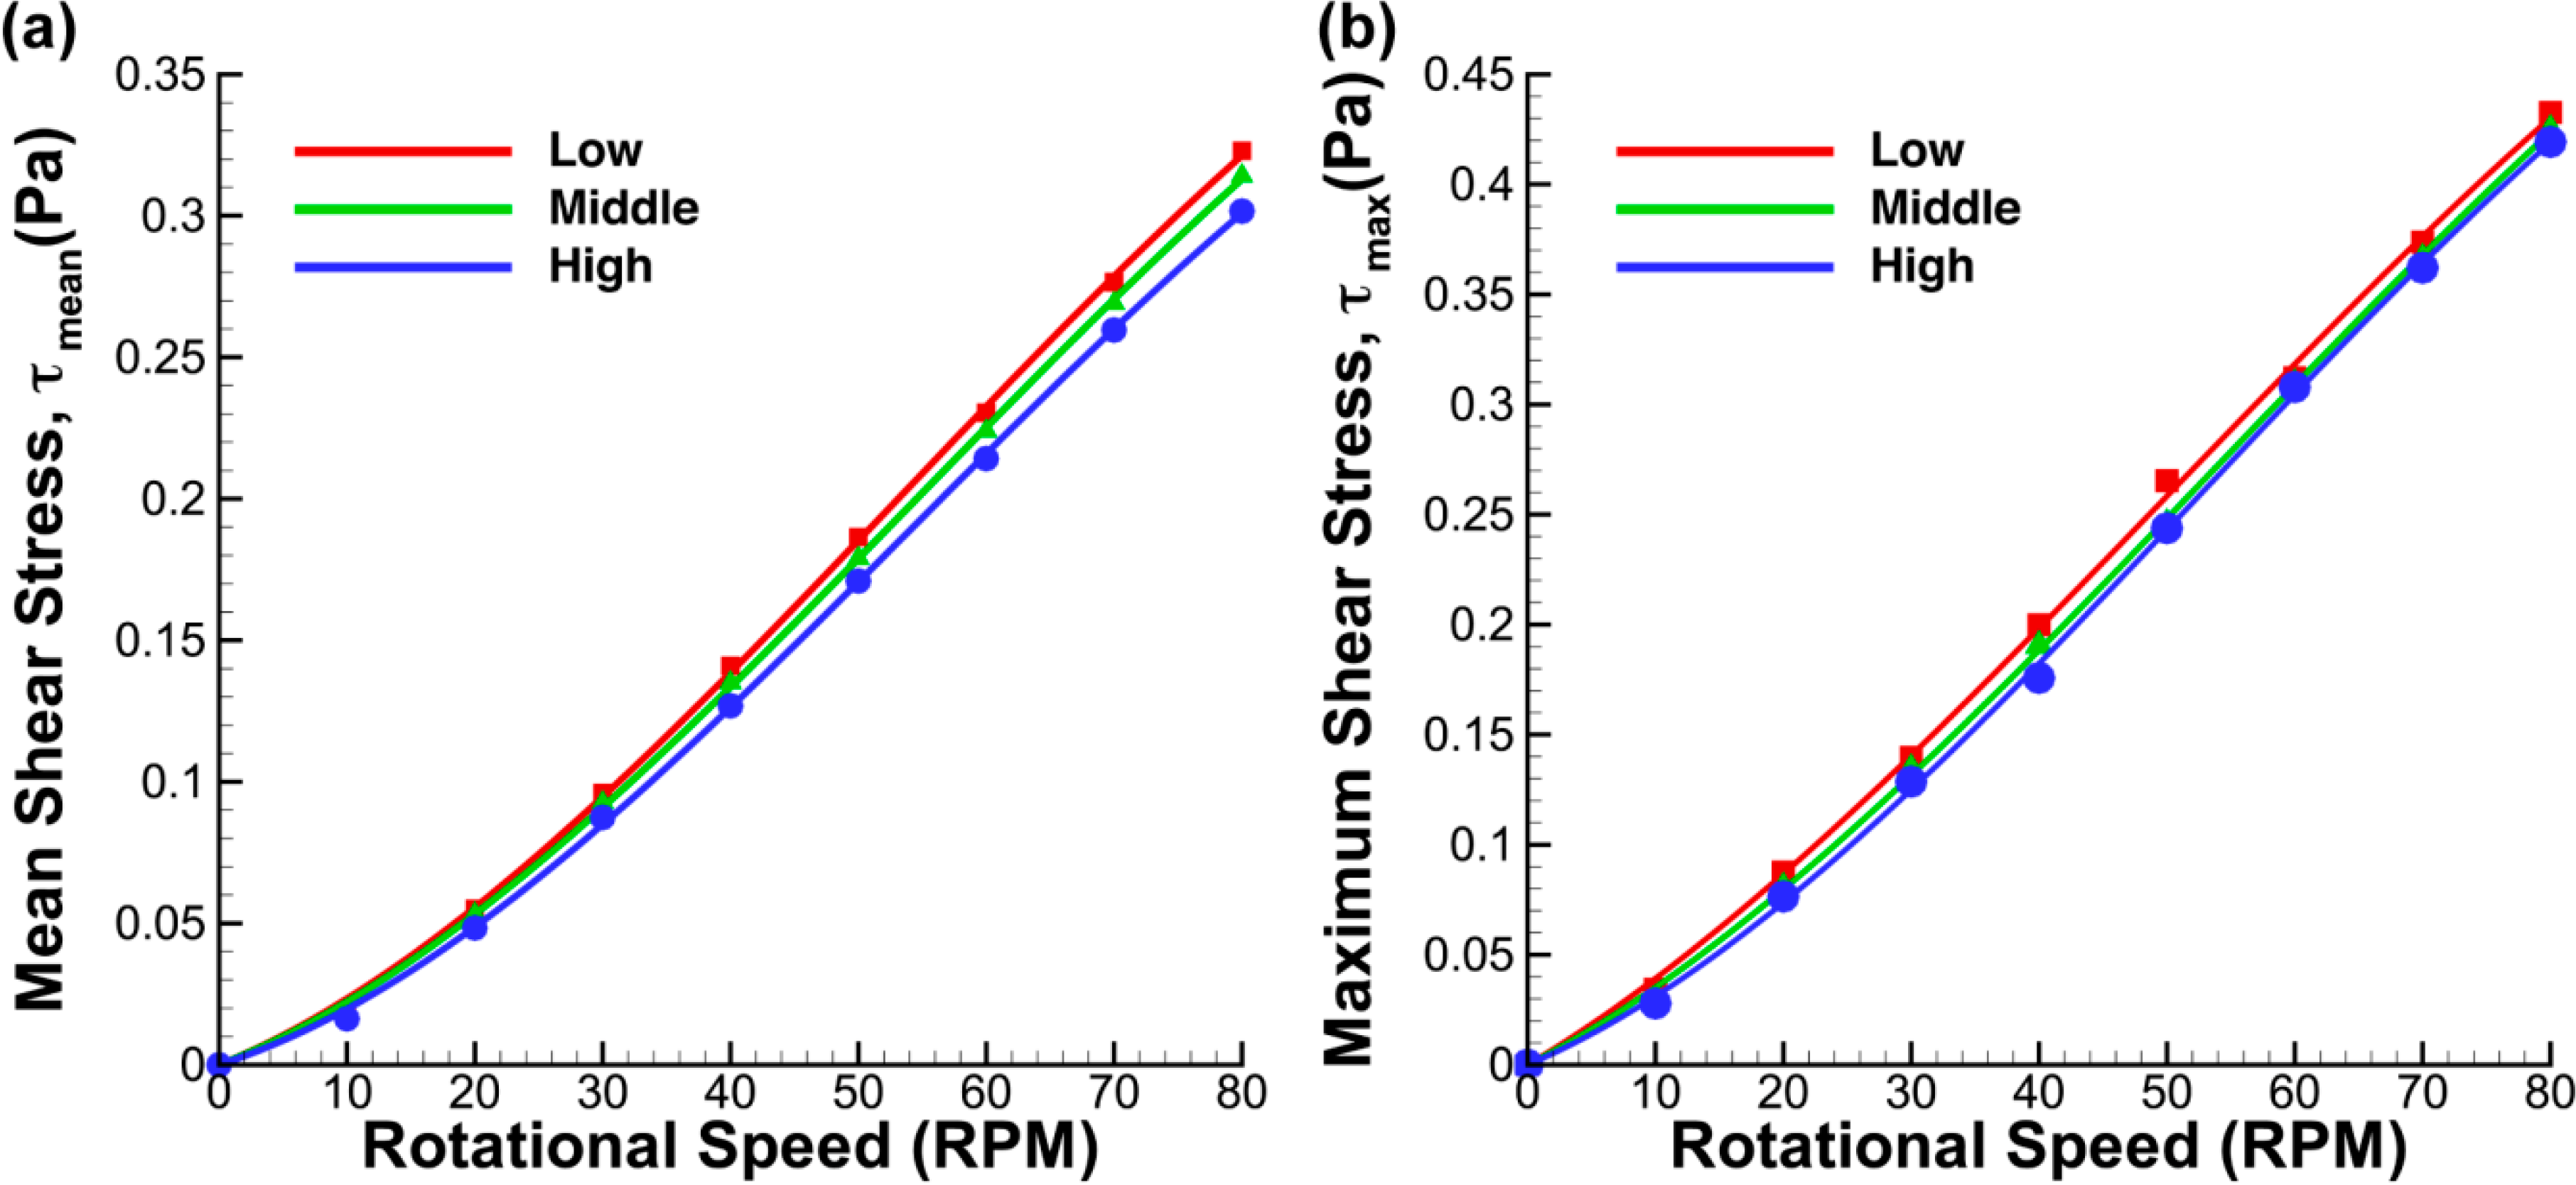
Figure 15 illustrates that the shear stress distribution was also not severely affected by the change in impeller position. However, unlike the shear stress distribution in the meridional plane, the shear stress distribution at the base skewed to higher magnitudes at increasing rotational speed. Due to the fact that the force at the bottom surface was highly dependent on the magnitude of the fluid velocity near the wall, it is not surprising to see that the peak of the distribution shifted to lower value as the impeller was placed at great heights. Microcarriers normally have higher density compared to the working fluid. Thus, they tend to sink and stay at the bottom of the flask. The flow analysis near the bottom wall will enable researchers to quantitatively determine the shear stress that may cause damage to any particular line of cells.
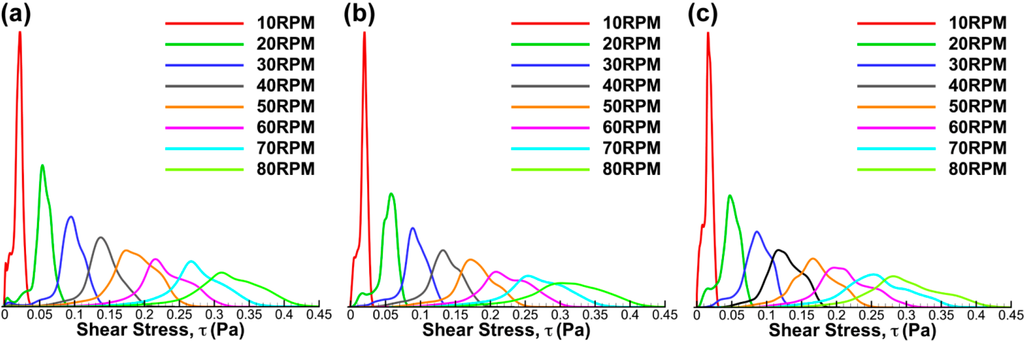
Figure 15.
Histograms of shear stress magnitude at three impeller positions. The shear stress readings for (a) low, (b) middle and (c) high were skewed to higher magnitude at increasing rotational speeds.
Figure 15.
Histograms of shear stress magnitude at three impeller positions. The shear stress readings for (a) low, (b) middle and (c) high were skewed to higher magnitude at increasing rotational speeds.
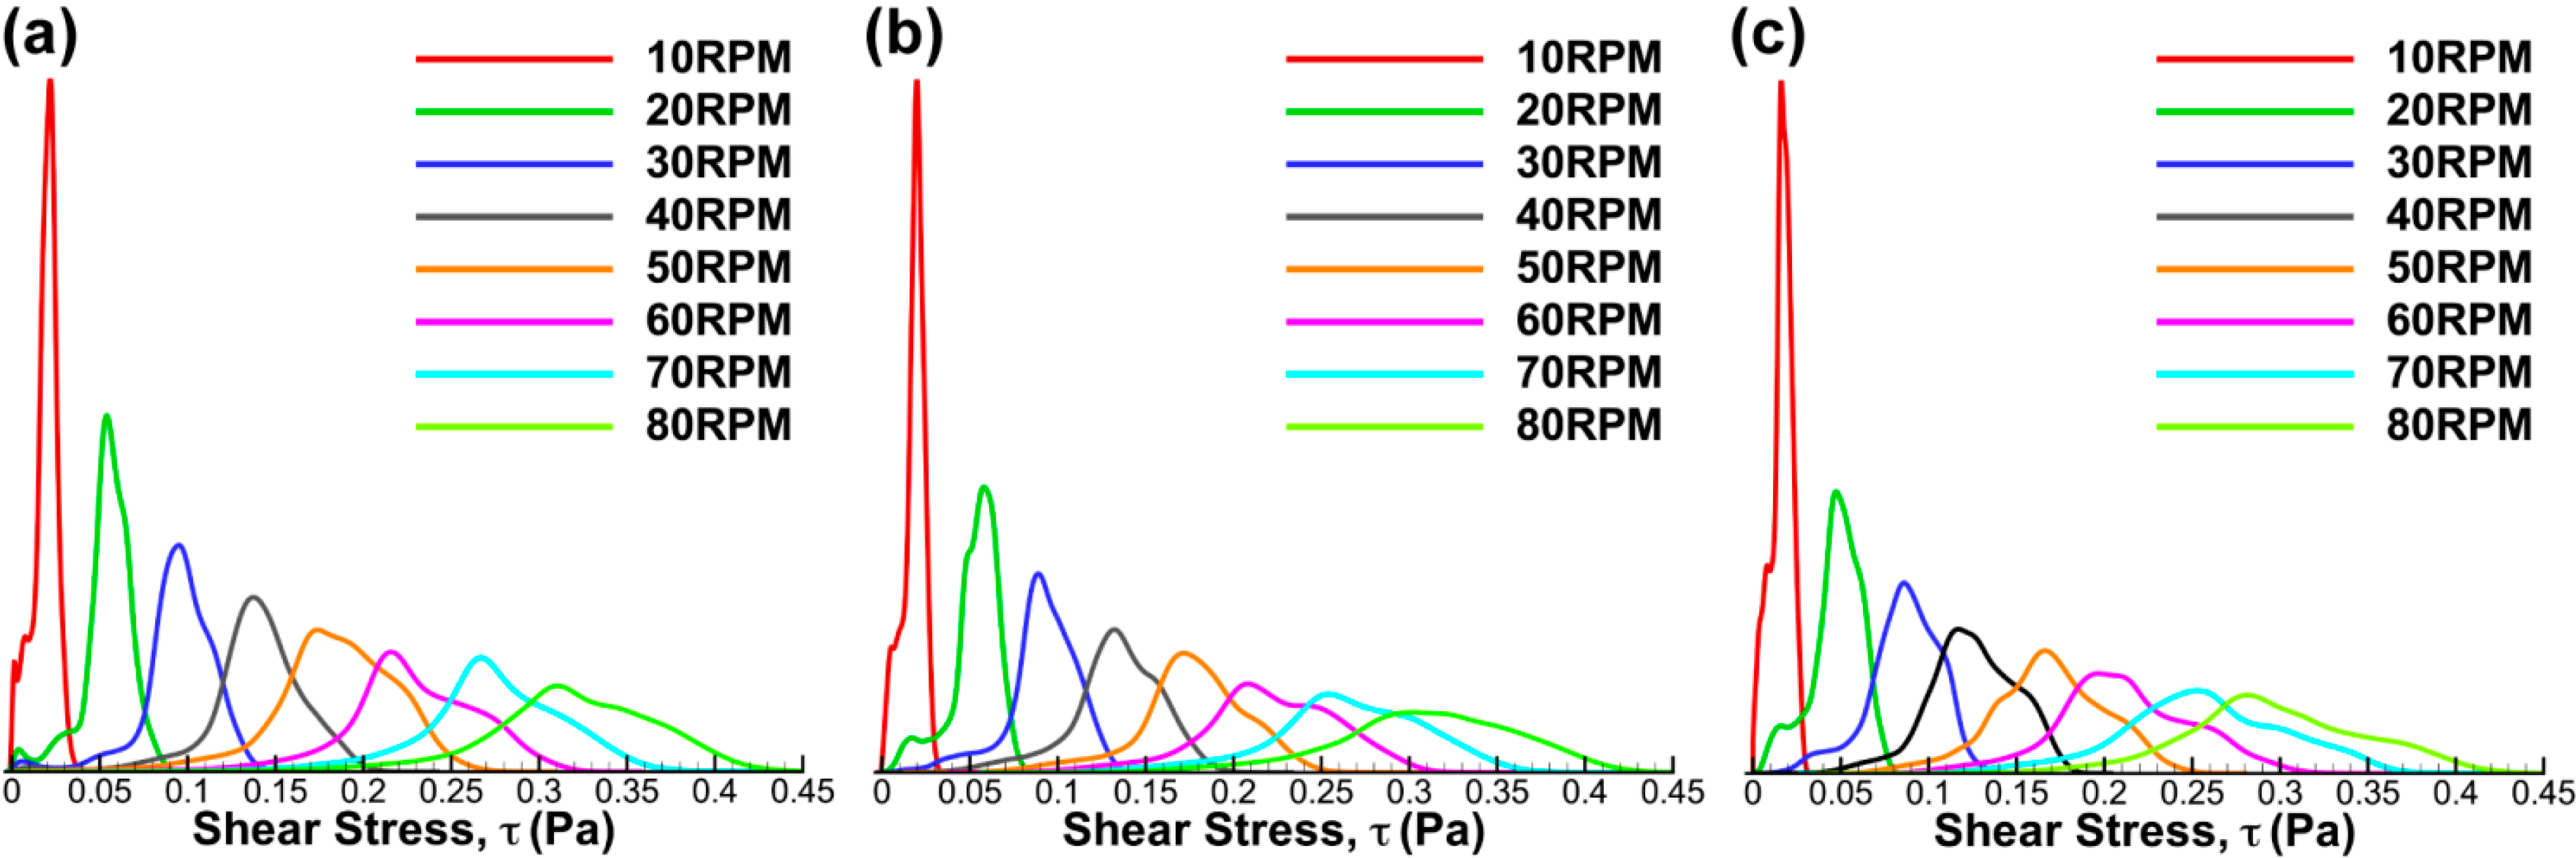
Comparing the stress distributions in this study to the investigations conducted by Kaiser et al. [32] and Schirmaier et al. [38], it can be deduced that the peak of shear stresses occurred due to fluid-wall interaction at the bottom of the flask. The trend of the histograms agrees with the results obtained in the aforementioned studies.
This study highlights the flow and mechanical characteristics within the spinner flask. Although the required average shear stress for various cell culture procedure and the maximum stress they can withstand are still unknown, given this information from cell culture experiments in a simple shear flow, the required speed for the culture protocol can be determined based on the characterization findings presented in this study. Moreover, the shear margin in many published works can be estimated using the data shown in the current study. The knowledge gained through flow characterization would enable researchers to find the optimum flow condition for cell growth. The optimum flow condition could then be used as design requirement for the development of more efficient bioreactors, tailor-made for specific cell type.
4. Conclusions
This study presents detailed quantitative characterization of the flow in the spinner flask bioreactor for varying impeller vertical position and agitation speed. In all imaging planes, the velocities and shear stresses increase with the spinning rate. In the meridional flow analysis, higher vorticity and more extensive recirculation were obtained when the impeller was placed closer to the upper free surface. The highest shear magnitude was observed near the bottom surface of the flask. The fluid-wall interaction in this region is significantly greater than at the middle height of the impeller. Overall, the impeller position has minimal impact on the shear stress in the bioreactor.
Apart from understanding the flow behavior in the spinner flask bioreactor, the results obtained in this study will enable researchers to quantify the shear stress exerted on cells in culture. Furthermore, the analysis in this study can be used as a datasheet and provide an estimate of the shear stress magnitude and its distribution of the previously published cell studies that utilized similar setup. If the required biomechanical properties for a specific cell lineage are known, the corresponding culture speed can be determined based on the shear stress datasheet for the spinner flask, thus optimizing the testing phase time. Additionally, these flow parameters can be used as design requirements for the development of more efficient bioreactors, and ultimately improving the efficiency of cell culture. Future work includes systematic optimization studies for different cell types to determine their optimum culture conditions. Moreover, by conducting similar fluid mechanics analysis for different bioreactor designs, it would enable the required biomechanical parameters knowledge for a certain cell type to be transferable to other bioreactors, should a different bioreactor need to be utilized.
Acknowledgments
This research was supported from the Australia India Strategic Research Fund BF050038 and under Australian Research Council’s Discovery Projects funding scheme (project number DP110100434).
Author Contributions
M.I. and A.F. conceived and designed the experiments; M.I. performed the experiments and analyzed the data; K.H. and A.F. contributed reagents/materials/analysis tools; M.I., K.H. and A.F. wrote the paper.
Conflicts of Interest
The authors declare no conflict of interest.
References
- Thomson, J.A.; Itskovitz-Eldor, J.; Shapiro, S.S.; Waknitz, M.A.; Swiergiel, J.J.; Marshall, V.S.; Jones, J.M. Embryonic stem cell lines derived from human blastocysts. Science 1998, 282, 1145–1147. [Google Scholar] [CrossRef] [PubMed]
- Dexter, T.M.; Allen, T.D.; Lajtha, L.G.; Schofield, R.; Lord, B.I. Stimulation of differentiation and proliferation of haemopoietic cells in vitro. J. Cell. Physiol. 1973, 83, 461–473. [Google Scholar] [CrossRef]
- Collins, P.C.; Miller, W.M.; Papoutsakis, E.T. Stirred culture of peripheral and cord blood hematopoietic cells offers advantages over traditional static systems for clinically relevant applications. Biotechnol. Bioeng. 1998, 59, 534–543. [Google Scholar] [CrossRef]
- Cabral, J.M.S. Ex vivo expansion of hematopoietic stem cells in bioreactors. Biotechnol. Lett. 2001, 23, 741–751. [Google Scholar] [CrossRef]
- Goodwin, T.J.; Schroeder, W.F.; Wolf, D.A.; Moyer, M.P. Rotating-wall vessel coculture of small intestine as a prelude to a tissue modelling: Aspects of simulated microgravity. Proc. Soc. Exp. Biol. Med. 1993, 202, 181–192. [Google Scholar] [CrossRef] [PubMed]
- Freed, L.E.; Vunjak-Novakovic, G. Microgravity tissue engineering. In Vitro Cell. Dev. Biol. Anim. 1997, 33, 381–385. [Google Scholar] [CrossRef] [PubMed]
- Gerecht-Nir, S.; Itskovitz-Eldor, J. Cell therapy using human embryonic stem cells. Transpl. Immunol. 2004, 12, 203–209. [Google Scholar] [CrossRef] [PubMed]
- Kallos, M.; Sen, A.; Behie, L. Large-scale expansion of mammalian neural stem cells: A review. Med. Biol. Eng. Comput. 2003, 41, 271–282. [Google Scholar] [CrossRef] [PubMed]
- Cabrita, G.J.M.; Ferreira, B.S.; da Silva, C.L.; Goncalves, R.; Almeida-Porada, G.; Cabral, J.M.S. Hematopoietic stem cells: From the bone to the bioreactor. Trends Biotechnol. 2003, 21, 233–240. [Google Scholar] [CrossRef] [PubMed]
- Zandstra, P.W.; Bauwens, C.; Yin, T.; Liu, Q.; Schiller, H.; Zweigerdt, R.; Pasumarthi, K.B.S.; Field, L.J. Scalable production of embryonic stem cell-derived cardiomyocytes. Tissue Eng. 2003, 9, 767–778. [Google Scholar] [CrossRef] [PubMed]
- Thouas, G.A.; Sheridan, J.; Hourigan, K. A bioreactor model of mouse tumor progression. J. Biomed. Biotechnol. 2007, 2007, 32754. [Google Scholar] [CrossRef] [PubMed]
- Dusting, J.; Sheridan, J.; Hourigan, K. A fluid dynamics approach to bioreactor design for cell and tissue culture. Biotechnol. Bioeng. 2006, 94, 1196–1208. [Google Scholar] [CrossRef] [PubMed]
- Singh, H.; Teoh, S.H.; Low, H.T.; Hutmacher, D.W. Flow modelling within a scaffold under the influence of uni-axial and bi-axial bioreactor rotation. J. Biotechnol. 2005, 119, 181–196. [Google Scholar] [CrossRef] [PubMed]
- Cormier, J.T.; Zur Nieden, N.I.; Rancourt, D.E.; Kallos, M.S. Expansion of undifferentiated murine embryonic stem cells as aggregates in suspension culture bioreactors. Tissue Eng. 2006, 12, 3233–3245. [Google Scholar] [CrossRef] [PubMed]
- Mukhopadhyay, A.; Madhusudhan, T.; Kumar, R. Hematopoietic stem cells: Clinical requirements and developments in ex-vivo culture. Adv. Biochem. Eng. Biotechnol. 2004, 86, 215–253. [Google Scholar] [PubMed]
- Schroeder, M.; Niebruegge, S.; Werner, A.; Willbold, E.; Burg, M.; Ruediger, M.; Field, L.J.; Lehmann, J.; Zweigerdt, R. Differentiation and lineage selection of mouse embryonic stem cells in a stirred bench scale bioreactor with automated process control. Biotechnol. Bioeng. 2005, 92, 920–933. [Google Scholar] [CrossRef] [PubMed]
- Stiehler, M.; Bünger, C.; Baatrup, A.; Lind, M.; Kassem, M.; Mygind, T. Effect of dynamic 3-D culture on proliferation, distribution and osteogenic differentiation of human mesenchymal stem cells. J. Biomed. Mater. Res. Part A 2008, 89A, 96–107. [Google Scholar]
- Zhang, Z.-Y.; Teoh, S.H.; Chong, W.-S.; Foo, T.-T.; Chng, Y.-C.; Choolani, M.; Chan, J. A biaxial rotating bioreactor for the culture of fetal mesenchymal stem cells for bone tissue engineering. Biomaterials 2009, 30, 2694–2704. [Google Scholar] [CrossRef] [PubMed]
- Meinel, L.; Karageorgiou, V.; Fajardo, R.; Snyder, B.; Shinde-Patil, V.; Zichner, L.; Kaplan, D.; Langer, R.; Vunjak-Novakovic, G. Bone tissue engineering using human mesenchymal stem cells: Effects of scaffold material and medium flow. Ann. Biomed. Eng. 2004, 32, 112–122. [Google Scholar] [CrossRef] [PubMed]
- Nie, Y.; Bergendahl, V.; Hei, D.J.; Jones, J.M.; Palecek, S.P. Scalable culture and cryopreservation of human embryonic stem cells on microcarriers. Biotechnol. Prog. 2009, 25, 20–31. [Google Scholar] [CrossRef] [PubMed]
- Phillips, B.W.; Lim, R.Y.M.; Tan, T.T.; Rust, W.L.; Crook, J.M. Efficient expansion of clinical-grade human fibroblasts on microcarriers: Cells suitable for ex vivo expansion of clinical-grade hESCs. J. Biotechnol. 2008, 134, 79–87. [Google Scholar] [CrossRef] [PubMed]
- Kuriyama, S.; Nakano, T.; Yoshimura, N.; Ohuchi, T.; Moritera, T.; Honda, Y. Mass cultivation of human retinal pigment epithelial cells with microcarrier. Opthamologica 1992, 205, 89–95. [Google Scholar] [CrossRef]
- Frauenschuh, S.; Reichmann, E.; Ibold, Y.; Goetz, P.M.; Sittinger, M.; Ringe, J. A microcarrier-based cultivation system for expansion of primary mesenchymal stem cells. Biotechnol. Prog. 2007, 23, 187–193. [Google Scholar] [CrossRef] [PubMed]
- Schop, D.; Janssen, F.W.; Borgart, E.; de Bruijn, J.D.; van Dijkhuizen-Radersma, R. Expansion of mesenchymal stem cells using a microcarrier-based cultivation system: Growth and metabolism. J. Tissue Eng. Regen. Med. 2008, 2, 126–135. [Google Scholar] [CrossRef] [PubMed]
- Fernandes, A.M.; Marinho, P.A.N.; Sartore, R.C.; Paulsen, B.S.; Mariante, R.M.; Castilho, L.R.; Rehen, S.K. Successful scale-up of human embryonic stem cell production in a stirred microcarrier culture system. Braz. J. Med. Biol. Res. 2009, 42, 515–522. [Google Scholar] [PubMed]
- Frith, J.E.; Thomson, B.; Genever, P.G. Dynamic three-dimensional culture methods enhance mesenchymal stem cell properties and increase therapeutic potential. Tissue Eng. Part C 2010, 16, 735–749. [Google Scholar] [CrossRef]
- Alfred, R.; Gareau, T.; Krawetz, R.; Rancourt, D.; Kallos, M. Serum-free scaled up expansion and differentiation of murine embryonic stem cells to osteoblasts in suspension bioreactors. Biotechnol. Bioeng. 2010, 106, 829–840. [Google Scholar] [CrossRef] [PubMed]
- Hewitt, C.J.; Lee, K.; Nienow, A.W.; Thomas, R.J.; Smith, M.; Thomas, C.R. Expansion of human mesenchymal stem cells on microcarriers. Biotechnol. Lett. 2011, 33, 2325–2335. [Google Scholar] [CrossRef] [PubMed]
- Sucosky, P.; Osorio, D.F.; Brown, J.B.; Neitzel, G.P. Fluid mechanics of spinner flask bioreactor. Biotechnol. Bioeng. 2003, 85, 34–46. [Google Scholar] [CrossRef]
- Meunier, P.; Hourigan, K. Mixing in a vortex breakdown flow. J. Fluid Mech. 2013, 731, 195–222. [Google Scholar] [CrossRef]
- Mununga, L.; Lo Jacono, D.; Sørensen, J.N.; Leweke, T.; Thomson, M.; Hourigan, K. Control of confined vortex breakdown with partial rotating lids. J. Fluid Mech. 2014, 738, 5–33. [Google Scholar] [CrossRef]
- Kaiser, S.C.; Jossen, V.; Schirmaier, C.; Eibl, D.; Brill, S.; van den Bos, C.; Eibl, R. Fluid flow and cell proliferation of mesenchymal adipose-derived stem cells in small-scale, stirred, single-use bioreactors. Chem. Ing. Tech. 2012, 85, 95–102. [Google Scholar] [CrossRef]
- Liovic, P.; Sutalo, I.D.; Stewart, R.; Glattauer, V.; Meagher, L. Fluid flow and stresses on microcarriers in spinner flask bioreactors. In Proceedings of the Ninth International Conference on CFD in the Minerals and Process Industries, CSIRO, Melbourne, VIC, Australia, 10–12 December 2012.
- Ismadi, M.-Z.; Higgins, S.; Samarage, R.; Paganin, D.; Hourigan, K.; Fouras, A. Optimisation of a stirred bioreactor through the use of a novel holographic correlation velocimetry flow measurement technique. PLoS One 2013, 8, e65714. [Google Scholar] [CrossRef] [PubMed]
- Gupta, P.; Ismadi, M.-Z.; Verma, P.; Fouras, A.; Jadhav, S.; Bellare, J.; Hourigan, K. Optimisation of agitation speed in spinner flask for microcarrier structural integrity and expansion of induced pluripotent stem cells. Cytotechnology 2014. [Google Scholar] [CrossRef]
- Fouras, A.; Lo Jacono, D.; Nguyen, C.V.; Hourigan, K. Volumetric correlation PIV: A technique for 3D velocity vector field measurement. Exp. Fluids 2009, 47, 569–577. [Google Scholar] [CrossRef]
- Fouras, A.; Lo Jacono, D.; Hourigan, K. Target-free Stereo PIV: A novel technique with inherent error estimation and improved accuracy. Exp. Fluids 2008, 44, 317–329. [Google Scholar] [CrossRef]
- Schirmaier, C.; Jossen, V.; Kaiser, S.C.; Jüngerkes, F.; Brill, S.; Safazi-Nab, A.; Siehoff, A.; van den Bos, C.; Eibl, D.; Eibl, R. Scale-up of adipose tissue-derived mesenchymal stem cell production in stirred single-use bioreactors under low-serum conditions. Eng. Life Sci. 2014, 14, 292–303. [Google Scholar] [CrossRef]
- Hemrajani, R.R.; Tatterson, G.B. Mechanically stirred vessels. In Handbook of Industrial Mixing: Science and Practice; Paul, E.I., Atiemo-Obeng, V.A., Kresta, S.M., Eds.; John Wiley & Sons, Inc.: Hoboken, NJ, USA, 2004; p. 345. [Google Scholar]
© 2014 by the authors; licensee MDPI, Basel, Switzerland. This article is an open access article distributed under the terms and conditions of the Creative Commons Attribution license (http://creativecommons.org/licenses/by/4.0/).