Abstract
Existing intelligent monitoring methods are limited by insufficient training samples and target-feature degradation in complex environments. To address these issues, an industrial visual inspection scheme with dual verification is proposed for material sheds. The scheme integrates sample enhancement preprocessing based on a Dynamic Enhanced Generative Adversarial Network (DEGAN) with an Attention-Enhanced YOLO-SLOWFAST (AE-YOLO-SLOWFAST) model for target and behavior detection, enabling feature enhancement, real-time dust monitoring, and timely dust suppression. A dynamic enhancement module is first introduced into a GAN, creating DEGAN to generate high-quality samples and augment the training dataset. An AE-YOLO model is then developed to improve static feature extraction under low illumination and enhance small-target detection. The objective function is refined to improve recognition of hard-to-distinguish samples during training. AE-YOLO is combined with SLOWFAST to recognize vehicle behaviors. Dual verification is performed using dust and vehicle detection results together with action recognition outputs, enabling precise control of dust suppression equipment for targeted water mist spraying. The improved AE-YOLO model achieves an mAP@50 of 94.4%. The proposed method delivers a vehicle–dust association matching accuracy of up to 97.2%, which enables all-weather, intelligent, traceable dust suppression in material sheds, reduces false recognition interference, and ensures timely suppression in areas where vehicles are operating.
1. Introduction
Since 2019, many countries have required iron and steel enterprises to adopt ultra-low emission targets, implement full-process environmental management, significantly reduce emissions of major air pollutants, and continuously improve ambient air quality. In the field of intelligent production, extensive research has been conducted on fault diagnosis [1,2], optimal regulation [3], and intelligent control [4] for the process of smelting iron ore in a blast furnace. These technologies can provide effective support for reducing pollution emissions during production. As the first stage of the production chain, the raw material yard must upgrade its dust pollution control measures to meet ultra-low emission requirements. Fugitive emissions are defined as the irregular release of air pollutants without passing through exhaust stacks. Emissions from gaps, vents, and open doors or windows of sintering sheds in steel plants fall into this category. Dust constitutes one of the main components of fugitive emissions and is primarily generated during the handling, transportation, stacking, and processing of raw materials by operating vehicles. Dust degrades air quality, contaminates soil and water sources, and increases the risk of respiratory diseases among workers and nearby residents. Tracing dust-generating vehicles and implementing timely dust suppression therefore has clear and urgent practical significance.
In the early stage, steel enterprises relied on manual identification for dust control in sheds. When a vehicle entered the shed, dust suppression equipment was manually activated to spray water mist. This approach caused uncontrolled water consumption and ground-level water accumulation, leading to moisture-related damage to raw materials. Manual identification also increased labor costs, and operator fatigue often resulted in monitoring omissions, making continuous 24/7 operation difficult. With the development of computer vision technology, on-site images can now be acquired through network cameras, and algorithms can identify dust and vehicle behaviors in real time. These capabilities enable automatic control of dust suppression equipment in designated areas to spray water mist, providing a more reliable and targeted approach to dust control.
2. Relevant Literature and Research Gaps
In computer vision, object detection [5] and action recognition [6] are two core tasks for intelligent analysis of complex scenes, focusing on static target perception and dynamic behavior understanding, respectively. Object detection aims to accurately determine the category and spatial location of target objects from single-frame images or video streams by outputting bounding box coordinates and category labels. As the basis for subsequent high-level visual tasks, object detection in industrial scenarios must address interfering factors such as small targets, low illumination, and occlusion to ensure rapid detection and precise localization of specific objects. Action recognition builds on object detection results and exploits temporal information in video sequences to identify specific behavior patterns by analyzing dynamic features, including postural variation and positional changes across consecutive frames.
Both object detection and action recognition have evolved from traditional handcrafted features to deep learning-based end-to-end frameworks. In early stages, limited computing resources and algorithmic frameworks led object detection to rely on handcrafted descriptors such as Histogram of Oriented Gradients (HOG) [7] and Scale-Invariant Feature Transform (SIFT) descriptors, combined with conventional machine learning classifiers, including Support Vector Machines (SVMs) and decision trees. Target localization and classification were achieved through sliding-window image traversal. Action recognition primarily extracted motion features using optical flow and frame-difference methods or constructed behavior templates based on manually annotated human joints. Although these approaches enabled basic detection and recognition in simple scenes, adaptability to complex environments remained limited. Generalization performance was weak, making it difficult for such approaches to handle industrial interference such as low illumination, occlusion, and small targets.
With the development of deep learning and Convolutional Neural Networks (CNNs), two-stage algorithms represented by Region-based Convolutional Neural Networks (R-CNNs) and single-stage algorithms represented by You Only Look Once (YOLO) emerged in object detection. Two-stage methods first generate candidate regions and then perform classification and regression, achieving high accuracy at the cost of relatively slow inference speed. To address recognition degradation caused by diverse instrument types and high visual similarity in complex industrial settings, Wang et al. [8] developed a robust and generalizable automatic instrument recognition method based on Faster R-CNN. Such two-stage approaches, however, typically require substantial computational resources and incur high hardware costs. YOLO [9], as a representative single-stage detector, directly performs regression-based prediction without candidate region generation, enabling fast inference and suitability for batch processing. Ye et al. [10] integrated hydropower station operational information with YOLO to monitor operating areas in real time, automatically identify worker violations, and issue timely alarms. For industrial emission monitoring, Zhang et al. [11] introduced the BiFormer attention mechanism into the backbone of YOLOv8, improving feature extraction for emissions such as gas and smoke and enhancing robustness in complex environments. Lou et al. [12] proposed DC-YOLOv8 to address insufficient small-target detection accuracy in specific scenarios by incorporating concepts from DenseNet and VoVNet to preserve both normal-scale and small-scale features. To mitigate challenges caused by low illumination and small target sizes, Fan et al. [13] proposed a multi-scale object detection method based on YOLOv5. Images are enhanced using Contrast-Limited Adaptive Histogram Equalization (CLAHE), followed by the introduction of shallow detection layers and network structure optimization to improve small-target detection performance. For road damage detection under complex backgrounds, Yu et al. [14] proposed incorporating a lightweight attention mechanism and a gsconv module to enhance feature extraction while reducing model parameters and adopted the SIoU loss function to improve training stability.
In traceable dust suppression for vehicles, accurate dust recognition is the primary objective. After dust id identified, the next task is to trace the source of dust generation, which can be inferred from the operating states of different engineering vehicles. Drawing on the relationship between temporal resolution and spatiotemporal information, Feichtenhofer et al. [15] proposed the SlowFast network (SLOWFAST), a CNN-based action recognition model that fuses semantic and motion information by processing video at different temporal scales. Vehicle working states inferred using the SLOWFAST model, combined with object detection results, enable more precise localization of dust sources within sheds.
Control schemes that combine object detection with action recognition can achieve traceable dust suppression, but deep learning methods are highly dependent on high-quality datasets [16]. Generative Adversarial Networks (GANs) are generative models based on adversarial training between two networks. The generator produces new samples, while the discriminator evaluates their authenticity, leading to a generator capable of producing realistic data. Wen et al. [17] proposed a GAN-based image enhancement method to expand underwater image datasets through sample generation. Zhan et al. [18] integrated data distribution fitting, GANs, and super-resolution image reconstruction to address random noise input during sample generation and to improve high-resolution image mapping performance.
Similar challenges arise in industrial traceable dust suppression scenarios. Dataset quality directly determines model performance, and insufficient sample diversity severely constrains detection and recognition accuracy. The low-light environment inside sheds limits extraction of discriminative features. Furthermore, camera placement in elevated positions causes engineering vehicles to appear as small targets in collected images, increasing the difficulty of feature extraction. To address these issues, this study makes the following contributions:
- (1)
- A dedicated sample generation algorithm, DEGAN, is proposed for industrial dust scenarios. By embedding dynamic geometric and photometric enhancement modules into a GAN, it enriches training sample diversity, alleviates data scarcity, and improves model adaptability to complex industrial conditions.
- (2)
- An Attention-Enhanced YOLO (AE-YOLO) model is designed for shed dust monitoring. It integrates an efficient attention module, a sparse attention–guided BiFPN, and Focal Loss optimization to address low illumination and small-target issues. Combined with the SLOWFAST network, it enhances both object detection and vehicle action recognition performance.
- (3)
- A traceable dust suppression framework with a dual-verification anti-misjudgment mechanism is established. A multi-task closed-loop system fuses detection, action recognition, and dust suppression control, reducing misjudgments and enabling accurate dust source tracing for practical industrial applications.
3. Traceable Dust Suppression Control Scheme
3.1. Foundations of YOLOv8 and SLOWFAST Models
Considering requirements for model complexity and detection accuracy, the YOLOv8 object detection algorithm achieves high accuracy while maintaining real-time performance. As shown in Figure 1, the YOLOv8 network architecture consists of three components: a backbone network, a neck network, and a head network. Feature extraction in the backbone is performed through a series of convolutional layers, C2f modules, and SPPF modules. The neck network adopts the design concept of the Path Aggregation Feature Pyramid Network (PAFPN) and removes some convolutional layers in the upsampling stage. The head network employs a decoupled head structure to separate classification and localization tasks.
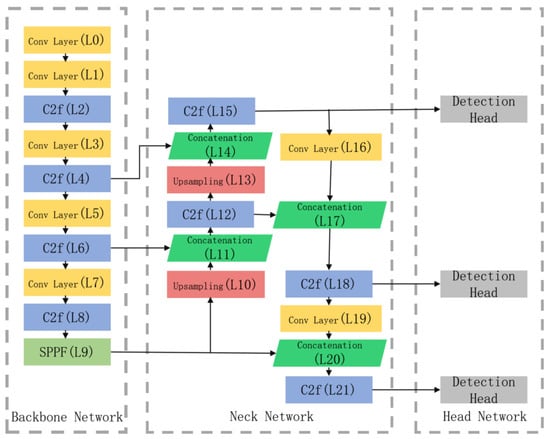
Figure 1.
Network structure diagram of YOLOv8.
Action recognition focuses on extracting dynamic features through spatiotemporal comparison. The classical SLOWFAST action recognition model extracts spatiotemporal features via two parallel pathways, namely, a slow video stream and a fast video stream, as shown in Figure 2. The slow stream operates at a high spatial resolution and low frame rate, learning primarily intra-frame spatial features. The fast stream uses a low spatial resolution and high frame rate to capture inter-frame temporal motion features. Features from the two streams are fused to obtain the final representation. By reducing the number of channel, the model can be made lightweight, significantly improving overall computational efficiency.
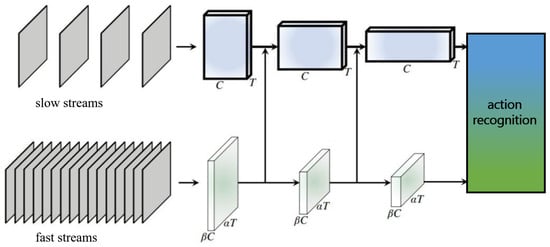
Figure 2.
Model structure diagram of SLOWFAST.
3.2. DEGAN
Long-term reliance on traditional manual dust suppression at industrial sites has limited the number of dust samples that can be collected. This class imbalance degrades model performance in dust recognition tasks. Generative Adversarial Networks (GANs) are deep generative models [19] that produce realistic samples through adversarial training between a generator and a discriminator. The generator synthesizes data samples from latent variables z drawn from a prior distribution, while the discriminator learns a scoring function that assigns low scores to synthetic samples and high scores to real samples x from dataset X. The objective function of the GAN is expressed as follows:
where represents the prior distribution of z, typically sampled from a simple parametric distribution, and represents the real data distribution. Dust samples collected from industrial material sheds are plagued by the problems of a single acquisition scenario, fixed viewing angles, and inadequate coverage of illumination variations. Conventional GAN-generated samples can only simulate the basic data distribution and fail to match the geometric perspective variations caused by vehicle movement inside sheds (e.g., target scaling due to varying vehicle distances, perspective rotation due to vehicle turning) and random illumination changes (e.g., cloudy/sunny weather, illumination fluctuations induced by vehicle lights). Consequently, the generated samples exhibit poor environmental adaptability and cannot effectively improve the generalization capability of the model [20]. To address this limitation, a targeted sample enhancement preprocessing algorithm is introduced by embedding dynamic data augmentation into the GAN framework. In the proposed method, the generator G incorporates a dynamic enhancement module at the output stage. Generated samples are enhanced through randomly parameterized geometric transformations, including rotation, scaling, and shearing, as well as photometric transformations such as contrast adjustment and noise injection [21]. Geometric enhancement corresponds to the perspective/scale variations of vehicle targets caused by the high-altitude deployment of cameras in sheds, while photometric enhancement addresses practical illumination issues in sheds such as low light, uneven light distribution, and image sensor noise. With the introduction of , a feature consistency constraint is applied to ensure that the generated samples still retain the core features of dust and vehicles after dynamic transformation, thus avoiding feature distortion caused by enhancement operations, yielding the following joint loss function:
where represents a pre-trained feature extraction network and is a balance factor, empirically set to . The dynamic enhancement function adopts a probabilistic activation strategy, randomly selecting a subset of enhancement operations for each training batch.
- (1)
- Geometric enhancement:where is the rotation angle , is the scaling factor , and is the shearing intensity .
- (2)
- Photometric enhancement:where is used to control contrast, is used to adjust brightness, and is the Gaussian noise variance. Compared with conventional GANs, the proposed sample enhancement preprocessing algorithm simulates perspective variations and illumination changes in shed environments through combined geometric and photometric transformations. This strategy increases sample diversity and environmental adaptability, improving robustness to small targets and low-light conditions.
DEGAN is improved based on the Deep Convolutional Generative Adversarial Network (DCGAN) framework. It retains the convolution-transposed convolution hierarchical structure of the DCGAN to ensure the textural authenticity of generated samples. Meanwhile, a dynamic enhancement module is embedded at the output end of the generator (G), and the input layer of the discriminator (D) is designed as a hybrid sample receiving layer (fusing real samples, generated samples, and enhanced generated samples); the feature extraction network adopts a lightweight residual network to form a feature consistency constraint with the generator. The following are the specific structures of the generator, discriminator, and feature extraction network and the embedding details of the enhancement modules:
The generator adopts a hierarchical structure of transposed convolution (TConv) + batch normalization (BN) + Leaky ReLU. It takes a 128-dimensional random noise vector as input and upsamples it to a 640 × 640 × 3 RGB image through transposed convolution step by step. The geometric enhancement module is embedded between the last transposed convolution layer and the sigmoid activation layer of the generator, and the photometric enhancement module is executed immediately after the geometric enhancement module; together, these parts form the dynamic output enhancement layer of the generator.
The specific hierarchical structure of the generator is shown in Table 1.

Table 1.
Hierarchical structure of generator (G).
The discriminator adopts a hierarchical structure of convolution + BN + LeakyReLU. To adapt to hybrid sample input (original real samples x, original generator output , enhanced generated samples ), the input layer of the discriminator supports 3 × 640 × 640 RGB image input and outputs the authenticity discrimination probability () through the FC layer after step-by-step downsampling via convolution.
The specific hierarchical structure of the discriminator is shown in Table 2.
Table 2.
Hierarchical structure of discriminator (D).
The feature extraction network in DEGAN is used to realize the feature consistency constraint of generated samples, ensuring that geometric/photometric enhancement operations only change the apparent features (view angle, illumination) of samples without destroying core semantic features (such as category features of dust and vehicles). In this study, a lightweight ResNet18 is selected as the basic network of , and its last fully connected layer and global average pooling layer are removed, retaining the convolution layer and residual block structure to adapt to the lightweight training requirements of industrial scenarios; the pre-trained weights of the network adopt the ImageNet dataset weights and are fine-tuned on the shed monitoring dataset in this study to ensure the feature extraction capability for industrial scenario samples.
The core structure of the feature extraction network is 7 convolution layers + 4 residual blocks, which takes a 640 × 640 × 3 image (generator output or ) as input and outputs a 512 × 20 × 20 core feature map. The specific key layer design is as Table 3.
Table 3.
Key layer design of feature extraction network .
3.3. AE-YOLO
Action recognition performance depends strongly on object detection performance, thus necessitating accurate object detection models. Although YOLOv8 outperforms many mainstream algorithms, the low-light environment in material sheds leads to a reduced image signal-to-noise ratio, blurred grayscale differences between targets and the background, and masking of key features (e.g., vehicle contours, dust edges) by noise. Conventional convolutional modules only perform local feature extraction, which cannot effectively distinguish target features from background noise and is prone to redundant feature extraction and missed detection. To address these limitations, a low-light and small-target detection method based on YOLOv8 is proposed and termed Attention-Enhanced YOLO (AE-YOLO). Figure 3 illustrates the AE-YOLO improvement scheme relative to the original YOLOv8. First, an Efficient Attention Module (EAM) [22] is introduced to enhance the backbone network’s feature extraction capability under low-light conditions. The original YOLOv8 backbone repeatedly applies C2f modules in the L4 and L6 layers, which can cause feature degradation. EAM is therefore integrated into the C2f modules at the L4’ and L6’ layers to strengthen effective feature extraction. Second, a dynamically sparse attention-guided bidirectional feature pyramid network (BiFPN) is designed. Compared with the original YOLOv8 feature pyramid, an additional C2f module (L26’) is introduced for feature fusion, and fusion paths between the L4’ and L6’ layers and the back end of the feature pyramid network are added to incorporate finer-grained features. A dynamically sparse attention mechanism is applied to improve feature extraction from shallow layers, while top-down pathways guide subsequent modules during feature fusion. The structure and working principles of the improved modules are described below.
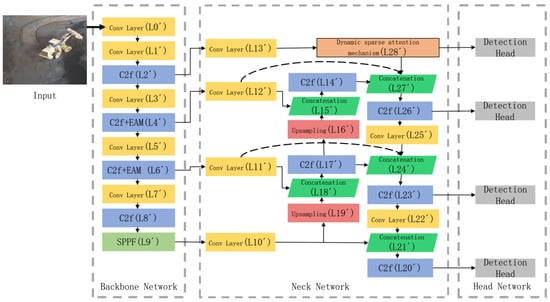
Figure 3.
Model structure diagram of AE-YOLO.
3.3.1. Backbone Network Enhanced by EAM
The YOLOv8 backbone consists primarily of stacked convolutional modules, which limits its ability to distinguish targets from background. To address this issue, EAM is introduced to enhance the C2f modules in the backbone. Local feature enhancement improves extraction of target features under low-light conditions. EAM comprises two independent submodules: a channel attention module and a spatial attention module, which perform attention operations along the channel and spatial dimensions, respectively. Channel attention extracts feature weights in the channel dimension via global average pooling and global max pooling. It assigns high weights to the high-response channels corresponding to target features under low light and low weights to the low-response channels associated with background noise, thus realizing effective feature screening in the channel dimension. Spatial attention expands the receptive field through dilated convolution and locates the spatial positions of targets under low light by fusing multi-scale features from average pooling and max pooling. It assigns high weights to the spatial regions of targets and suppresses the spatial interference of background noise. This design strengthens key feature responses while suppressing redundant or irrelevant information. The implementation of EAM is shown in Figure 4. Given an intermediate feature map , EAM sequentially computes a one-dimensional channel attention map and a two-dimensional spatial attention map . For channel attention, global average pooling (AvgPool) and global max pooling (MaxPool) are applied independently to each channel. The resulting feature vectors are passed through one-dimensional convolution layers. A sigmoid activation function constrains attention weights to the range [0, 1]. The channel attention-weighted feature map is computed as follows:
where denotes the sigmoid function and CNN represents a one-dimensional convolution with kernel size 3. The channel-weighted features are then processed by the spatial attention module. Features obtained by average pooling and max pooling are concatenated along the channel dimension to form a multi-scale contextual representation. This representation is passed through a dilated convolution layer to generate spatial attention weights :
where denotes a dilated convolution with kernel size 3. A sigmoid activation function is applied to normalize the spatial attention weights. The resulting weights are then applied to the original feature map, emphasizing informative spatial locations while suppressing background noise.
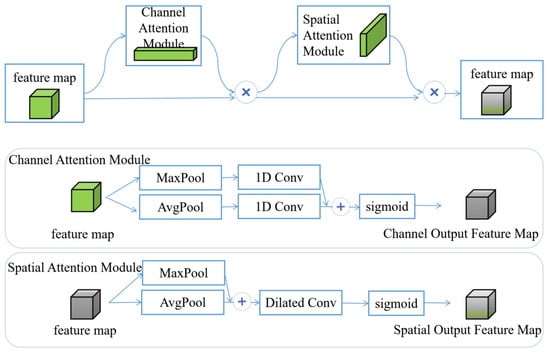
Figure 4.
Efficient attention mechanism.
3.3.2. Attention-Guided BiFPN
Small-target detection remains challenging because small targets occupy few pixels, and their features are easily lost as convolutional depth increases. Multi-scale feature fusion can improve network performance and robustness. In YOLOv8, feature fusion is enhanced primarily through secondary fusion, resulting in relatively simple bidirectional fusion. The extensive use of convolution operations can further degrade semantic details associated with small targets. To improve the detection of small targets, this paper proposes a dynamically sparse attention–guided BiFPN. A dynamically sparse attention mechanism is introduced to extract information from extremely small-target feature layers [23]. Sparsity operations allow the network to skip computation in less relevant regions, enabling extraction of more discriminative target features [24]. Top-down pathways are then added to transmit high-level semantic information and guide subsequent feature fusion. In addition, the head and tail nodes of intermediate feature layers are connected to improve information flow and fusion efficiency, for example, by connecting L13’ to L28’ in Figure 3. For extremely small-target layers, high spatial resolution makes dense attention computationally expensive. Therefore, AE-YOLO adopts a two-path dynamically sparse attention strategy to achieve flexible, content-aware allocation of computation.
The dynamically sparse attention mechanism is illustrated in Figure 5, and its specific data flow and computation steps are mathematically described as follows:
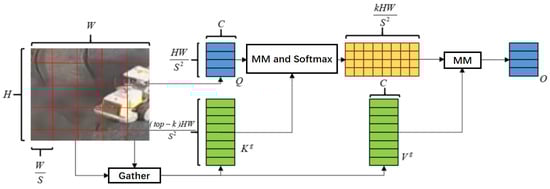
Figure 5.
Dynamic sparse attention mechanism.
Step 1: Feature map partitioning and rearrangement. Given the input feature map (where and C denote height, width, and channel number, respectively), partition X into non-overlapping spatial regions. Each region has a size of , and the rearranged feature map is expressed as
where is the total number of regions, while is the number of pixels in each single region.
Step 2: Generation of query, key, and value tensors. Perform linear transformations on to generate query, key, and value tensors, respectively:
where ; are learnable linear transformation matrices; and are bias terms.
Step 3: Region-level Q and K aggregation. To reduce computational complexity and focus on inter-region correlation, perform average pooling on the pixel dimension of Q and K to obtain region-level query and key :
where denotes the index of the spatial region; is the number of pixels per region; and .
Step 4: Adjacency matrix construction and top-k region selection. Compute the region-level adjacency matrix by calculating the dot product between and the transpose of to measure the similarity between any two regions:
where represents the similarity between the -th reference region and the -th candidate region. For each reference region , select the top-k candidate regions with the highest similarity values, and record their indices as :
where denotes the top-k selection operator, while is the index matrix of selected candidate regions.
Step 5: Gather selected key-value pairs and perform attention computation. Based on the index matrix , gather the corresponding key and value vectors from K and V, respectively:
where , denotes the index of the selected candidate region for each reference region. An LCE block [25] is introduced to focus attention on the selected key–value pairs, and the final output of the dynamically sparse attention mechanism is computed as
where denotes the standard scaled dot-product attention operation, while is the local context enhancement block to retain local pixel-level details.
3.3.3. Improved Loss Function
Focal loss is introduced to optimize training under conditions involving small targets and heavy background interference. Unlike structural modifications based on attention mechanisms, loss function optimization directly influences the training process by encouraging the model to focus on hard-to-distinguish samples during learning [26]. Focal loss extends binary cross-entropy by applying a dynamic scaling factor that downweights easily classified samples. In datasets dominated by easily classified negative samples, standard training tends to suppress the contribution of positive samples. Focal loss addresses this imbalance by introducing a modulation factor:
where is the focusing parameter, ranging from [0, 5]. denotes the predicted confidence score, and balances the relative importance of positive and negative samples. The term increases the loss contribution of hard-to-distinguish samples. The parameter mitigates class imbalance, while controls the emphasis placed on hard versus easy samples.
3.4. Dual-Verification Traceable Dust Suppression Scheme for Vehicles
As shown in Figure 6, the proposed AE-YOLO-SLOWFAST model forms a dual-stage framework, consisting of offline training and online monitoring, which integrates DEGAN sample enhancement, AE-YOLO object detection, and SLOWFAST action recognition for better reproducibility and interpretability. During offline training, collected video data are processed into images and short video clips. After mosaic-based data augmentation, the dataset is divided into training, validation, and test sets. The training set is further enhanced using DEGAN. The processed images are used to train the AE-YOLO object detection model, while the video data, combined with object detection results, are used to jointly train the SLOWFAST action recognition model. After training, real-time data streams are processed for on-site monitoring, enabling continuous detection of dust and vehicles and recognition of vehicle operating states.
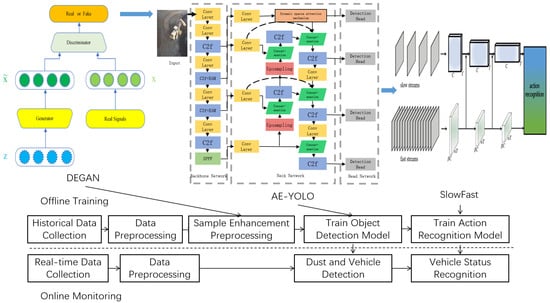
Figure 6.
Model training and monitoring.
The dual-verification anti-misjudgment mechanism of the proposed traceable dust suppression scheme first performs static feature extraction to detect dust and vehicles using AE-YOLO, as illustrated in Figure 7. SLOWFAST is then applied to analyze dynamic features and determine vehicle working conditions. When dust generation is detected in the video stream of a specific camera and the vehicle is identified as operating, the system automatically sends a notification to the information center and activates dust suppression equipment in the corresponding camera area. Water mist is precisely sprayed in the vehicle operating zone, avoiding unnecessary activation of suppression equipment across the entire shed and reducing resource waste. If a vehicle is operating but no dust is detected, dust suppression is not triggered. If dust is detected without corresponding vehicle operation, the event is attributed to potential false recognition. Dust suppression is therefore executed only when both vehicle operation and dust generation are simultaneously identified. This decision logic reduces incorrect suppression caused by false detection. The proposed scheme enables accurate tracing of dust sources, real-time dust suppression, and reduced labor demand, meeting ultra-low emission control requirements for fugitive emissions in sheds.
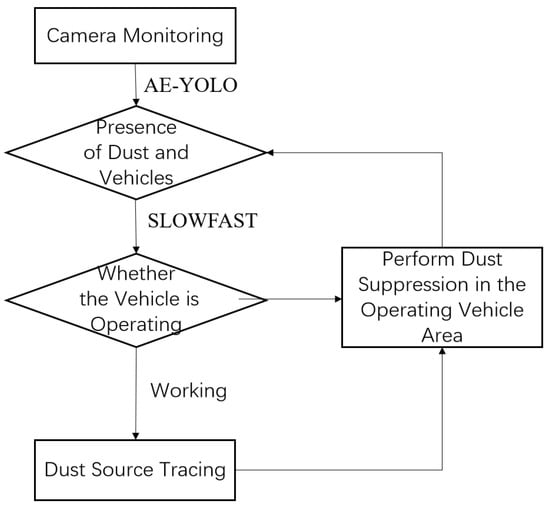
Figure 7.
Control scheme for traceability dust suppression.
4. Case Study
4.1. Experimental Environment and Parameters
To verify the effectiveness of the proposed scheme, tests were performed using the experimental hardware and software configuration listed in Table 4. To ensure stable parameter updates, DEGAN and AE-YOLO are trained using the stochastic gradient descent (SGD) optimizer. The initial learning rate is set to 0.01 and decays to a final value of 0.0001. To accelerate training and improve utilization of computational resources, the number of training epochs is set to 100, the batch size to 64, and the input image resolution to 640 × 640.
Table 4.
Configuration of computer parameters.
4.2. Dataset
The dataset used in this study is collected from multi-angle surveillance videos of sheds in iron and steel enterprises, as shown in Figure 8 and Figure 9. The action recognition dataset annotates the loading and unloading behaviors and motion states of different vehicles. Objects are located and tracked on a frame-by-frame basis. After preprocessing, the action recognition dataset contains 582 videos, each approximately 15 s in duration, with a total length of about 8730 s. The dataset includes 256,394 images, of which 8235 are key frames, with 10,235 annotated bounding boxes. Given the limited data volume, the dataset is randomly divided into training, validation, and test sets with a ratio of 7:2:1. The object detection dataset is constructed by extracting frames from the action recognition videos. After data cleaning, 5610 images are retained and split into training, validation, and test sets using the same ratio. The object detection dataset includes four categories: excavators, forklifts, trucks, and dust.
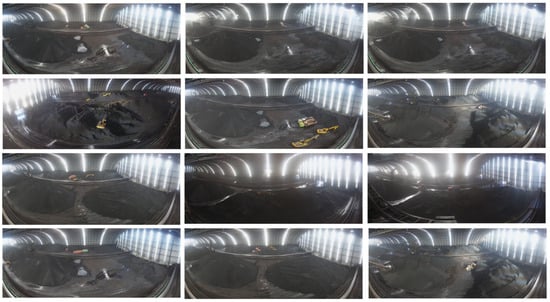
Figure 8.
Selected field data sets.
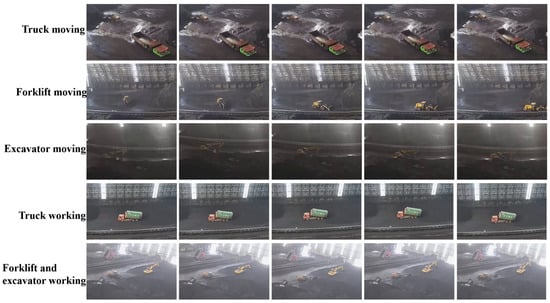
Figure 9.
Key frames showing vehicle motion.
4.3. Evaluation Metrics
Floating-point operations (FLOPs) and mean average precision at an IoU threshold of 0.5 (mAP@50) are used to evaluate model computational cost and recognition accuracy for both object detection and action recognition. The calculation formulas are defined as
where denotes average precision, defined as the area under the precision–recall (Pr-R) curve; represents precision; and R represents recall. n is the number of categories, which is four in this study. To provide a more rigorous and application-oriented evaluation of the model’s performance in industrial dust monitoring scenarios, we introduce two critical metrics: the false positive rate (FPR) and the false negative rate (FNR). These metrics directly reflect the reliability of dust-triggered suppression decisions. The FPR is defined as the proportion of erroneous triggers in dust-free scenes:
where denotes the number of dust-free samples in which the model erroneously detects dust targets (false positives), while represents the total number of dust-free samples. The FNR is defined as the proportion of missed triggers in dusty scenes:
where denotes the number of dusty samples in which the model fails to detect actual dust targets (false negatives), while represents the total number of dusty samples.
To quantitatively evaluate the performance of dust suppression trigger decision, three core metrics are defined based on the actual demands of industrial shed monitoring: the false triggering rate (FTR), the missed triggering rate (MTR), and the overall triggering accuracy (OTA). The calculation formulas and symbol explanations are as follows:
The FTR refers to the proportion of samples where the model incorrectly triggers the dust suppression equipment in scenes without dust production, which is applicable only to the two dust-free scene types, i.e., dust-free scenes with and without vehicle operation. The calculation formula is
where denotes the number of erroneous samples where the model triggers dust suppression in dust-free scenes, while denotes the total number of samples in dust-free scenes.
The MTR refers to the proportion of samples where the model fails to trigger the dust suppression equipment in scenes with dust production, which is only applicable to the two dust-containing scene types, i.e., dust-containing scenes with and without vehicle operation. The calculation formula is
where denotes the number of erroneous samples where the model fails to trigger dust suppression in dust-containing scenes, while denotes the total number of samples in dust-containing scenes.
The OTA refers to the proportion of samples where the model’s trigger decision is consistent with the actual scene requirements in all scenes, which is a core metric for comprehensively evaluating the reliability of the model’s triggering decisions. The calculation formula is
where denotes the number of samples with correct trigger decisions in all scenes, while denotes the total number of samples in all scenes.
To quantitatively evaluate the traceability of dust sources in industrial shed scenarios, vehicle–dust association matching accuracy (VDAMA) is used to evaluate the accuracy of the model in matching the operating vehicle with the corresponding dust source, which is the key to realizing “vehicle–dust source” traceability. The calculation formula is
where is the number of correctly matched “operating vehicle–dust source” pairs identified by the model, while is the total number of “operating vehicle–dust source” pairs in the test set. VDAMA is the core indicator to evaluate the traceability of dust sources to specific operating vehicles. High matching accuracy means that the model can accurately trace which vehicle’s operation causes the dust generation, providing a basis for responsibility tracing and targeted dust suppression. Notably, all evaluation metrics reported in this study represent the mean values derived from five independent experimental runs, ensuring statistical reliability and result reproducibility.
4.4. Ablation Experiment
To evaluate the effectiveness of the EAM, the dynamically sparse attention mechanism, and the improved loss function introduced in AE-YOLO, an ablation study is conducted based on the original YOLOv8 model. The self-constructed dataset is first enhanced using DEGAN, after which individual components are incrementally added to analyze their contributions. Table 5 summarizes the experimental results. In this setup, A denotes the addition of the EAM module to the backbone network, B denotes the introduction of the dynamically sparse attention mechanism in the neck network, and C denotes replacement of the original loss with focal loss. As shown in Table 5, integrating EAM into YOLOv8 improves backbone feature extraction. Under occlusion and irregular target conditions such as dust, the model preserves more discriminative information, increasing mAP@50 by 4.3%. Introducing the dynamically sparse attention mechanism further enhances small-target detection through improved multi-scale feature fusion, yielding an additional 2.1% increase in mAP@50. Loss function optimization with focal loss improves the training process without degrading real-time performance, raising mAP@50 to 94.4%. In addition to mAP@50, we also evaluate FPR and FNR, which are critical for industrial dust monitoring. The results show that each added module effectively reduces the rates of false and missed detection.
Table 5.
Results of the ablation experiment.
The impact of model enhancements on real-time performance is further evaluated through inference efficiency tests. System delay time is defined as the average interval from on-site data acquisition to activation of dust suppression equipment. Model inference time represents the combined average inference time of the object detection and action recognition models. As shown in Table 6, introducing EAM and the dynamically sparse attention mechanism increases system delay, inference time, and peak GPU memory usage, with a corresponding reduction in frame rate. These modules are critical for enhancing weak feature extraction (low illumination) and small-target fusion (dust particles), which are indispensable for industrial dust monitoring. In contrast, loss function improvement does not affect inference efficiency. The proposed scheme achieves an average system delay of 132 ms, satisfying the requirements for continuous real-time monitoring in shed environments.
Table 6.
Comparison results of inference efficiency performance.
4.5. Comparative Experiment
During preliminary experiments, dust detection performance of the baseline object detection model was limited. A sample enhancement preprocessing algorithm, DEGAN, was therefore introduced to augment the training dataset and increase the number of dust samples. To further and objectively evaluate the performance of the proposed object detection model, Table 7 compares AE-YOLO with Faster R-CNN, YOLOv8, improved YOLOv5 [13], DC-YOLOv8 [12], and YOLOv13 [27]. The results indicate that Faster R-CNN, as the detector originally integrated into the SLOWFAST framework, no longer satisfies the performance demands of modern industrial shed monitoring tasks—its real-time inference capability (reflected by high FLOPs of 200.8 G) and recognition accuracy are substantially inferior to state-of-the-art single-stage detectors, with an FPR of 8.7% and FNR of 9.2% that fail to meet practical industrial application requirements. In terms of recognition accuracy, dataset enhancement via the DEGAN module consistently improves detection performance across all models, with mAP@50 gains ranging from 1.8% to 3.1%. Among comparative models, Improved YOLOv5 is optimized for complex environments (e.g., low illumination and occlusion by dust), achieving a lower performance requirement of 14.8 G FLOPs through lightweight module design, but at the cost of slightly compromised accuracy (mAP@50 = 89.2% with enhancement) and suboptimal dust detection robustness (FPR: 5.3%, FNR: 6.8%). DC-YOLOv8 targets small-object detection and outperforms baseline YOLOv8 in both mAP@50 (91.8% with enhancement) and dust detection metrics (FPR: 4.1%, FNR: 5.5%), but its computational requirement of 35.4 G FLOPs is marginally higher than those of more recent variants. YOLOv13, as the latest baseline model, demonstrates competitive performance, with an mAP@50 of 93.1% (with enhancement), FPR of 3.2%, and FNR of 4.2% for dust targets, outperforming all prior models except AE-YOLO. However, it still lags behind AE-YOLO by 1.3% in enhanced mAP@50 and 1.1%/1.2% in FPR/FNR, while its computational requirement (32.9 G FLOPs) is only slightly lower than that of AE-YOLO. AE-YOLO, tailored specifically for the task of traceable dust suppression in sheds, addresses both low-illumination and small-target characteristics simultaneously. It achieves the highest mAP@50 among all models, at 94.4% (with enhancement), coupled with the lowest FPR rate (2.1%) and FNR (3.0%)—key metrics for industrial dust monitoring. While derived from YOLOv8 and incorporating attention mechanisms (consistent with DC-YOLOv8), AE-YOLO balances performance and efficiency: it is a lightweight model capable of real-time inference (FLOPs = 34.7 G, comparable to YOLOv13 and DC-YOLOv8) while delivering substantial gains in accuracy and dust detection robustness, making it the optimal choice for practical shed monitoring scenarios.
Table 7.
Detection performance of target detection models for various types of targets.
4.6. Anti-Misjudgment Mechanism Verification
To further verify the cross-scenario generalization ability and industrial applicability of the proposed method, an independent test dataset was collected in this study from the shed surveillance videos of another iron and steel enterprise. After rigorous data cleaning and screening, a total of 1000 valid 15 s video clips were finally selected as the independent test set. This test set was divided into four distinct actual working conditions, with 250 samples for each scenario: vehicle operation with dust, vehicle operation without dust, dust without vehicle operation, and no vehicle operation without dust. The dust suppression triggering performance of both the single detection model (AE-YOLO) and the dual-verification model (AE-YOLO-SLOWFAST) was independently evaluated. The comparative results are summarized in Table 8, and “-” denotes metrics not applicable to the specific scenario.
Table 8.
Comparison of dust suppression triggering performance between single- and dual-verification models.
Regarding the FTR, the single AE-YOLO model exhibited an FTR of 18.4% in the “Vehicle operation + Dust” scenario—a result highly consistent with real-world monitoring conditions in industrial material sheds. In such environments, visual artifacts induced by vehicle operations (e.g., body vibrations, tire-raised particulates) closely resemble genuine dust features. A detection model relying solely on static object recognition struggles to discriminate these subtle visual similarities, consequently triggering the dust suppression system erroneously. In contrast, the AE-YOLO-SLOWFAST dual-verification model leverages the SLOWFAST network to dynamically analyze vehicle motion patterns, accurately identifying whether dust-generating actions are occurring. This approach reduces the FTR in this scenario dramatically to 1.2%, conclusively validating the pivotal role of the behavior recognition module in mitigating misjudgments caused by static visual ambiguities.
Concerning the MTR, the single AE-YOLO model yielded an MTR of 15.2% in the “No Vehicle + Dust” scenario. This stems from the limitation of object detection alone: low-concentration dust phenomena (e.g., faint airborne particles or localized accumulations in vehicle-free zones) are frequently obscured by complex background textures, resulting in insufficient detection sensitivity. The AE-YOLO-SLOWFAST model overcomes this by integrating contextual scene understanding, prioritizing dust identification in non-vehicle-containing regions. It effectively captures non-vehicle-related dust events, such as natural dispersion over stockpiles or dust diffusion during material handling, reducing the MTR to 2.0% and demonstrating the enhanced adaptability of the dual-verification framework across diverse dust-generation contexts.
In terms of holistic performance, the dual-verification model reduced the average FTR across all scenarios from 10.9% to 0.8% and the average MTR from 12.4% to 1.8%, maintaining both critical error metrics below 2%. Concurrently, the OTA for dust suppression improved by 13.3% relative to the single-model baseline. This measured improvement not only quantitatively validates the optimization efficacy of the dual-verification mechanism on trigger decision reliability but also aligns with established patterns in industrial vision system refinement—avoiding implausible gains indicative of overfitting or data distortion. The results robustly affirm the engineering practicality, generalizability, and deployment readiness of the proposed methodology.
4.7. Traceability Experimental Validation
From the test set detailed in Section 4.6, we selected 500 valid operating vehicle–dust source association samples from the test set, comprehensively covering real-world operational scenarios in industrial material sheds. The baseline method employed for comparison is the standard YOLOv13+SLOWFAST model.
The two models were evaluated on an identical set of 500 samples. Each model’s outputs identified vehicle–dust association pairs, which were compared against manually annotated ground-truth pairs to compute the VDAMA. To minimize random errors, all experiments were repeated five times, with mean values and standard deviations reported as final results (as shown in Table 9).
Table 9.
Performance comparison of vehicle–dust association matching accuracy.
The proposed AE-YOLO-SLOWFAST model achieves a VDAMA of 97.2%, representing a substantial improvement of 3.4% over the baseline. Concurrently, its significantly lower standard deviation (0.8% vs. 2.1%) demonstrates superior robustness and reproducibility across repeated trials. These results validate two critical mechanisms: (1) The DEGAN module generates diverse, physically plausible vehicle–dust association samples, enabling comprehensive learning of varied operational behaviors and enhancing generalization to rare scenarios, whereas the baseline model, constrained by limited real-world samples, exhibits poor adaptability; (2) The Dynamically Sparse Attention module explicitly focuses on causally relevant features (e.g., vehicle operating actions and dust diffusion direction), effectively suppressing spurious correlations. In contrast, the baseline model lacks such targeted feature refinement, frequently misidentifying nearby non-causative vehicles as sources of dust.
4.8. Effect Demonstration
To visually evaluate detection performance in shed environments, representative images from the test set are selected and detection results from three advanced models, improved YOLOv5, DC-YOLOv8, YOLOv13, and AE-YOLO, are compared in Figure 10. In the figures, Dust denotes dust, Digging denotes excavators, Truck denotes trucks, and Forklift denotes forklifts. The results demonstrate that AE-YOLO improves detection under conditions of low illumination, small targets, occlusion, and varying viewpoints. In Figure 10a, the improved YOLOv5 model exhibits false detections, misclassifying forklifts as excavators. In Figure 10b, DC-YOLOv8 fails to detect vehicles under low-light conditions, while the improved YOLOv5 model detects vehicles but produces false positives. Due to elevated camera placement, vehicles located farther inside the shed appear as small targets. As shown in Figure 10c, AE-YOLO achieves the most reliable detection of small vehicles. The improved YOLOv5 model optimizes only the small-target detection layer, resulting in loss of key features and inferior performance compared with the other three models. AE-YOLO incorporates EAM to strengthen feature associations between targets and background regions and improves the loss function to address hard-to-distinguish dust samples, leading to superior dust recognition performance, as shown in Figure 10e,f. To further assess robustness, images collected from different sheds are evaluated (Figure 10g). The proposed model maintains stable performance across varying shed environments, indicating improved generalization capability.
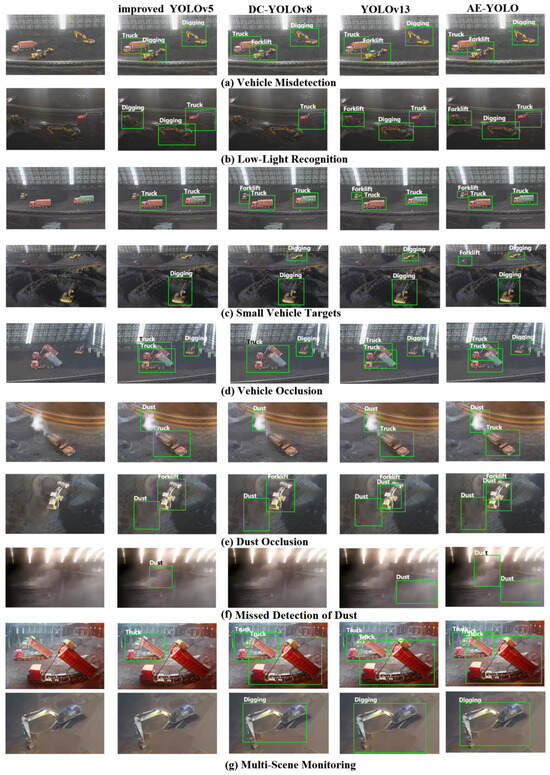
Figure 10.
Comparison results of object detection performance.
Taking key frames of a forklift shoveling material as an example, Figure 11 illustrates the dust tracing process, where “working” indicates that the vehicle is in an operating state. The improved YOLOv5-SLOWFAST model exhibits missed dust detections. Although dust is detected in the final two frames, severe dust occlusion prevents recognition of the vehicle operating state. The DC-YOLOv8 model fails to detect dust; therefore, even when SLOWFAST identifies the forklift as operating, the system does not issue an alarm. YOLOv13 only detects parts of the dust. AE-YOLO-SLOWFAST provides stronger feature extraction capability and reduces missed detections. When both vehicle operation and dust generation are identified, the dust suppression system locates the corresponding shed area based on the camera identifier and performs regional traceable dust suppression.
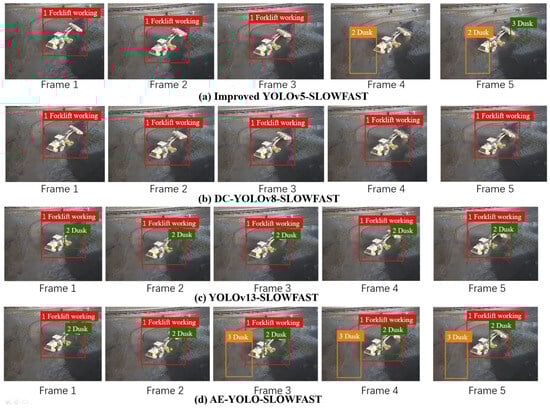
Figure 11.
Action recognition results of different models.
In Figure 12, the truck remains stationary, while DC-YOLOv8 incorrectly identifies ground reflections as dust. Relying solely on object detection would therefore lead to incorrect suppression decisions. When dual verification is applied in conjunction with SLOWFAST, the dust suppression system does not trigger unnecessary suppression, demonstrating the effectiveness of the anti-misjudgment mechanism.
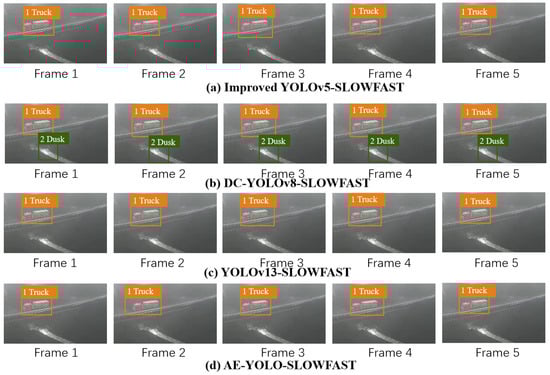
Figure 12.
Anti-misjudgment effect of the proposed scheme.
4.9. Discussion
The proposed technical chain of ”DEGAN Sample Enhancement–AE-YOLO Detection–SLOWFAST Dual-Verification Traceability” achieves a systematic breakthrough in industrial shed dust monitoring, spanning ”data quality → detection accuracy → decision reliability → accountability traceability”. The core findings are summarized as follows:
- 1.
- Scenario-driven collaborative design outperforms generic model stacking: DEGAN generates high-fidelity samples through dynamic photometric-geometric enhancement, effectively alleviating the scarcity of industrial data. AE-YOLO customizes attention mechanisms and loss functions for pain points such as low illumination, small targets, and occlusion while maintaining a system delay of 132 ms (meeting the industrial real-time standard of ≤200 ms), it significantly enhances detection robustness (with drastically reduced FPR/FNR). The dual-verification framework integrates static object detection and dynamic action recognition, raising triggering accuracy to 98.5% and fundamentally suppressing misjudgments.
- 2.
- Technical closed-loop aligns with industrial practical needs: A 97.2% vehicle–dust association matching accuracy (VDAMA) not only supports precise dust suppression but also provides a quantitative basis for accountability definition. The modular design allows independent adaptation of each component to diverse industrial scenarios (e.g., ports, mines), verifying the scheme’s transferability and engineering practicality.
- 3.
- Rational trade-off between performance and efficiency: A moderate increase in computational overhead (FLOPs: 28.5 G → 34.7 G) yields substantial improvements in detection and decision quality, conforming to the core requirement of ”reliability first” in industrial deployment.
This study not only presents an implementable technical solution for intelligent dust suppression but also offers a methodological reference for other industrial visual inspection tasks via its research paradigm of ”problem-oriented design → modular collaboration → closed-loop verification”.
5. Conclusions
To address the challenges of insufficient training samples, target feature degradation, and unreliable dust source tracing in industrial shed dust monitoring, this study proposes an all-weather traceable dust suppression scheme integrating Dynamic Enhanced Generative Adversarial Network (DEGAN), Attention-Enhanced YOLO (AE-YOLO), and SLOWFAST action recognition. The scheme achieves synergistic improvements in data quality, detection accuracy, decision reliability, and tracing capability, providing a practical technical solution for intelligent pollution control in industrial scenarios.
Quantitatively, DEGAN stably improves the mAP@50 of mainstream detectors by 1.8–3.1% through dynamic photometric–geometric enhancement; AE-YOLO reaches a mAP@50 of 94.4% with FPR = 2.1% and FNR = 3.0%, outperforming YOLOv13 by 1.3% in accuracy while maintaining a real-time system delay of 132 ms. The dual-verification framework achieves 98.5% OTA and 97.2% VDAMA, reducing the false and missed triggering rates to 0.8% and 1.8% respectively. Qualitatively, the proposed methods effectively mitigate the impact of low illumination, small targets, and occlusion in sheds; generate environment-adaptive samples; and realize accurate dust source tracing, which aligns well with practical industrial needs.
The scheme balances performance and efficiency (FLOPs: 34.7 G) and features a modular design with strong transferability, suitable for deployment in diverse industrial scenarios. The proposed technical chain provides a reusable solution for intelligent dust suppression and offers methodological references for other industrial visual inspection tasks. Future work will focus on optimizing the model for ultra-small targets and expanding multi-camera collaborative monitoring.
Author Contributions
Conceptualization, K.C.; methodology, K.C.; software, H.X. and D.Z.; validation, D.Z.; formal analysis, X.Z.; investigation, H.X.; resources, Y.S. and Z.J.; data curation, X.Z.; writing—original draft preparation, K.C. and X.Z.; writing—review and editing, Y.S. and S.L.; visualization, Z.J.; supervision, Y.S. and S.L.; project administration, Y.S. and X.Z.; funding acquisition, Y.S. All authors have read and agreed to the published version of the manuscript.
Funding
This work was supported in part by the horizontal project Technical Scheme for Development and Application of Intelligent Image Recognition Algorithms Based on Cloud-Edge Integration, in part by a grant from Pioneer Research and Development Program of Zhejiang (No. 2025C01021), in part by a grant from Zhejiang Province Postdoctoral Research Project Selection Fund (No. ZJ2025061), in part by the grants from the National Science and Technology Major Project Intelligent Manufacturing Systems and Robotics of China (No. 2025ZD1602000 and 2025ZD1601800), and in part by grants from the National Natural Science Foundation of China (No. 61933015, 62273030, 62573387).
Data Availability Statement
Data are contained within the article.
Conflicts of Interest
Authors Kun Chen, Yan Shao and Di Zheng were employed by the company China City Environment Protection Engineering Limited Company. The remaining authors declare that the research was conducted in the absence of any commercial or financial relationships that could be construed as a potential conflict of interest. The China City Environment Protection Engineering Limited Company had no role in the design of the study; in the collection, analyses, or interpretation of data; in the writing of the manuscript, or in the decision to publish the results.
References
- Cao, Y.; Yang, C.; Lou, S.; Yang, Y. Stationarity fusion with SVM: A stationary combined features support vector machine approach for blast furnace iron-making process fault diagnosis. Comput. Chem. Eng. 2025, 206, 109543. [Google Scholar] [CrossRef]
- Zhang, X.; Yang, C.; Ge, M.; Lou, S.; Yang, Y.; Wu, P. A novel few-shot fault diagnosis model for addressing nonstationarity in the ironmaking process. J. Process Control 2025, 152, 103491. [Google Scholar] [CrossRef]
- Lou, S.; Yang, C.; Kong, L.; Lin, T.; Zhang, H.; Wu, P.; Chai, L. TKS-BLS: Temporal kernel stationary broad learning system for enhanced modeling, anomaly detection, and incremental learning with application to ironmaking processes. IEEE Trans. Syst. Man Cybern. Syst. 2024, 55, 645–660. [Google Scholar] [CrossRef]
- Zhang, X.; Yang, C.; Lou, S.; Yang, Y.; Li, Y.; Wu, P. A Self-Healing Control Framework for Blast Furnace Based on Latent Space Feature Transformation. IEEE Trans. Instrum. Meas. 2025, 74, 1–18. [Google Scholar] [CrossRef]
- Zou, Z.; Chen, K.; Shi, Z.; Guo, Y.; Ye, J. Object detection in 20 years: A survey. Proc. IEEE 2023, 111, 257–276. [Google Scholar] [CrossRef]
- Sun, Z.; Ke, Q.; Rahmani, H.; Bennamoun, M.; Wang, G.; Liu, J. Human action recognition from various data modalities: A review. IEEE Trans. Pattern Anal. Mach. Intell. 2022, 45, 3200–3225. [Google Scholar] [CrossRef] [PubMed]
- Zhang, X.; Zhang, L.; Lou, X. A raw image-based end-to-end object detection accelerator using HOG features. IEEE Trans. Circuits Syst. I Regul. Pap. 2021, 69, 322–333. [Google Scholar] [CrossRef]
- Wang, X.; Zhang, B.; Zhan, M.; Zhao, C. Automatic instrument identification based on improved Faster RCNN. Mech. 2024, 41, 532–539. [Google Scholar]
- Redmon, J.; Divvala, S.; Girshick, R.; Farhadi, A. You only look once: Unified, real-time object detection. In 2016 IEEE Conference on Computer Vision and Pattern Recognition; IEEE: Las Vegas, NV, USA, 2016; pp. 779–788. [Google Scholar]
- Ye, B.; Tian, Y.; Zhao, Y.; Jiang, Q.; Chen, S. Operation Safety Detection of Hydraulic Power Station Based on YOLO. Autom. Appl. 2023, 20, 198–200. [Google Scholar]
- Zhang, F.; Zhang, P.; Li, D.; Yu, X.; Gao, Q.; Wu, H. Image Monitoring Technology for Industrial Emissions Based on Improved YOLOv8. In 2024 IEEE China Conference on System Simulation Technology and Its Application; IEEE: Tianjin, China, 2024; pp. 241–245. [Google Scholar]
- Lou, H.; Duan, X.; Guo, J.; Liu, H.; Gu, J.; Bi, L.; Chen, H. DC-YOLOv8: Small-size object detection algorithm based on camera sensor. Electronics 2023, 12, 2323. [Google Scholar] [CrossRef]
- Fan, H.; Liu, J.; Cao, X.; Zhang, C.; Zhang, X.; Li, M.; Ma, H.; Mao, Q. Multi-scale target intelligent detection method for coal, foreign object and early damage of conveyor belt surface under low illumination and dust fog. J. China Coal Soc. 2024, 49, 1259–1270. [Google Scholar]
- Yu, M.; Xiang, G.; Yu, J. Research on Road Damage Detection Algorithm Based on Deep Learning. J. Harbin Univ. Sci. Technol. 2025, 30, 42–49. [Google Scholar]
- Feichtenhofer, C.; Fan, H.; Malik, J.; He, K. Slowfast networks for video recognition. In 2019 IEEE/CVF International Conference on Computer Vision; IEEE: Seoul, Republic of Korea, 2019; pp. 6202–6211. [Google Scholar]
- Sun, C.; Shrivastava, A.; Singh, S.; Gupta, A. Revisiting unreasonable effectiveness of data in deep learning era. In 2017 IEEE International Conference on Computer Vision; IEEE: Venice, Italy, 2017; pp. 843–852. [Google Scholar]
- Wen, P.; Chen, J.; Xiao, Y.; Wen, Y.; Huang, W. Underwater image enhancement algorithm based on GAN and multi-level wavelet CNN. J. Zhejiang Univ. (Eng. Sci.) 2022, 56, 213–224. [Google Scholar] [CrossRef]
- Zhan, Y.; Hu, D.; Tang, H.; Lu, J.; Tan, J.; Liu, C. Image data enhancement method based on improved generative adversarial network. J. Zhejiang Univ. (Eng. Sci.) 2023, 57, 1998–2010. [Google Scholar] [CrossRef]
- Goodfellow, I.; Pouget-Abadie, J.; Mirza, M.; Xu, B.; Warde-Farley, D.; Ozair, S.; Courville, A.; Bengio, Y. Generative adversarial networks. Commun. ACM 2020, 63, 139–144. [Google Scholar] [CrossRef]
- Huo, Y.; Gan, J.; Jiang, W. Multi-exposure high dynamic range imaging based on LSGAN. Displays 2024, 83, 102707. [Google Scholar] [CrossRef]
- Shamai, G.; Slossberg, R.; Kimmel, R. Synthesizing facial photometries and corresponding geometries using generative adversarial networks. ACM Trans. Multimed. Comput. Commun. Appl. 2019, 15, 1–24. [Google Scholar] [CrossRef]
- Fu, G.; Huang, J.; Yang, T.; Zheng, S. Improved lightweight attention model based on CBAM. Comput. Eng. Appl. 2021, 57, 150–156. [Google Scholar]
- Zhu, L.; Wang, X.; Ke, Z.; Zhang, W.; Lau, R.W. Biformer: Vision transformer with bi-level routing attention. In Proceedings of the IEEE/CVF Conference on Computer Vision and Pattern Recognition; IEEE: Vancouver, BC, Canada, 2023; pp. 10323–10333. [Google Scholar]
- Wen, B.; Zhang, J.; Shen, Y.; Xu, B. Information balance network for multiscale object detection in remote sensing imagery. J. Electron. Imaging 2024, 33, 063054. [Google Scholar] [CrossRef]
- Ren, S.; Zhou, D.; He, S.; Feng, J.; Wang, X. Shunted self-attention via multi-scale token aggregation. In 2024 IEEE/CVF Conference on Computer Vision and Pattern Recognition; IEEE: Seattle, WA, USA, 2024; pp. 10853–10862. [Google Scholar]
- Ross, T.Y.; Dollár, G. Focal loss for dense object detection. In 2017 IEEE Conference on Computer Vision and Pattern Recognition; IEEE: Honolulu, HI, USA, 2017; pp. 2980–2988. [Google Scholar]
- Lei, M.; Li, S.; Wu, Y.; Hu, H.; Zhou, Y.; Zheng, X.; Ding, G.; Du, S.; Wu, Z.; Gao, Y. Yolov13: Real-time object detection with hypergraph-enhanced adaptive visual perception. arXiv 2025, arXiv:2506.17733. [Google Scholar]


Disclaimer/Publisher’s Note: The statements, opinions and data contained in all publications are solely those of the individual author(s) and contributor(s) and not of MDPI and/or the editor(s). MDPI and/or the editor(s) disclaim responsibility for any injury to people or property resulting from any ideas, methods, instructions or products referred to in the content. |
© 2026 by the authors. Licensee MDPI, Basel, Switzerland. This article is an open access article distributed under the terms and conditions of the Creative Commons Attribution (CC BY) license.