Abstract
Ozonation is widely applied for refractory wastewater treatment, but its practical engineering is often limited by poor ozone mass transfer and low ozone utilization. In this study, micro-nano bubbles (MNBs) technology was employed to improve ozone delivery, and the performance of an O3-MNBs system for treating coking reverse osmosis concentrate (ROC) was systematically compared with the conventional millimeter-sized ozone bubbles (O3-MBs) system. To further promote oxidation, hydrogen peroxide (H2O2) was introduced, forming an O3-MNBs/H2O2 system. Results showed that O3-MNBs (D50 = 36 μm) achieved a volumetric mass transfer coefficient 2.5 times higher than O3-MBs. Under optimized conditions (pH: 7–9, ozone dosage: 10 mg/(L·min), temperature: 20–30 °C), COD removal in the O3-MNBs system reached 34.9 ± 1.2%, nearly twice that of the O3-MBs system, while the O/C ratio decreased by approximately 50% (4.7 ± 0.2), indicating enhanced ozone utilization efficiency. The addition of H2O2 further increased COD removal to 52.1 ± 2.9% and reduced the O/C ratio to 2.9 ± 0.2, reflecting strong synergistic effects. Moreover, the integration of MNBs and H2O2 effectively reduced energy consumption per unit of pollutant removed. Overall, the O3-MNBs-based technology enhances organic pollutant degradation, ozone utilization and energy efficiency, offering a promising strategy for high-salinity refractory wastewater treatment.
1. Introduction
The rapid expansion of the coking industry has led to the generation of massive volumes of wastewater, posing a critical environmental challenge [1,2,3]. Reverse osmosis (RO) technology is widely utilized for coking wastewater treatment due to its excellent desalination efficiency and robust purification capability [4,5]; however, it inevitably produces reverse osmosis concentrate (ROC), which is characterized by high salinity and high concentrations of refractory organic compounds [6]. The accumulation of these organics severely hinders the downstream evaporation–crystallization process, causing fouling, corrosion, and the deterioration of salt quality, and thus necessitates effective pretreatment strategies of ROC [7,8]. Advanced oxidation processes (AOPs) have been widely applied for the treatment of ROC due to their high efficiency in degrading recalcitrant organic pollutants. Among these technologies, the Fenton process enables efficient removal of refractory organics via in situ generation of hydroxyl radicals; however, its practical application is hindered by intrinsic limitations, including a narrow effective pH range, extensive iron sludge production, and high reagent consumption [6]. The electrochemical oxidation process exhibits strong oxidation capability and rapid reaction kinetics, but its large-scale implementation remains restricted by the high cost of electrode materials and intensive energy input [9]. Thus, the development of cost-effective and environmentally sustainable alternatives for ROC treatment is urgently required.
Ozonation and its coupled processes have been extensively investigated for the treatment of refractory wastewater, attributed to their high oxidation capacity, minimal sludge production, and excellent engineering adaptability [10,11,12]. Owing to the limitations of its selective oxidation, ozone is often combined with other technologies to enhance treatment efficiency. O3/H2O2 is a widely used combined process, in which H2O2 promotes ozone decomposition to generate ·OH, thereby significantly improving the mineralization of refractory organic matter. Meanwhile, H2O2 decomposes into only water and oxygen without introducing secondary impurities, demonstrating excellent environmental compatibility and considerable application potential in water treatment [13]. However, conventional ozonation processes typically employ gas diffusers to generate millimeter-sized bubbles, resulting in limited ozone mass transfer coefficients (0.044–0.109 min−1) and low ozone utilization efficiencies (40–60%) [14,15,16,17]. Zhang et al. [18] reported a volumetric mass transfer coefficient (kLa) of only 0.0044 min−1 for traditional large bubbles in 10 L of deionized water at an ozone concentration of 12.5 mg/L, and further observed an ozone utilization efficiency of merely 59.3% when treating 10 L of synthetic dye wastewater under identical conditions. Wang et al. [19] documented an ozone utilization efficiency of only 49% in an O3 bubble column treating 2 L of landfill leachate, with an ozone concentration of 48 mg/L and a gas flow rate of 300 mL/min. These intrinsic limitations significantly restrict the oxidation efficiency of ozone-based processes, particularly in high-salinity wastewater (e.g., coking ROC), where ozone solubility is further suppressed, and radical scavenging is intensified [20]. Hence, developing innovative ozone supply strategies to overcome mass transfer limitations is of critical importance.
Bubble size plays a decisive role in gas–liquid mass transfer efficiency [21]. Compared with traditional millimeter-sized bubbles, micro-nano bubbles (MNBs) exhibit a larger specific surface area, lower rising velocity, and enhanced interfacial adsorption capacity, resulting in enhanced gas–liquid mass transfer [22,23,24]. Additionally, the collapse of MNBs can generate hydroxyl radicals (·OH), thereby facilitating the degradation of refractory organic compounds [25]. Currently, MNB technology has been successfully integrated into the ozonation process (referred to as O3-MNBs) and has shown superior performance in organic pollutants removal [26]. However, existing research has largely focused on model pollutants (e.g., aromatic hydrocarbons, methylene blue dye, and tetracycline) in synthetic wastewater [27,28,29], while systematic investigations into the performance of O3-MNBs in treating actual complex, highly saline industrial wastewater (e.g., coking ROC) remain limited.
To bridge these knowledge gaps, this study systematically investigates the application of O3-MNBs for coking ROC treatment. Specifically, the work aims to: (1) elucidate the physicochemical characteristics of MNBs and compare them with conventional millimeter-sized bubbles; (2) optimize critical operational parameters (including initial pH, ozone dosage, and reaction temperature) for the O3-MNBs process, and explore the synergistic O3-MNBs/H2O2 system by optimizing H2O2 dosing to enhance the removal of refractory organics; and (3) comprehensively evaluate the pollutant removal performance and energy consumption of the O3-MNBs and the O3-MNBs/H2O2 systems for coking ROC under optimized conditions, in comparison with the conventional millimeter-sized ozone bubbles (O3-MBs) system. The findings of this study aim to provide both mechanistic insights and practical guidance for the engineering application of MNB-enhanced ozone oxidation in the treatment of complex industrial wastewater.
2. Materials and Methods
2.1. Wastewater Quality and Reactor Operation
The coking ROC used in this study was obtained from a coking plant located in Handan City, Hebei Province, China. The detailed physicochemical characteristics of the ROC are provided in Table 1. Coking ROC samples were stored in a refrigerator at 2 °C immediately after collection, and all experiments were conducted promptly to minimize changes in water quality. All experiments were performed using the same batch of ROC to ensure data comparability and eliminate batch-to-batch variation. Prior to each experiment, all water samples were filtered through filter paper to remove large suspended solids, thereby preventing potential damage to subsequent analytical instruments.

Table 1.
Basic water quality data of the coking ROC.
In this study, two oxidation systems—an O3-MNBs system and an O3-MBs system—were employed for comparative analysis (Figure 1). During operation, 2 L of coking ROC was pumped into a cylindrical reactor (inner diameter: 8 cm; height: 50 cm; volume: 2.5 L). High-purity oxygen (99.99%) was supplied to an ozone generator (MLS-A-103G, Mailang, Guangzhou, China) at a flow rate of 0.2 L/min, where ozone was generated by high-voltage discharge. The concentration of generated ozone was continuously monitored using an online gas-phase ozone analyzer (3S-J5000, Tonglin, Beijing, China). For the O3-MNBs system, the ozone gas was introduced into an MNB generator (ZJC-NM-200L, Zhongjing, Shanghai, China) and completely dissolved in coking ROC under pressurized conditions (0.4 MPa). When the pressurized gas–liquid mixture was released into the reactor, the abrupt pressure drop induced the generation of massive micro- and nanometer-scale bubbles (Figure 1c). For the O3-MNBs/H2O2 system, a predetermined amount of H2O2 was added to the reactor in one batch simultaneously with the initiation of the O3-MNBs system, at dosages of 400, 600, 800, and 1000 mg/L, respectively. This moment was recorded as the starting time of the reaction (0 min). In contrast, for the O3-MBs system, ozone gas was directly introduced into the reactor via a titanium alloy aerator, forming millimeter-sized bubbles (Figure 1c). An ozone tail gas destruction unit (F800-L, Tonglin, Beijing, China) was installed to prevent ozone leakage into the atmosphere.
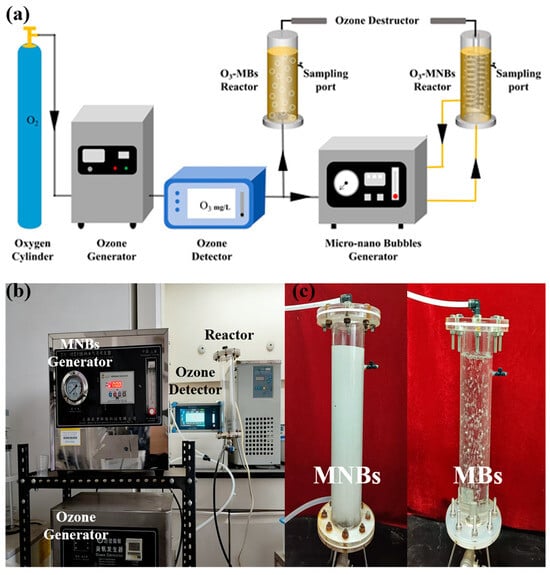
Figure 1.
Schematic diagram and photographs of the experimental apparatus: (a) Schematic of the ozonation experimental setup; (b) Photograph of the actual apparatus; (c) Comparison of bubble morphologies during operation.
The reaction temperature (10–40 °C) was maintained using a thermostat water bath (LC-WB-4, Lichen, Changzhou, China) and a cooling circulator (DHC-30-B, Qiwei, Hangzhou, China) to ensure thermal stability during oxidation. All experiments involved in this study were conducted in triplicate to ensure data reliability and experimental reproducibility.
2.2. Characterization of MNBs
2.2.1. Determination of Particle Size Distribution of MNBs
To determine the bubble size distribution in the O3-MNBs system, 2 L of deionized water was added to the reactor, and the gas supply conditions were kept identical to those described in Section 2.1. After 20 min of continuous operation, the size distributions of microbubbles and nanobubbles were analyzed using a laser particle size analyzer (Mastersizer 2000, Malvern) and a nano-particle size analyzer (ZS90, Malvern), respectively [30,31].
2.2.2. Ozone Mass Transfer in O3-MNBs and O3-MBs Systems
The ozone mass transfer coefficient was computed based on variations in liquid-phase ozone concentration during the ozone aeration process. The experiments were conducted with 2 L of deionized water maintained at 20 ± 1 °C within the two reactors in Figure 1. Ozone aeration was conducted with a gas-phase ozone concentration of 50 mg/L and a gas flow rate of 0.2 L/min. During the experiment, water samples were collected at 3 min intervals. The collected samples were allowed to stand until the MNBs ruptured completely, after which the dissolved ozone concentration was measured using a liquid-phase ozone analyzer. When a nearly constant liquid-phase ozone concentration was yielded, i.e., the liquid-phase ozone was considered saturated, aeration was then stopped, and the ozone self-decomposition phase was initiated. The following formula was used to determine the volumetric mass transfer coefficient (kLa) and the self-decomposition rate constant (kd) in water [18,32].
The ozone self-decomposition in deionized water follows first-order kinetics, as illustrated by Equation (1). In the semi-continuous flow experiment, the mass balance of ozone in the liquid phase can be decreased by Equation (2):
where C represents the liquid-phase ozone concentration at time t; C* denotes the equilibrium ozone concentration at the gas–liquid interface; kLa is the volumetric mass transfer coefficient, calculated as the product of the liquid film mass transfer coefficient (kL) and the gas–liquid surface area (a); r is the ozone self-decomposition rate; kd is the ozone self-decomposition rate constant in water.
When dissolved ozone reaches equilibrium, C = Cs and dC/dt = 0. Substituting this equilibrium condition into the simultaneous Equations (1) and (2), Equations (3)–(5) can be derived:
where Cs represents the saturated liquid-phase ozone concentration at steady state during the ozone mass transfer process.
Based on experimental data of dissolved ozone concentration (C) versus time (t), a linear fit is performed on the relationship between ln[Cs/(Cs − C)] and t. The slope of the resulting fitted line is equal to (kLa + kd). The value of the volumetric mass transfer coefficient kLa can be obtained by subtracting the first-order kinetic rate constant kd for ozone self-decomposition from this slope.
2.2.3. Hydroxyl Radical Quenching Test
This experiment was conducted in accordance with the method described in Section 2.2.2. After the O3-MNBs system stopped aeration and entered the ozone self-decomposition stage, 100 mM tert-butanol (TBA) was added to the water to ensure that OH was completely quenched [33]. Subsequently, the temporal variation in dissolved ozone concentration was measured using a portable ozone analyzer following the method specified in Section 2.2.2.
2.2.4. Electron Paramagnetic Resonance Analysis
Electron paramagnetic resonance (EPR) spectroscopy was employed to detect ·OH in the ozonation systems, using DMPO (100 mM) as the spin-trapping agent [34]. Samples were collected after 20 min of operation under the following conditions: gaseous ozone concentration of 50 mg/L, gas flow rate of 0.2 L/min, and 2 L of deionized water. The reaction solution was immediately mixed with DMPO and subjected to EPR measurement. The relative generation of ·OH in O3-MNBs and O3-MBs systems was evaluated by comparing the characteristic 1:2:2:1 quartet signal intensities of the DMPO-OH adducts.
2.3. Analytical Methods of Wastewater Quality and Ozone Concentration
The UV254 absorbance of wastewater was measured using a UV-visible spectrophotometer (UV-2550, Shimadzu, UVProbe 2.33). The total organic carbon (TOC) of wastewater was measured using a TOC analyzer (TOC-L, Shimadzu, TOC-Control L). The chemical oxygen demand (COD) was determined by adding an appropriate volume of wastewater to COD digestion reagent vials (HACH), followed by digestion using a COD premade reagent, followed by digestion using a COD digester instrument (DRB200, HACH), and subsequent measurement with an analyzer (DR2800, HACH).
The gas-phase ozone concentration was measured using a gas-phase ozone analyzer (3S-J5000, Beijing Tonglin), and the liquid-phase ozone concentration was determined with a portable ozone analyzer (LH-D01F, Luheng).
2.4. Fluorescence Analysis of Dissolved Organic Matter
The removal performance of dissolved organic matter (DOM) in coking ROC was evaluated using three-dimensional excitation-emission matrix (3D-EEM) fluorescence spectroscopy (FLS1000, Edinburgh Instruments Ltd., Fluoracle®.) [35]. The analyzed samples included the raw coking ROC, the effluent after O3-MNBs treatment, and the effluent after O3-MBs treatment. The EEM spectra were recorded with an excitation wavelength (Ex) of 240–450 nm and an emission wavelength (Em) of 280–600 nm. The obtained fluorescence landscape was divided into five regions (Regions I–V), corresponding to tyrosine-like, tryptophan-like, fulvic acid-like, soluble microbial by-product-like, and humic acid-like substances, respectively (Table 2).
Table 2.
Fluorescent region delineation.
For semi-quantitative analysis of DOM content in each region, the fluorescence regional integration (FRI) method was applied [36]. This method involves volumetric integration of fluorescence intensity within each region to quantify the relative content of DOM components.
2.5. Calculation of Energy Consumption
The calculation formula for energy consumption per ton of treated water is as follows:
where E represents the energy consumption per ton of water (kW·h/m3); V is the volume of the water sample (m3); t is the reaction time (h); Pi denotes the power consumption of each component in the system, where the costs of O2 and H2O2 are converted into power terms (kW), specifically including PO2, PO3, PMNBs and PH2O2. The specific calculation formulas for each power term are given in Equation (7); MO3 is the mass of ozone dosed (kg); ki is the corresponding empirical coefficient for converting ozone dosage into power (kW/kg), where kO2 = 0.84, kO3 = 7.5, kMNBs = 7.1, and kH2O2 = 0.59 [37].
3. Results and Discussion
3.1. MNBs Characteristics and Ozone Mass Transfer
In ozone-based wastewater treatment, the efficiency of gas–liquid mass transfer is a critical determinant of overall process performance and is strongly influenced by ozone bubble size [38]. This study characterized the size distribution of bubbles generated by an MNB generator, compared the ozone transfer performance between the O3-MNBs system and a conventional O3-MBs system, and investigated the effect of temperature on ozone solubility.
3.1.1. Particle Size Distribution of MNBs
The size distribution of nano- and micro-bubbles in the O3-MNBs system was measured in deionized water. The bubble population was predominantly in the micrometer size range (20–60 μm), with a median diameter (D50) of 36 μm (Figure 2a). In addition, nano-bubbles were also detected, mainly concentrated within the 300–400 nm range, exhibiting a D50 of 311 nm (Figure 2b). The measured size distribution conforms to the ISO 20480-1:2017 international standard for MNBs (i.e., ˂100 μm) and aligns with the typical size range (100 nm–100 μm) reported in the literature [39,40,41]. These results confirm the successful generation of compliant MNBs, thereby ensuring reliable conditions for subsequent ozone mass transfer and oxidation tests.
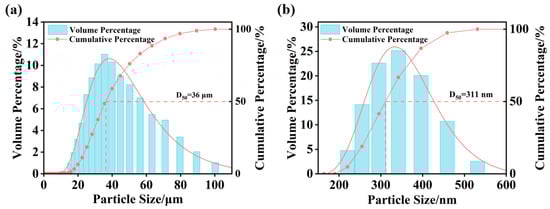
Figure 2.
Particle size distribution: (a) Micrometer-scale particle size distribution and (b) Nanometer-scale particle size distribution.
3.1.2. Enhanced Ozone Mass Transfer by MNBs
The dissolution dynamics of ozone were compared between the O3-MNBs and O3-MBs systems during aeration (Figure 3). The saturated dissolved ozone concentration (Cs) in the O3-MNBs system was 7.85 mg/L, which was 1.4-fold higher than that in the O3-MBs system (5.55 mg/L) (Figure 3a). Moreover, the dissolved ozone reached equilibrium within 24 min in the O3-MNBs system, significantly faster than the 33 min required for the O3-MBs system (Figure 3a). The concurrent increase in both saturation concentration and equilibration rate underscores the superior mass transfer performance of the O3-MNBs systems. The mass transfer kinetics were further quantified by plotting ln[Cs/(Cs − C)] and ln(Cs/C) against time (Figure 3b,c). Both relationships exhibited strong linearity (R2 ˃ 0.9), and the slopes of these fitted lines correspond to (kLa + kd) and kd, respectively (where kLa is the volumetric mass transfer coefficient and kd is the self-decomposition rate constant of ozone). Based on Equation (5), the kLa value of the O3-MNBs system was calculated to be 0.206 min−1, which is 2.5 times greater than that of the O3-MBs system (0.081 min−1) (Figure 3b,c and Table 3). This remarkable enhancement in kLa quantitatively confirms the superior mass transfer capability of the MNB system, directly explaining the observed improvements in saturation concentration and equilibration kinetics (Figure 3a). These results are consistent with Hu et al. [42], who reported that the kLa of O3-MNBs (0.366 min−1) was 1.74 times higher than that of conventional bubbles (0.210 min−1). The enhancement can be primarily ascribed to the fundamental properties of MNBs, including their large specific surface area for gas exchange and prolonged residence time in the aqueous phase, both of which synergistically promote ozone dissolution [41].
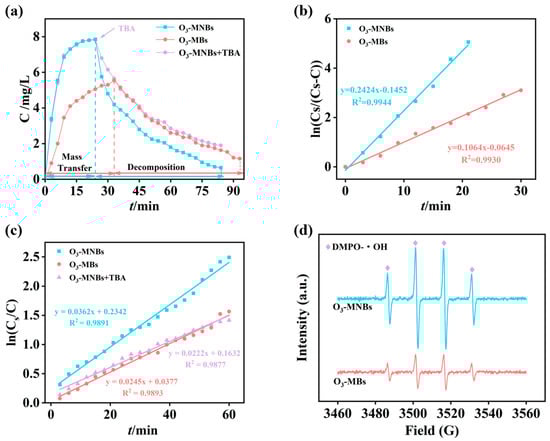
Figure 3.
First-order kinetics of ozone mass transfer and self-decomposition: (a) Temporal variation in liquid-phase ozone concentration; (b) Linear fitting of ln[Cs/(Cs − C)] versus time; (c) Linear fitting of ln(Cs/C) versus time; and (d) EPR of O3-MNBs and O3-MBs.
Table 3.
Kinetic equations for mass transfer and decomposition of ozone.
Following the cessation of aeration, the dissolved ozone concentration in both systems gradually declined due to self-decomposition, and the O3-MNBs system exhibited a more rapid decay rate (Figure 3a), which is consistent with the findings of Yang et al. [43]. This accelerated decay can be attributed to the ·OH generated during the rupture of MNBs, which accelerates the chain reaction of ozone and thus significantly speeds up the decomposition process, leading to a rapid decrease in dissolved ozone concentration. The relevant reaction equations are listed below [44]: O3 + ·OH → HO2· + O2; HO2· + OH− → ·O2− + H2O; ·O2− + O3 → ·O3− + O2; ·O3− + H2O → ·OH + O2 + OH−.
The addition of tert-butanol at the ozone decomposition stage of the O3-MNBs system resulted in a significant reduction in the decreasing rate of liquid-phase ozone concentration, and the relevant experimental results are illustrated in Figure 3a. As TBA acts as an OH scavenger, this phenomenon further confirms that MNBs generate ·OH during their collapse, and these ·OH in turn accelerate the decomposition reaction of ozone. The calculated kd value for the O3-MNBs system was 0.036 min−1, higher than that of the O3-MBs system (0.025 min−1) and the O3-MNBs + TBA system (0.022 min−1) (Figure 3c and Table 3), providing quantitative evidence for this radical-induced decay pathway. Furthermore, comparative EPR analysis of the two systems revealed a more pronounced ·OH signal for O3-MNBs than for O3-MBs under identical conditions, further confirming that micro-nano bubbles are more effective than conventional microbubbles in promoting ·OH generation (Figure 3d). While this phenomenon shortens the lifetime of dissolved ozone, it simultaneously signifies a more reactive environment conducive to the advanced oxidation of refractory organic pollutants, highlighting a dual role of MNBs in enhancing both mass transfer and chemical oxidation intensity [45].
3.2. Optimization of Operation Parameters
The degradation efficiency of organic pollutants by ozonation is highly dependent on operational parameters (e.g., initial pH, ozone dosage, reaction temperature, and H2O2 dosage), as these parameters directly regulate ozone solubility, free radicals generation, and reaction kinetics [46]. To identify optimal conditions that maximize treatment performance, the effects of these critical parameters on system performance were systematically evaluated.
3.2.1. Optimization of Initial pH
The influence of initial pH on the oxidation performance of the O3-MNBs system was investigated at pH values of 3, 5, 7, 8, 9, and 11, while maintaining a wastewater temperature of 20 ± 1 °C and an ozone dose of 10 mg/(L·min). After a 240 min reaction, the COD removal efficiencies were 19.4 ± 2.0%, 27.5 ± 2.1%, 33.9 ± 1.3%, 35.1 ± 1.5%, 36.0 ± 1.4%, and 22.9 ± 1.3% at respective pH values (Figure 4a). A similar trend was observed for UV254 removal, with efficiencies of 26.3 ± 1.8%, 43.4 ± 2.0%, 46.8 ± 1.1%, 52.2 ± 1.6%, 57.3 ± 1.8%, and 40.6 ± 0.8%, respectively (Figure 4a).
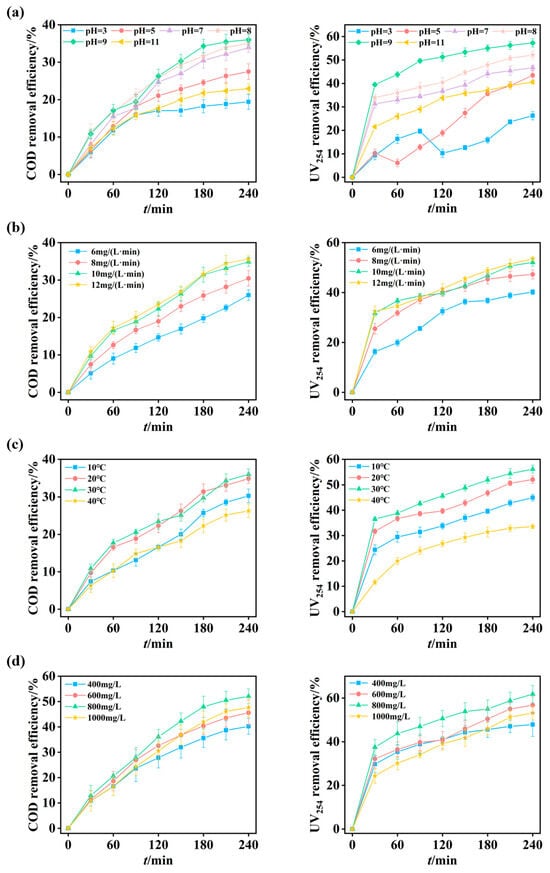
Figure 4.
Optimization of operational parameters for O3-MNBs process: (a) Effect of initial pH on COD and UV254 removal efficiencies; (b) Effect of ozone dosage on COD and UV254 removal efficiencies; (c) Effect of temperature on COD and UV254 removal efficiencies; and (d) Effect of H2O2 dosage on COD and UV254 removal efficiencies.
The relatively low removal efficiencies of COD and UV254 under acidic conditions (e.g., pH = 3) are attributed to limited chain reactions of ozone. Under such environments, oxidation is dominated by the direct reaction of molecular ozone, which is highly selective and thus removes only a limited fraction of organic matter [47]. The fluctuation in UV254 removal efficiency observed at pH 3 and 5 possibly results from the dominance of direct ozone oxidation, a pathway characterized by high selectivity and sluggish kinetics. This leads to transient accumulation of unsaturated conjugated intermediates from ring cleavage, whose slow mineralization temporarily perturbs UV254 removal efficiency [48]. As the pH increased from 3 to 9, the COD removal efficiency increased from 19.4 ± 2.0% to 36.0 ± 1.4% (Figure 4a). Neutral to mildly alkaline conditions (pH = 7–9) promote ozone chain reactions, effectively enhancing the generation of ·OH radicals and consequently improving the oxidation capability of the O3-MNBs system [49]. This observed phenomenon is consistent with Shen et al. [29], who reported increased degradation of aromatic hydrocarbons by O3-MNBs as pH increased from 5 to 9. However, when the pH was further increased to 11 in this study, the COD removal efficiency decreased to 22.9 ± 1.3% (Figure 4a). At excessively high OH− concentrations, a significant proportion of ·OH radicals undergo self-quenching reactions (e.g., ·OH + HO2· → H2O + O2), which reduces the effective radical concentration and impedes pollutant degradation [26,50]. Therefore, the optimal pH range for organic carbon removal from coking ROC was identified as 7–9, which aligns well with the typical pH range of actual coking ROC (7.7–8.3; Table 1).
3.2.2. Optimization of Ozone Dosage
Ozone dosage is a critical operational parameter in oxidation systems. Excessive dosages result in ozone wastage and increased operational costs, whereas insufficient dosages fail to provide enough oxidants, leading to incomplete pollutant degradation [51]. Therefore, precise control of ozone dosage is essential for achieving optimal oxidation efficiency. In this study, four ozone dosages—6, 8, 10, and 12 mg/(L·min)—were tested by adjusting the gas-phase ozone concentration to 60, 80, 100, and 120 mg/L, respectively, while maintaining a constant ozone gas flow rate of 0.2 L/min. All experiments were performed at the original pH of the coking ROC (7.7–8.3) and a controlled temperature of 20 ± 1 °C.
After 240 min of reaction, the COD removal efficiencies were 26.0 ± 1.4%, 30.5 ± 2.1%, 34.9 ± 1.2%, and 35.6 ± 0.9% for ozone dosages of 6, 8, 10, and 12 mg/(L·min), respectively (Figure 4b). Correspondingly, UV254 removal efficiencies were 40.2 ± 1.0%, 47.3 ± 1.8%, 52.1 ± 1.5%, and 53.5 ± 0.7%, respectively (Figure 4b). These results demonstrate a positive correlation between ozone dosage and pollutant removal efficiency within the range of 6–10 mg/(L·min). However, a plateau was observed when the ozone dosage was increased from 10 to 12 mg/(L·min), where the enhancement in COD and UV254 removal was only 0.7% and 1.4%, respectively (Figure 4b). Considering the associated increase in operational costs, the optimal zone dosage was determined to be 10 mg/(L·min).
The enhancement in organic compound removal with increasing dosage from 6 to 10 mg/(L·min) occurs as a higher ozone input per unit time increases the availability of oxidants in the reactor, thereby facilitating more extensive oxidation and decomposition [52]. Once the dosage exceeds 10 mg/(L·min), the reaction kinetics are no longer limited by the availability of ozone; instead, the process becomes constrained by the intrinsic recalcitrance of the remaining organic compounds and the inherent selectivity of ozonation reactions. Consequently, further increasing the ozone dosage yields negligible improvements in treatment performance.
3.2.3. Optimization of Operation Temperature
The influence of reaction temperature on the oxidation performance of the O3-MNBs system was investigated at 10, 20, 30, and 40 °C, under an ozone dosage of 10 mg/(L·min) and the original pH of the ROC (7.7–8.3). As shown in Figure 4c, the COD removal efficiencies were 30.3 ± 1.8%, 34.9 ± 1.2%, 36.6 ± 1.4%, and 26.3 ± 1.8%, respectively. The corresponding UV254 removal efficiencies were 45.0 ± 1.3%, 52.1 ± 1.5%, 56.1 ± 1.6%, and 33.6 ± 0.8%, respectively (Figure 4c). Both COD and UV254 removal efficiencies increased steadily as the temperature rose from 10 °C to 30 °C, but exhibited a sharp decline at 40 °C. This result suggests that moderate temperature elevation (e.g., 20–30 °C) is beneficial for oxidation efficiency, whereas excessively high temperature (e.g., 40 °C in this study) adversely affects the process.
The non-monotonic trend can be explained by the competition between two opposing mechanisms (Text S1). On the one hand, as shown in Figure S1, higher temperatures significantly reduce the saturation concentration of dissolved ozone, which limits the oxidant availability in the aqueous phase and negatively impacts oxidation performance [53]. On the other hand, Figure S2 shows that kLa of ozone in water increases, while higher temperatures accelerate the molecular thermal motion and increase the collision frequency between oxidants and refractory organics, thereby enhancing reaction rate constants and promoting oxidation kinetics [54]. The observed optimum temperature ranges of 20–30 °C represent a balance where the benefits of enhanced reaction kinetics outweigh the penalties imposed by reduced ozone solubility. This finding indicates the importance of temperature control to maximize the efficiency of the O3-MNB process in practical applications.
3.2.4. Optimization of H2O2 Dosage
This study constructed a synergistic O3-MNBs/H2O2 system with H2O2 to further enhance the removal efficiencies of COD and UV254 and utilized the reaction between H2O2 and ozone to facilitate the generation of ·OH. This study systematically investigated the effect of H2O2 dosage on the treatment performance of the O3-MNBs system under the conditions of 20 °C, an ozone dosage rate of 10 mg/(L·min), and a raw water pH ranging from 7.7 to 8.3. The experiments set the gradient H2O2 dosages at 400, 600, 800, and 1000 mg/L, respectively. Figure 4d shows that the corresponding COD removal efficiencies were 40.2 ± 3.1%, 45.6 ± 5.1%, 52.1 ± 2.9%, and 47.7 ± 3.8%, with the UV254 removal efficiency measured at 47.9 ± 5.4%, 56.7 ± 3.8%, 61.8 ± 4.0%, and 53.2 ± 3.2% (Figure 4d).
Both the COD and UV254 removal efficiencies exhibited a trend of first increasing and then decreasing with the rise in H2O2 dosage, reaching the maximum at the dosage of 800 mg/L; a further increase in H2O2 dosage subsequently led to a decline in the removal efficiencies. These results indicate that the addition of an appropriate amount of H2O2 can effectively improve the oxidation efficiency of the system, while excessive dosage exerts an inhibitory effect on the treatment performance. The underlying mechanism may lie in the fact that H2O2 can promote ozone decomposition and ·OH generation (2O3 + H2O2 → 2·OH + 3O2), thus enhancing the oxidative capacity of the system. Excessive H2O2 dosage, however, not only accelerates ozone consumption but also may cause the excessive accumulation and self-quenching of ·OH, which ultimately results in the reduction in oxidative performance.
3.3. Comparative Evaluation of Treatment Performance and Energy Efficiency
To quantitatively evaluate the enhancement in coking ROC treatment achieved by MNB technology, a comparative experiment between the O3-MNBs and O3-MBs systems was conducted under the optimal operational conditions established in Section 3.2. In addition, H2O2 was introduced to the O3-MNBs system to further enhance organic pollutant removal through a synergistic advanced oxidation process. The results indicate that integrating MNB technology into the ozonation process offers dual benefits of enhanced treatment efficiency and reduced operational costs, and the O3-MNBs/H2O2 process achieved satisfactory removal of refractory organics.
3.3.1. Organic Pollutant Removal and Ozone Utilization
Generally, the organic removal efficiency and the O/C ratio are key metrics for evaluating the ozonation process [55]. As shown in Figure 5a and Figure S5, the O3-MNBs system consistently achieved higher COD and TOC removal efficiencies than the O3-MBs system during the 240 min reaction period. At the end of the reaction, the COD and TOC removal efficiencies in the O3-MNBs system were 34.9 ± 1.2% and 45.7 ± 3.3%, respectively, which were approximately twice those obtained in the O3-MBs system (17.1 ±1.6% and 22.2 ± 4.6%) (Figure 5a), attributed to reduced bubble size in the O3-MNBs system can significantly improve the ozone mass transfer coefficient in water, thereby accelerating the reaction rate between ozone and organic pollutants and enhancing the oxidative capacity (Figure 3). Ozonation exhibits selectivity in organic matter degradation, thus its pollutant removal efficiency is often limited in actual wastewater treatment. To further enhance organic matter removal, H2O2 was coupled with the O3-MNBs system in this study and added to the system at an optimal dosage of 800 mg/L (Figure 4d). After H2O2 addition, the COD and TOC removal efficiencies increased to 52.1 ± 2.9% and 58.6 ± 0.9%, respectively, indicating that H2O2 further strengthens the oxidative performance of the O3-MNBs system and promotes the degradation of refractory organics pollutants (Figure 5a and Figure S5).
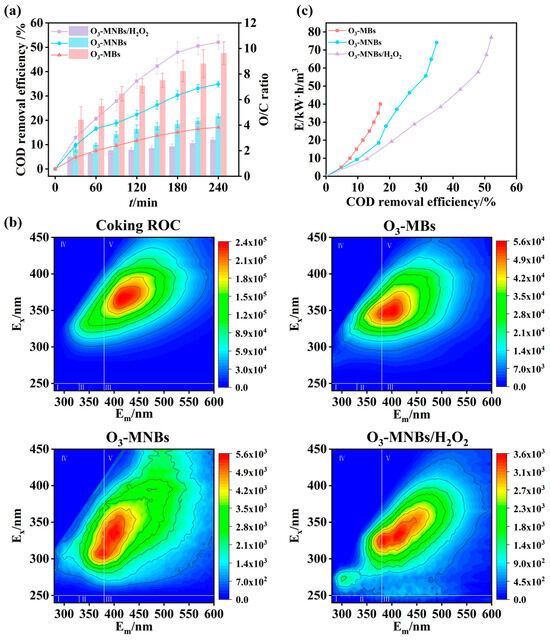
Figure 5.
Comparative performance of O3-MBs, O3-MNBs, and O3-MNBs/H2O2 processes: (a) Comparison of COD removal efficiency and O/C ratio; (b) 3D-EEM spectra of coking ROC before and after treatment; and (c) Comparison of energy consumption.
As shown in Table 4, a comparison with literature data for the ROC of comparable electrical conductivity and total dissolved solids (TDS) reveals that the COD removal efficiency of the O3-MNBs system aligns with previously reported levels. In contrast, the O3-MNBs/H2O2 system attained significantly higher removal efficiency, surpassing most analogous studies. Among them, the O3-MNBs-Co2Cu1/CM system achieved superior treatment performance, as the metal-catalyzed ozonation process generates multiple reactive radicals (e.g., ·OH and 1O2) for stronger oxidation, with the abundant active sites on the catalyst surface further enhancing efficiency by increasing pollutant–radical contact [56]. However, metal catalysts generally suffer from drawbacks such as high preparation cost, and most high-performance metal catalysts remain at the laboratory research stage [57]. In comparison, the reagents employed in the O3-MNBs/H2O2 system are simple and easily available, demonstrating greater potential for practical engineering applications. Notably, when benchmarked against the O3/H2O2 process reported by Yuan et al. [58], the O3-MNBs/H2O2 system exhibited superior COD removal performance even under more challenging conditions—namely, with coking ROC possessing markedly higher salinity and COD concentration. These comparisons underscore that microbubble technology not only intensifies oxidation efficiency but also bolsters the resilience of advanced oxidation processes (AOPs) toward complex water matrices, including those with elevated salinity and organic loads (Table 4).
Table 4.
The comparison between this study and previous studies.
The organic removal performance was further confirmed by 3D-EEM. As shown in Figure 5b, the coking ROC mainly contained two types of fluorescent DOM, i.e., soluble microbial by-product-like substances (Region IV) and humic acid-like substances (Region V). According to FRI analysis, these components initially accounted for 27.9% and 71.9% of the total fluorescent DOM, respectively (Figure S3). After treatment, the fluorescence intensities of both regions decreased substantially, with the most pronounced reductions observed in the O3-MNBs/H2O2 system (Figure 5b and Figure S4). Specifically, in the O3-MBs system, the integrated fluorescence volume of Region IV decreased from 4.2 × 10⁸ AU·nm2 to 1.3 × 10⁸ AU·nm2, and Region V decreased from 2.4 × 10⁹ AU·nm2 to 5.1 × 10⁸ AU·nm2 (Figure S4). In contrast, the O3-MNBs system achieved more substantial reductions, with Region IV decreasing to 1.8 × 10⁷ AU·nm2 and Region V to 8.3 × 10⁷ AU·nm2 (Figure S4). With the addition of H2O2, fluorescence intensities further decreased to 5.7 × 10⁶ AU·nm2 and 3.1 × 10⁷ AU·nm2, demonstrating the superior degradation of refractory DOM (Figure S4). These results were consistent with the COD and TOC removal performance.
Furthermore, the O3-MNBs system exhibited an O/C ratio of 4.7 ± 0.2, which was approximately 50% lower than that of the O3-MBs system (9.6 ± 0.9) (Figure 5a). In the O3-MNBs/H2O2 system, the O/C ratio further decreased to 2.9 ± 0.2 (Figure 5a). A lower O/C ratio signifies that a smaller ozone dosage is required to remove per unit mass of COD, indirectly reflecting superior ozone utilization efficiency [55]. This phenomenon demonstrates that a larger fraction of the supplied ozone is effectively transferred into the liquid phase and participates in organic pollutant degradation via both direct molecular ozone oxidation and indirect hydroxyl-radical-mediated pathways. In comparison, ozone loss via bubble escape is significantly reduced. Therefore, the decreased O/C ratio reflects enhanced ozone mass transfer efficiency and improved utilization efficiency within the system, which is responsible for the superior performance of the oxidation process.
3.3.2. Energy Consumption
In addition to COD removal efficiency, energy consumption is a key indicator for evaluating the practical feasibility and engineering prospects of applying MNB technology to the ozone oxidation process. To further define the applicable scope of MNBs in practical engineering applications, the energy consumption of the three systems under optimal operating conditions was calculated using Equations (6) and (7).
Energy consumption of the three systems was calculated and analyzed to derive the correlation curve for COD removal efficiency, and energy consumption per ton of water was plotted, with the results shown in Figure 5c. Under the condition of achieving the same COD removal efficiency, the O3-MNBs/H2O2 system has the lowest energy consumption, while the O3-MBs system has the highest. Notably, the energy consumption per ton of water of the O3-MNBs system is significantly lower than that of the O3-MBs system, which demonstrates that the MNB technology can not only enhance oxidation capacity and improve pollutant removal efficiency but also effectively reduce the energy consumption in the wastewater treatment process. In addition, the introduction of H2O2 into the system can further elevate the COD removal efficiency, thereby leading to a substantial decrease in the energy consumption required for removing per unit COD. Specifically, when the COD removal efficiency reaches 17.1 ± 1.6%, the energy consumption per ton of water of the O3-MBs system is 40.0 kW·h/m3; in contrast, the O3-MNBs system can achieve an 18.9 ± 1.2% COD removal efficiency with an energy consumption per ton of water of 27.8 kW·h/m3; while the O3-MNBs/H2O2 system only needs an energy consumption per ton of water of 19.2 kW·h/m3 to attain a 20.6 ± 0.9% COD removal efficiency (Figure 5c). With the continuous increase in COD removal efficiency, the energy consumption advantage of the O3-MNBs/H2O2 system becomes more pronounced, which fully reflects its favorable potential for engineering applications.
4. Conclusions
This study systematically investigated the performance of an O3-MNBs system for the treatment of coking ROC and highlighted its advantages over the conventional O3-MBs system. The smaller bubble size (D50 = 36 μm) in the O3-MNBs system greatly enhanced gas–liquid mass transfer, yielding a 2.5-fold increase in the kLa compared to the millimeter-scale O3-MBs. Optimal operating conditions for the O3-MNBs system were identified as an initial pH of 7–9, ozone dosage of 10 mg/(L·min), and temperature of 20–30 °C. Under these conditions, the COD removal efficiency of the O3-MNBs system reached 34.9 ± 1.2%, which was nearly double that achieved by the O3-MBs system. Moreover, supplementing with H2O2 (800 mg/L) further improved COD removal efficiency to 52.1 ± 2.9%. Both TOC and 3D-EEM analyses confirmed the enhanced degradation of organic compounds by the O3-MNBs/H2O2 system, while O3-MNBs alone also exhibited better performance than the conventional O3-MBs. The O/C ratio decreased from 9.6 ± 0.9 in the O3-MBs system to 4.7 ± 0.2 in the O3-MNBs system and further declined to 2.9 ± 0.2 with H2O2 addition, indicating markedly improved ozone utilization efficiency owing to the MNB technology and the synergistic effect of H2O2. Additionally, the MNB approach significantly reduced energy consumption, and the introduction of H2O2 contributed to a further decrease in energy demand. Thus, the O3-MNBs system, especially when combined with H2O2, offers a more efficient and energy-saving alternative for the enhanced treatment of coking ROC.
Supplementary Materials
The following supporting information can be downloaded at: https://www.mdpi.com/article/10.3390/pr14060921/s1, Text S1. Effect of temperature on ozone solubility. Figure S1: Variation in liquid-phase ozone saturation concentration with time at different temperatures; Figure S2: Effect of temperature on the kLa of ozone; Figure S3: Proportional distribution of fluorescence integral volumes in different Regions obtained via regional fluorescence integration; Figure S4: Fluorescence integral area in Regions IV and V for coking ROC before and after treatments; Figure S5: Comparison of TOC removal efficiency. Ref. [60] is cited in Supplementary Materials.
Author Contributions
Data curation and Writing—Original draft, Z.G.; Conceptualization, Methodology and Funding acquisition, L.W.; Supervision and Writing—Review and Editing, J.L.; Conceptualization and Formal analysis, B.Z.; Methodology and Supervision, Z.Z.; Visualization and Data curation, T.Y. All authors have read and agreed to the published version of the manuscript.
Funding
This work was supported by the Hebei Natural Science Foundation (B2023110025), Cangzhou Key Research and Development Program (23242101002D), and Cangzhou Institute of Tiangong University (TGCYY-Z-0101).
Data Availability Statement
Data is contained within the article.
Conflicts of Interest
The author declares no conflicts of interest.
References
- Cui, T.; Zhang, C.; Quan, B.; Wang, L.; Zhang, Z.; Su, P.; Tang, Y.; Zhao, G.; Qiao, P.; Guo, J.; et al. Addressing challenges and advancing solutions: Enhancing semi-coking wastewater treatment for a sustainable prospect. J. Environ. Manag. 2025, 387, 125796. [Google Scholar] [CrossRef] [PubMed]
- Liu, J.; Wu, Y.; Dai, B.; Wu, Y.; Xu, M.; Guo, X. Investigating the catalytic degradation performance of the actual coking wastewater DOM by iron-containing sludge-based biochar. J. Environ. Manag. 2025, 389, 126052. [Google Scholar] [CrossRef] [PubMed]
- Shi, J.; Jia, L.; Wang, L.; Sun, H.; Zhao, H. Peroxodisulfate pretreatment for toxicity reduction of coking wastewater: Evaluation of key toxic substances, combined toxicity and toxicity thresholds. Chem. Eng. J. 2025, 519, 164600. [Google Scholar] [CrossRef]
- Xu, Y.; Hao, S.; Jia, D.; Qin, Y.; Wang, J.; Gao, J.; Xiao, J.; Hu, Y. Carboxyl-free polyamide reverse osmosis membrane with sustainable anti-fouling performance in treating industrial coke wastewater. Water Res. 2025, 280, 123495. [Google Scholar] [CrossRef]
- Li, J.; Cheng, W.; Wang, H.; Luo, Y.; Liu, Q.; Wang, X.; Wang, L.; Zhang, T. Reverse osmosis and nanofiltration processes in industrial wastewater treatment: The recent progress, challenge, and future opportunity. Sep. Purif. Technol. 2025, 362, 131687. [Google Scholar] [CrossRef]
- Liu, Y.; Mo, Y.; Zhao, X.; Wang, S.; Wang, L.; Guo, H. A mini review on treatment alternatives removing organic pollutants for reverse osmosis concentrate from industrial wastewater sources. J. Environ. Chem. Eng. 2025, 13, 116339. [Google Scholar] [CrossRef]
- Liu, Z.-Q.; Huang, C.; Li, J.-Y.; Yang, J.; Qu, B.; Yang, S.-Q.; Cui, Y.-H.; Yan, Y.; Sun, S.; Wu, X. Activated carbon catalytic ozonation of reverse osmosis concentrate after coagulation pretreatment from coal gasification wastewater reclamation for zero liquid discharge. J. Clean. Prod. 2021, 286, 124951. [Google Scholar] [CrossRef]
- Li, X.; Li, Y.; Wang, Z.; Xu, T.; Hong, M.; Zhao, X.; Mao, X. UV/peroxysulfate/ozone (UV/PS/O3) oxidation system for efficient degradation of organic matters in nanofilter membrane concentrates. J. Water Process Eng. 2024, 65, 105806. [Google Scholar] [CrossRef]
- Wu, M.; Zhou, S.; Huang, X.; Chen, Z.; Zhi, D. Insight into the coupled processes of electro-oxidation and other techniques for organic removal from water and wastewater. Desalin. Water Treat. 2025, 324, 101458. [Google Scholar] [CrossRef]
- Guo, Y.; Wang, R.; Ren, L.; Li, Y.; Wang, X.; Jiang, Y.; Wang, L.; Wang, Z. Harnessing singlet oxygen for advanced electrochemical treatment of coking wastewater. Energy Environ. Sustain. 2025, 1, 100033. [Google Scholar] [CrossRef]
- Wang, J.; Wang, S.; Hu, C. Advanced treatment of coking wastewater: Recent advances and prospects. Chemosphere 2024, 349, 140923. [Google Scholar] [CrossRef] [PubMed]
- Lyu, H.; Zhang, X.; Bai, C.; Ren, Y.; Zheng, T.; Wang, X.; Peng, W.; Jin, H.; Colombo, P. Coupled advanced oxidation process systems for enhanced degradation of antibiotics: A review. Sep. Purif. Technol. 2026, 382, 135602. [Google Scholar] [CrossRef]
- Wang, H.; Zhang, Z.; Liu, J.; Wang, L.; Liu, Q.; Zhang, T. O3/H2O2-NF Coupling for treating coal chemical reverse osmosis Concentrate: Organic matter removal and membrane fouling control. Sep. Purif. Technol. 2025, 362, 131682. [Google Scholar] [CrossRef]
- Xu, Z.; Mochida, K.; Naito, T.; Yasuda, K. Effects of operational conditions on 1, 4-dioxane degradation by combined use of ultrasound and ozone microbubbles. Jpn. J. Appl. Phys. 2012, 51, 07GD08. [Google Scholar] [CrossRef]
- Zhang, J.; Fan, S.-K.; Zhang, M.-H.; Grieneisen, M.L.; Zhang, J.-F. Aliphatic hydrocarbons recovered in vegetables from soils based on their in-situ distribution in various soil humus fractions using a successive extraction method. J. Hazard. Mater. 2018, 346, 10–18. [Google Scholar] [CrossRef] [PubMed]
- Gao, Y.; Duan, Y.; Fan, W.; Guo, T.; Huo, M.; Yang, W.; Zhu, S.; An, W. Intensifying ozonation treatment of municipal secondary effluent using a combination of microbubbles and ultraviolet irradiation. Environ. Sci. Pollut. Res. 2019, 26, 21915–21924. [Google Scholar] [CrossRef]
- Wu, L.; Wang, D.; Xu, X.; Xu, H.; Liu, J. Contrasting oxidation mechanisms and enhanced efficiency of ozone microbubbles for two pollutants in a Venturi-swirl reactor. Sep. Purif. Technol. 2025, 379, 134911. [Google Scholar] [CrossRef]
- Zhang, J.; Huang, G.-Q.; Liu, C.; Zhang, R.-N.; Chen, X.-X.; Zhang, L. Synergistic effect of microbubbles and activated carbon on the ozonation treatment of synthetic dyeing wastewater. Sep. Purif. Technol. 2018, 201, 10–18. [Google Scholar] [CrossRef]
- Wang, H.; Zhang, S.; He, X.; Yang, Y.; Yang, X.; Van Hulle, S.W.H. Comparison of macro and micro-pollutants abatement from biotreated landfill leachate by single ozonation, O3/H2O2, and catalytic ozonation processes. Chem. Eng. J. 2023, 452, 139503. [Google Scholar] [CrossRef]
- Lu, K.; Ren, T.; Yan, N.; Huang, X.; Zhang, X. Revisit the Role of Salinity in Heterogeneous Catalytic Ozonation: The Trade-Off between Reaction Inhibition and Mass Transfer Enhancement. Environ. Sci. Technol. 2023, 57, 18888–18897. [Google Scholar] [CrossRef] [PubMed]
- Pei, W.; Tang, Z.; Zhang, J.; Qu, Z.; Jiang, H.; Xing, W.; Chen, R. SiC ceramic membranes for high-efficiency micron-sized bubble aeration. J. Membr. Sci. 2025, 731, 124240. [Google Scholar] [CrossRef]
- Lu, J.; Huang, X.; Zhang, Z.; Pang, H.; Chen, K.; Xia, H.; Sui, Y.; Chen, R.; Zhao, Z. Co-coagulation of micro-nano bubbles (MNBs) for enhanced drinking water treatment: A study on the efficiency and mechanism of a novel cleaning process. Water Res. 2022, 226, 119245. [Google Scholar] [CrossRef] [PubMed]
- Kizhisseri, M.I.; Sakr, M.; Maraqa, M.; Mohamed, M.M. A comparative bench scale study of oxygen transfer dynamics using micro-nano bubbles and conventional aeration in water treatment systems. Heliyon 2025, 11, e41687. [Google Scholar] [CrossRef] [PubMed]
- Malahlela, H.K.; Belay, Z.A.; Mphahlele, R.R.; Caleb, O.J. Micro-nano bubble water technology: Sustainable solution for the postharvest quality and safety management of fresh fruits and vegetables—A review. Innov. Food Sci. Emerg. Technol. 2024, 94, 103665. [Google Scholar] [CrossRef]
- John, A.; Brookes, A.; Carra, I.; Jefferson, B.; Jarvis, P. Microbubbles and their application to ozonation in water treatment: A critical review exploring their benefit and future application. Crit. Rev. Environ. Sci. Technol. 2020, 52, 1561–1603. [Google Scholar] [CrossRef]
- Guo, M.; Song, B.; Chen, R.; Hong, M. Enhanced atrazine degradation in contaminated groundwater using ozone. Colloids Surf. A 2025, 726, 137811. [Google Scholar] [CrossRef]
- Koundle, P.; Nirmalkar, N.; Momotko, M.; Makowiec, S.; Boczkaj, G. Tetracycline degradation for wastewater treatment based on ozone nanobubbles advanced oxidation processes (AOPs)—Focus on nanobubbles formation, degradation kinetics, mechanism and effects of water composition. Chem. Eng. J. 2024, 501, 156236. [Google Scholar] [CrossRef]
- Koundle, P.; Nirmalkar, N.; Momotko, M.; Boczkaj, G. Ozone nanobubble technology as a novel AOPs for pollutants degradation under high salinity conditions. Water Res. 2024, 263, 122148. [Google Scholar] [CrossRef] [PubMed]
- Shen, D.; Xie, Z.; Shentu, J.; Long, Y.; Lu, L.; Li, L.; Qi, S. Enhanced oxidation of aromatic hydrocarbons by ozone micro-nano bubble water: Mechanism and influencing factors. J. Environ. Chem. Eng. 2023, 11, 110281. [Google Scholar] [CrossRef]
- Liu, T.; Zhang, B.; Li, W.; Li, B.; Han, Z.; Zhang, Y.; Ding, A.; Wang, S.; Ma, J.; He, X. The catalytic oxidation process of atrazine by ozone microbubbles: Bubble formation, ozone mass transfer and hydroxyl radical generation. Chemosphere 2023, 325, 138361. [Google Scholar] [CrossRef]
- Zheng, Y.; Wang, J.; Xue, S.; Li, S.; Ren, B. Study on the wetting characteristics of coal dust by micro-nano bubbles (MNBs) activated water. Fuel 2026, 406, 137161. [Google Scholar] [CrossRef]
- Achar, J.C.; Nam, G.; Jung, J.; Klammler, H.; Mohamed, M.M. Microbubble ozonation of the antioxidant butylated hydroxytoluene: Degradation kinetics and toxicity reduction. Environ. Res. 2020, 186, 109496. [Google Scholar] [CrossRef]
- Cai, M.; Miao, X.; Wang, X.; Xue, X.; Zhu, H.; Yang, L.; Zhang, X.; Yin, J. Singlet oxygen-dominated dual-pathways catalytic ozonation of sulfamethoxazole over FeOx-N-BC/O3–MNBs system. J. Environ. Chem. Eng. 2026, 14, 121689. [Google Scholar] [CrossRef]
- Liu, F.; Qin, J.; Sun, J.; Xu, Z.; Du, C.; Tu, Y.; Ren, Z. Oxygen vacancies-enriched Ca1.1MnO3-δ perovskite catalysts for efficient catalytic ozone oxidation and enhanced radical generation. Chem. Eng. Sci. 2025, 305, 121179. [Google Scholar] [CrossRef]
- Zhao, C.; Miao, W.; Yu, J.; Xiong, F.; Tong, M.; Yong, M.; Tang, M.; Sun, L.; Luo, W.; Liu, Z.; et al. Analysis of dissolved organic matter distribution in A zero-discharge system for coking wastewater treatment at A Typical steel plant. Sep. Purif. Technol. 2025, 364, 132310. [Google Scholar] [CrossRef]
- Xiaoli, C.; Guixiang, L.; Xin, Z.; Yongxia, H.; Youcai, Z. Fluorescence excitation–emission matrix combined with regional integration analysis to characterize the composition and transformation of humic and fulvic acids from landfill at different stabilization stages. Waste Manag. 2012, 32, 438–447. [Google Scholar] [CrossRef]
- Shen, J.; Miao, W.; Hu, N.; Li, E.; Li, P. Efficiency of ozone micro nano bubbles in treating concentrated brine in zero discharge process of coking wastewater. J. Environ. Eng. Technol. 2024, 14, 1130–1140. [Google Scholar]
- Yang, X.; Zhang, T.; Liu, Z.; Zhang, R.; Chen, C.; Li, Z.; Demeestere, K.; Van Hulle, S.W.H. Intensification of ozone gas/liquid mass transfer and ozonation efficiency: A critical review. Water Res. 2026, 288, 124719. [Google Scholar] [CrossRef]
- Zhang, Z.; Li, J.; Jiang, Y.; Zhao, L.; Bai, L.; Yang, J.; Pang, H.; Lu, J. Emission Characteristics of Aerosols Generated during the Micro–Nano Bubble Aeration Process in Wastewater. Environ. Sci. Technol. 2024, 58, 17396–17405. [Google Scholar] [CrossRef]
- Jia, J.; Zhu, Z.; Chen, H.; Pan, H.; Jiang, L.; Su, W.-H.; Chen, Q.; Tang, Y.; Pan, J.; Yu, K. Full life circle of micro-nano bubbles: Generation, characterization and applications. Chem. Eng. J. 2023, 471, 144621. [Google Scholar] [CrossRef]
- You, X.; Yang, L.; Chu, H.; Zhang, L.; Hong, Y.; Lin, Y.; Zhou, X.; Zhang, Y. Micro-nano-bubbles and their application in microalgae production: Wastewater treatment, carbon capture and microalgae separation. Algal Res. 2024, 78, 103398. [Google Scholar] [CrossRef]
- Hu, L.; Chen, B.; Ma, J. Micro-/nano- bubbles ozonation for effective industrial wastewater remediation: From lab to pilot-scale application. J. Environ. Chem. Eng. 2023, 11, 110807. [Google Scholar] [CrossRef]
- Yan, P.; Feng, C.; Li, M.; Shen, J.; Chen, Z.; Ma, F.; Kang, J.; Zhu, X.; Li, Y.; Cheng, Y. Enhanced durable water purification via UV-triggered ozone micro-nano bubbles process: Exposure of free radicals and control of disinfection byproducts. Chem. Eng. J. 2025, 526, 171258. [Google Scholar] [CrossRef]
- Khuntia, S.; Majumder, S.K.; Ghosh, P. Quantitative prediction of generation of hydroxyl radicals from ozone microbubbles. Chem. Eng. Res. Des. 2015, 98, 231–239. [Google Scholar] [CrossRef]
- Ji, Y.; Feng, X.; Shen, J.; Kang, J.; Yan, P.; Wang, B.; Shen, Y.; Chen, Z. Removal of trace organic pollutants in drinking water by an integrated ozone micro-nano bubble and granular activated carbon process: From laboratory scale to pilot studies. Sep. Purif. Technol. 2025, 382, 135985. [Google Scholar] [CrossRef]
- Mohammed, S.M.; Sukkar, K.A.; Al-Ezzi, A.A.R.; Qarahgouli, A.R. A critical review of optimizing pollutant removal from refinery wastewater using ozone and nanocatalyst-assisted bubble column reactors. Desalin. Water Treat. 2025, 323, 101343. [Google Scholar] [CrossRef]
- Canatto, A.K.; da Silva, T.F.; dos Santos Machado, B.; Gozzi, F.; de Brito, D.A.S.; Nazário, C.E.D.; Filho, F.J.C.M.; Cavalheri, P.S.; de Oliveira, S.C.; Junior, A.M. Ozonation process at neutral pH integrated with anaerobic treatment system to methylparaben removal. J. Water Process Eng. 2024, 64, 105741. [Google Scholar] [CrossRef]
- Rath, S.A.; Lim, S.; Halder, M.L.; von Gunten, U. Kinetics of aqueous phase ozone reactions of 5-membered aromatic heterocycles. Water Res. 2026, 295, 125271. [Google Scholar] [CrossRef]
- Han, W.-R.; Wang, W.-L.; Qiao, T.-J.; Wang, W.; Su, H.; Xu, C.-X.; Wu, Q.-Y. Ozone micro-bubble aeration using the ceramic ultrafiltration membrane with superior oxidation performance for 2, 4-D elimination. Water Res. 2023, 237, 119952. [Google Scholar] [CrossRef]
- Wang, F.; Qin, Z.; Yuan, Y.; Cai, Y.; Yu, Y.; Wu, C. Toward efficient catalytic ozonation: Overcoming challenges in real wastewater treatment-A review. J. Water Process Eng. 2025, 77, 108404. [Google Scholar] [CrossRef]
- Das, P.P.; Dhara, S.; Samanta, N.S.; Purkait, M.K. Advancements on ozonation process for wastewater treatment: A comprehensive review. Chem. Eng. Process. Process Intensif. 2024, 202, 109852. [Google Scholar] [CrossRef]
- Sun, Q.; Yuan, X.; Zhang, L.; Ming, F.; Zhang, W. Investigation of mass transfer enhancement by spontaneous interfacial convection in gas–liquid absorption process: Inducing strategy, mass transfer rate and modeling. Chem. Eng. Sci. 2025, 318, 122155. [Google Scholar] [CrossRef]
- Song, Q.; Kong, F.; Liu, B.-F.; Song, X.; Ren, N.-Q.; Ren, H.-Y. Ozone oxidation of actual waste leachate coupled with culture of microalgae for efficient lipid production under different temperatures. Water Res. 2025, 277, 123305. [Google Scholar] [CrossRef] [PubMed]
- Sun, S.; Lu, M.; Wei, Q.; Chen, J.; Wu, R.; Feng, F.; Wei, L. Key factors impacting treatment efficiency in actual copper mineral processing wastewater by ozonation. Water Sci. Technol. 2023, 87, 2362–2372. [Google Scholar] [CrossRef]
- Hu, R.; Li, J.-Y.; Yu, Q.; Yang, S.-Q.; Ci, X.; Qu, B.; Yang, L.; Liu, Z.-Q.; Liu, H.; Yang, J.; et al. Catalytic ozonation of reverse osmosis concentrate from coking wastewater reuse by surface oxidation over Mn-Ce/γ-Al2O3: Effluent organic matter transformation and its catalytic mechanism. J. Hazard. Mater. 2024, 471, 134363. [Google Scholar] [CrossRef]
- Ren, M.; Zhai, X.; Wang, S.; Qiu, J.; Yu, F.; Cui, Y.; Cao, H.; Xie, Y. Nanoconfined bimetallic functionalized ceramic membrane with O3 micro-nano-bubbles for synergistic treatment of highly-salinity wastewater. Water Res. 2026, 293, 125480. [Google Scholar] [CrossRef]
- Han, S.; Wang, W.; Xu, Z.; Qi, L. Research and perspective of heterogeneous catalytic oxidation by ozone in the removal of pollutants from industrial wastewater: A review. J. Ind. Eng. Chem. 2025, 147, 20–38. [Google Scholar] [CrossRef]
- Yuan, R.; Xia, Y.; Wu, X.; He, C.; Qin, Y.; He, C.; Zhang, X.; Li, N.; He, X. Efficient advanced treatment of coking wastewater using O3/H2O2/Fe-shavings process. J. Environ. Chem. Eng. 2022, 10, 107307. [Google Scholar] [CrossRef]
- Zhou, S.; Lu, W.; Li, P. Micro-nanobubble Ozone Oxidation for the Treatment of RO Concentrated Water from Dyeing Wastewater. China Water Wastewater 2022, 38, 88–93. [Google Scholar] [CrossRef]
- Zhang, N.; Zhang, J.; Zhang, Y.; Bai, J.; Wei, X. Solubility and Henry’s law constant of sulfur dioxide in aqueous polyethylene glycol 300 solution at different temperatures and pressures. Fluid Phase Equilib 2013, 348, 9–16. [Google Scholar] [CrossRef]


Disclaimer/Publisher’s Note: The statements, opinions and data contained in all publications are solely those of the individual author(s) and contributor(s) and not of MDPI and/or the editor(s). MDPI and/or the editor(s) disclaim responsibility for any injury to people or property resulting from any ideas, methods, instructions or products referred to in the content. |
© 2026 by the authors. Licensee MDPI, Basel, Switzerland. This article is an open access article distributed under the terms and conditions of the Creative Commons Attribution (CC BY) license.