Abstract
To address the critical need for accurate human thermal comfort prediction in winter heating environments, this study established a comprehensive thermal comfort dataset containing 2089 valid samples through experiments. On this basis, thermal comfort prediction models were constructed using three multi-class machine learning algorithms: Support Vector Classification, K-Nearest Neighbors, and Random Forest. The predictive performance of 63 different feature combinations was systematically evaluated. The results indicate that the feature subset comprising indoor air temperature, forehead temperature, cheek temperature, dorsal hand temperature, heart rate, and systolic blood pressure yields the optimal prediction performance. Among the evaluated models, the Random Forest model demonstrated superior overall performance, achieving an accuracy exceeding 90% and an AUC ranging from 96% to 99%, significantly outperforming the SVC and KNN models. Compared with the traditional Predicted Mean Vote (PMV) model, the machine learning models developed in this study showed a substantial improvement in prediction accuracy under identical conditions; notably, the Random Forest model improved accuracy by approximately 40% over the PMV model. Based on these findings, a smart heating system framework integrating environmental sensors, wearable devices, and intelligent control valves is proposed, providing a theoretical basis and technical approach for realizing personalized and energy-efficient heating control.
1. Introduction
According to data from the International Energy Agency, the three major sectors contributing to global energy consumption and carbon emissions are the building industry, transportation, and other industries. Notably, the building sector accounts for 35% of total energy consumption and 38% of carbon emissions [1]. In China, energy consumption in the building sector constitutes nearly 20% of the total national energy consumption. The growing demand for heating has led to substantial building energy consumption and significant carbon emissions [2], making winter heating a matter of widespread public concern [3].
Currently, most cities in northern China adopt a centralized heating mode [4]. The working principle of this system involves transporting hot water from a centralized heat source to various users via a thermal pipe network, which ensures stable and safe continuous heating 24 h a day. With the rapid development of urbanization in China, the application of centralized heating systems has become increasingly extensive. However, due to a lack of intelligent control, this heating mode often suffers from issues such as supply-demand imbalances and energy wastage [5]. Consequently, it is imperative to construct a more efficient heating regulation system, which fundamentally requires the ability to accurately predict the thermal comfort of residents.
Since the 1970s, scholars have progressively established a series of thermal comfort models to predict human thermal sensation. Among them, the Predicted Mean Vote (PMV) model [6], established by Fanger based on experimental data, has been widely recognized. However, in practical applications, numerous studies have found that PMV predictions often deviate from subjective experiences [7,8,9,10,11,12,13,14]. Furthermore, some input variables required by the PMV model are difficult to collect in actual building environments. Therefore, the development of new thermal comfort prediction models is necessary.
In research related to model prediction, data-driven machine learning methods have demonstrated excellent performance in prediction accuracy, becoming a crucial component of intelligent heating systems. However, despite progress in data-driven thermal comfort prediction, several issues in the existing literature may still warrant further investigation. First, a considerable portion of existing machine learning studies tend to rely on large-scale public datasets [15,16,17]. While such data are valuable for identifying global trends, it may be challenging for them to fully capture the nuanced effects of specific building operation modes (e.g., centralized heating).
Second, in current predictive modeling practices, “thermal sensation” is more frequently adopted as the model output than “thermal comfort”, the latter being more closely related to subjective pleasure [18,19]. This is because thermal sensation, as an objective description of one’s thermal state [20,21], is often less difficult to predict. However, models based solely on sensation may not fully reflect the subjective satisfaction of occupants.
Third, the rationale for selecting input features is sometimes context-specific or constrained by the dataset used. There remains room for discussion regarding how different combinations of multi-source features (environmental, physiological, and behavioral) affect the performance of machine learning algorithms.
Against this background, this study attempts to construct a localized thermal comfort dataset specifically for winter centralized heating conditions in the cold region of China. In the research design, we tend to employ a thermal comfort scale rather than a thermal sensation scale. Furthermore, using a consistent evaluation protocol, we conduct a systematic comparative analysis of 63 multi-factor, multi-type coupled feature combinations across three representative classifiers. The aim is to provide a data reference for building a deployable intelligent closed-loop control framework that balances individual comfort and energy efficiency.
2. Methodology
The research methodology is divided into five main components: data collection, data processing and feature engineering, model training, baseline model comparison, and control framework development. Figure 1 illustrates the overall workflow of this study. First, experiments were conducted according to the research objectives, and thermal comfort data were collected. The data were then integrated and cleaned. The processed data were used to train three different machine learning models, after which the machine learning models were compared with the PMV model. Finally, based on the requirements of intelligent heating, an intelligent heating framework equipped with a machine learning prediction system was proposed. The research procedure of this study is illustrated in Figure 1.
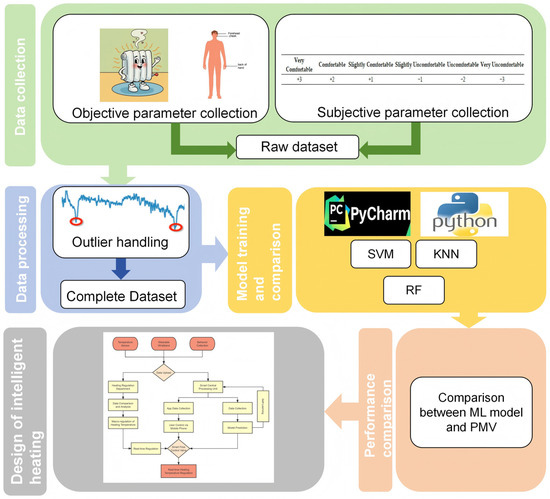
Figure 1.
Research procedure.
2.1. Experimental Site and Participant Recruitment
The experiment was conducted from October 2020 to April 2021 in a laboratory at a university in Jiaozuo, Henan Province, China. The laboratory was equipped with typical centralized heating terminals. To minimize the potential confounding effects of gender, age, and social background on the results, junior university students were recruited as participants. The cohort consisted of 32 students (16 males and 16 females), all of whom had lived locally for at least one year and were acclimatized to the local climate. This study has obtained verbal informed consent from the participants to publish this paper along with any accompanying data and images. Prior to the experiment, participants were instructed to avoid alcohol, caffeine, strenuous exercise, and smoking, and to ensure adequate sleep the night before. During the experiment, participants remained in a sedentary seated position, with an estimated metabolic rate of 1.2 met. The basic information of the participants is presented in Table 1.

Table 1.
Basic information of occupants.
2.2. Experimental Design
During the experiment, staff monitored the completion of questionnaires and physiological measurements in real time. The experimental procedure is illustrated in Figure 2. The collected data included basic participant information, indoor and outdoor environmental parameters, physiological parameters, and subjective evaluations.
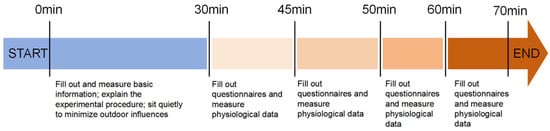
Figure 2.
Experimental flow chart.
Regarding environmental parameters, indoor air temperature (Ta) was measured. In accordance with ISO 7726 [22] and ASHRAE 55-2020 standards [23], the measurement instruments were positioned within 0.3 m of the participants. The recorded values represent the temperature at the waist (0.6 m) level.
Regarding physiological parameters, local skin temperatures (forehead, cheek, and dorsal hand; all measured on the left side), heart rate (HR), and systolic blood pressure (SBP) were recorded using a multi-channel heat flow tester and an automated blood pressure monitor, respectively. The instrument specifications are provided in Table 2. The skin measurement points are shown in Figure 3a, and the field test setup is depicted in Figure 3b.
Table 2.
Field test parameters and measuring instruments.
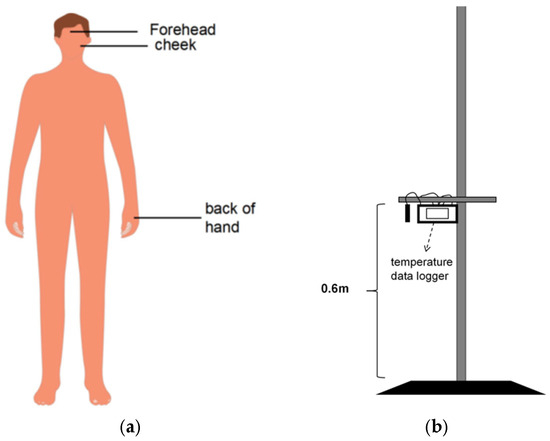
Figure 3.
Measurement setup. (a) Schematic diagram of skin measurement points. (b) Measurement height of environmental parameters.
During the test, participants reported their real-time clothing status in the questionnaire. To simulate realistic conditions, participants were not required to wear a fixed uniform. The thermal resistance values for single garments were determined based on ISO 7730-2005 [24] and GB 50785-2012 standards [25]. Given the sedentary posture of the participants, a correction of 0.15 clo [26] was applied to the clothing insulation values to account for the thermal insulation of the chair.
The subjective questionnaire assessed thermal comfort using the voting scale presented in Table 3.
Table 3.
Thermal comfort voting scale.
A total of 2210 data samples were obtained. After removing 121 samples containing errors or significant omissions, 2089 valid samples remained for analysis.
2.3. Data Preprocessing
Before model training, the raw dataset was preprocessed to ensure data quality and consistency. Outliers in the input variables were removed using the interquartile range (IQR) criterion, and the cleaned dataset was used for all subsequent modeling. Samples with missing values in any required input feature or in the target label (thermal comfort) were excluded. The thermal comfort labels were treated as a multi-class target and encoded accordingly. For models sensitive to feature scales (SVC and kNN), input features were standardized, while Random Forest does not require scaling.
2.4. Algorithm Selection and Performance Evaluation
Machine learning is generally categorized into supervised and unsupervised learning. Supervised learning involves training a model to predict outputs for given inputs and includes classification and regression tasks. Unsupervised learning is primarily used for clustering, dimensionality reduction, and association. Given the objective of this study, supervised learning was selected. Common supervised learning methods are listed in Table 4.
Table 4.
Classification of supervised learning methods.
This study selected three classification algorithms—Support Vector Classification (SVC), K-Nearest Neighbors (KNN), and Random Forest (RF) (an ensemble method based on decision trees)—to model the preprocessed thermal comfort data. These algorithms were chosen according to the following criteria: (1) suitability for multi-class classification on tabular data with potentially non-linear decision boundaries, which is typical for combined physiological and environmental measurements; (2) complementary learning principles to support a robust comparison—SVC is a margin-based classifier, KNN is an instance-based method, and RF is an ensemble tree approach that can capture non-linear interactions; and (3) practical computational complexity for real-time or near-real-time implementation in intelligent control applications. These three methods are also widely used as strong classical baselines in indoor comfort-related classification tasks [32,33,34].
Model performance was evaluated using Accuracy (reflecting the proportion of correctly classified samples), f1-score (a comprehensive metric balancing precision and recall), and AUC (Area Under the ROC Curve, assessing the overall discriminative ability of the classifier). The detailed calculation methods for each metric are provided in Appendix A.
To obtain a robust and reproducible performance estimate, we adopted a two-stage evaluation protocol. First, the cleaned dataset was split into a stratified training set and an independent hold-out test set (80/20), and the test set was reserved for the final unbiased assessment (reported in Section 2.6 and Section 3.1). Second, we performed stratified k-fold cross-validation (CV) on the training set to compare classifiers (SVC, kNN, and RF) and feature-group configurations, reporting mean ± standard deviation of Accuracy and Macro-f1. Because the least frequent thermal-comfort class contains only two samples in the training set, a fixed 5-fold stratified CV is mathematically infeasible; therefore, k was constrained by the minimum class size in the training set (k ≤ 5), which resulted in stratified 2-fold CV for this dataset. Macro-f1 was emphasized in CV because it is more informative for multi-class imbalanced data.
Considering the various combinations of input features and the distinct characteristics of the three algorithms, this study conducted a comparative analysis. This included a horizontal comparison of different feature subsets and a vertical comparison of the three algorithms, providing a theoretical reference for feature selection in intelligent building control and the application of classification algorithms in thermal comfort research.
2.5. Feature Engineering
Thermal comfort prediction models based on SVC, KNN, and RF were constructed using Python 3.12.1. To fully account for the comprehensive impact of environmental, physiological, and behavioral factors on human thermal comfort, a multi-factor, multi-type coupled classification approach was adopted. The specific combinations of input feature parameters are detailed in Table 5.
Table 5.
Input feature parameter combinations.
Table 5 lists the feature-group configurations used in this study. The groups were constructed based on a deployment-oriented assumption that indoor air temperature (Ta) is always available and should be included as a mandatory input for thermal comfort prediction and subsequent control. Under this assumption, the remaining six variables were combined using all possible non-empty subsets, resulting in 26 − 1 = 63 feature groups. Hence, the 63 groups in Table 5 constitute an exhaustive enumeration of all combinations subject to the Ta-mandatory constraint.
2.6. Algorithm Establishment
The thermal comfort prediction models were developed on the Jupyter Notebook 6.5.4 platform using Python. The input features comprised three categories: environmental parameters (indoor air temperature, Ta), physiological parameters (forehead temperature Tskforehead, cheek temperature Tskcheek, back of hand temperature TskBH, heart rate HR, systolic blood pressure SBP), and clothing thermal resistance (clo). The pseudo-code for the modeling process is shown in Table 6.
Table 6.
Pseudo-code of multi-factor and multi-type coupling thermal comfort prediction algorithm.
As indicated in the pseudo-code, the algorithm divides the dataset into a training set (Dtrain) and a testing set (Dtest). The three algorithms were used to learn the initial classification patterns on the training set to obtain the models (M). These models were then tested and adjusted on the testing set to obtain the final models (Madjust), with Accuracy, f1-score, and AUC calculated simultaneously.
3. Model Performance Comparison
3.1. Class Distribution
Table 7 summarizes the distribution of thermal comfort classes in the overall dataset and in the stratified 80/20 train–test split. The labels are clearly imbalanced: class “1” and class “2” account for 38.34% and 43.14% of all samples, respectively, while minority classes are scarce (e.g., class “−3” includes only 2 samples overall). This imbalance motivates the use of stratified splitting and the reporting of Macro-f1 in addition to accuracy. It also constrains stratified cross-validation; therefore, k was set according to the minimum class size in the training set (k ≤ 5), which resulted in stratified 2-fold cross-validation for this dataset.
Table 7.
Distribution of thermal comfort classes in the overall dataset and in the stratified 80/20 train–test split.
3.2. Performance Results of Support Vector Classification (SVC)
Thermal comfort models based on Support Vector Classification (SVC) were established for the 63 different feature parameter combinations listed in Table 5. The evaluation metrics (Accuracy, f1-score, and AUC) for these combinations on the test set are presented in Table 8.
Table 8.
Evaluation criteria for classification support vector machine thermal comfort model.
Based on the performance results, specific input feature combinations—including Group 12, Group 16, Group 22, Group 26, Group 32, Group 39, Group 41, Group 42, Group 49, Group 51, Group 53, Group 55, Group 57, Group 58, Group 61, and Group 62—were selected. For these combinations, all three evaluation metrics exceeded 60%.
Overall, the Accuracy and f1-score of the SVC models were concentrated in the range of 60–64%, while the AUC ranged from 63% to 70%. This indicates that the predictive performance of the thermal comfort models established using SVC falls within the 60–70% range.
3.3. Performance Results of K-Nearest Neighbors (KNN)
Thermal comfort models based on the K-Nearest Neighbors (KNN) algorithm were established for the 63 feature combinations listed in Table 5. The evaluation metrics for the different combinations on the test set are presented in Table 9.
Table 9.
Evaluation standard of k-nearest Neighbor algorithm thermal comfort model.
Based on the performance results, feature combinations such as Group 22, Group 23, Group 35, Group 38, Group 43, Group 44, Group 46, Group 52, Group 55, Group 56, Group 57, Group 59, Group 62, and Group 63 were selected. For these combinations, all three evaluation metrics exceeded 75%.
Overall, the Accuracy and f1-score of the KNN models were concentrated in the range of 75–79%, while the AUC metrics were primarily concentrated in the range of 80–87%. This indicates that the predictive performance of the thermal comfort models based on KNN falls within the 75–87% range.
3.4. Performance Results of Random Forest (RF)
Thermal comfort models based on the Random Forest (RF) algorithm were established for the 63 feature combinations listed in Table 5. The evaluation metrics for the different combinations on the test set are presented in Table 10.
Table 10.
Evaluation criteria of thermal comfort model based on random forest algorithm.
Based on the performance results, feature combinations such as Group 23, Group 29, Group 30, Group 31, Group 41, Group 44, Group 45, Group 47, Group 49, Group 50, Group 51, Group 53, Group 55, Group 56, Group 57, Group 58, Group 59, Group 60, Group 61, Group 62, and Group 63 were selected. For these combinations, all three evaluation metrics exceeded 90%.
Overall, the Accuracy and f1-score of the RF models were concentrated in the range of 90–95%, while the AUC metrics were primarily concentrated in the range of 96–99%. This demonstrates that the predictive performance of the thermal comfort models established using RF consistently falls within the 90–99% range.
3.5. Comparison of Features and Model Performance
This study employed three machine learning algorithms—SVC, KNN, and RF—to analyze thermal comfort prediction across different input feature combinations. The selection of the optimal feature combination and prediction model was based on a comprehensive consideration of feature convenience, rationality, and model performance metrics (Accuracy, f1-score, and AUC).
The results indicated that the performance differences between certain feature combinations were minimal (approximately 1–2%). Consequently, to prioritize practical application convenience, non-essential features could be excluded. For instance, Group 57 does not include clothing insulation, whereas Group 63 does. A comparison of the models reveals that the differences in all three performance metrics for SVC and KNN were less than 1%. For the RF model, the difference in AUC was less than 1%, and the differences in Accuracy and f1-score were less than 4%. This suggests that winter clothing insulation has a limited impact on the performance of the thermal comfort prediction model. Considering that winter clothing insulation is relatively stable and its regulation exhibits hysteresis in reality, it was ultimately excluded from the input features.
On the other hand, skin temperatures of the forehead, cheek, and dorsal hand are sensitive to environmental changes, while heart rate and systolic blood pressure directly reflect physiological thermoregulatory states. These features were included in most high-performance combinations (e.g., Group 57), yielding superior predictive performance.
Comparing the three algorithms, the Random Forest model significantly outperformed the other two (performance metrics reaching 96–99%), whereas the SVC and KNN models were concentrated in the 60–70% and 75–87% ranges, respectively. These results demonstrate that Random Forest can more effectively identify the complex relationships between features and thermal comfort, making it suitable for the prediction tasks in this study.
To address potential split-dependence of a single hold-out evaluation, we additionally report stratified cross-validation results on the training set. Table 11 summarizes the CV performance (mean ± std) of the three models under the selected best feature group (Group 57), together with the corresponding hold-out test performance for direct comparison. Although CV typically provides a more conservative estimate than a single split, the relative ranking of the models is consistent across CV and the independent test set (RF > SVC and kNN), supporting the robustness of the model selection and the conclusions drawn in this study.
Table 11.
Stratified cross-validation (CV) and hold-out test performance.
3.6. Comparative Analysis of Machine Learning Models and the PMV Model
This section compares the parameter combinations and prediction models derived from machine learning algorithms with those used in the traditional PMV model under identical conditions to determine which is superior. Accuracy was used as the comparative metric. The results are shown in Table 12.
Table 12.
Comparative analysis of thermal comfort prediction models.
As indicated in the table, the thermal comfort prediction models established using machine learning algorithms in this study consistently achieved higher prediction accuracy than the traditional PMV equation. Compared to the six factors of the traditional PMV model (indoor air temperature, mean radiant temperature, air velocity, relative humidity, clothing insulation, and metabolic rate), the parameter combinations derived via machine learning algorithms are more aligned with human perception of current thermal environment changes. Specifically, the predictive performance of the SVC model improved by 9.49% over the PMV model, the KNN model by 26.31%, and the RF model by 40.18%.
4. Discussion
To address the prevalent issues in the centralized heating sector, such as severe energy wastage, supply-demand imbalances, and the lack of intelligent control, this study proposes a targeted solution. By integrating the Random Forest-based thermal comfort prediction model established herein with sensors, wearable devices, and imaging technology, we designed an intelligent heating control device and system. The intelligent heating control device is a novel smart control valve. Its regulation feedback mechanism primarily relies on real-time data collection via indoor environmental monitoring systems and wearable wristbands. Based on the thermal comfort levels predicted by the Random Forest model, the valve opening angle is adjusted to achieve the objective of intelligent heating regulation.
4.1. Analysis of the Mechanisms Underlying Model Performance Differences
The experimental results in Section 3 demonstrate that the Random Forest (RF) model significantly outperforms both Support Vector Classification (SVC) and K-Nearest Neighbors (KNN) in predicting thermal comfort. While the previous section presented the performance metrics, this part delves into the underlying reasons for this performance gap, focusing on how the intrinsic characteristics of each algorithm interact with the specific nature of the thermal comfort dataset.
The superior performance of the RF model can be attributed to several key factors inherent to its ensemble learning mechanism. First, thermal comfort is a complex phenomenon resulting from non-linear interactions between environmental (e.g., Ta), physiological (e.g., skin temperatures, HR), and personal (e.g., clo) factors. As an ensemble of decision trees, RF is inherently adept at capturing these complex, non-linear relationships and high-order feature interactions without requiring extensive feature engineering or data transformation [35,36]. Each decision tree in the forest learns different splitting rules based on different feature subsets, and the final prediction is an aggregation (e.g., majority voting) of these trees. This process effectively models the multifaceted nature of the perception of the thermal environment. Second, RF provides a robust measure of feature importance. This inherent capability allows the model to automatically weigh the predictive power of different inputs (e.g., it might find that skin temperature is a stronger indicator than heart rate for certain comfort levels), leading to a more nuanced and accurate decision boundary. This aligns with our feature selection process in Section 3.4, where models including physiological signals like skin temperature consistently performed better. Third, the bagging (Bootstrap Aggregating) procedure used by RF introduces randomness into the training process, which significantly reduces the model’s variance and makes it less prone to overfitting compared to a single decision tree [37]. This robustness is critical for generalizing well to unseen data, as reflected in the high and stable performance metrics (Accuracy > 90%, AUC 96–99%).
In contrast, the weaker performance of SVC and KNN can be explained by their respective algorithmic limitations when applied to this specific problem. The SVC model’s performance, concentrated in the 60–70% range, suggests that its underlying principle of finding an optimal separating hyperplane may be less suited for this dataset. While SVC with a non-linear kernel (like the RBF kernel used in this study) can model complex boundaries, its performance is highly sensitive to the choice of kernel parameters and feature scaling. The high-dimensional feature space created by the combination of environmental and physiological data may make it challenging for the SVC to find a clean, maximal-margin hyperplane that separates the six comfort categories effectively [30]. Furthermore, the one-vs-one or one-vs-rest strategies required for multi-class classification with SVC can lead to ambiguous regions and reduced confidence in predictions, especially when class boundaries are fuzzy, as is often the case with subjective thermal comfort votes.
The KNN model, while outperforming SVC, still lagged significantly behind RF. As an instance-based learner, KNN’s prediction relies on measuring the distance (e.g., Euclidean distance) between a new data point and its nearest neighbors in the training set [27]. Its performance is therefore highly dependent on the quality of the distance metric and the local structure of the data. In a dataset with 2089 samples across six comfort classes, the feature space is dense but not infinite. The “curse of dimensionality” can affect KNN, where distances become less meaningful in high-dimensional spaces. Moreover, KNN assigns equal weight to all features unless feature weighting is explicitly implemented. In contrast to RF, which automatically learns feature importance, KNN may be equally influenced by a highly predictive feature (e.g., forehead temperature) and a less relevant one, potentially diluting its predictive accuracy. This explains why KNN’s accuracy (75–79%) is good but not exceptional, as it lacks the sophisticated feature interaction modeling and importance weighting that RF provides.
In summary, the RF model’s ensemble nature, its ability to model non-linear interactions, and its inherent robustness to overfitting make it exceptionally well-suited for the complex, multi-class classification task of predicting human thermal comfort from a mixed set of environmental and physiological features.
4.2. Feasibility Analysis of Intelligent Heating
Traditional studies have predominantly correlated environmental parameters with thermal comfort for prediction [38,39,40]. However, relying solely on environmental parameters is insufficient, as individuals may experience different thermal sensations under identical environmental conditions [41,42]. Physiological parameters—particularly skin temperature [43], which is sensitive to environmental changes—are closely linked to thermoregulatory mechanisms [44] and can better reflect individual differences. Therefore, incorporating them into the model is rational.
With technological advancements, the development of data collection and data-driven methods has made the precise prediction of thermal comfort using new variables possible [45,46]. Meanwhile, the mature application of sensors and wearable devices (such as wristbands capable of monitoring heart rate and skin temperature) [47,48] provides a viable technical pathway for non-invasive, real-time data acquisition and personalized prediction. These technologies can be integrated into the intelligent control of HVAC systems via the Internet of Things (IoT).
4.3. Design of Intelligent Heating Scheme
Based on the feasibility analysis, the intelligent heating scheme designed in this study primarily comprises intelligent heating control valves, indoor environmental sensors, wearable devices, a central control panel, and mobile terminals. The operational principle is illustrated in Figure 4.
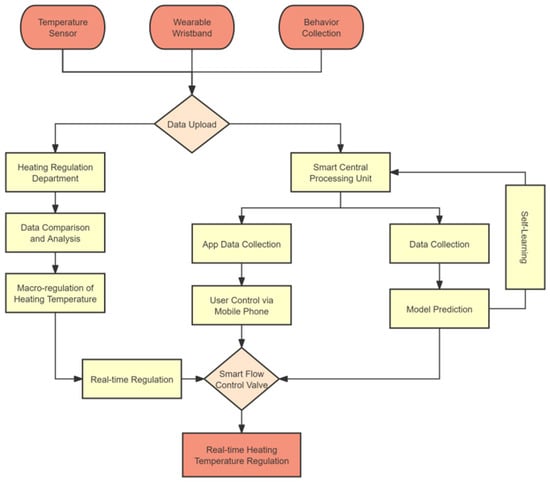
Figure 4.
Working principle diagram of intelligent heating.
The proposed framework consists of four components, namely the data acquisition layer, the smart central processing unit, the control/actuation layer, and the self-learning module. Its working principle is described as follows.
(1) Multi-source sensing and data uploading (Sensing & Uploading): The system collects data from an indoor temperature sensor (Temperature Sensor), a wearable wristband (Wearable Wristband), and user behavior collection (Behavior Collection). The indoor temperature reflects variations in the thermal environment; the wearable device captures physiological signals such as skin temperature; and behavior collection is used to characterize activity states and changes in subjective preferences. These data streams are preliminarily aggregated on the mobile device or gateway and then transmitted via Data Upload to provide inputs for subsequent prediction and control.
(2) Data fusion and model prediction (Fusion & Prediction): After uploading, the data enter the Smart Central Processing Unit. This unit performs data cleaning, alignment, and fusion across sources (e.g., outlier handling, missing-value processing, and time synchronization), and then feeds the fused features into the multi-class thermal-comfort prediction model developed in this study (Model Prediction). The model output represents the user’s current (or short-term predicted) thermal-comfort category, which quantifies the control demand, i.e., whether heating should be increased, decreased, or maintained. To improve practical usability, the mobile App simultaneously conducts App Data Collection and allows users to provide preference inputs or manual settings (User Control via Mobile Phone). Such information can be used as a correction term in the control strategy (e.g., warm/cool preference or target comfort level) to accommodate individual differences.
(3) Control decision and actuation (Decision & Actuation): The control layer comprises two complementary pathways.
Macro-regulation pathway (Macro-regulation of Heating Temperature): The heating regulation department (Heating Regulation Department) determines a baseline heating temperature at a slower time scale based on historical operation and statistical analyses (Data Comparison and Analysis). This pathway is designed to address low-frequency, large-amplitude changes in demand, such as outdoor weather variations and building-wide load shifts.
Real-time regulation pathway (Real-time Regulation): On top of the macro-regulation baseline, the system generates real-time control commands according to the model prediction and user inputs, and applies them to the Smart Flow Control Valve. By adjusting the heating flow rate/valve position, the valve enables Real-time Heating Temperature Regulation to respond to rapid changes in human state and local thermal conditions. Together, the two pathways provide both global stability (ensured by macro-regulation) and individualized, fast responsiveness (achieved by real-time regulation).
(4) Feedback and self-learning updates (Feedback & Self-learning): During operation, changes in the thermal environment after actuation and user feedback (including physiological responses and possible manual adjustment records) are fed back to the Self-learning module within the smart central processing unit. This module periodically updates model parameters or optimizes the mapping from predicted comfort categories to control actions (e.g., valve-adjustment magnitude/thresholds), allowing the system to gradually adapt to individual differences and environmental variations over long-term operation and to improve the stability and generalization of both prediction and control. In this way, a closed-loop iterative process of “data–model–control–feedback–re-learning” is formed.
In summary, the framework in Figure 4 integrates multi-source sensing data with the thermal-comfort prediction model, establishes coordination between the macro-level heating baseline and local real-time regulation, and continuously improves performance through self-learning, thereby forming an intelligent closed-loop control system for thermal comfort.
4.4. Limitations and Future Outlook
Although this study has made progress in establishing machine learning-based thermal comfort prediction models and designing an intelligent winter heating scheme, certain limitations remain. The dataset was primarily derived from a student cohort at a university in Jiaozuo, Henan, which limits the representation of climate zones, building types, and demographic diversity. This may affect the model’s generalization capability in broader scenarios. Future work could involve collecting heterogeneous data across multiple climate zones and building types and utilizing transfer learning techniques to construct more adaptive models.
The PMV model is a physics-based heat-balance approach, primarily used to estimate thermal sensation under steady-state assumptions with representative values of metabolic rate and clothing insulation. In contrast, the machine-learning models developed in this study are trained to predict thermal comfort; although the two constructs are related, they are not equivalent. The PMV-related results are presented only as a reference to a conventional physical index and to highlight the potential of data-driven models for predicting more complex, preference-related outcomes, rather than to claim that PMV “underperforms” the proposed ML models on the same target. Establishing a rigorous and fair comparison framework between different constructs such as thermal sensation and thermal comfort remains an open problem. Future work will explore more advanced approaches to enable more principled cross-metric comparisons and interpretations.
Additionally, the proposed intelligent heating system relies on reliable multi-source data acquisition and transmission; its cost-effectiveness, user acceptance, and long-term stability in actual deployment require further verification.
5. Conclusions
Addressing the issue of imprecise regulation in the thermal environment of centralized heating buildings, this study provided a solution for intelligent thermal comfort prediction and control through experiments and data-driven modeling. The conclusions are as follows:
(1) A comprehensive dataset containing indoor air temperature, multi-site skin temperatures, heart rate, and systolic blood pressure was constructed through experiments. Three machine learning models—Support Vector Classification (SVC), K-Nearest Neighbors (KNN), and Random Forest (RF)—were systematically compared. The Random Forest model exhibited optimal performance, with a prediction accuracy exceeding 90%, significantly outperforming the other algorithms.
(2) The study identified that the Group 57 parameter combination (indoor air temperature, heart rate, systolic blood pressure, forehead temperature, cheek temperature, and dorsal hand temperature) performed optimally across all three machine learning models. This combination demonstrated high stability within the models.
(3) Under identical conditions, the prediction accuracy of the data-driven models established in this study comprehensively surpassed that of the traditional PMV model, with the optimal model showing a performance improvement of over 40%.
(4) Based on the aforementioned models, a system scheme integrating environmental sensors, wearable devices, and intelligent control valves was proposed.
Future research will explore model generalization, algorithmic interpretability, lightweight system deployment, and multi-modal comfort fusion to promote the practical application of these research findings.
Author Contributions
T.W.: Writing—review & editing, Supervision. W.H.: Writing—original draft, Writing—review & editing, Methodology, Visualization, Conceptualization. H.Y.: Writing—review & editing, Resources, Supervision, Conceptualization, Project administration. J.G.: Writing—review & editing, Methodology, Visualization, Conceptualization. Y.L.: Writing—review & editing. Y.G.: Writing—review & editing. All authors have read and agreed to the published version of the manuscript.
Funding
This research was supported by the National Natural Science Foundation of China (Grant No. 52378095), the Key Research Project Support Program for Higher Education Institutions in Henan Province (Grant No. 24A410001 and 26A410002), the International Science and Technology Cooperation Program of Henan Province (Grant No. 252102521004), and the Natural Science Foundation of Henan (Grant No. 252300423404).
Institutional Review Board Statement
This study did not involve any direct medical or psychological interventions on the participants. According to Article 32 of the Measures for Ethical Review of Life Sciences and Medical Research Involving Humans deliberated and adopted by the National Science and Technology Ethics Committee of the People’s Republic of China, ethical review may be exempted for research involving humans that uses human information data or biological samples under the following circumstances, provided it does not cause harm to the human body and does not involve sensitive personal information or commercial interests (original text available at: https://www.nhc.gov.cn/qjjys/c100016/202302/6b6e447b3edc4338856c9a652a85f44b.shtml, URL accessed on 10 February 2026). This study falls under such circumstances; therefore, formal ethical review approval was not required.
Informed Consent Statement
Informed consent has been obtained from all participants to publish the details and/or images contained in this manuscript. All data in the manuscript and in any public datasets have been anonymized to minimize the risk of identification, and the participants are aware that the article will be published in an open-access journal under a Creative Commons CC BY 4.0 license. (1) Consent for Minors: Minors were not included as participants in this study. (2) Data Anonymization: All content, relevant data, and images presented in the manuscript have been anonymized to the greatest extent possible. (3) Information Provided to Participants: Participants were fully informed about the purpose of this study, the potential risks and benefits of publication, and the consequences of disclosing their personal information. (4) Voluntary Participation: Participants were informed that their consent and participation in the publication of this research are entirely voluntary. They were made aware of their right to withdraw consent at any time. (5) Compliance with Local Laws: This study complies with local laws and regulations regarding informed consent and privacy protection. (6) The entire experimental process complied with the principles of the Declaration of Helsinki.
Data Availability Statement
Data associated with our study has been deposited into a publicly available repository. The dataset from this study has been stored in the Open Science Framework (OSF, https://osf.io) repository, with the access number https://doi.org/10.17605/OSF.IO/4B72C, (URL accessed on 9 February 2026).
Acknowledgments
The first draft of this study was entirely prepared manually by the author. Upon completion of the draft, Gemini 3.0 was used for partial language polishing and information proofreading. The authors have reviewed and edited the output and take fully responsible for the content of this publication
Conflicts of Interest
The authors declare no conflicts of interest.
Appendix A
To facilitate reproducibility and comparison, we evaluate classification performance using Accuracy, Precision, Recall, f1-score, and ROC–AUC. Suppose there are classes and the total number of test samples is . Let the confusion matrix be , where denotes the number of samples whose true class is but are predicted as class . For any class , we define the number of true positives (), false positives (), and false negatives () as follows:
(1) Accuracy
The overall Accuracy represents the proportion of correctly predicted samples across all classes:
(2) Precision and Recall (Class-wise)
For each individual class , Precisioni and Recalli are computed as:
(3) f1 score (Class-wise)
The f1i score is the harmonic mean of Precisioni and Recalli:
(4) Macro and Weighted Aggregation
To summarize performance under class imbalance, we employ two averaging strategies.
Macro-averaging assigns equal weight to each class:
Weighted-averaging weights each class by its support , where :
Given the class imbalance, we emphasize in our comparisons to ensure that performance on minority classes is adequately reflected.
(5) ROC–AUC (One-vs-Rest)
For multi-class classification, we adopt a one-vs-rest strategy. The True Positive Rate () and False Positive Rate () for class at threshold are defined as:
The Area Under the Curve for class () is calculated as:
The final reported is the average over the set of classes present in the test set, where :
Appendix B
Additional model performance metrics for the selected best feature combination are listed in Table A1.
Table A1.
Additional evaluation metrics for the optimal feature set on the test set.
Table A1.
Additional evaluation metrics for the optimal feature set on the test set.
| Model | Precision (Macro) | Recall (Macro) | Precision (Weighted) | Recall (Weighted) |
|---|---|---|---|---|
| SVC | 0.2563 | 0.2374 | 0.4262 | 0.5000 |
| KNN | 0.3721 | 0.3112 | 0.4924 | 0.4977 |
| RF | 0.5216 | 0.3590 | 0.5627 | 0.5724 |
Macro-averaging (equal weight for each class) and weighted-averaging (weighted by sample size per class).
To more comprehensively characterize the discriminative ability of the models in a multi-class task, we plotted ROC curves for SVC, kNN, and RF using a one-vs-rest (OvR) strategy under the selected best feature group and the same test-set split (see Figure A1), and reported the AUC for each class. It should be noted that, because class −3 has zero samples in the independent test set (see the class distribution table in the main text), the ROC/AUC for this class is not defined on the test set and was therefore automatically skipped in the OvR plotting. Overall, the three models show relatively strong discrimination for class 0 (AUC ≈ 0.92–0.98), whereas their discrimination for minority classes (e.g., −2) is weaker (AUC ≈ 0.49–0.63), which is consistent with the imbalanced class distribution and the limited sample size of minority classes. These ROC results are provided to supplement the class-wise discriminative differences among the models.

Figure A1.
ROC Curves of 3 models. The three subfigures show the ROC curves of different models ((a). kNN; (b). RF; (c). SVC), used to compare the classification performance for each class; the closer a curve is to the upper-left corner, the better the model distinguishes that class, while the pink dashed line indicates the chance level for random classification.

Appendix C
The key hyperparameters of the three classifiers were specified as follows. For SVC, an RBF kernel was used (kernel = “rbf”), with probability = probability = False, and the random seed was fixed (random_state = 42); other SVC parameters were kept at their default values. For KNN, the number of neighbors was set to n_neighbors = 5; other parameters (e.g., distance metric and neighbor weighting) followed default settings. For RF, the number of trees was set to n_estimators = 300, with random_state = 42 and n_jobs = −1; remaining parameters (e.g., max_depth, max_features, and min_samples_split) were left as defaults. In addition, input features were standardized for SVC and KNN using z-score normalization, while RF was trained without requiring feature scaling. Unless otherwise stated, all unspecified hyperparameters followed the default configuration of the adopted implementation.
Appendix D
The PMV-calculated thermal sensation indices are reported in Table A2.
Table A2.
Thermal sensation voting scale.
Table A2.
Thermal sensation voting scale.
| Very Hot | Hot | Warm | Netural | Cool | Cold | Very Cold |
|---|---|---|---|---|---|---|
| +3 | +2 | +1 | 0 | −1 | −2 | −3 |
References
- Global Alliance for Buildings and Construction. Global Status Report for Buildings and Construction; International Energy Agency, UN Environment: Paris, France, 2020; p. 19. [Google Scholar]
- Huo, T.; Ren, H.; Zhang, X.; Cai, W.; Feng, W.; Zhou, N.; Wang, X. China’s energy consumption in the building sector: A Statistical Yearbook-Energy Balance Sheet based splitting method. J. Clean. Prod. 2018, 185, 665–679. [Google Scholar] [CrossRef]
- Yang, Z.; Dong, X.; Xiao, H.; Sun, H.; Wang, B.; Shi, W.; Li, X. Investigation of thermal comfort of room air conditioner during heating season. Build. Environ. 2022, 207, 108544. [Google Scholar] [CrossRef]
- Su, C.; Madani, H.; Palm, B. Heating solutions for residential buildings in China: Current status and future outlook. Energy Convers. Manag. 2018, 177, 493–510. [Google Scholar] [CrossRef]
- Ma, S.; Guo, S.; Zheng, D.; Chang, S.; Zhang, X. Roadmap towards clean and low carbon heating to 2035: A provincial analysis in northern China. Energy 2021, 225, 120164. [Google Scholar] [CrossRef]
- Fanger, P.O. Thermal Comfort Analysis and Application in Environmental Engineering; Danish Technical Press: Copenhagen, Demark, 1970. [Google Scholar]
- de Dear, R.J.; Brager, G.S. Thermal comfort in naturally ventilated buildings: Revisions to ASHRAE standard 55. Energy Build. 2002, 34, 549–561. [Google Scholar] [CrossRef]
- Broday, E.E.; Moreto, J.A.; de Paula Xavier, A.A.; de Oliveira, R. The approximation between thermal sensation votes (OTS) and predicted mean vote (PMV): A comparative analysis. Int. J. Ind. Ergon. 2019, 69, 1–8. [Google Scholar] [CrossRef]
- van Hoof, J. Forty years of Fanger’s model of thermal comfort: Comfort for all? Indoor Air 2008, 18, 182–201. [Google Scholar] [CrossRef]
- Auffenberg, F.; Stein, S.; Rogers, A. A personalised thermal comfort model using a Bayesian Network. In Proceedings of the Twenty-Fourth International Joint Conference on Artificial Intelligence, Buenos Aires, Argentina, 25–31 July 2015; pp. 2547–2553. [Google Scholar]
- Nicol, F. Adaptive thermal comfort standards in the hot–humid tropics. Energy Build. 2004, 36, 628–637. [Google Scholar] [CrossRef]
- Bouden, C.; Ghrab, N. An adaptive thermal comfort model for the Tunisian context: A field study results. Energy Build. 2005, 37, 952–963. [Google Scholar] [CrossRef]
- Kim, J.T.; Lim, J.H.; Cho, S.H.; Yun, G.Y. Development of the adaptive PMV model for improving prediction performances. Energy Build. 2015, 98, 100–105. [Google Scholar] [CrossRef]
- Dahlan, N.D.; Gital, Y.Y. Thermal sensations and comfort investigations in transient conditions in tropical office. Appl. Ergon. 2016, 54, 169–176. [Google Scholar] [CrossRef]
- de Dear, R.J. Global database of thermal comfort field experiments. ASHRAE Trans. 1998, 104, 1141. [Google Scholar]
- de Dear, R.J.; Brager, G.S.; Cooper, D. Developing an adaptive model of thermal comfort and preference—Final report on RP-884. ASHRAE Trans. 1997, 104, 291. [Google Scholar]
- Yang, B.; Li, X.; Liu, Y.; Chen, L.; Guo, R.; Wang, F.; Yan, K. Comparison of models for predicting winter individual thermal comfort based on machine learning algorithms. Build. Environ. 2022, 215, 108970. [Google Scholar] [CrossRef]
- Schweiker, M.; Schakib-Ekbatan, K.; Fuchs, X.; Becker, S. A seasonal approach to alliesthesia. Is there a conflict with thermal adaptation? Energy Build. 2020, 212, 109745. [Google Scholar] [CrossRef]
- Wang, Z.; Wang, J.; He, Y.; Liu, Y.; Lin, B.; Hong, T. Dimension analysis of subjective thermal comfort metrics based on ASHRAE Global Thermal Comfort Database using machine learning. J. Build. Eng. 2020, 29, 101120. [Google Scholar] [CrossRef]
- Zhao, Q.; Lyu, J.; Du, H.; Lian, Z.; Zhao, Z. Gender differences in thermal sensation and skin temperature sensitivity under local cooling. J. Therm. Biol. 2023, 111, 103401. [Google Scholar] [CrossRef]
- Luo, M.; Wang, Z.; Zhang, H.; Arens, E.; Filingeri, D.; Jin, L.; Ghahramani, A.; Chen, W.; He, Y.; Si, B. High-density thermal sensitivity maps of the human body. Build. Environ. 2020, 167, 106435. [Google Scholar] [CrossRef]
- ISO International Standard 7726-2001; Ergonomics of the Thermal Environment Instruments for Measuring Physical Quantities. International Organization for Standardization: Geneva, Switzerland, 2001; pp. 2–49.
- ASHRAE Standard 55-2020; Thermal Environmental Conditions for Human Occupancy. American Society of Heating, Refrigerating and Air Conditioning Engineers: Atlanta, GA, USA, 2020; pp. 5–21.
- ISO International Standard 7730-2005; Moderate Thermal Environments—Determination of the PMV and PPD Indices and Specification of the Conditions for Thermal Comfort. International Organization for Standardization: Geneva, Switzerland, 2005; pp. 2–26.
- GB/T 50785-2012; Evaluation Standard for Indoor Thermal Environment in Civil Buildings. China Architecture & Building Press: Beijing, China, 2012.
- Mccullough, E.A.; Olesen, B.W.; Hong, S. Thermal insulation provided by chairs. ASHRAE Trans. 1994, 100, 795–802. [Google Scholar]
- Guo, G.; Wang, H.; Bell, D.; Bi, Y.; Greer, K. KNN model-based approach in classification. In On the Move to Meaningful Internet Systems 2003: CoopIS, DOA, and ODBASE; Meersman, R., Tari, Z., Schmidt, D.C., Eds.; Springer: Berlin/Heidelberg, Germany, 2003; pp. 986–996. [Google Scholar] [CrossRef]
- Jiang, L.; Zhang, H.; Cai, Z. A novel bayes model: Hidden naive bayes. IEEE Trans. Knowl. Data Eng. 2008, 21, 1361–1371. [Google Scholar] [CrossRef]
- Kingsford, C.; Salzberg, S.L. What are decision trees? Nat. Biotechnol. 2008, 26, 1011–1013. [Google Scholar] [CrossRef] [PubMed]
- Noble, W.S. What is a support vector machine? Nat. Biotechnol. 2006, 24, 1565–1567. [Google Scholar] [CrossRef] [PubMed]
- Mor, B.; Garhwal, S.; Kumar, A. A Systematic Review of Hidden Markov Models and Their Applications. Arch. Comput. Methods Eng. 2021, 28, 1429–1448. [Google Scholar] [CrossRef]
- Liu, T.; Jin, L.; Zhong, C.; Xue, F. Study of thermal sensation prediction model based on support vector classification (SVC) algorithm with data preprocessing. J. Build. Eng. 2022, 48, 103919. [Google Scholar] [CrossRef]
- Xiong, L.; Yao, Y. Study on an adaptive thermal comfort model with K-nearest-neighbors (KNN) algorithm. Build. Environ. 2021, 202, 108026. [Google Scholar] [CrossRef]
- Ren, J.; Zhang, R.; Cao, X.; Kong, X. Experimental study on the physiological parameters of occupants under different temperatures and prediction of their thermal comfort using machine learning algorithms. J. Build. Eng. 2024, 84, 108676. [Google Scholar] [CrossRef]
- Breiman, L. Random Forests. Mach. Learn. 2001, 45, 5–32. [Google Scholar] [CrossRef]
- Svetnik, V.; Liaw, A.; Tong, C.; Culberson, J.C.; Sheridan, R.P.; Feuston, B.P. Random Forest: A Classification and Regression Tool for Compound Classification and QSAR Modeling. J. Chem. Inf. Comput. Sci. 2003, 43, 1947–1958. [Google Scholar] [CrossRef]
- Hastie, T.; Tibshirani, R.; Friedman, J. The Elements of Statistical Learning; Springer: Berlin/Heidelberg, Germany, 2009. [Google Scholar] [CrossRef]
- Ghahramani, A.; Tang, C.; Becerik-Gerber, B. An online learning approach for quantifying personalized thermal comfort via adaptive stochastic modeling. Build. Environ. 2015, 92, 86–96. [Google Scholar] [CrossRef]
- Daum, D.; Haldi, F.; Morel, N. A personalized measure of thermal comfort for building controls. Build. Environ. 2011, 46, 3–11. [Google Scholar] [CrossRef]
- Rana, R.; Kusy, B.; Jurdak, R.; Wall, J.; Hu, W. Feasibility analysis of using humidex as an indoor thermal comfort predictor. Energy Build. 2013, 64, 17–25. [Google Scholar] [CrossRef]
- Fountain, M.; Brager, G.; de Dear, R. Expectations of indoor climate control. Energy Build. 1996, 24, 179–182. [Google Scholar] [CrossRef]
- Humphreys, M.A.; Nicol, J.F. The validity of ISO-PMV for predicting comfort votes in every-day thermal environments. Energy Build. 2002, 34, 667–684. [Google Scholar] [CrossRef]
- Takada, S.; Matsumoto, S.; Matsushita, T. Prediction of whole-body thermal sensation in the non-steady state based on skin temperature. Build. Environ. 2013, 68, 123–133. [Google Scholar] [CrossRef]
- González-Alonso, J. Human thermoregulation and the cardiovascular system. Exp. Physiol. 2012, 97, 340–346. [Google Scholar] [CrossRef]
- Havenith, G.; Holmér, I.; Parsons, K. Personal factors in thermal comfort assessment: Clothing properties and metabolic heat production. Energy Build. 2002, 34, 581–591. [Google Scholar] [CrossRef]
- Ji, W.; Luo, M.; Cao, B.; Zhu, Y.; Geng, Y.; Lin, B. A new method to study human metabolic rate changes and thermal comfort in physical exercise by CO2 measurement in an airtight chamber. Energy Build. 2018, 177, 402–412. [Google Scholar] [CrossRef]
- Chaudhuri, T.; Soh, Y.C.; Li, H.; Xie, L. Machine learning driven personal comfort prediction by wearable sensing of pulse rate and skin temperature. Build. Environ. 2020, 170, 106615. [Google Scholar] [CrossRef]
- Li, W.; Zhang, J.; Zhao, T.; Liang, R. Experimental research of online monitoring and evaluation method of human thermal sensation in different active states based on wristband device. Energy Build. 2018, 173, 613–622. [Google Scholar] [CrossRef]


Disclaimer/Publisher’s Note: The statements, opinions and data contained in all publications are solely those of the individual author(s) and contributor(s) and not of MDPI and/or the editor(s). MDPI and/or the editor(s) disclaim responsibility for any injury to people or property resulting from any ideas, methods, instructions or products referred to in the content. |
© 2026 by the authors. Licensee MDPI, Basel, Switzerland. This article is an open access article distributed under the terms and conditions of the Creative Commons Attribution (CC BY) license.