Abstract
For less-developed, carbon-dependent regions, achieving carbon decoupling while pursuing economic catch-up presents a fundamental challenge. This study investigates this persistent dilemma through the case of Jiangxi Province, China, a typical coal-reliant inland region. Utilizing data from 2000 to 2022, we estimate carbon emissions following IPCC guidelines and employ the Generalized Divisia Index Method (GDIM) to decompose emission drivers, effectively overcoming the limitation of factor independence in conventional decomposition analyses. The results identify economic scale (cumulative contribution: 97.81%) and energy consumption (51%) as the primary drivers of emission growth, while carbon intensity of output (−47.38%) emerges as the strongest inhibiting factor. The application of the Tapio decoupling model reveals that weak decoupling is the dominant state, prevailing in 91% of the study period. This persistent pattern underscores only a partial and unstable separation between economic growth and emissions, highlighting the region’s entrenched carbon lock-in. Our findings demonstrate that transcending this weak decoupling dilemma necessitates a strategic shift beyond efficiency gains. We propose that the resolution lies in accelerating structural transitions within the energy system and fostering low-carbon industrial upgrading. This study not only elucidates the dynamics of the carbon decoupling challenge in catch-up regions but also offers actionable and context-specific pathways, providing a valuable reference for analogous regions, particularly in developing and transition economies.
1. Introduction
The global imperative to decouple economic growth from carbon emissions presents a formidable challenge, particularly for less-developed regions striving for economic catch-up while adhering to carbon mitigation targets. As the world’s largest emitter, China’s commitment to achieving peak carbon by 2030 and neutrality by 2060 necessitates differentiated strategies across its diverse regional landscape. While affluent coastal provinces may leverage financial and technological advantages for a green transition, the pathway for less-developed inland regions remains profoundly challenging. These areas often face a “dual dilemma”: they are burdened with carbon-intensive industrial structures, frequently inherited from inter-regional industrial transfers, and constrained by limited capacity for clean energy investment and innovation. This challenge is also observed in many other developing and transition economies, including transition economies in Eastern Europe, rapidly industrializing nations in Southeast Asia, and resource-dependent countries in Latin America, face similar tensions between development and decarbonization. It is within this critical and comparative context that our study examines Jiangxi Province, a typical representative of central China’s underdeveloped regions, whose coal-dominated energy profile and ongoing industrialization make it a compelling case for investigating the dynamics and decoupling potential of carbon emissions (Tang and Li 2022 [1]; Tang and Luo [2]).
Extensive research has been conducted to identify the driving forces behind carbon emissions, with index decomposition analysis being a predominant methodology. Since its initial application in energy studies in the late 1970s (Ang and Zhang 2000) [3], methods like the Logarithmic Mean Divisia Index (LMDI) have been widely adopted due to their properties of complete decomposition and absence of residuals (Zheng and Xu 2012 [4]; Wang and Yu 2019 [5]). Numerous scholars have applied these techniques at national, regional, and industrial levels (Shao and Cui 2024 [6]; Shao et al., 2017 [7]; Wang et al., 2025 [8]; Wan et al., 2025 [9,10]). However, the conventional LMDI method suffers from a significant limitation: it relies on the assumption of factor independence, which can lead to biased results when analyzing the complex, interrelated drivers within a socio-economic system (Vaninsky 2013) [11]. To address this, the Generalized Divisia Index Method (GDIM) was developed, capable of handling correlations between factors and providing a more robust decomposition framework (Vaninsky 2014) [12]. Although GDIM has been applied in studies focusing on national aggregates or specific sectors (Yan and Yin 2017 [13]; Hao and Wang 2024 [14]), its application to the context of a single, less-developed province remains scarce. Moreover, while the Tapio decoupling model has been effectively used alongside decomposition techniques to explore the relationship between economic growth and emissions (Guo et al., 2025 [15]; Yan and Li 2023 [16]; Dong and Li 2025 [17]), most studies on less-developed areas either lack this combined analytical depth or fail to articulate the specific policy implications arising from the unique socio-economic and resource constraints of these regions, particularly from the perspective of induced technological change and carbon lock-in mechanisms.
Furthermore, recent years have witnessed a growing body of research on carbon emission decoupling across various Chinese regions, such as the Hu-Bao-O-Yu City Cluster (Zhou et al., 2024 [18]), the national scale (Ji et al., 2023) [19], and the agricultural sector in the Beijing–Tianjin–Hebei region (Liang et al., 2024) [20]. Du et al. (2022) [21] develops a novel hybrid Trigonometric Envelopment Analysis for Ideal Solutions (TEA-IS) model to assess the ecological efficiency of 248 Chinese cities for a 14-year period and employs a difference-in-difference approach to reveal the mechanism of the impact of low-carbon pilot city policies on ecological efficiency from the perspective of green technology innovation. These studies, from different dimensions, reveal the complex relationship between carbon emissions and economic growth. However, a conspicuous research gap exists. There is an urgent need for a nuanced analysis that not only employs advanced decomposition methods like GDIM to accurately unravel the emission drivers in less-developed regions but also integrates decoupling analysis to assess progress and inform tailored, feasible policy pathways. Jiangxi Province serves as an ideal subject to fill this gap. Its economic structure, reliance on coal, and status as a developing region in central China make it a microcosm of the challenges faced by many similar economies worldwide, particularly in understanding how path-dependent technological trajectories and structural rigidities hinder the transition to low-carbon systems.
Based on this, the marginal contributions of this paper are threefold:
- (1)
- Methodologically, it pioneers the application of the GDIM framework to a single, less-developed province (Jiangxi). This approach captures the interconnected effects of driving factors (e.g., between economic scale, energy structure, and efficiency), overcoming the factor-independence limitation of LMDI and yielding more reliable insights.
- (2)
- Empirically, it provides a comprehensive, long-term (2000–2022) analysis of emission drivers and decoupling states in a typical catch-up region. It moves beyond identifying drivers to critically examine the persistence of “weak decoupling,” highlighting the tension between growth imperatives and emission constraints within a carbon-locked system.
- (3)
- Policy-wise, it translates findings into actionable, context-specific recommendations grounded in Jiangxi’s coal dependence and developmental stage. The proposed roadmap, emphasizing structural over merely efficiency-focused changes, offers a realistic reference for policymakers in analogous regions.
The remainder of this paper is structured as follows: Section 2 details the research methodology, including carbon emission accounting, the GDIM model, and the Tapio decoupling index. Section 3 presents the empirical results, featuring a decomposition analysis of driving factors and an assessment of the decoupling relationship. Section 4 discusses the findings, derives policy implications, and acknowledges the study’s limitations while suggesting directions for future research.
2. Research Methods and Data Sources
2.1. Research Methods
2.1.1. Measurement Methods of Carbon Emissions
According to the calculation method provided in the 2006 IPCC guidelines for na-tional greenhouse gas inventories, this paper based on Office Excel 2019 software calculates the total carbon emissions from energy consumption. The formula is as follows:
where C is the total carbon emission, measured in 10,000 tons; Ei refers to the consumption of the i-th energy, measured in 10,000 tons of standard coal; represents the carbon emission coefficient of the i-th energy, measured in tons of carbon/tons of standard coal.
In this paper, the carbon emissions of coal, crude oil, natural gas and electric power consumption in Jiangxi Province from 2000 to 2022 were calculated, respectively, and then the total energy carbon emissions were calculated. The carbon emission factors of various energy sources are shown in Table 1.

Table 1.
Carbon Emission Coefficient of Various Energy Sources.
2.1.2. GDM Decomposition Model
This article, based on the basic principles of the GDIM and referring to the research of Yan Qingyou decomposes the energy carbon emissions in Jiangxi Province into the following equation:
The definition of each variable (X1 to X8) used in the GDIM decomposition is provided in Table 2, which includes their meanings and units, to enhance clarity for readers unfamiliar with the notation.
Table 2.
Variable Definition Table.
The eight variables (X1 to X8) selected in this study are derived from the extended Kaya identity framework and reflect the core driving forces of carbon emissions within the socio-economic system. Gross domestic product (X1) and population (X5) represent scale effects, whereas energy consumption (X3) is directly associated with economic activity and resource utilization. Carbon intensity (X2, X4), energy intensity (X8), and per capita carbon emissions (X6) capture technological efficiency and structural characteristics. Per capita GDP (X7), as a derived indicator, reflects the level of economic affluence. This set of variables enables the GDIM model to effectively capture inter-variable interactions, particularly the endogenous relationship between economic scale (X1) and energy consumption (X3), thereby mitigating potential biases arising from the assumption of factor independence inherent in traditional LMDI methods. In energy-intensive regions such as Jiangxi, this correlation is especially significant, facilitating a more accurate identification of the structural drivers underlying carbon lock-in.
Further transform Formulas (2)–(4) into the following form:
The function C(X) represents the driving contribution of factor X to carbon emissions. Calculate the first-order partial derivative according to Equation (5), and construct the Jacobian matrix φ(X), which represents the impact of various factors on carbon emissions:
According to the decomposition principle of GDIM model, the contribution of the above factors is aggregated to express the overall carbon emission change of Jiangxi Province, ∆C:
where L is the time span, ; I is the identity matrix; “+” indicates the generalized inverse matrix; If the column vector of the Jacobian matrix φ(X) is linearly independent, then
Changes in carbon emissions can be decomposed into the sum of eight effects: ∆X1, ∆X3, ∆X5, ∆X2, ∆X4, ∆X6, ∆X7, ∆X8. Where ∆X1, ∆X3 and ∆X5 are absolute quantities, which, respectively, reflect the impact of economic development level, energy consumption and population size change on energy consumption and carbon emissions in Jiangxi Province; The other five effects are relative quantity factors, which, respectively, represent the impact of carbon emissions per unit of GDP, carbon emissions per unit of energy consumption, per capita carbon emissions, per capita GDP and energy consumption per unit of GDP on carbon emissions.
2.1.3. Decoupling Index Model
After an in-depth study of the carbon emission situation in Jiangxi Province from 2000 to 2022, we further explored the decoupling status of carbon emissions in Jiangxi Province. Currently, the Tapio decoupling index model has been widely applied in the field of carbon emission research. It can effectively demonstrate the relationship between economic development and carbon emissions and reveal the decoupling status between the two. The model creatively improves the accuracy and objectivity of the decoupling relationship measurement by introducing the decoupling elasticity coefficient. In addition, it also makes a more detailed classification of the decoupling status, making it easier to understand and analyze more precisely. The specific Tapio index model formula is as follows:
where t represents the decoupling elasticity coefficient between carbon emissions from energy consumption and economic development; is the difference between the current carbon emissions and the base period; C stands for carbon emissions in the base period; represents the difference between current GDP and base period; G stands for base period GDP.
According to different elasticity coefficients, we can classify decoupling relationships into eight different decoupling levels, the specific content and classification of which can be found in detail in Table 3. Among these levels, strong decoupling (∆C < 0, ∆G > 0, t < 0) represents the most ideal state for achieving a low-carbon economy, meaning that while the economy continues to grow, carbon emissions are decreasing; conversely, strong negative decoupling (∆C > 0, ∆G < 0, t < 0) represents the least desirable situation. When GDP maintains a continuous growth trend (∆G/G > 0), the smaller the decoupling elasticity coefficient, the more pronounced the decoupling phenomenon. Therefore, pursuing a state of strong decoupling should be the ultimate goal for developing a low-carbon economy.
Table 3.
Tapio Decoupling Elasticity Model.
The combined application of decomposition and decoupling models has proven effective in regional carbon studies. For instance, Guan (2023) [22] employed an extended LMDI with the Tapio model in the Beijing–Tianjin–Hebei region, while Ding et al. (2023) [23] investigated the decoupling effect and driving factors in the urban agglomeration of the Middle Yangtze River. This study adopts the GDIM, which, by effectively handling factor correlations (Vaninsky, 2014) [12], offers a superior capability to capture the interconnected driving mechanisms within complex systems. This is particularly pertinent for regions like Jiangxi, characterized by a monolithic energy structure and strong developmental path dependence.
2.2. Data Source
This paper selects the data of Jiangxi Province from 2000 to 2022, such as regional GDP, total energy consumption (coal, crude oil, natural gas, electricity), and population size data from Jiangxi statistical yearbook and China energy statistical yearbook. The carbon emission accounting method and carbon emission coefficient refer to the 2006 IPCC guidelines for national greenhouse gas inventories. It should be noted that this accounting covers direct emissions from fossil fuel combustion and electricity consumption (using a grid-average emission factor), but excludes indirect emissions embedded in trade or from non-energy industrial processes. While this is standard for many regional studies, the results should be interpreted within this boundary.
3. Empirical Results and Analysis
3.1. Decomposition Analysis of Carbon Emission Change and Carbon Emission Driving Factors
Having established the methodological framework, we now present the empirical results. We first trace the trajectory of carbon emissions and economic growth in Jiangxi, setting the stage for the decomposition and decoupling analyses that follow. These analyses are designed to test our core proposition: whether and why a state of ‘weak decoupling’ and ‘carbon lock-in’ prevails in such a catch-up economy.
The persistent dominance of economic scale and energy consumption as primary drivers, coupled with the only partial inhibitory effect of carbon intensity, reflects a deeper path dependency inherent in Jiangxi’s development model. As a less-developed region, Jiangxi’s economy remains locked into a carbon-intensive trajectory, characterized by reliance on established industrial structures and energy systems—a phenomenon aligned with the theory of technological lock-in. This lock-in effect is reinforced by the ongoing industrialization and urbanization processes, which create rigid demand for energy-intensive infrastructure and delay the structural shifts necessary for strong decoupling. The findings resonate with the Environmental Kuznets Curve (EKC) hypothesis, suggesting that Jiangxi may still be positioned on the upward slope of the curve, where economic growth continues to drive environmental pressure. The absence of a turning point toward strong decoupling indicates that income-induced technological and structural changes have not yet overcome the scale effect of growth.
Based on the consumption data of the four primary energy types in Jiangxi Province from 2000 to 2022, and referring to the carbon emission factors for various types of energy listed in Table 1, we can use Formula (1) to conduct precise calculations, thereby determining the carbon emissions generated by energy consumption. These calculation results are shown in detail in Figure 1.
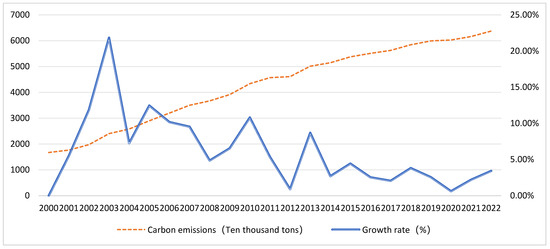
Figure 1.
Carbon Emissions and Growth Rate of Energy Consumption in Jiangxi Province from 2000 to 2022. Note: The left vertical axis represents carbon emissions (in 10,000 tons), and the right vertical axis shows the annual growth rate (in percentage). Data source: Jiangxi Statistical Yearbook and China Energy Statistical Yearbook.
As shown in Figure 1, the carbon emissions from energy consumption in Jiangxi Province have shown a continuous upward trend from 16.72 million tons in 2000 to 63.73 million tons in 2022, an increase of approximately 281%, with an average annual growth rate of about 6.0%. Carbon emissions reached an all-time high in 2022. Notably, the annual growth rate of emissions exhibited a general declining trend, especially slowing down significantly from 2014 onward. At the same time, combining the analysis from Figure 2, we can observe that with the strong support of the Central Soviet Area Revitalization Development Strategy and other policies, Jiangxi’s economic growth has been quite rapid in the past few years. Specifically, Jiangxi’s GDP has grown from 200.307 billion yuan in 2000 to 320.7472 billion yuan in 2022, showing that Jiangxi is accelerating its economic development and vigorously promoting the urbanization process. However, in terms of the growth rate of carbon emissions, there has been a general trend of decline, especially from 2014 to 2022, when the growth rate of carbon emissions significantly slowed down. This trend may be associated with Jiangxi’s active response to the national environmental protection strategy since the “13th Five-Year Plan” and the proposal of the provincial environmental protection strategy of “scientific development, catch-up and surpass, green rise”. Based on the above analysis, we can conclude that energy consumption carbon emissions are largely related to the level of economic development in the region. In other words, the higher the level of economic development, the greater the energy consumption carbon emissions. At the same time, to achieve effective reduction of energy carbon emissions, it is closely linked to the implementation of supportive policies. Therefore, in-depth research on the decoupling relationship between carbon emissions and economic growth is of great significance for controlling carbon emissions and achieving sustainable development.
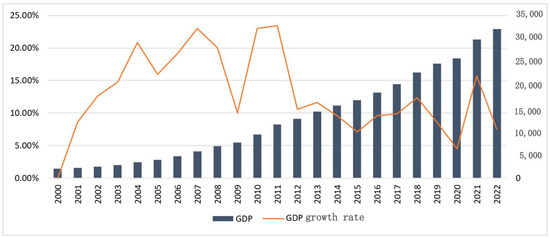
Figure 2.
Jiangxi Province GDP and Growth Rate from 2000 to 2022. Note: The left vertical axis represents GDP (in billion yuan), and the right vertical axis shows the annual growth rate (in percentage). Data source: Jiangxi Statistical Yearbook.
Concurrently, as depicted in Figure 2, Jiangxi’s GDP grew rapidly from 200.3 billion yuan in 2000 to 3207.5 billion yuan in 2022, indicating accelerated economic development and urbanization. The co-evolution of rising GDP and rising carbon emissions, albeit with a slowing emission growth rate, suggests a persistent linkage between economic scale and environmental pressure. The slowdown post-2014 may be associated with enhanced environmental policies during the “13th Five-Year Plan” period. Therefore, in-depth research on the decoupling relationship is crucial.
From Table 4, the level of economic development, namely Gross Domestic Product (GDP, X1), has the highest cumulative contribution rate (97.81%). This underscores the fundamental dilemma confronting underdeveloped inland provinces such as Jiangxi. From the perspective of catch-up development, this reflects an investment-driven growth model reliant on physical capital accumulation, generating significant scale effects and leading to carbon lock-in. Jiangxi remains in a stage of rapid industrialization and urbanization, where growth is heavily tied to infrastructure and secondary sector expansion, inevitably sustaining increases in energy use and emissions. The overwhelming dominance of economic scale, with a cumulative contribution of 97.81%, supports the hypothesis of an upward trajectory along the Environmental Kuznets Curve (EKC), indicating that Jiangxi Province remains in a development phase primarily driven by scale effects. Following closely is energy consumption (E, X3), with its cumulative contribution rate at 51%. This confirms that economic scale and energy consumption are the two primary drivers of emission growth in Jiangxi. Specifically, regarding the situation in Jiangxi Province from 2011 to 2022, we can see that the contribution rate of GDP to carbon emissions has remained positive but has shown a gradual downward trend. Similarly, the contribution rate of energy consumption has also shown a declining trend. This reflects that although Jiangxi Province has relatively abundant resources, it is relatively backward in terms of industrial level and economic development in the central region, lacking emerging industries, and therefore has a high dependence on energy. This structural dependence is further reinforced by the nature of inherited industrial transfers, which often relocate energy-intensive processes to less-developed regions, creating a structural inertia that is difficult to reverse. Despite the rapid economic growth of Jiangxi Province, the resulting carbon emissions are also quite significant. Therefore, achieving decoupling remains a significant challenge for the future.
Table 4.
Contribution Rates of Various Factors Affecting Carbon Emissions in Jiangxi Province from 2001 to 2022.
In contrast, the cumulative contribution rates of carbon intensity of output (C/GDP, X2: −47.38%), carbon intensity of energy consumption (C/E, X4: −3.98%), and energy intensity (E/GDP, X8: −2.58%) are all negative, indicating inhibitory effects. The pronounced effect of X2 reflects the crucial role of production technology progress and the application of low-carbon technologies in curbing emissions, aligning with the theory of induced technological change focused on efficiency improvements within the existing paradigm. Among these indicators, the inhibitory effect of carbon intensity of output (C/GDP) is particularly pronounced, with its cumulative contribution rate reaching −47.38%. The significant inhibitory effect of carbon intensity (−47.38%) supports the theory of induced technological change, which posits that policy-driven pressures stimulate improvements in efficiency. However, this pattern of “incremental improvement” has not overcome the structural inertia within the energy system, indicating that, in a carbon-locked context, reliance on technological efficiency alone is insufficient to achieve strong decoupling. This data reflects that in the process of economic development, continuous progress in production technology and the widespread application of low-carbon technologies play a crucial role in curbing carbon emissions. This pattern aligns with the theory of induced technological change, where efforts tend to focus on improving efficiency within the existing technological paradigm (e.g., reducing carbon per unit of output) rather than fostering radical shifts in the energy base itself. This further indicates that technological progress is a key factor in solving the problem of carbon emissions. Therefore, for Jiangxi Province, actively supporting and promoting the development of low-carbon technologies and pursuing continuous progress in production technology is the only way to meet the challenges of carbon emissions.
The impact of population size (X5) and per capita carbon emissions (X6) is also significant, with cumulative contributions of 2.97% and 45.00%, respectively. The high contribution of X6 suggests that, alongside rapid urbanization, high-energy-consumption lifestyles may still prevail, highlighting an area for behavioral and demand-side interventions.
The persistent dominance of economic scale and energy consumption as primary drivers, coupled with the only partial inhibitory effect of carbon intensity, reflects a deeper path dependency inherent in Jiangxi’s development model—a phenomenon aligned with the theory of technological lock-in. This lock-in effect is reinforced by ongoing industrialization and urbanization. The findings resonate with the Environmental Kuznets Curve (EKC) hypothesis, suggesting that Jiangxi may still be positioned on the upward slope of the curve, where economic growth continues to drive environmental pressure. The absence of a turning point toward strong decoupling indicates that income-induced technological and structural changes have not yet overcome the scale effect of growth.
Note on Variable X7 in Results Presentation: It is important to clarify that variable X7 (GDP per capita) is not independently listed in the subsequent decomposition results table (Table 4). This is because X7 is a deterministic function of X1 (GDP) and X5 (Population) (X7 = X1/X5). Within the GDIM framework, when perfect functional relationships exist between factors, the contribution of a derived variable (X7) is fully captured and explained by its parent variables (X1 and X5). Presenting it separately could lead to misleading interpretation due to multicollinearity. Therefore, the effects related to per capita affluence are inherently embedded within the contributions of economic scale (X1) and population (X5).
3.2. Analysis of Carbon Emission Decoupling Effect
The persistent prevalence of “weak decoupling,” as opposed to a transition toward “strong decoupling,” can be interpreted through the lens of institutional and technological path dependence. While technological progress—evidenced by declining carbon intensity—has effectively moderated the rate of emissions growth, the entrenched carbon lock-in of Jiangxi’s coal-dominated energy system imposes structural constraints that hinder a full decoupling. This is further compounded by the region’s limited institutional capacity and policy tools to catalyze a fundamental energy transition. In contrast to provinces endowed with abundant hydropower resources, such as Yunnan and Sichuan, Jiangxi’s natural resource endowment limits its clean energy alternatives, reinforcing a dependency on coal. Under such conditions, incremental improvements in energy efficiency face diminishing marginal returns, making it difficult to escape the “weak decoupling” trap without systemic change. To further examine the sustainability of weak decoupling, this study analyzes the research period by segmenting it into distinct policy phases—from the 11th to the 14th Five-Year Plan. The findings indicate that during the 13th Five-Year Plan (2016–2020), the contribution of energy consumption (X3) declined relative to earlier periods, while the restraining effect of carbon intensity (X2) intensified, suggesting that energy efficiency policies began to take effect. Nevertheless, the contribution of economic scale (X1) remained persistently high, reflecting structural inertia in the prevailing growth model. This pattern—where efficiency gains fail to offset the expansion of economic scale—represents a typical manifestation of the carbon lock-in effect and elucidates why decoupling has remained in a “weak” state throughout the study period.
According to the Tapio decoupling index model and in combination with Table 3, the decoupling elasticity value t of energy consumption carbon emissions and economic development in Jiangxi Province can be calculated, and the decoupling status can be analyzed. The calculation results are shown in Table 5.
Table 5.
Decoupling Index between Energy Consumption Carbon Emissions and Economic Development in Jiangxi Province from 2001 to 2022.
From Table 5 and Figure 3, it can be seen that the decoupling relationships include three types: weak decoupling, expansive connection, and expansive negative decoupling. Weak decoupling is overwhelmingly dominant, occurring in 20 out of 22 periods (91%). An expansive connection occurred in 2002, and an expansive negative decoupling occurred in 2003. The overall decoupling index shows a downward trend, especially from 2013 to 2021, indicating a general improvement in the decoupling effort, though the state remains “weak.” Analyzing the reasons, during the “12th Five-Year Plan” and “13th Five-Year Plan” periods, the government increased the implementation of energy conservation and emission reduction policies, and the optimization of industrial structure achieved certain results, improving resource utilization efficiency.
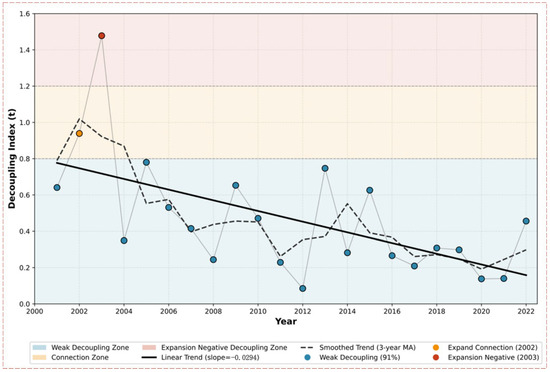
Figure 3.
Trend of Decoupling Index in Jiangxi Province from 2001 to 2022. Note: The decoupling index (t) is calculated as the ratio of the growth rate of carbon emissions to that of GDP. Data source: Authors’ calculation based on Jiangxi Statistical Yearbook.
This persistent prevalence of “weak decoupling,” as opposed to a transition toward “strong decoupling,” underscores the significant challenges inherent in Jiangxi’s energy structure transformation and can be interpreted through the lens of institutional and technological path dependence. While technological progress—evidenced by declining carbon intensity—has effectively moderated the rate of emissions growth, the entrenched carbon lock-in of Jiangxi’s coal-dominated energy system imposes structural constraints. This lock-in manifests in: (a) Infrastructural inertia from long-lived coal-fired power and heavy industrial assets; (b) Industrial path dependency from inherited energy-intensive sectors; and (c) Limited institutional capacity for a rapid clean energy transition, compounded by natural resource constraints (lack of abundant hydropower compared to provinces like Yunnan or Sichuan). Under such conditions, incremental efficiency gains face diminishing returns, making it difficult to escape the “weak decoupling” trap without systemic change. The case of Jiangxi thus illustrates the limitations of an efficiency-focused approach within a carbon-locked system and underscores the necessity of structural transformation.
The persistent prevalence of “weak decoupling,” as opposed to a transition toward “strong decoupling,” underscores the significant challenges inherent in Jiangxi’s energy structure transformation. Within the framework of green growth theory, Jiangxi’s growth trajectory remains distinctly “brown,” characterized by a high carbon lock-in effect due to its coal-dominated energy mix and industrial structure. While technological advancements—evidenced by declining carbon intensity—have effectively moderated the rate of emissions growth, the entrenched reliance on coal continues to impose rigid constraints, preventing a complete decoupling of carbon emissions from economic expansion. Under the current technological and structural paradigm, there exists a theoretical lower bound for emissions reduction, beyond which further efficiency gains yield diminishing returns. This stands in stark contrast to provinces endowed with abundant hydropower resources, such as Yunnan and Sichuan. For regions like Jiangxi that lack natural advantages in clean energy, incremental improvements in energy efficiency are increasingly constrained by this theoretical floor. Achieving meaningful decoupling therefore hinges on a fundamental restructuring of the energy system—a transition that is inherently more complex and costly, yet imperative to transcend the current carbon-intensive growth paradigm and realize genuine green growth.
In summary, the pervasive ‘weak decoupling’ state is not merely a statistical outcome but a manifestation of the deep-seated ‘carbon lock-in’ described above. The scale-driven growth model, reinforced by infrastructural and industrial inertia, sets a high baseline for emissions, while efficiency gains (negative X2) can only partially offset it, resulting in the persistent pattern observed. This interplay between structure and efficiency frames Jiangxi’s challenge.
3.3. Comparative Perspective with Other Regions
Based on existing research, regions can be classified into three categories according to the dominant driving factors: (1) scale-driven regions (e.g., Jiangxi and Shanxi), where economic scale and energy consumption are the primary drivers; (2) efficiency improvement regions (e.g., Jiangsu and Zhejiang), in which reductions in carbon and energy intensity exert significant inhibitory effects on emissions growth; and (3) structural transformation regions (e.g., Sichuan and Yunnan), characterized by a high share of clean energy and a greater capacity to achieve strong decoupling. Jiangxi exemplifies the scale-driven type, exhibiting a weak decoupling status similar to that of coal-dependent provinces such as Shanxi, in contrast to regions endowed with abundant clean energy resources.
To contextualize Jiangxi’s findings and assess their typicality, we compare key metrics with those reported in studies of other Chinese regions (Table 6). Compared to the more developed Beijing–Tianjin–Hebei (BTH) region (Guan 2023) [22], Jiangxi shows a much higher cumulative contribution from economic scale (97.8% vs. ~60–80% in BTH studies), underscoring its earlier stage on the development curve where scale effects dominate. The frequency of weak decoupling in Jiangxi (91%) is notably higher than in the Hu-Bao-O-Yu city cluster (Zhou et al., 2024) [18] (where strong decoupling periods appear) or national averages, highlighting its persistent struggle to separate growth from emissions. However, Jiangxi’s negative contribution from carbon intensity of output (−47.4%) is comparable to or stronger than many regions, indicating significant efficiency efforts. This pattern—dominant scale effect, strong efficiency inhibition, yet persistent weak decoupling—closely mirrors challenges reported in other less-developed (Ji et al., 2023) [19], resource-dependent catch-up regions globally, such as certain Eastern European transition economies or industrializing Southeast Asian nations. Thus, Jiangxi serves as a salient case study for this common developmental dilemma.
Table 6.
Comparative Analysis of Key Decoupling and Decomposition Metrics Across Selected Regions.
This comparative perspective validates Jiangxi’s representativeness and underscores a critical policy insight: for regions like Jiangxi, where scale effects are extraordinarily dominant, achieving decoupling requires a dual focus. It necessitates not only continuing the effective pursuit of efficiency improvements (as reflected in the strong negative X2) but, more crucially, initiating aggressive structural interventions to alter the very composition of economic scale.
4. Conclusions and Recommendations
4.1. Conclusions
The carbon emissions in Jiangxi Province are influenced by a variety of factors, among which the positive role of economic development level is particularly significant, which is consistent with the conclusions of previous studies. This underscores the scale effects embedded in the investment-driven catch-up growth model, leading to carbon lock-in. This means that as the economy grows, carbon emissions also increase accordingly. In addition to the level of economic development, the increase in energy consumption and the rise in per capita carbon emissions are also important factors driving the growth of carbon emissions. The structural inertia from inherited industrial transfers further reinforces this carbon-intensive trajectory. However, in terms of reducing carbon emissions, the impact of carbon intensity of output is the most prominent, indicating that reducing carbon emissions per unit of output through improving production efficiency is the key way to achieve carbon reduction. This reflects a pattern of induced technological change favoring efficiency improvements over fundamental energy system transformation. In addition, the reduction of energy consumption carbon intensity and energy intensity also plays a positive role in reducing carbon emissions. These phenomena collectively indicate that technological progress is a decisive factor in solving the problem of carbon emissions. Therefore, strengthening the research on the decoupling relationship between carbon emissions and economic growth is of great significance for achieving more effective energy conservation and emission reduction.
To gain a deeper understanding of the relationship between economic development and carbon emissions in Jiangxi Province, the Tapio decoupling index model was applied for assessment. The analysis results of the model show that Jiangxi Province is currently mainly in a state of weak decoupling, indicating that although there is a certain degree of separation between economic growth and carbon emission growth, this separation is not yet complete. Critically, our analysis shows that carbon emissions had not peaked as of 2022. Therefore, the immediate policy priority for Jiangxi is to achieve an absolute peak in carbon emissions while maintaining necessary growth—a prerequisite for transitioning from weak to strong decoupling. In order to achieve stronger decoupling effects, or even reach a state of complete decoupling, Jiangxi Province continues to face several challenges while promoting sustained and healthy economic development. These include optimizing the energy structure, improving energy efficiency, and promoting low-carbon lifestyles and production methods throughout society.
4.2. Recommendations
Building on the theoretical insights from EKC and path dependence literature, policy interventions for Jiangxi must not only address immediate drivers but also aim to break the carbon lock-in that perpetuates weak decoupling. The following recommendations are proposed with an emphasis on systemic and structural change:
(1) Prioritize Energy Structure Transformation Through Regional Collaboration and Diversification.
Given Jiangxi’s limited potential for large-scale conventional renewable energy and the high contribution of energy consumption (51%) to emissions, policy must focus on structural diversification. First, it should aggressively promote distributed photovoltaic systems and biomass energy, leveraging local conditions. Second, and more critically, given the entrenched carbon lock-in from coal dependence, Jiangxi must actively seek integration into regional green electricity trading markets. This requires not only infrastructure investment but also addressing transaction costs and designing equitable benefit-sharing mechanisms, possibly supported by interregional fiscal transfers, to ensure the market’s viability and fairness. By establishing such mechanisms to import green power from resource-rich neighboring provinces, Jiangxi can bypass its natural resource constraints and achieve a tangible reduction in the carbon intensity of its energy supply, which is fundamental to transitioning from weak to strong decoupling. The initial investment and coordination costs, while substantial, are necessary to overcome systemic lock-in.
(2) Foster Low-Carbon Industrial Upgrading Aligned with Regional Comparative Advantages.
Given the overwhelming cumulative contribution of economic scale (97.81%), industrial restructuring should strategically aim to alter the composition of GDP growth rather than suppress it. This involves not solely phasing out old capacity but on strategically cultivating new industries that align with Jiangxi’s green comparative advantages, such as low-carbon ecological agriculture, eco-tourism, and segments of the digital economy that leverage its ecological and human capital. To guide resource allocation efficiently, a balanced policy mix—including carbon pricing, targeted subsidies, and green finance instruments—should be deployed. Policymakers must weigh the economic efficiency and distributional consequences of these tools to avoid undue burdens on vulnerable sectors while incentivizing green innovation and industrial transition. Capacity building for green skills is essential to support this shift.
(3) Implement Differentiated and Enforceable Policies Targeting Key Sectors.
Policy support needs to be precise and robust. This includes establishing and strictly enforcing advanced energy efficiency and carbon emission standards for new projects in key industries such as construction materials and chemicals. A synergistic approach that combines market-based mechanisms (e.g., a well-designed emissions trading scheme or carbon tax) with command-and-control measures (e.g., efficiency standards) can enhance policy effectiveness while mitigating administrative and compliance costs. Additionally, to address the significant driver of per capita carbon emissions (45% cumulative contribution), innovative economic instruments, such as a carbon inclusion system in urban areas that rewards low-carbon behaviors, can effectively incentivize residents and businesses. Public awareness campaigns and improving low-carbon infrastructure (e.g., public transport) are complementary demand-side measures.
In conclusion, the case of Jiangxi Province offers insights that may be relevant for other less-developed, coal-dependent regions facing similar developmental and decarbonization dilemmas. It demonstrates that achieving decoupling is an immense challenge when economic catch-up remains the priority and clean energy options are structurally limited. The pathway forward must be pragmatic, combining aggressive energy efficiency measures with innovative strategies to overcome inherent resource constraints, such as regional energy collaboration. The experiences and challenges documented in this study provide a valuable reference for designing feasible and just transition pathways for similar economies striving to balance development with climate responsibilities.
4.3. Limitations and Future Research
This study has certain limitations. Firstly, in the decomposition analysis using the Generalized Divisia Index Method (GDIM), the variable X7 (GDP per capita) was not presented independently in the results table (Table 4). This is primarily because the GDIM model, when dealing with perfect functional relationships between factors, may lead to the contribution of some variables being fully explained by their correlated counterparts. Specifically, X7 (GDP per capita) is a direct derivative of X1 (GDP) and X5 (Population) (X7 = X1/X5), and its driving effect is already captured and reflected by these two core variables. Consequently, the absence of X7 is not expected to substantially impact the overall interpretative power of the decomposition results, and it does not alter the core findings regarding economic scale and population size as primary drivers. Nonetheless, this approach might theoretically lead to a slight underestimation or obscuration of the independent influence mechanism of per capita wealth on carbon emissions. Future research could employ models that better handle highly collinear variables to further disentangle and verify the independent contribution of GDP per capita.
Author Contributions
X.T.: Project administration, Validation, Formal Analysis, Visualization, Writing—review and editing, Writing—original draft, Conceptualization. J.W.: Writing—review and editing, Writing—original draft. M.D.N.: Writing—review and editing, Language, Funding acquisition. B.X.: Resources, Writing—original draft, Investigation, Data curation. G.H.: Formal Analysis, Writing—review and editing, Funding acquisition, Conception, Analysis. All authors have read and agreed to the published version of the manuscript.
Funding
This work was financially supported by the Science and Technology Research Project of Jiangxi Education Department (Project number: GJJ2201327).
Informed Consent Statement
All the participants in this study were recruited with available informed consent. All authors are informed and agree to the study.
Data Availability Statement
The original contributions presented in the study are included in the article, further inquiries can be directed to the corresponding author.
Acknowledgments
We would like to extend our sincere gratitude to Dr. Wan Youwei for his invaluable guidance and technical expertise throughout the data processing phase of this research. His profound knowledge of statistical methodologies and computational tools significantly enhanced the accuracy and efficiency of our data analysis. Wan’s patient mentorship, constructive feedback, and willingness to share resources proved instrumental in overcoming challenges related to data cleaning, transformation, and visualization. His commitment to academic excellence and collaborative spirit created an inspiring environment that greatly contributed to the success of this study. We are deeply appreciative of his support and look forward to future opportunities for knowledge exchange.
Conflicts of Interest
The authors declare no competing interests.
References
- Tang, X.; Li, J. Study of the mechanism of digitalization boosting urban low-carbon transformation. Front. Environ. Sci. 2022, 10, 982864. [Google Scholar] [CrossRef]
- Tang, X.; Luo, X. Research on energy policies of Jiangxi province under the dual-carbon constraints. Front. Environ. Sci. 2022, 10, 986385. [Google Scholar] [CrossRef]
- Ang, B.W.; Zhang, F. A survey of index decomposition analysis in energy and environmental studies. Energy 2000, 25, 1149–1176. [Google Scholar] [CrossRef]
- Zheng, Y.; Xu, K.N. Driving factors of China’s declining energy intensity: A study based on the logarithmic mean Dirichlet decomposition (LMDI). Econ. Manag. 2012, 34, 11–21. [Google Scholar] [CrossRef]
- Wang, Z.; Yu, M. Decomposition of influencing factors of carbon dioxide emissions from China’s petrochemical industry—Based on the generalized Dirichlet index decomposition method. Sci. Technol. Manag. Res. 2019, 39, 268–274. [Google Scholar]
- Shao, S.; Cui, X. Responsibility accounting and driving factors of carbon emissions on the energy supply side and consumption side—Based on the perspective of “income responsibility”. J. Shanghai Jiao Tong Univ. (Philos. Soc. Sci.) 2024, 32, 81–100. [Google Scholar] [CrossRef]
- Shao, S.; Zhang, X.; Zhao, X. Empirical decomposition and peak path of carbon emissions from China’s manufacturing industry—Generalized Dirichlet index decomposition and dynamic scenario analysis. China’s Ind. Econ. 2017, 3, 44–63. [Google Scholar] [CrossRef]
- Wang, W.; Xiao, Z.; Kong, N. Analysis of influencing factors of carbon emissions from energy consumption in Jilin Province. Compr. Util. Tire Resour. China 2025, 1, 73–75. [Google Scholar] [CrossRef]
- Wan, Y.; Xu, Y.; Pan, B.; Tang, X. Policy-oriented pathways for decoupling economic growth from carbon emissions in Southwest China: A GDIM analysis of multi-driver dynamics and regional heterogeneity. Front. Environ. Sci. 2025, 13, 1711582. [Google Scholar] [CrossRef]
- Wan, Y.; Pan, B.; Xu, Y.; Yu, Y.; Yang, J.; Tang, X. Decoupling effect of carbon emissions in the Yangtze River Delta region based on GDIM factor decomposition. Front. Environ. Sci. 2025, 13, 1622372. [Google Scholar] [CrossRef]
- Vaninsky, A. Economic Factorial Analysis of CO2 Emissions: The Divisia Index with Interconnected Factors Approach. Int. J. Econ. Manag. Eng. 2013, 7, 2772–2777. [Google Scholar]
- Vaninsky, A. Factorial decomposition of CO2 emissions: A generalized Divisia index approach. Energy Econ. 2014, 45, 389–400. [Google Scholar] [CrossRef]
- Yan, Q.; Yin, J. The decomposition of carbon emission factors in Beijing Tianjin Hebei region based on generalized Dirichlet index decomposition method. Sci. Technol. Manag. Res. 2017, 37, 239–245. [Google Scholar]
- Hao, Y.; Wang, J. Research on the driving factors of carbon emissions in China’s automobile manufacturing industry. J. Environ. Sci. 2024, 43, 1–6, 19. [Google Scholar] [CrossRef]
- Guo, W.Q.; Yu, Z.P.; Lei, M.; Zhang, W.P.; Gao, Y.Q. Research on decomposition of driving factors of carbon emissions and decoupling efforts in China. Environ. Sci. Res. 2025, 38, 209–219. [Google Scholar] [CrossRef]
- Yan, Q.Y.; Li, X.T. Research on decoupling between carbon emissions from energy consumption and economic development in Shandong Province Based on GDIM. Shandong Ind. Technol. 2023, 2, 3–13. [Google Scholar] [CrossRef]
- Dong, L.; Li, H. Research on decoupling status and influencing factors of carbon emissions from energy consumption in Xinjiang under the background of dual carbon. Environ. Prot. Sci. 2025, 51, 32–40. [Google Scholar] [CrossRef]
- Zhou, M.; Yang, J.; Ning, X.; Wu, C.; Zhang, Y. Analysis of the Characteristics and Driving Mechanisms of Carbon Emission Decoupling in the Hu-Bao-O-Yu City Cluster under the “Double Carbon” Target. Sustainability 2024, 16, 7290. [Google Scholar] [CrossRef]
- Ji, J.; Li, C.; Ye, X.; Song, Y.; Lv, J. Analysis of the Spatial and Temporal Evolution of China’s Energy Carbon Emissions, Driving Mechanisms, and Decoupling Levels. Sustainability 2023, 15, 15843. [Google Scholar] [CrossRef]
- Liang, L.; Wang, H.; Huai, H.; Tang, X. Study of the Decoupling Patterns between Agricultural Development and Agricultural Carbon Emissions in Beijing Tianjin Hebei Region from 2000 to 2020. Land 2024, 13, 839. [Google Scholar] [CrossRef]
- Du, M.; Antunes, J.; Wanke, P.; Chen, Z. Ecological efficiency assessment under the construction of low-carbon city: A perspective of green technology innovation. J. Environ. Plan. Manag. 2022, 65, 1727–1752. [Google Scholar] [CrossRef]
- Guan, Q. Decomposing and Decoupling the Energy-Related Carbon Emissions in the Beijing–Tianjin–Hebei Region Using the Extended LMDI and Tapio Index Model. Sustainability 2023, 15, 9681. [Google Scholar] [CrossRef]
- Ding, H.; Wang, Z.; Huang, C.; Liu, L.; Bedra, K.B. Carbon Pressure and Economic Growth in the Urban Agglomeration in the Middle Reaches of the Yangtze River: A Study on Decoupling Effect and Driving Factors. Sustainability 2023, 15, 7862. [Google Scholar] [CrossRef]


Disclaimer/Publisher’s Note: The statements, opinions and data contained in all publications are solely those of the individual author(s) and contributor(s) and not of MDPI and/or the editor(s). MDPI and/or the editor(s) disclaim responsibility for any injury to people or property resulting from any ideas, methods, instructions or products referred to in the content. |
© 2026 by the authors. Licensee MDPI, Basel, Switzerland. This article is an open access article distributed under the terms and conditions of the Creative Commons Attribution (CC BY) license.