Abstract
Given the strong coupling between electricity flow and carbon flow, promoting the low-carbon transformation of the energy sector is a crucial measure to actively responding to climate challenges. As a pivotal hub linking the electricity market with the carbon market, promoting electricity–carbon coordinated scheduling of Virtual Power Plants (VPPs) is of great significance in expediting the energy transition process. Based on the introduction of carbon potential, this manuscript constructs a VPP electricity–carbon coordinated scheduling model that incorporates various typical elements, including renewable energy units and demand response. Furthermore, this paper utilizes Brain Storm Optimization (BSO) to improve the Snow Ablation Optimizer (SAO) algorithm and applies the improved algorithm to solve the model developed in this manuscript. Finally, an analysis was conducted using a small-scale VPP project in eastern China, and the results are the following: Firstly, the SAO improved by BSO demonstrates a significant enhancement in solution efficiency. In particular, for the cases presented in this manuscript, the algorithm’s convergence speed increased by 42.85%. Secondly, under the multi-market conditions and with real-time carbon potential, VPPs will possess greater flexibility in scheduling optimization and stronger incentives to fully explore their emission reduction potential through collaborative electricity–carbon scheduling, thereby improving both economic and environmental performance. However, constrained by factors such as the currently low carbon price level, the extent of improvement in VPPs’ performance under real-time carbon potential, compared to fixed carbon potential, remains relatively limited, with a 1.07% increase in economic benefits and a 2.63% reduction in carbon emissions. Thirdly, an increase in carbon prices can incentivize VPPs to continuously tap into their emission reduction potential, but beyond a certain threshold (120 CNY/t in this case study), the marginal contribution of further carbon price increases to emission reductions will progressively decline. Specifically, for every 20-yuan increase in the carbon price, the carbon emission reduction rate of VPPs drops below 1%.
1. Introduction
The world is actively addressing the issue of global warming, and the proposal of carbon neutrality goals continues to drive the construction of new power systems. On the one hand, renewable energy has entered a golden era of large-scale development, yet this has also posed certain challenges to the safe and stable operation of power systems. Meanwhile, demand-side resources are developing rapidly, characterized by their large quantity, widespread distribution, and significant potential for regulation. However, due to the absence of effective integration and systematic management, their full potential has yet to be fully tapped into. On the other hand, there exists an inherent coupling relationship between carbon emissions and the full lifecycle activities of electricity production and consumption. As carbon market construction progresses steadily, the interaction between the electricity market (a demand-driven market) and the carbon market (a policy-driven market) has become increasingly evident [1,2].
Based on power system architecture, Virtual Power Plants (VPPs) utilize modern information and communication technologies, as well as system integration and control techniques, to aggregate various decentralized resources such as distributed generation, flexible loads, and Energy Storage Systems (ESSs) [3]. Acting as new types of operational entities, VPPs participate in power system optimization and market transactions. On this basis, in order to promote the absorption of renewable energy and meet the assessment requirements of the carbon quota mechanism, VPP operators need to conduct research on electricity–carbon coordinated scheduling, thereby increasing income while promoting an energy transition [4].
A summary of the research trends in the optimization operation of VPPs and corresponding solution algorithms is presented in Table 1.

Table 1.
Research overview on low-carbon VPP operation.
Scholars have conducted relatively extensive research on the optimization of VPPs, with the vast majority of these studies focusing on optimization objectives such as maximizing the economic benefits or minimizing operational costs [5,6]. With the emergence of demands such as addressing climate change challenges and promoting energy’s low-carbon transition, the low-carbon operation of VPPs has gradually become one of the significant research hotspots [7,8]. Currently, the low-carbon operation of VPPs can primarily be achieved through two modes: constructing and operating equipment resources, and participating in market transactions [9,10].
When it comes to the construction and operation of equipment resources, Zamani et al. [11], Gou et al. [12], and Liu [13] utilized the absolute value of carbon emissions as an indicator to measure the effectiveness of VPPs’ low-carbon operation, and constructed corresponding VPP scheduling optimization models. Their conclusions demonstrate that by constructing and operating low-carbon and negative-carbon technology equipment, such as biomass gasification systems, Carbon Capture Systems (CCSs), and Power-to-Gas (P2G) facilities, the carbon emissions from VPP operation can be effectively mitigated. Zhuo et al. [14] and Cui et al. [15] took advantage of shared energy storage and enhanced the forecasting accuracy of renewable energy units, among other measures, to fully exploit the efficient collaborative operation of existing equipment resources within VPPs, thereby reducing both operational costs and carbon emissions.
In the context of market transactions, with carbon trading markets being established in various regions, carbon emissions have become one of the critical factors influencing the revenue structure of VPPs. Numerous scholars have leveraged carbon trading mechanisms to achieve low-carbon operations of VPPs. Liu et al. [16] and Zhang et al. [17] incorporated carbon emission factors into enable renewable energy units to participate in carbon trading. Their simulation results demonstrate that this approach helps enhance the enthusiasm of VPPs for wind power consumption. Zhang et al. [18] proposed a collaborative optimization strategy for VPPs based on blockchain cross-chain transactions involving electricity, carbon, and green certificates. The simulation results show that, compared with traditional models, the proposed strategy reduces carbon emission intensity by 13.3%, increases the new energy consumption rate to 98.75%, and partially offsets costs through revenues from carbon trading.
As the diversity of internal resources within VPPs continues to grow, the solution methods for VPP optimization problems have also garnered attention from scholars. Overall, these solution methods can be broadly classified into two categories: those based on mathematical methods and those based on intelligent algorithms.
In the realm of mathematical methods, although approaches such as Newton’s method, the Lagrange multiplier method, and linear transformation can be applied to solve VPP optimization problems to a certain extent, they impose relatively stringent requirements on the differentiability of the objective function. Moreover, as the problem scale expands, the difficulty of solving these problems gradually increases, thereby limiting the efficiency and feasibility of traditional algorithms [19,20,21].
In terms of intelligent algorithms, classic intelligent algorithms, such as the multi-objective gray wolf algorithm [22] and the multi-objective Genetic Algorithm [23], have already been employed to solve VPP optimization problems. Furthermore, concerning the improved classic algorithms, Xu et al. [24] proposed a multi-objective particle swarm optimization algorithm for the optimal allocation of hybrid energy storage, which is based on multi-strategy improvements. This algorithm demonstrates better Pareto front and convergence performance compared to traditional multi-objective particle swarm optimization algorithms. Qi et al. [25], based on the establishment of a flexibility aggregation model for VPPs, proposed using an improved Harris Hawk optimization algorithm for the solution to accelerate the convergence.
In the aforementioned studies, despite scholars having carried out relatively extensive research on low-carbon VPP optimization and its solution methods, there still exist two limitations:
Firstly, most of the current research predominantly focuses on the direct emissions and emission reduction potential of internal equipment within VPPs, while neglecting the time-varying characteristic of the carbon factor of electricity supplied by the grid and the potential of demand response, which is oriented toward low-carbon objectives, in reducing VPP carbon emissions.
Secondly, when addressing high-dimensional low-carbon VPP optimization problems, mathematical methods encounter difficulties such as high solution complexity. In contrast, traditional intelligent algorithms struggle to balance the conflict between accelerating convergence speed and escaping from local optima.
In light of the aforementioned issues, the main contributions of this paper are the following:
Firstly, it analyzes the impacts of both fixed carbon potential (carbon emission factor) and real-time carbon potential on the scheduling strategies of VPPs. It clarifies that real-time carbon potential can provide more flexible elastic space for VPP scheduling, thereby further improving the efficiency and performance of VPPs.
Secondly, this paper proposes the BSO-SAO heuristic algorithm. Compared with classic SAO and evolutionary algorithms represented by the Genetic Algorithm (GA), the BSO-SAO demonstrates superior performance in terms of convergence speed, optimal solution acquisition, and the avoidance of local optima.
Thirdly, it analyzes the sensitivity of VPPs to carbon price fluctuations under real-time carbon potential, and clarifies the relationship between the economic performance of VPPs, environmental changes, and carbon price variation trends.
The organizational structure of this paper is as follows. Section 2 establishes a mechanism for collaborative electricity–carbon dispatch of VPPs in a diversified market environment, based on the introduction of the carbon potential concept. Section 3 constructs a model for collaborative electricity–carbon dispatch of VPPs and proposes an improved SAO algorithm based on BSO to solve the VPP dispatch optimization. Section 4 conducts an empirical analysis using a small-scale VPP project in eastern China as the research subject. Finally, Section 5 draws the relevant conclusions.
2. Electricity-Carbon Coordinated Scheduling Mechanism for VPPs Under the Multi-Market
2.1. Carbon Quota and Carbon Potential of VPPs
As a typical demand-side business model, VPPs generate direct or indirect carbon emissions during the process of supplying energy to loads [26]. Considering the role of carbon quota mechanisms and carbon trading in correcting externalities associated with economic activities, this study designates VPPs as the primary entities subject to carbon emission assessments. In accordance with China’s current policy, “The Interim Regulations on the Administration of Carbon Emissions Trading” states that carbon emission quotas shall be allocated free of charge initially, and a distribution approach combining free quotas with paid quotas shall be gradually implemented in accordance with relevant national requirements. VPPs will receive free or paid carbon quotas allocated by the government based on emission reduction targets and are permitted to autonomously trade these quotas within the compliance period according to their actual emission needs: surplus quotas can be sold, while deficits must be purchased. At the end of the period, VPPs must fully surrender quotas equivalent to their actual emissions; failure to comply will result in penalties [27]. To align the time scales of carbon and electricity transactions, this study sets the assessment cycle as one day and allocates annual carbon quotas on a daily basis according to load levels. Given China’s practical context, this paper adopts a free quota mechanism for initial carbon quotas for participating entities, with the initial quota determined by the aggregated internal load volume. The carbon quota calculation equation is the following:
where represents the initial carbon quotas for the VPPs, represents the load level of the VPP at time , and is the carbon quota coefficient used to quantify the carbon emissions associated with the load.
The carbon emissions of VPPs mainly originate from two sources: direct emissions generated by internally operated power-generating units, such as Gas-Fired Generator Units (GFUs), and indirect emissions represented by the carbon flow entering the VPPs along with electricity purchased from the grid. Here, the intensity of carbon flow entering the VPP is primarily determined by the carbon potential at the node where the VPP is connected, while the node’s carbon potential is jointly influenced by the branch carbon flows entering that node and the carbon emissions from the generator units within the node. Carbon potential can be categorized into fixed carbon potential and real-time carbon potential. Fixed carbon potential refers to the situation where the grid’s electricity carbon factor (carbon emission factor) is determined by the local power generation mix and is typically disclosed by the government on an annual basis. Consequently, within the same calendar year, the carbon potential remains uniform across all nodes of the power grid. Real-time carbon potential, by contrast, assumes that the carbon potential at a specific grid node is influenced by the electricity generation volumes from power units with varying technologies and carbon emission levels during a given time period. Therefore, the carbon potential at different grid nodes will fluctuate in real time over different time intervals. The carbon potential can be calculated as follows [28].
where represents the carbon potential of node , and are the incoming active power to node and the active power output of the generator units at node , respectively, and denote the carbon flows intensity corresponding to the incoming active power to node and the active power output of the generator units, respectively, while and refer to the set of branches flowing into node and the set of generator units connected to node , respectively.
2.2. Electricity Scheduling Mechanism for VPPs
The VPP aggregates GFUs, ESS, distributed photovoltaic (PV), distributed wind turbine (WT) units, and loads. Among these, the loads are categorized into fixed loads and flexible loads. The VPP needs to allocate internal resources to meet internal load electricity demands while simultaneously enhancing overall profitability.
In terms of internal operational management, the VPP provides access platforms and establishes standardized integration systems for widely dispersed renewable energy generator units [29]. It can also act as an agent for users to purchase electricity and implement demand-side management to regulate electricity consumption behaviors. This approach not only helps users reduce electricity costs but also unlocks their potential for load adjustment.
In terms of dispatch, the VPP optimizes operations based on predefined objectives. When electricity supply is insufficient, it can guide flexible resources to respond or purchase electricity from the grid via tie-lines. Additionally, in the event of emergencies or extreme weather conditions, it can promptly adjust internal resources to ensure supply–demand balance and mitigate risks.
2.3. Electricity-Carbon Coordinated Scheduling Mechanism for VPPs
When participating in the electricity–carbon market, the VPP aims to maximize its profits. Its revenue primarily consists of electricity fees paid by aggregated loads, income from selling electricity to the grid, and income from selling surplus carbon quotas. Its costs mainly include the power generation costs of GFU, WT, and PV, the charging and discharging costs of ESSs, and the costs of purchasing deficient carbon quotas. Due to the constraints imposed by carbon quota assessments, the VPP will first make every effort to consume as much internal renewable energy as possible. The VPP primarily achieves balance and meets constraints by rationally allocating internal resources, including GFU, ESS, WT, PV, and flexible loads, as shown in Figure 1.
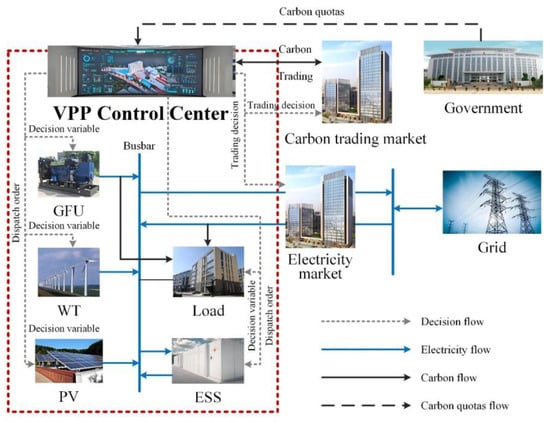
Figure 1.
Electricity-carbon coordinated scheduling mechanism for VPP.
The scheduling behavior of a VPP is influenced not only by the time-of-use electricity pricing from the grid but also by real-time carbon potential: when the carbon potential is high, if the VPP purchases electricity from the grid, it will not only incur corresponding electricity purchase costs but also face a significant risk of high carbon emission costs. Specifically, if the total carbon emissions exceed the initial quota within a one-day settlement cycle, the VPP will need to purchase higher-priced quotas in the carbon market to meet the carbon emission constraints.
3. Modeling
3.1. Objective Function
Based on the characteristics of aggregated resources within the VPP, in this chapter, a variety of various revenues and costs incurred by the VPP are computed in pursuing the optimal goal of 24 h economic and low-carbon dispatch operation, while adhering to the operational constraints of its internal resources.
3.1.1. Total Revenue Function
This paper adopts the total revenue of the VPP as the objective function, where the total revenue is computed as the income derived from internal electricity supply within the VPP minus the costs related to carbon quota trading, internal electricity generation, interactions with the power grid, ESS dispatch, DR, as well as penalties for curtailed solar and wind power.
where represents the total revenue of the VPP, CNY; represents the electricity supply income, CNY; is the cost of carbon quota trading, CNY; denotes the WT cost, CNY; stands for the PV cost, CNY; is the penalty cost incurred for curtailing PV and WT power, CNY; represents the cost of electricity purchase and sale between the VPP and the grid, CNY; is the cost associated with ESS charging and discharging, CNY; signifies GFU cost, CNY; and represents the demand response (DR) cost, CNY.
- Carbon emission quota trading cost:
- WT cost:
- PV cost:
- Penalty cost incurred for curtailing PV and WT power:
- Cost of electricity purchase and sale between the VPP and the grid:
- Cost associated with ESS charging and discharging:
- GFU cost:
- Electricity supply income:
- DR cost:
3.1.2. Constraints
This subsection presents the constraint conditions for ensuring the normal operation of various resources within the VPP.
- Constraints on renewable generation output:
- Constraints on grid interaction:
- Constraints of ESS:
- Constraints of GFU:
- Constraints of electricity load:
- Balance constraint:
3.2. Solution
Based on the established model, it is evident that the electricity–carbon coordinated scheduling process for VPPs constitutes a typical high-dimensional mixed-integer nonlinear optimization problem. Traditional mathematical solution methods exhibit drawbacks, such as high computational complexity and extended solution times. The SAO, as an emerging heuristic algorithm in recent years, has its core concept centered around dividing a set of feasible solutions into two populations: one for exploration and the other for exploitation [30,31].
In summary, it is clear that the SAO algorithm exhibits strong adaptability to the VPP electricity–carbon coordinated scheduling model. Moreover, considering that the BSO algorithm demonstrates favorable technical features concerning population diversity, convergence efficiency, and other aspects [32,33], this paper employs the BSO algorithm to enhance the SAO. By achieving a trade-off between accelerating the algorithm’s convergence rate and avoiding premature convergence, this paper presents a solution for the scheduling optimization process of VPPs.
The primary solution process of the BSO-SAO method proposed in this paper is depicted in Figure 2. The key steps primarily comprise four components: initial solution generation, exploration, exploitation, and fusion.
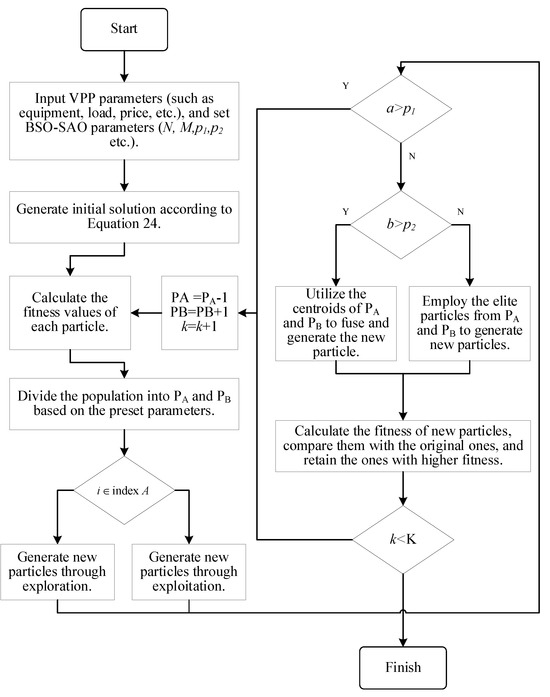
Figure 2.
VPP strategy optimization process.
The initial solution generation process randomly generates initial values for decision variables, taking into account the input VPP parameter information and constraints. These decision variables encompass the output of GFU, ESS, WT, PV, electricity purchase decisions, and so on. Subsequently, the fitness (i.e., objective function values) of each initial solution is calculated in combination with Equations (3)–(13). During the exploration and exploitation phases, optimization is carried out around the initial solutions based on the SAO, specifically generating new solutions. In the fusion step, updates or retention operations will be performed on the newly generated solutions from the previous step in accordance with the BSO to avert premature convergence of SAO. Finally, the fitness values of the new solutions will be calculated, and a new iteration is initiated to commence until the maximum number of iterations is attained.
- Initial solution generation:
- Exploration:
During the evolutionary process, particles emulate the phenomenon of snow melting into water, performing both exploration and exploitation around the current optimal solution with the aim of discovering solutions with higher fitness. In this process, particles update their positions in accordance with the following equation [30].
where represents the snow melt rate calculated using the degree day method, which simulates the process of snow melting into water; is a random number within the range [−1, 1]; K is the predefined maximum number of iterations; and denotes the coordinate position within the exploitation population.
- Fusion:
During the fusion phase, the core concept of the BSO algorithm is predominantly employed, where elite particles and centroid particles are fused to generate a new generation of particles. This approach not only introduces perturbations through the SAO process but also, to a certain extent, accelerates the convergence progress of particles within the solution space.
In this step, a random number is generated. If exceeds the predefined threshold p1, no operation is carried out, and the algorithm advances to the next iteration.
Otherwise, another random number is then generated. Specifically, when is greater than a given threshold p2, the centroid particles from PA and PB are selected, weighted in line to a standard Gaussian distribution, and a specific perturbation is added to generate new particles. Conversely, when is less than the given threshold p2, the elite particles from PA and PB are selected, weighted in accordance with a standard Gaussian distribution, and a certain perturbation is incorporated to produce new particles.
4. Case Study
4.1. Basic Data
In this paper, a small park-level VPP located in eastern China was selected as the analysis subject. This VPP is primarily responsible for supplying electricity to aggregated loads, with 10% of these loads being flexible loads. Additionally, the VPP mainly operates three types of units: GFU, PV, and WT. It also has interconnected channels with the grid to ensure balance between the power supply and demand within the VPP. The real-time carbon potential at the node where the VPP is located is mainly determined by the local power grid’s generation mix and interregional power exchanges, and it can be obtained through the platform interfaces provided by the grid company.
Additionally, information such as carbon trading prices, average carbon emission factors of regional power grids, and peak–valley periods of the power grid was acquired from websites including the Shanghai Environment and Energy Exchange (https://www.cneeex.com) and the Ministry of Ecology and Environment of China (https://www.mee.gov.cn).
It should be noted that all time-related parameters and information involved in the case analysis are based on local standard time.
The relevant equipment parameters and information pertaining to the scheduling process of the VPP are presented in Table 2.
Table 2.
Parameter information.
From the case study, the WT and PV output, load level, electricity price level, and carbon potential on the typical day of the VPP are illustrated in Figure 3 and Figure 4.

Figure 3.
Unit output and load levels.
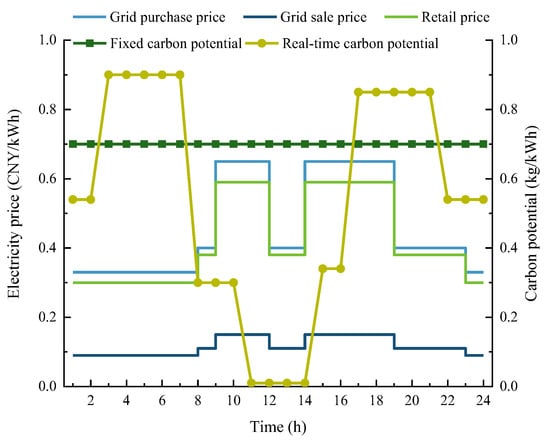
Figure 4.
Electricity price and carbon potential levels.
4.2. Scenes and Results
To evaluate the effectiveness of the proposed model, this paper sets up three scenes based on the presence or absence of a carbon market and the adoption of real-time carbon potential or fixed carbon potential. Specifically, in the scene employing fixed carbon potential, the carbon emissions of the VPP were calculated based on the carbon emission factors of regional power grids published by the authorities.
- Scene 1: traditional economic scheduling process without the carbon market.
- Scene 2: low-carbon economic scheduling process with a fixed carbon potential and participation in the carbon trading market.
- Scene 3: low-carbon economic scheduling process with real-time carbon potential and participation in the carbon trading market.
The model and solution method outlined in Section 4 were employed to address the VPP scheduling problem across three scenes. Specifically, the total time period was set to 24 h, with a unit time step of 1 h. The population size of the BSO-SAO algorithm was 100, and the number of iterations was 300. The parameters were configured as p1 = 0.2 and p2 = 0.2. The computational environment utilized an Intel(R) Core(TM) Ultra 9 185H processor operating at 2.30 GHz. The optimized results for the VPP are presented in Table 3.
Table 3.
Optimization results of the VPP.
4.3. Discussion
4.3.1. Algorithm Performance
To analyze the performance of the proposed solution method, the classical SAO and the classical evolutionary algorithm GA were selected as the control algorithms for solving the problem based on Scene 3. Among them, the population sizes of both algorithms were set to be the same as that of BSO-SAO, which is 100. The mutation probability of GA is 0.01, and the crossover probability is 0.7. The convergence processes of the three algorithms during problem-solving are shown in Figure 5.
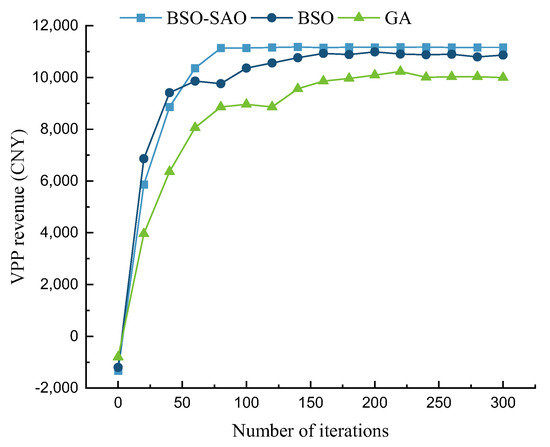
Figure 5.
Convergence process of algorithms.
In terms of algorithmic convergence speed, before approximately 60 iterations, SAO demonstrates superior convergence performance compared to both the BSO-SAO and GA. However, by the 80th iteration, the BSO-SAO algorithm essentially converged to a stable state, whereas SAO and GA gradually converged to relatively stable states only around the 140th and 220th iterations, respectively. From the perspective of iteration count, BSO-SAO exhibits a generally superior convergence speed, achieving improvements of 42.85% and 63.63% compared to SAO and GA, respectively. Regarding the algorithmic convergence values, the fitness values (objective function values) of the solutions obtained by the three algorithms stabilize around 11,164.92, 10,787.88, and 10,033.36, respectively. Compared to SAO and GA, the convergence value characteristics of the BSO-SAO algorithm show improvements of 3.52% and 11.38%, respectively.
In summary, compared with the classical GA, BSO-SAO demonstrates significant advantages in terms of solution speed, solution effectiveness, and the ability to avoid getting trapped in local optima. When compared with the classical SAO, although the improved BSO-SAO showed only a marginal improvement in the convergence value (optimal solution), its convergence speed was notably enhanced, which reflects, to a certain extent, the effectiveness of the improved algorithm in optimizing solution efficiency.
Considering that as the refinement of dispatching operations progresses, VPP dispatching will require formulating corresponding optimization strategies and generating instructions on an hourly or even 15 min basis, the BSO-SAO algorithm—which can effectively enhance solution speed while ensuring result accuracy—holds significant reference and research value for practical VPP optimization dispatching tasks.
4.3.2. Scheduling Strategy
The optimization scheduling results of the VPP for the three scenes are presented in Figure 6, Figure 7 and Figure 8.
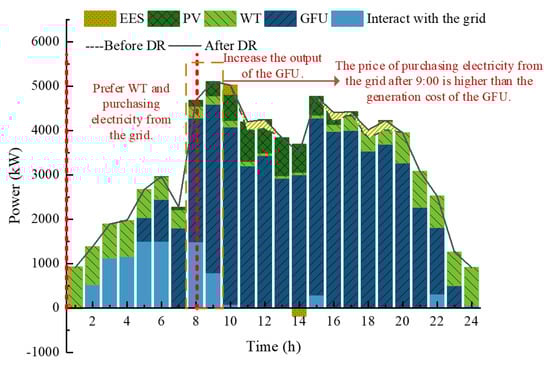
Figure 6.
Optimization results of VPP scheduling in Scene 1.
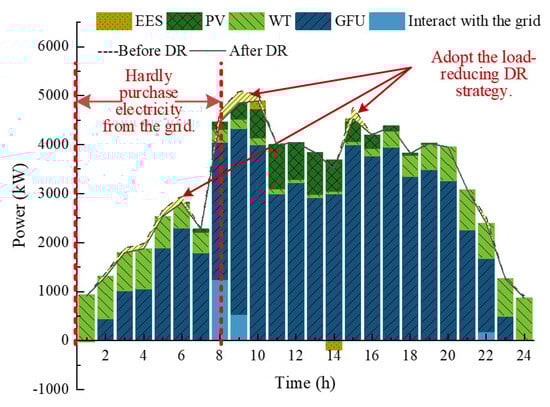
Figure 7.
Optimization results of VPP scheduling in Scene 2.
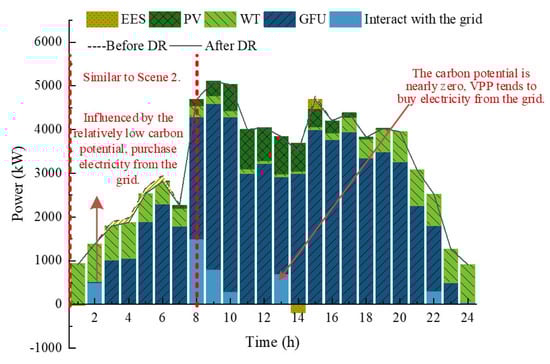
Figure 8.
Optimization results of VPP scheduling in Scene 3.
In Scene 1, due to the absence of a carbon quota mechanism, the formulation of VPP scheduling strategies is primarily influenced by factors such as grid power cost and power generation costs. Between 1:00 and 8:00, the WT units exhibit ample power generation capacity, coinciding with a period of low electricity prices. Since the cost of purchasing electricity from the grid is slightly lower than the generation cost of the GFU during this time, the VPP prefers to utilize WT output and purchase electricity from the grid to meet load demands and charge the ESS. It is noteworthy that, although the period from 5:00 to 8:00 remains a low-price electricity period, influenced by the significantly higher electricity purchase price from the grid after 9:00 compared to the GFU generation cost, as well as the ramping constraints of the GFU, the VPP adopts a strategy of gradually increasing GFU output to ensure the unit’s power supply capability during peak electricity price periods. During the peak electricity price periods from 10:00 to 12:00 and 16:00 to 19:00, the power generation capacity of PV increases, effectively offsetting, to a certain extent, the decline in WT output capacity. Considering the price differentials among sales electricity prices, DR costs, and ESS discharge costs, the VPP tends to employ strategies such as utilizing DR to increase load levels, discharging the ESS, and reducing electricity purchases from the grid to generate more revenue.
The scheduling strategy of the VPP in Scene 2 exhibits significant differences from that in Scene 1.
Firstly, from 1:00 to 8:00, the VPP substantially reduces or even completely refrains from purchasing electricity from the power grid; instead, it prefers to meet the load’s energy consumption demands through the GFU. This is because, under carbon quota constraints, although the electricity price from the grid is lower than the cost per kilowatt-hour of the GFU, when considering the additional carbon cost arising from the indirect emissions associated with grid electricity purchases—which are significantly higher than the carbon cost from the direct emissions of the GFU under a fixed carbon potential scene—the overall comprehensive cost of purchasing electricity from the grid exceeds that of generating electricity through the GFU. However, from 8:00 to 9:00, the VPP still purchases electricity from the grid due to the limitations imposed by the GFU’s insufficient ramping capability and limited installed capacity.
Secondly, in contrast to Scene 1, where the VPP adopts a DR strategy to increase load levels during the periods of 10:00–12:00 and 16:00–19:00, in Scene 2, the VPP tends to implement a DR strategy to reduce the load during four specific time slots: 2:00–6:00, 8:00–10:00, 15:00, and 22:00. The primary reason for these phenomena is the following: under a fixed carbon potential of 0.7 kg/kWh, supplying electricity to the load incurs additional carbon costs. During off-peak or regular electricity price periods, as well as peak load periods—especially when off-peak/regular electricity price periods coincide with peak load periods—the sum of the marginal cost of power generation by the GFU, the cost of purchasing electricity from the grid, and the carbon costs from both direct and indirect emissions for supplying power to the load are significantly higher than the sum of the DR cost and the cost of lost electricity supply revenue due to load reduction.
It is noteworthy that even during the two peak electricity price periods of 10:00–12:00 and 16:00–19:00, when the output capacity of PV units is ample, the increase in power supply revenue generated by implementing a load—increasing DR strategy—does not significantly exceed or cover the series of costs associated with DR. These costs include the carbon costs from direct/indirect emissions and the marginal cost of power supply. Therefore, the VPP does not adopt a load-increasing DR strategy during these periods.
As shown in Figure 8, from 1:00 to 8:00, the scheduling and DR strategies adopted by the VPP in Scene 3 are generally similar to those in Scene 2. That is, the VPP primarily relies on the GFU as its electricity supply source and reduces the load level through DR measures. However, the difference lies in the fact that at 2:00, the VPP mainly tends to purchase electricity from the grid to meet the load demand. This is because, influenced by the increased local wind power output at night, the carbon potential at the node where the VPP is located drops to 0.54 kg/kWh, resulting in the comprehensive cost of purchasing electricity from the grid being lower than that of generating electricity using the GFU.
From the perspective of the ESS operation strategy, unlike in Scene 1 and Scene 2, where the ESS primarily adopts discharging and charging strategies at 10:00 and 14:00, respectively, in Scene 3, the VPP implements charging and discharging strategies at 14:00 and 15:00 instead. The reasons are the following:
Firstly, at 10:00, the output of the GFU has already been constrained by its installed capacity. However, due to the increased output from renewable energy units within the regional power grid, the carbon potential at the VPP’s node drops to 0.3 kg/kWh. Moreover, the comprehensive cost of purchasing electricity from the grid at this time is significantly lower than that in Scene 1 and Scene 2, prompting the VPP to prefer buying electricity from the grid.
Secondly, at 14:00, the carbon potential further decreases to 0.01 kg/kWh. Although the indirect carbon emission cost of purchasing electricity from the grid is almost negligible and it is a flat electricity price period, the VPP’s internal power supply capacity is already ample because its PV output is sufficient and the GFU is constrained by its ramping capability. Consequently, the VPP charges the ESS and refrains from buying electricity from the grid.
Finally, at 15:00, the GFU’s output is constrained by its installed capacity again. However, since the carbon potential at the node has risen to 0.34 kg/kWh, both the comprehensive cost of purchasing electricity from the grid and the cost of implementing DR are relatively high. Therefore, the VPP prefers to discharge the ESS to meet the load demand.
Additionally, at 13:00, unlike in Scene 1 and Scene 2, the VPP in Scene 3 purchases a portion of electricity from the grid to meet the load demand. This is due to the combined effects of three factors: the carbon potential at the VPP’s node being nearly zero, it being a flat electricity price period, and the GFU’s output adjustment range being constrained by its ramping capability.
4.3.3. Benefit Analysis
The economic and environmental benefits across the three scenes are presented in Figure 9, encompassing total income and its composition, total cost and its composition, as well as total carbon emissions and their composition.
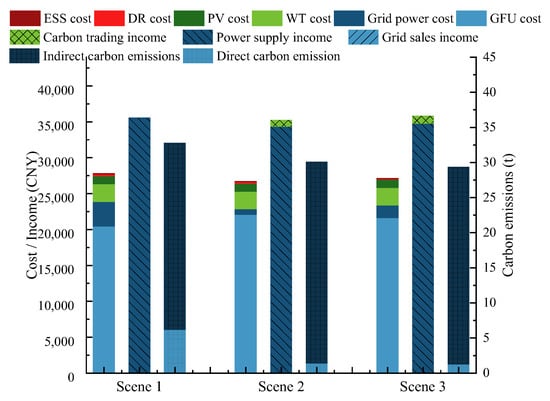
Figure 9.
Economic and environmental benefits of VPP in three scenes.
In terms of costs, on the whole, Scene 1 incurs the highest total cost, amounting to 25,262.11 CNY, followed by Scene 3 and Scene 2, with costs of 24,660.15 CNY and 24,280.30 CNY, respectively. Compared to Scene 1, the costs of Scene 3 and Scene 2 decreased by 2.38% and 3.89%, respectively. This, to some extent, demonstrates that, under suitable installed capacity configurations, the implementation of the carbon quota mechanism does not inevitably imply an increase in the total operating costs of a VPP.
From a structural perspective, in all three scenes, the GFU cost holds an absolutely dominant position within the total cost of the VPP, accounting for over 70% in each case. Compared to Scene 1, the total amount and proportion of electricity purchase costs from the grid in the other two scenes significantly decreased. The total amounts dropped from 3108.14 CNY to 701.25 CNY and 1593.83 CNY, respectively, while the proportions decreased from 12.30% to 2.89% and 6.46%, respectively. This phenomenon is correlated with the carbon potential at VPP nodes and the carbon emission costs associated with purchasing electricity from the grid, aligning with the analysis and conclusions presented in Section 4.3.2.
In addition, the generation costs of WT and PV are essentially consistent across the three scenes. This is because, in this case, the installed capacities of WT and PV are significantly smaller than the load demand, resulting in virtually no issues such as difficulties in consumption, wind/solar curtailment, or excess generation being fed back into the grid.
From the perspective of revenue, overall, the ranking of the scenes from highest to lowest is Scene 3, Scene 1, and Scene 2, with revenues of 35,825.07 CNY, 35,566.82 CNY, and 35,258.88 CNY, respectively. Scene 3′s revenue increased by 0.73% and 1.61% compared to Scene 1 and Scene 2, respectively. Among them, the revenue contributions from carbon trading in Scene 2 and Scene 3 are 924.45 CNY and 1070.94 CNY, respectively, playing a relatively insignificant role in the overall revenue increase. This is largely attributed to factors such as the limited scale of the VPP in this case and the current low price of China’s carbon trading market.
It is important to note that when evaluating from the perspective of profitability, the ranking of the scenes from highest to lowest is Scene 3, Scene 2, and Scene 1, with profits amounting to 11,164.93 CNY, 10,978.57 CNY, and 10,304.71 CNY, respectively. Scene 3′s profitability surpasses that of Scene 1 by 8.35% and that of Scene 2 by 1.70%, respectively. This, to a certain extent, demonstrates that under real-time carbon potential conditions, the VPP can achieve optimal resource allocation and secure greater profits through more flexible and diversified strategies.
In terms of carbon emissions, on the whole, the total carbon emissions in Scene 3 and Scene 2 are significantly lower at 29.37 t and 30.09 t, respectively, compared to 32.77 t in Scene 1, with reductions of 10.37% and 8.19%. From a structural perspective, compared to Scene 1, the indirect carbon emissions from grid electricity purchases in Scene 2 and Scene 3 notably decreased, with reductions of 4.79 t and 4.92 t, respectively. The above phenomena, to a certain extent, indicate that considering carbon flow impacts under carbon quotas can help VPPs reduce carbon emissions during their operations. Furthermore, under real-time carbon potential conditions, VPPs can further explore their potential to reduce carbon emissions through scheduling optimization.
4.3.4. Sensitivity Analysis of Carbon Price
Combining the results and discussions from Section 4.3.2 and Section 4.3.3, it can be observed that the carbon trading price level is one of the crucial factors influencing the scheduling strategy formulation of the VPP. Based on the fundamental settings of Scene 3, this paper further explores the economic and environmental performance of the VPP under different carbon price levels, with a step size of 20 CNY/t, in order to analyze and discuss the sensitivity of the VPP’s benefits to carbon prices. The relevant results are presented in Figure 10 and Figure 11.
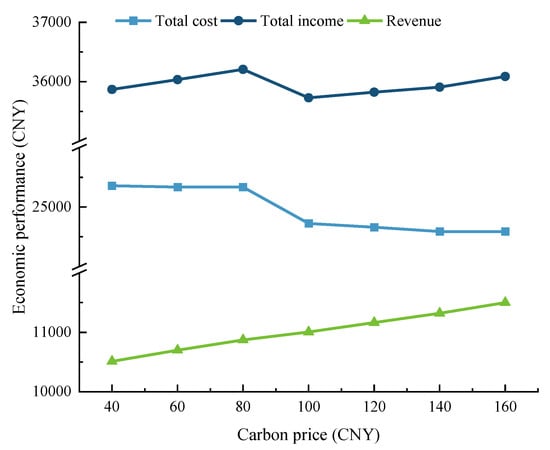
Figure 10.
Economic performance of VPP under different carbon price levels.
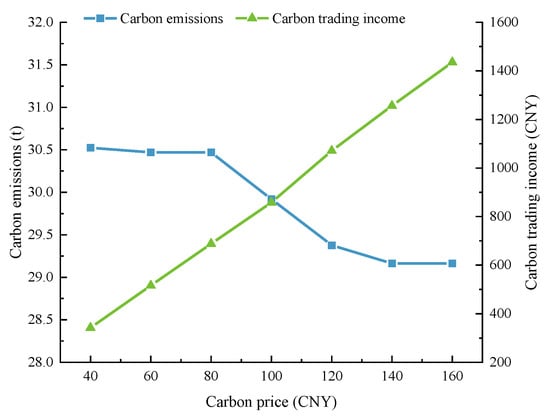
Figure 11.
Carbon emission-related performance of VPP under different carbon price levels.
From the perspective of its impact on economic performance, firstly, in terms of revenue, there is an approximately linear correlation overall between carbon price and VPP revenue overall. Based on the case analysis, this indicates to a certain extent that when the VPP is reasonably configured, the carbon price is positively correlated with the VPP’s revenue-generating capacity.
Secondly, in terms of cost and structure, when the carbon price is within the range of 40 to 80 CNY/t, the cost curve shows no significant trend of change, whereas the revenue curve exhibits a certain upward trend. This is because, at such low carbon price levels, the potential carbon costs are not significant, and the VPP still primarily adopts economic scheduling strategies aimed at minimizing electricity supply costs. Consequently, there is no significant change in costs. However, an increase in carbon prices to a certain extent boosts revenue from carbon trading, resulting in an upward trend in the revenue curve.
When the carbon price falls within the range of 80 to 160 CNY/t, both the cost curve and the income curve exhibit significant fluctuations at a carbon price of 100 CNY/t, showing a rapid decline. Subsequently, the cost curve demonstrates a trend of slow decline and convergence, while the income curve rebounds and then rises. This is because, once the carbon price rises beyond a certain critical point, the gradually increasing potential carbon costs will prompt the VPP to shift from economic scheduling strategies to those that balance environmental protection and economic efficiency. This, in turn, results in notable impacts and sharp fluctuations in both cost and income structures. However, as the carbon price continues to rise, the VPP’s ability to explore its own carbon reduction potential through strategic optimization gradually approaches its limit due to the constraints of resource allocation potential. Consequently, the declining trend of the cost curve will gradually slow down and stabilize. Additionally, the continuous increase in unit carbon prices will persistently expand the income scale of the VPP in the carbon trading market, leading to a sustained upward trend in the income curve after its initial decline and rebound.
From the perspective of the impact on carbon-emission-related performance, with regard to carbon trading income, it continues to grow in tandem with the increase in carbon prices, demonstrating a nearly linear positive correlation between the two. As for carbon emissions, when the carbon price is within the range of 40 to 80 CNY/t, the decrease in the VPP’s carbon emissions is not significant as the carbon price rises. However, when the carbon price climbs to the range of 80 to 120 CNY/t, carbon emissions exhibit a rapid decline. Furthermore, when the carbon price is further raised to the range of 120 to 160 CNY/t, the downward trend in the VPP’s carbon emission curve gradually slows down and almost converges to a stable level.
The reasons behind this are as follows. When the carbon price remains at a relatively low level (40–80 CNY/t), it does not significantly influence the VPP’s strategy of prioritizing economic scheduling, resulting in limited emission reduction effects. Consequently, the growth in carbon trading income primarily stems from the increase in carbon prices themselves. However, once the carbon price surpasses a certain threshold (80 CNY/t), carbon costs start to have a notable impact on the VPP’s profitability, prompting it to shift toward an integrated scheduling strategy that balances both economic and environmental considerations to minimize carbon emissions during operations. As the carbon price continues to rise to the range of 140–160 CNY/t, the VPP faces constraints due to its limited configurable resources, and its potential for further carbon reduction nearly depletes. Therefore, carbon emissions will no longer decrease in line with the rising carbon prices. The above discussion and analysis are consistent with the mechanistic conclusions regarding the impact of carbon prices on economic performance.
5. Conclusions and Implications
5.1. Conclusions
This paper addresses the optimal scheduling problem of VPPs in the context of electricity–carbon markets. By introducing the concept of carbon potential, an electricity–carbon coordinated scheduling optimization model for VPPs was constructed. This model takes into account the carbon potential at VPP nodes and incorporates typical elements such as WT, PV, ESS, and flexible loads. Furthermore, this paper proposes an improved SAO algorithm based on BSO to solve the mixed-integer optimization problem. Finally, a case study was conducted on a small-scale VPP project in eastern China, leading to the following relevant conclusions:
- From an algorithmic perspective, compared with the classical SAO, the BSO-SAO shows only marginal improvement in optimal solution accuracy but achieves significant enhancement in convergence efficiency. Specifically, in the case study, the convergence speed increased by 42.85%, providing valuable insights for enhancing both the solution speed and real-time responsiveness in VPP scheduling for practical engineering applications.
- From the perspective of VPP scheduling, under the combined mechanism of the carbon quota and real-time carbon potential, by considering key cost factors—including GFU marginal costs, direct emission carbon costs, grid purchase costs with corresponding indirect emission carbon costs, and DR costs—as well as the interrelationships among these variables, VPPs can further unlock economic and environmental benefits through flexible operational strategy formulation. In the case study, compared to traditional economic dispatch, the proposed VPP optimization model achieves an 8.35% increase in economic benefits and a 10.37% reduction in carbon emissions.
- From the perspective of carbon price sensitivity, there exists a strong correlation between carbon price and the VPP’s costs, revenues, and emission reductions. However, given constraints such as the scale of the VPP project and the technical characteristics of its equipment, once the carbon price surpasses a certain threshold (approximately 120 CNY/t in the case study), the marginal contribution of further carbon price increases to cost reductions, and emission reductions for the VPP will gradually diminish.
5.2. Implications
Regarding research implications, this study exhibits certain limitations. First, the uncertainty factors inherent in VPP scheduling were not adequately addressed. Second, the design of transaction scenarios requires further refinement. Future research directions include the following:
- Leveraging CVaR and Information Gap Decision Theory (IGDT) to analyze the impacts of uncertainties in renewable energy output and load demand, thereby improving the robustness of low-carbon VPP scheduling optimization.
- By integrating environmental attribute products—specifically, China Certified Emission Reduction (CCER) and Green Energy Certificates (GECs)—into the research framework and conducting a rigorous investigation of market game behaviors both between VPPs and between VPPs and their aggregated loads, this approach ultimately provides more actionable references for practical scheduling operations.
Regarding policy and practical implications, the research conclusions of this paper, to a certain extent, reveal the impacts of diverse factors such as carbon potential, carbon price, and electricity price on the operational benefits of VPPs. On the one hand, this is related to the inherent coupling relationship between energy activities and carbon emissions. On the other hand, it is associated with the Chinese government’s active promotion of the diversified markets represented by electricity trading and carbon trading.
Considering the discussions on price sensitivity in this paper, since China’s current electricity supply still primarily focuses on ensuring people’s livelihoods and facilitating economic development, with the commodity attribute of electricity trading playing a secondary role, VPPs exhibit relatively limited sensitivity to changes in factors like grid carbon emission factors and carbon prices. However, with the intensive introduction of a series of policies, such as Document No. 136 titled “Deepening the Market-oriented Reform of New Energy Feed-in Tariffs to Promote High-quality Development of New Energy“ and Document No. 357 titled “Guiding Opinions on Accelerating the Development of Virtual Power Plants,” driven by the dual impetus of policy and market forces, VPPs hold considerable potential in terms of both economic value and environmental benefits. Establishing a linkage mechanism between adjustable capacity and carbon emission reductions, as well as providing value-added services related to green energy consumption, will become one of the important future developmental directions and functional orientations for VPPs. Based on this, it is necessary to focus on two aspects in the future:
- In terms of policy formulation, under the carbon neutrality strategy, a variety of trading products such as CCER, China Emission Allowance (CEA), green electricity, and GECs are constantly emerging. Although the starting points for policy formulation related to each product differ significantly, all products possess distinct environmental attributes, which pose a risk of double-counting environmental values among them. In future policy formulation efforts, it is essential to prioritize improving arrangements including the division of environmental values, conversion/cancellation of different products, cross-market information sharing, and traceability, etc., so as to enhance the credibility of the products and boost market confidence.
- In terms of practical work, as the construction of diversified markets accelerates, the decision-making environment for VPPs will become increasingly complex. However, markets represented by CEA, CCER, and GEC in China are still in their nascent stages, with significant policy uncertainty risks concerning market scope, trading mechanisms, price systems, compliance forms, and application scenarios. During actual operations, VPPs should actively track relevant policy developments, reasonably expand businesses involving diversified markets based on the characteristics of the aggregated resources, and enhance their ability to withstand operational risks.
Author Contributions
Conceptualization, H.W., M.Z., X.L., and Z.C.; methodology, H.W. and J.H.; software, H.W.; validation, H.W. and X.L.; formal analysis, H.W., X.L., and Z.C.; data curation, X.L. and Z.C.; writing—original draft preparation, H.W. and J.H.; writing—review and editing, H.W. and J.H.; funding acquisition, H.W. All authors have read and agreed to the published version of the manuscript.
Funding
This research was funded by the Guangdong Carbon Emission Management Service Platform (ZCNTO0570).
Data Availability Statement
The original contributions presented in this study are included in the article. Further inquiries can be directed to the corresponding author.
Conflicts of Interest
Author Haiji Wang was employed by the China Energy Engineering Group Guangdong Electric Power Design Institute. The remaining authors declare that the research was conducted in the absence of any commercial or financial relationships that could be construed as a potential conflict of interest.
References
- Zhou, Z.; Ma, Z.; Lin, X. Carbon emissions trading policy and green transformation of China’s manufacturing industry: Mechanism assessment and policy implications. Front. Environ. Sci. 2022, 10, 984612. [Google Scholar] [CrossRef]
- Chen, Y.; Mu, H. Natural resources, carbon trading policies and total factor carbon efficiency: A new direction for China’s economy. Resour. Policy 2023, 86, 104183. [Google Scholar] [CrossRef]
- Liu, R. “Dual Carbon” Goals: Comprehensive Review of Technical Progress and Application of Virtual Power Plants. Ind. Control Comput. 2025, 39, 131–132. [Google Scholar]
- Wang, J.; He, S. Distributionally Robust Low-Carbon Scheduling Model for Virtual Power Plants Considering Emerging Distributed Resources and Electricity Carbon Trading. Electr. Power Constr. 2025, 46, 13–26. [Google Scholar]
- Yang, X.; Du, N.; Sun, G.; Fang, C.; Tian, Y. Bi-level optimization dispatch of virtual power plants considering the demand response. J. Electr. Power Sci. Technol. 2022, 37, 137–146. [Google Scholar]
- Wang, S.; Feng, T.; Sun, N.; He, H.; Li, J.; Cui, C.Y.H. Optimal Scheduling Strategy for Virtual Power Plant Considering Electricity-Gas-Heat Coupling and Demand Response. Electr. Power. 2024, 57, 101–114. [Google Scholar]
- Mei, Z.; Jiang, X.; Wang, K. Multi-objective Coordinated Optimal Scheduling of Virtual Power Plants Based on Demand Side Response. In Proceedings of the IEEE Asia-Pacific Conference on Image Processing, Dalian, China, 14–16 April 2022; pp. 753–757. [Google Scholar]
- Ge, C.; Lin, S.; Tan, J.; Yang, F.; Li, D. A Day-ahead Optimal Coordination Strategy for a VPP With Multiple Prosumers. Power Syst. Technol. 2025, 49, 2521–2532. [Google Scholar]
- Bhuiyan, E.A.; Hossain, M.Z.; Muyeen, S.M.; Fahim, S.R.; Sarker, S.K.; Das, S.K. Towards next generation virtual power plant: Technology review and frameworks. Renew. Sustain. Energy Rev. 2021, 150, 111358. [Google Scholar] [CrossRef]
- Huang, Y.; Chen, H.; Niu, Z.; Wang, L.; Cao, R.; Yu, Z.; Zheng, X.; Xiao, D. A review of virtual power plant architecture and key operational technologies based on a “energy-information-value” three-layer network. Power Syst. Prot. Control 2024, 52, 169–187. [Google Scholar]
- Zamani, A.G.; Zakariazadeh, A.; Jadid, S. Day-ahead resource scheduling of a renewable energy based virtual power plant. Appl. Energy 2016, 169, 324–340. [Google Scholar] [CrossRef]
- Gou, K.; Wang, J.; Chen, H.; Wang, Y.; Zhang, G.; Chen, H. Optimal Scheduling of Low-carbon Virtual Power Plants with Multiple Types of Thermal Power Units and Power-to-gas. J. Chin. Soc. Power Eng. 2025, 45, 944–952. [Google Scholar]
- Liu, X. Research on optimal dispatch method of virtual power plant considering various energy complementary and energy low carbonization. Int. J. Electr. Power Energy Syst. 2022, 136, 107670. [Google Scholar] [CrossRef]
- Zhuo, H.; Ma, Y.; Ma, H.; Wang, Y.; Li, R.; Wang, Y. Coupling operation strategy of virtual power plant and shared energy storage based on double-layer optimization. Electro Tech. Appl. 2025, 44, 86–92. [Google Scholar]
- Yang, C.; Peng, Z.; Zheng, W. Multiple time scales scheduling strategy of wind power accommodation considering energy transfer characteristics of carbon capture power plant. Proc. CSEE 2021, 41, 946–960. [Google Scholar]
- Liu, Z.; Zheng, W.; Qi, F.; Wang, L.; Zou, B.; Wen, F. Optimal dispatch of a virtual power plant considering demand response and carbon trading. Energies 2018, 11, 1488. [Google Scholar] [CrossRef]
- Zhang, L.; Dai, G.; Nie, Q.; Dong, Z. Economic dispatch model of virtual power plant considering electricity consumption under a carbon trading mechanism. Power Syst. Prot. Control 2020, 48, 154–163. [Google Scholar]
- Zheng, C.; Huang, W.; Zhai, S.; Pan, K.; He, X.; Liu, X.; Su, S.; Shen, C.; Ai, Q. Block chain-Enabled Cross-Chain Coordinated Trading Strategy for Electricity-Carbon-Green Certificate in Virtual Power Plants: Multi-Market Coupling and Low-Carbon Operation Optimization. Energies 2025, 18, 3443. [Google Scholar] [CrossRef]
- Zhao, C.; Wang, B.; Sun, Z.; Wang, X. Optimal Configuration Optimization of Islanded Microgrid Using Improved Grey Wolf Optimizer Algorithm. Acta Energiae Solaris Sin. 2022, 43, 256–262. [Google Scholar]
- Wang, B. Optimal Sizing and Economic operation of Islanded Microgrid Based on Grey Wolf Optimization Algorithm. Fuzhou Univ. 2020, 19–29. [Google Scholar] [CrossRef]
- Zhang, L.; Bao, F. Study on coordinated operation of multiple virtual power plants integrated with distributed renewable energy. Electr. Meas. Instrum. 2025, 1–9. [Google Scholar] [CrossRef]
- Ye, X. Research on Optimal Dispatching and Voltage Control Strategy of Virtual Power Plant for Active Power Distribution Network. Wuhan Univ. 2019, 49–54. [Google Scholar] [CrossRef]
- Jiang, Q.; Chang, Y.; Yi, C.; Chen, Z. Multi-Time Scale Optimization Scheduling of Combined System of New Energy Power Generation and Pumped Storage Power Station Based on NSGA-ⅡSerial Pattern Search. Acta Energiae Solaris Sin. 2024, 45, 434–441. [Google Scholar]
- Xu, X.-F.; Wang, K.; Ma, W.-H.; Wu, C.-L.; Huang, X.-R.; Ma, Z.-X.; Li, Z.-H. Multi-objective particle swarm optimization algorithm based on multi-strategy improvement for hybrid energy storage optimization configuration. Renew. Energy 2024, 223, 120086. [Google Scholar] [CrossRef]
- Ding, J.; Qin, H.; Sun, P.; Zeng, X.; Li, J.; Hao, W. Optimal scheduling of virtual power plants based on improved Harris Hawk optimization algorithm. Renew. Energy Resour. 2025, 43, 829–838. [Google Scholar]
- Li, Z.; Ran, Z.; Peng, F.; Ge, Y. Research on Low-Carbon Transition Pathways for Power Systems Under the “Double Carbon” Goals. Power Energy 2025, 46, 233–236+248. [Google Scholar]
- Li, H.; He, L.; Han, C. The Study on the Synergistic Optimization of Carbon Tax System Construction and Carbon Emission Trading Market under the Carbon Peak Background. Syst. Eng. Theory Pract. 2025, 45, 2566–2590. [Google Scholar]
- Sun, X.; Wei, Z.; Chen, S.; Huang, M.; Sun, G. Strategy for Low-Carbon Economic Operation in Industrial Parks Considering Carbon Flow Demand Response. Electr. Power Constr. 2025, 46, 84–95. [Google Scholar]
- Zeng, M.; Ma, J.; Xu, Y.; Li, R.; Bai, B.; Zhou, X. Mechanism and Path Exploration of Virtual Power Plant Participating in Peaking Product Trading under Carbon Peaking and Carbon Neutrality Goal. Price Theory Pract. 2022, 10, 9–14. [Google Scholar]
- Deng, L.; Liu, S. Snow ablation optimizer: A novel metaheuristic technique for numerical optimization and engineering design. Expert Syst. Appl. 2023, 225, 120069. [Google Scholar] [CrossRef]
- Chen, S.; Cai, Z.; Zhang, X.; Huang, Y.; Xu, H. A multi-stage parameter identification method for low-voltage ride-through model of grid-connected PV inverters based on a snow ablation algorithm. Power Syst. Prot. Control 2025, 53, 47–58. [Google Scholar]
- Qiao, L.; Yin, Q.; Yao, C.; Qian, W.; Zhao, F. Prediction model of ship fuel consumption based on BSO-BP. J. Shanghai Marit. Univ. 2024, 45, 29–34. [Google Scholar]
- Ma, L.; Cheng, S. Enhancing learning efficiency of brain storm optimization via orthogonal learning design. IEEE Trans. Syst. Man Cybern. Syst. 2020, 51, 6723–6742. [Google Scholar] [CrossRef]


Disclaimer/Publisher’s Note: The statements, opinions and data contained in all publications are solely those of the individual author(s) and contributor(s) and not of MDPI and/or the editor(s). MDPI and/or the editor(s) disclaim responsibility for any injury to people or property resulting from any ideas, methods, instructions or products referred to in the content. |
© 2025 by the authors. Licensee MDPI, Basel, Switzerland. This article is an open access article distributed under the terms and conditions of the Creative Commons Attribution (CC BY) license (https://creativecommons.org/licenses/by/4.0/).