Abstract
Hydraulic fracturing technology serves as the primary method for efficiently developing deep shale resources. During hydraulic fracturing, the thermal stress caused by the injection of fracturing fluid, which has low temperature, has a significant effect on the propagation of multiple hydraulic fractures in deep shale reservoirs. Due to the unclear mechanisms governing multi-fracture propagation in deep shale reservoirs, this study proposed a hydraulic fracturing model for multi-fracture propagation based on the principles of linear elastic fracture mechanics. The model was employed to investigate how formation properties and operational parameters influenced the expansion of multiple hydraulic fractures. The findings revealed that thermal stress fracturing caused by low-temperature fluid injection significantly affected the rock breakdown pressure and fracture initiation timing. Specifically, when the reservoir temperature exceeded 180 °C, the breakdown pressure decreased substantially, and the fracture initiation occurred much earlier. Moreover, an increase in rock thermal conductivity further reduced both the breakdown pressure and the propagation pressure, alleviating the “stress shadow” effect on intermediate fractures and promoting more uniform fracture growth. Furthermore, when the reservoir temperature surpassed 180 °C and the thermal conductivity exceeded 1.3 W/(m K), the influence of horizontal stress difference and cluster spacing on multi-fracture propagation diminished sharply—by more than 40%. This condition facilitated tight containment of the deep shale reservoir and significantly expanded the stimulated reservoir volume. These findings not only enriched and refined the theoretical understanding of hydraulic fracturing in deep shale reservoirs but also provided a valuable reference for optimizing fracturing parameters in the development of deep oil and gas reservoirs.
1. Introduction
Deep shale resources have played an important role in the energy supply [1]. The primary technology for developing deep shale reservoirs is hydraulic fracturing, which involves high-pressure water injection into low-permeability rock formations at depths of several kilometers [2]. This process initiates and propagates natural fracture networks, thereby creating high-permeability heat exchange reservoirs. Furthermore, numerical simulations and real-time monitoring have been employed to optimize fracture geometry and connectivity [3]. In-depth investigations into the fracture propagation mechanisms and thermohydromechanical coupling processes have not only improved thermal recovery efficiency and the operational lifespan of geothermal well fields but have also supported fracture network optimization and induced seismicity management [4]. These studies have provided critical scientific support for the safe and controlled development of deep shale formation [5].
To clarify the dynamics of hydraulic fracture propagation in deep shale reservoirs during fracturing, researchers both domestically and internationally conducted experimental and numerical simulation studies on hydraulic fracture extension in these reservoirs [6]. The failure mechanisms of rocks under thermal stress were primarily categorized into two types: first, thermal expansion caused by increased temperature induced tensile stress within the rock, and when this stress exceeded the rock’s tensile strength, thermal fracturing occurred; second, high-temperature rocks rapidly contracted upon cooling, concentrating internal thermal stress and inducing low-temperature cracking [7]. Tang et al. [8] demonstrated through experiments that the permeability of cores increased after high-temperature treatment, with a distinct permeability threshold for abrupt changes. They investigated the fracture threshold, thermal fracture evolution, and the factors influencing thermal fracturing in rocks of various lithologies. Guo et al. [9] evaluated the hydraulic fracturing behavior of large concrete specimens containing embedded cracks under high-temperature conditions through experiments and numerical simulations, revealing the effects of elevated temperature and crack networks on crack propagation. Rinaldi et al. [10] utilized the TOUGH2 simulator and found that thermal stress near the injection well was more significant than stress changes caused by water pressure, leading to the formation of new fractures or the opening of natural fractures. Zhu et al. [11] employed the discrete element method and concluded that thermal stress generated numerous microcracks perpendicular to the main fracture surface along the hydraulic fractures. The presence of these microcracks allowed fracturing fluid to penetrate the high-temperature rock mass along the fracture surface, leading to further microcrack generation. Colombero et al. [12], through microseismic monitoring in field experiments, observed that injecting low-temperature fluids into high-temperature deep shale created large-scale high-permeability zones. They concluded that thermal stress-induced fracturing was a key factor influencing the effectiveness of geothermal development.
In numerical simulation studies, Bujakowski et al. [13] applied the TOUGH2 2.0 software to evaluate heat extraction from thermal reservoirs and found that the volume and permeability of artificially fractured areas had a significant impact on the development effectiveness. Sun et al. [14] developed a THM coupling model to simulate the development effects of HDR, demonstrating that reducing flow resistance in EGS could improve heat extraction efficiency, although heat extraction decreased gradually over time. Li et al. [15] simulated the fracturing conditions and thermohydro coupling process of a well, showing that reservoir enhancement methods could enable the sustainable and stable development of geothermal energy. Lei et al. [16] conducted numerical simulations to analyze temperature and pressure variations in the fracture–porous media system during geothermal energy development.
The aforementioned studies identified shear failure as the primary failure mode in deep shale reservoirs with natural fractures, directly determining the fracture propagation patterns of hydraulic fractures. However, these studies neglected the influence of thermal stress generated by the injection of cold fluids during the modeling process on the formation of the fracture network [17,18]. Existing research has primarily focused on the influence of natural fracture systems in deep shale reservoirs on fracture propagation and investigated the hydraulic fracture propagation patterns under circulation pump injection conditions. Nevertheless, few studies have examined the propagation patterns of multiple fractures during hydraulic fracturing. It is widely acknowledged that thermal stress-induced fracturing, caused by the injection of low-temperature fluids, significantly influences multi-fracture propagation. Understanding the multi-fracture propagation patterns in deep shale reservoirs is essential for enhancing the development effectiveness of deep shale [19].
Given the unclear understanding of the multi-fracture propagation patterns in deep shale reservoirs and the ambiguous influence of thermal stress-induced fracturing on these patterns, this study focused on deep shale reservoirs. By establishing a numerical simulation model, this study simulated and analyzed the multi-fracture propagation process within deep shale reservoirs, determining the multi-fracture propagation patterns under the influence of thermal stress fields.
2. Method
During the hydraulic fracturing of deep shale reservoirs, the fracturing process was categorized into three primary stages: (1) Rock Fracturing Initiation: This stage involved the injection of high-pressure fracturing fluid, where the rock experienced failure due to the combined effects of elevated fluid pressure and thermal stress. (2) Fracture Propagation: As fracturing fluid continued to be injected, the fractures extended under the combined influence of high-pressure fluid, thermal stress, and the induced stress field. (3) Fracturing Fluid Leak-Off: Due to the porous nature of the reservoir rock, the fracturing fluid infiltrated the rock matrix during injection, altering the local pore pressure and temperature fields [20,21,22,23]. The governing equations for these interrelated physical processes were presented below.
2.1. Control Equations of Hydraulic Fracturing in Deep Shale Reservoirs
The theoretical foundation of hydraulic fracturing in deep shale reservoirs was based on the coupled thermal-fluid-solid interaction, which was described by the solid deformation equation. The governing equations of solid deformation primarily comprised the equilibrium equation, geometric relations, and constitutive equation, expressed as follows:
During the hydraulic fracturing of deep shale reservoirs, both tensile and shear failures occurred. Therefore, the maximum tensile stress criterion and the Mohr–Coulomb criterion were employed to characterize tensile and shear failures, respectively. In this context, tensile failure was considered positive, while compressive failure was considered negative. The governing equations were as follows:
When the rock experienced tensile failure (F1 ≥ 0), the governing equation for the damage variable was expressed as follows:
Among
When shear failure occurred in the rock (F2 ≥ 0), the governing equation for the damage variable was expressed as follows:
The governing equation for the elastic modulus during fracturing was expressed as follows:
During the fracturing process, the porosity of HDR varied with applied stress, while the permeability increased in response to the accumulation of rock damage. The governing equations were as follows:
If , and represented the maximum, intermediate, and minimum principal stresses, respectively, then
The relationship between variables and , as well as between variables and , was defined as follows:
The tensile and shear strains generated during the fracturing of deep shale reservoirs were as follows:
Considering the impact of temperature variation on permeability, the temperature sensitivity coefficient was incorporated into the permeability evolution equation to achieve temperature-stress-seepage coupling. Consequently, the strain and permeability evolution equations under thermohydromechanical (THM) coupling conditions were derived as follows [21]:
2.2. Fluid Flow Equation in Cracks
The Navier–Stokes equations governing incompressible Newtonian fluids were restated as follows:
Neglecting inertia and body forces, the above equation was simplified as follows:
The governing equation for fluid flow within deep shale was obtained:
3. Numerical Simulation
3.1. Establishment of a Hydraulic Fracture Propagation Model for Deep Shale Reservoirs
To investigate the multi-fracture propagation behavior during the horizontal well fracturing of deep shale reservoirs, a two-dimensional hydraulic fracturing model was developed using ABAQUS 2019 software. The model represented a 150 m × 100 m reservoir with a single-stage, three-cluster configuration. The rock matrix was discretized using 48,000 CPE4P elements (pore pressure structural elements), while hydraulic fractures were modeled with 3760 COH2D4P elements [24,25]. Detailed parameters are provided in Table 1.

Table 1.
Parameters of hydraulic fracturing fracture propagation model in deep shale reservoirs.
3.2. Model Validity Verification
During the study, a 30 cm × 30 cm numerical simulation model was developed to replicate the experimental fracture morphology of the main plane. The model’s validity was evaluated by comparing the variations in the hydraulic fracturing injection pressure curve. The maximum horizontal principal stress was set at 12.0 MPa, the minimum horizontal principal stress at 10.4 MPa, and the vertical stress at 15.0 MPa. The reservoir temperature was maintained at 100 °C, and the injection flow rate was set to 25.0 mL/min.
As indicated in Figure 1, it was found that first, hydraulic fractures primarily exhibited planar characteristics during initiation and propagation, with no significant bending observed. The fracture morphology obtained from the numerical simulation closely matched the experimental results (Figure 1a,b). Second, the experiments indicated a rock fracture pressure of 16.3 MPa during hydraulic fracturing and an average fracture extension pressure of 11.2 MPa. The numerical simulation yielded a rock fracture pressure of 15.8 MPa and an average fracture extension pressure of 11.6 MPa. The errors between the simulated and experimental rock fracture pressures and fracture extension pressures were 3.07% and 3.57%, respectively, indicating minimal deviation between the model accuracy and the actual experimental results (Figure 1c).
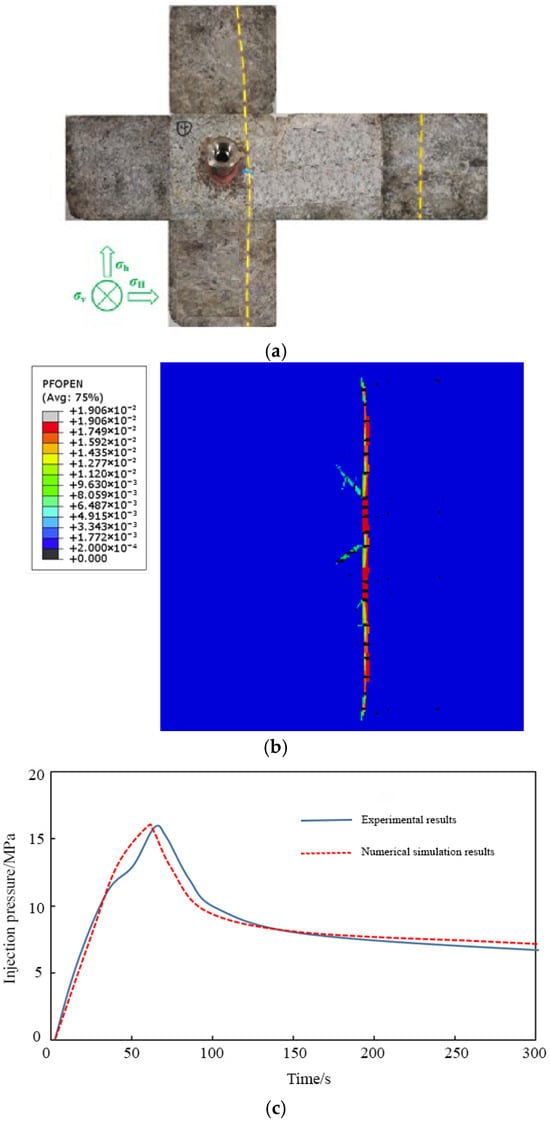
Figure 1.
Deep shale hydraulic fracturing model verification. (a) Results of true triaxial hydraulic fracturing experiment on deep shale. (b) Numerical simulation results of true triaxial hydraulic fracturing of deep shale. (c) Comparison of injection pressure between experimental results and numerical simulation results.
3.3. Analysis of Numerical Simulation Results
3.3.1. Effect of Reservoir Temperature on Hydraulic Fracture Expansion
Based on the hydraulic fracturing crack propagation model of deep shale reservoirs, reservoir temperatures were set to 120 °C, 140 °C, 160 °C, 180 °C, and 200 °C, respectively. The dynamic propagation behavior of hydraulic fractures under single-fracture conditions was analyzed while maintaining a horizontal stress difference of 5.0 MPa. Figure 2 illustrates the fracture propagation morphology at different formation temperatures. The simulation results indicated that when the formation temperature was below 160 °C, the hydraulic fracture consisted of one main fracture and one branch fracture [26]. However, at formation temperatures of 180 °C and 200 °C, the number of branch fractures increased significantly, forming a fracture network characterized by one main fracture and four branch fractures.
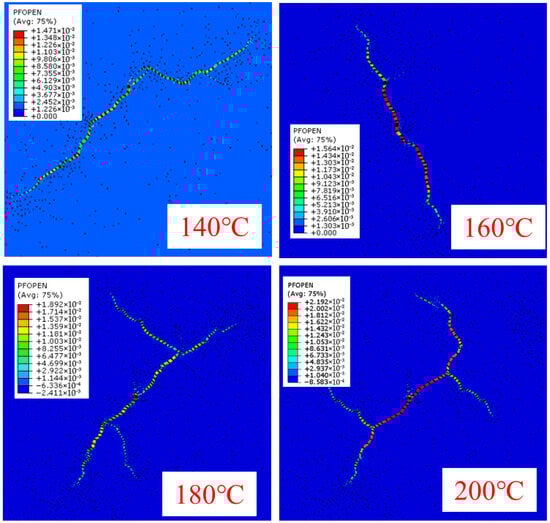
Figure 2.
Dynamics of hydraulic fracture expansion under different formation temperature conditions.
To further investigate the characteristics of hydraulic fracturing under varying formation temperatures, four injection pressure curves corresponding to different temperatures were extracted (Figure 3). By comparing the injection pressure variations, it was observed that as the formation temperature increased, the onset time of rock damage during hydraulic fracturing was significantly advanced. Specifically, rock damage occurred at approximately 320 s when the temperature was 140 °C, advanced to 296 s at 160 °C, further advanced to 261 s at 180 °C, and reached 148 s at 200 °C.
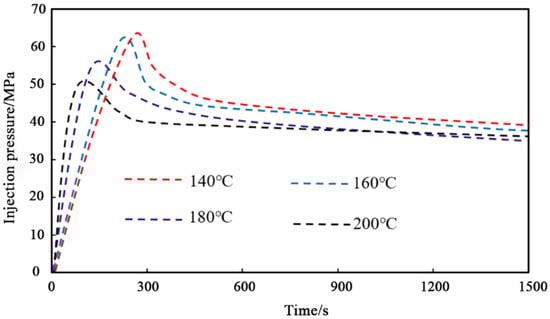
Figure 3.
Comparison of injection pressure under different formation temperature conditions.
By comparing the fracture pressure and fracture extension pressure at different formation temperatures, it was found that when the formation temperature was 140 °C, the reservoir rock fracture pressure was 65.8 MPa, and the average fracture extension pressure was 47.2 MPa. At 160 °C, the fracture pressure decreased to 63.4 MPa, and the average extension pressure was 45.7 MPa. When the temperature rose to 180 °C, the fracture pressure further declined to 57.4 MPa, with an average extension pressure of 43.1 MPa. At 200 °C, the fracture pressure dropped to 51.2 MPa, and the average extension pressure was 41.1 MPa [27,28]. These results demonstrated that both fracture pressure and fracture extension pressure decreased to varying degrees as the formation temperature increased, with a significant reduction observed at 180 °C. Using a commonly employed reservoir rock fracture pressure calculation formula, the theoretical fracture pressure under these conditions was approximately 66.4 MPa. The measured fracture pressures at 140 °C and 160 °C were close to this theoretical value, whereas a marked decline occurred at 180 °C.
The primary cause of this phenomenon was that, as the formation temperature increased, the injection of fracturing fluid into the formation caused rapid cooling of the rock, generating a low-temperature-induced thermal stress fracturing effect. This thermal stress fracturing led to a sharp decrease in rock fracture pressure (Figure 4 and Table 2). When the temperature difference between the reservoir rock and fracturing fluid exceeded a certain threshold, the low-temperature-induced thermal stress fracturing effect occurred. During the simulation, at a formation temperature of 180 °C (corresponding to a temperature difference of 160 °C between the rock and the fracturing fluid), a significant thermal stress fracturing effect was observed. As this temperature difference further increased, the injection pressure required for rock failure decreased, resulting in earlier rock fracture initiation. The thermal stress fracturing phenomenon, caused by the temperature difference between the reservoir and the fracturing fluid, also contributed to an increase in the number of branch fractures during hydraulic fracturing due to the reduction in rock fracture pressure. Therefore, when the formation temperature exceeded 180 °C, the number of branch fractures increased significantly.
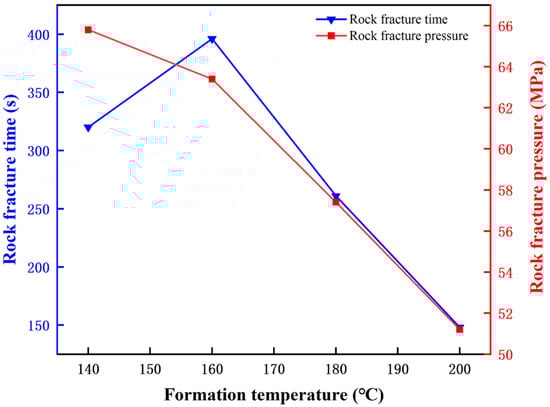
Figure 4.
Statistical diagram of reservoir rock fracture time and pressure under different formation temperature conditions.
Table 2.
Statistics of reservoir rock rupture time and pressure under different formation temperature conditions.
3.3.2. Effect of Horizontal Stress Difference on the Extension of Multiple Cracks
During the synchronous propagation of multiple hydraulic fractures, the “stress shadow” effect caused by the induced stress between fractures significantly influenced their simultaneous expansion. To date, both domestic and international researchers have extensively studied the “stress shadow” effect, analyzing how fracture spacing, horizontal stress difference, and injection parameters affect fracture propagation. However, these studies did not consider the impact of temperature field variations on fracture growth. In this section, twelve numerical simulation experiments were conducted to investigate the influence of horizontal stress difference under varying formation temperatures on the synchronous propagation of multiple hydraulic fractures. The formation temperatures were set to 140 °C, 200 °C, and 260 °C, while the horizontal stress differences were set to 6.0 MPa, 8.0 MPa, 10.0 MPa, and 12.0 MPa. To eliminate the influence of changes in the minimum horizontal principal stress on fracture propagation, the minimum horizontal principal stress was held constant throughout the simulations; different horizontal stress differences were achieved by varying the maximum horizontal principal stress. A single-stage, three-cluster hydraulic fracturing case was used as an example, with a fracture cluster spacing of 15.0 m.
In the first set of numerical simulations (Figure 5 and Figure 6 and Table 3), the morphology of hydraulic fracture propagation was analyzed at a formation temperature of 140 °C with horizontal stress differences of 6.0 MPa, 8.0 MPa, 10.0 MPa, and 12.0 MPa, respectively. The results indicated that as the horizontal stress difference increased, the discrepancy between the propagation length of the middle fracture and that of the side fractures also increased. When the horizontal stress difference was 6.0 MPa, the three hydraulic fractures exhibited nearly free propagation, and the stress shadow effect exerted minimal inhibition on the middle fracture, whose propagation length was only 2.4% shorter than that of the side fractures. At 8.0 MPa, the propagation of the middle fracture was slightly constrained, with its length reduced by 8.2% relative to the side fractures [29]. When the horizontal stress difference increased to 10.0 MPa, the inhibition of the middle fracture propagation became significant, with its length reduced by 34.7% compared to the side fractures. At 12.0 MPa, the restriction on the middle fracture propagation intensified further, the stress shadow effect was enhanced, and the difference in fracture lengths increased to 51.6%.
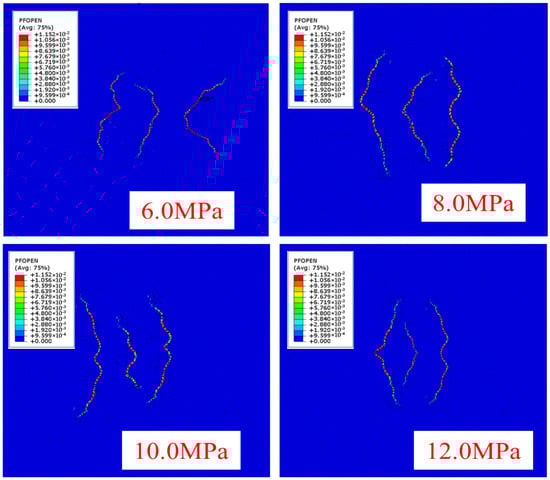
Figure 5.
Multi-fracture extension diagram under different horizontal stress differences at a formation temperature of 140 °C.
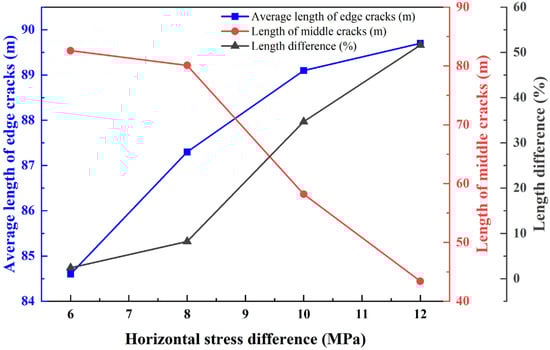
Figure 6.
Comparison of multiple crack extension lengths under different horizontal stress differences.
Table 3.
Comparison of multiple fracture extension lengths under different horizontal stress differences at a formation temperature of 140 °C.
When the formation temperature increased to 200 °C, the hydraulic fracture propagation morphology under horizontal stress differences of 6.0 MPa, 8.0 MPa, 10.0 MPa, and 12.0 MPa is shown in Figure 7. As illustrated in Figure 7 and Figure 8 and Table 4, the disparity in propagation lengths among the three hydraulic fractures was significantly reduced at 200 °C. When the horizontal stress difference was 6.0 MPa, the propagation length of the edge fracture was 94.2 m, while that of the middle fracture was 92.8 m. The stress shadow effect exerted minimal inhibition on the middle fracture, whose length was 1.4% shorter than the edge fracture. At 8.0 MPa, the edge fracture propagated to 93.7 m, and the middle fracture reached 88.9 m, representing a 5.2% reduction relative to the edge fracture. When the horizontal stress difference increased to 10.0 MPa, the edge fracture extended to 92.3 m, whereas the middle fracture length decreased significantly to 72.6 m, showing a 21.3% reduction. At 12.0 MPa, the propagation of the middle fracture was further constrained; the edge fracture extended to 92.1 m, while the middle fracture shortened to 69.2 m. Consequently, the stress shadow effect intensified, and the difference in fracture lengths increased to 24.8%.
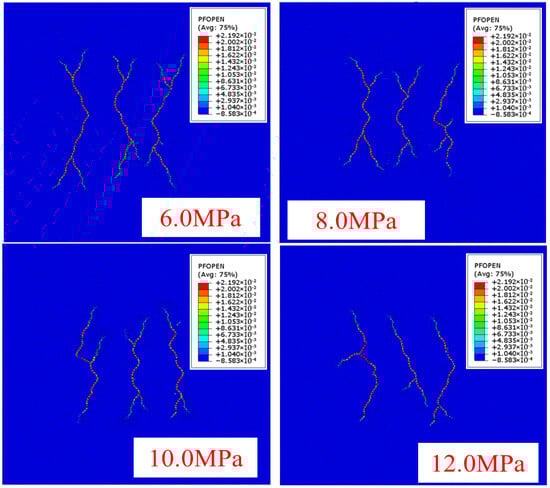
Figure 7.
Multi-fracture extension diagram under different horizontal stress differences at a formation temperature of 200 °C.
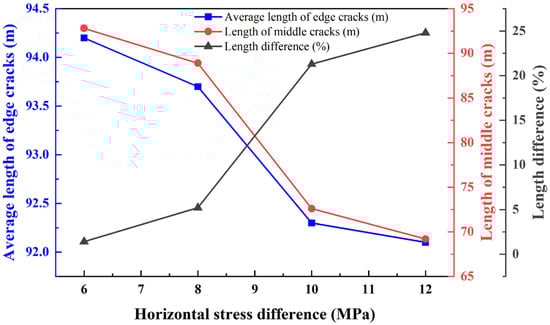
Figure 8.
Comparison of the extension lengths of multiple cracks under different horizontal stress differences.
Table 4.
Comparison of multiple fracture extension lengths under different horizontal stress differences at a formation temperature of 200 °C.
When the formation temperature increased to 260 °C, the hydraulic fracture propagation morphology under horizontal stress differences of 6.0 MPa, 8.0 MPa, 10.0 MPa, and 12.0 MPa is presented in Figure 9. As shown in Figure 9 and Figure 10 and Table 5, at this temperature, the difference in propagation lengths among the three hydraulic fractures was significantly reduced. When the horizontal stress difference was 6.0 MPa, the edge fracture propagated to 97.3 m, and the middle fracture extended to 96.8 m. The stress shadow effect exerted minimal inhibition on the middle fracture, whose length was 0.51% shorter than the edge fracture. At 8.0 MPa, the edge fracture reached 96.9 m, while the middle fracture extended to 95.4 m, representing a 1.44% reduction relative to the edge fracture. When the horizontal stress difference increased to 10.0 MPa, the edge fracture propagated to 94.3 m, and the middle fracture to 91.5 m. The degree of restriction on the middle fracture’s extension increased slightly, with the middle fracture length being 2.97% shorter than the edge fracture. At 12.0 MPa, the propagation of the middle fracture was further constrained; the edge fracture extended to 93.7 m, while the middle fracture shortened to 90.2 m. Consequently, the stress shadow effect intensified, and the difference in fracture lengths increased to 3.74% [30].
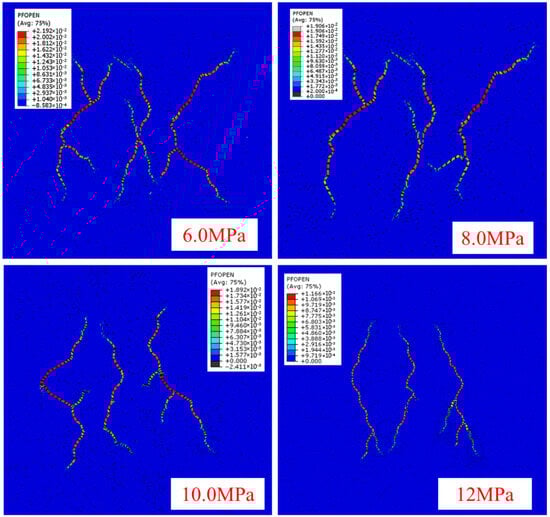
Figure 9.
Multi-fracture extension diagram under different horizontal stress differences at a formation temperature of 260 °C.
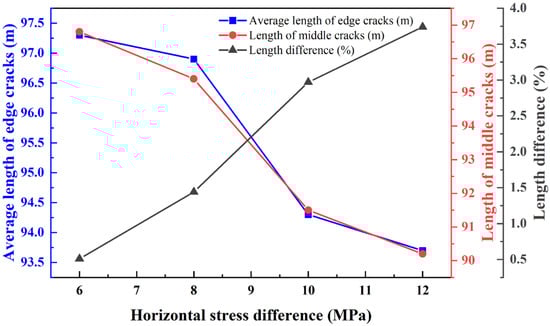
Figure 10.
Comparison of extension lengths of multiple cracks under different horizontal stress differences.
Table 5.
Comparison of multiple fracture extension lengths under different horizontal stress differences at a formation temperature of 260 °C.
A comparison of fracture propagation morphology at different formation temperatures revealed that the extension length of hydraulic fractures increased with rising formation temperatures. At 140 °C, as formation pressure increased, the stress shadow effect on the middle fracture intensified, leading to a gradual reduction in its extension length. However, at 200 °C and 260 °C, the disparity between the extension lengths of the middle and edge fractures was significantly reduced.
As shown in Figure 11, when the formation temperature was 140 °C, the difference in extension lengths between edge and middle fractures increased significantly once the formation pressure exceeded 8 MPa. When the horizontal stress difference reached 12 MPa, this difference reached 51.6%. Increasing the formation temperature effectively mitigated the impact of the stress shadow effect on fracture propagation. Specifically, at formation temperatures of 200 °C and 260 °C with a horizontal stress difference of 12 MPa, the difference in extension lengths between edge and middle fractures was reduced to 24.8% and 3.74%, respectively.
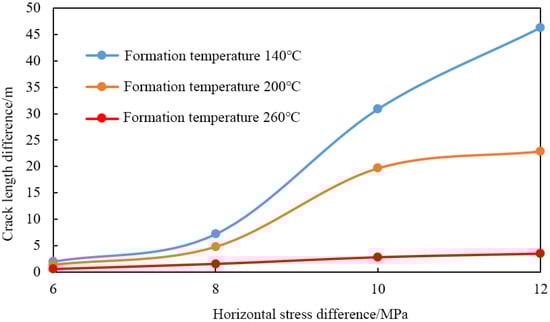
Figure 11.
Comparison of the difference in the extension of side cracks and middle cracks under different formation temperatures and different horizontal stress differences.
To further understand the influence of formation temperature on fracture propagation, the injection pressure curves were extracted, providing insights into hydraulic fracturing pressures under various conditions (Figure 12). The results indicated that increasing the formation temperature significantly reduced the rock fracture pressure during hydraulic fracturing. A comparison of rock fracture pressures at 140 °C and 260 °C revealed a 22.9% reduction in fracture pressure with rising temperature. This reduction in fracture pressure also promoted the formation of branch fractures. The distribution of hydraulic fractures at different formation temperatures demonstrated that the number of branch fractures increased substantially with rising temperature. At 140 °C, hydraulic fracture propagation was predominantly characterized by the expansion of primary fractures. In contrast, at 200 °C and 260 °C, the number of branch fractures increased markedly during propagation. These findings suggest that a greater temperature difference between the formation and the fracturing fluid enhanced the low-temperature-induced thermal stress fracturing effect. This effect not only reduced fracture pressure but also increased fracture complexity, diminished the stress shadow effect’s impact on fracture propagation, and promoted the development of complex fracture networks [31,32].
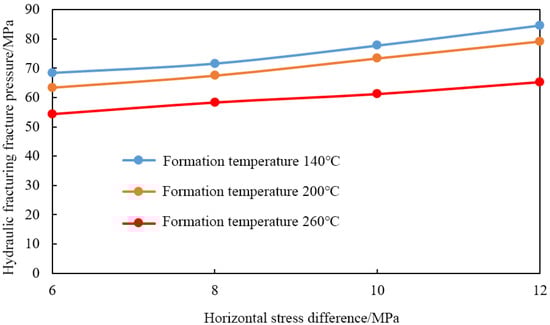
Figure 12.
Comparison of hydraulic fracturing fracture pressure under different formation temperatures and different horizontal stress differences.
3.3.3. Effect of Cluster Spacing on Multi-Crack Extension
To further investigate the impact of cluster spacing on the propagation of multiple fractures, the formation temperatures were set to 180 °C and 240 °C, with a horizontal stress difference of 14.0 MPa. Numerical simulations were conducted to examine the dynamic propagation of multiple hydraulic fractures at cluster space of 5.0 m, 8.0 m, 10.0 m, and 13.0 m.
At a formation temperature of 180 °C, as the cluster spacing decreased to 10.0 m, the propagation of the middle fracture became restricted, with a difference of 1.38 m in extension length between the edge and middle fractures, resulting in a 0.97% reduction in the middle fracture’s extension length. When the cluster spacing was further reduced to 8.0 m, the difference in extension length between the middle and edge fractures increased, leading to a 1.67% reduction in the middle fracture’s extension length. At a cluster spacing of 5.0 m, this difference further expanded to 3.47% (Figure 13 and Figure 14 and Table 6).
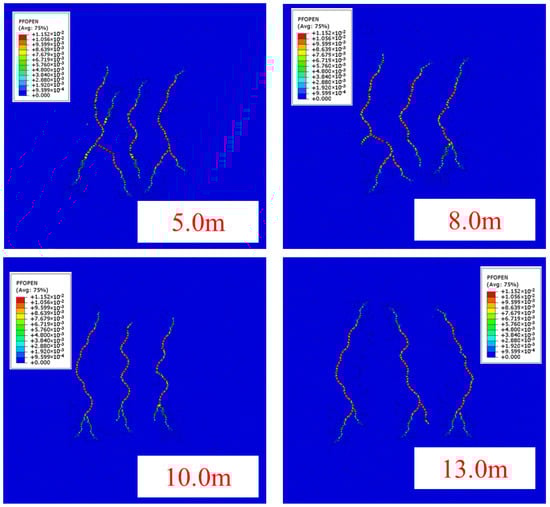
Figure 13.
Hydraulic fracture propagation morphology at a formation temperature of 180 °C and different cluster spacing.
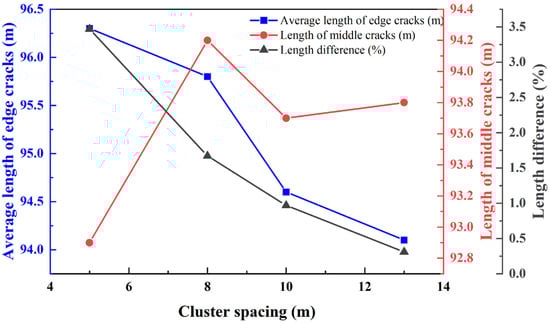
Figure 14.
Comparison of hydraulic fracture extension lengths at different cluster spacings.
Table 6.
Comparison of hydraulic fracture extension lengths at different cluster spacings at a formation temperature of 180 °C.
Conversely, increasing the cluster spacing reduced the number of hydraulic fracture branches. Considering both the extension length of hydraulic fractures and the number of branch fractures, the optimal cluster spacing under these conditions was determined to be 8.0 m.
At a formation temperature of 240 °C, the dynamic simulation results of multiple hydraulic fracture propagation under cluster spacings of 5.0 m, 8.0 m, 10.0 m, and 13.0 m are presented in Figure 15 and Figure 16. The results indicated that hydraulic fractures generally exhibited unrestricted propagation under different cluster spacing conditions. Only when the cluster spacing was 5.0 m did the propagation of the middle fracture experience noticeable restriction.
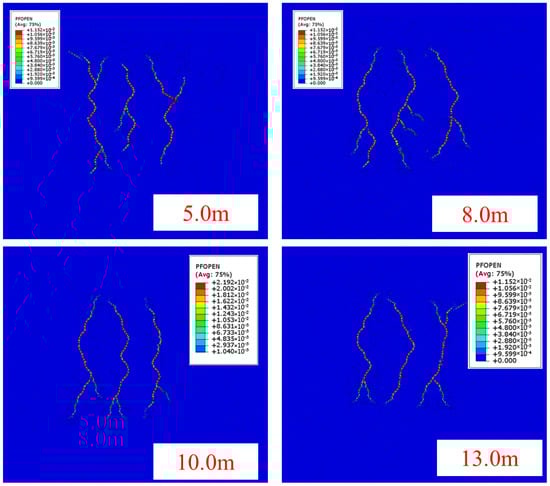
Figure 15.
Hydraulic fracture propagation morphology at a formation temperature of 240 °C and different cluster spacings.
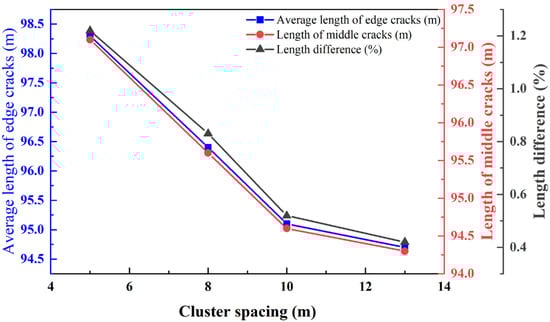
Figure 16.
Comparison of hydraulic fracture extension lengths with different cluster spacings when the formation temperature is 240 °C.
As shown in Table 7, when the cluster spacing was 5.0 m, the extension length of the edge fracture increased by 1.22% compared to the middle fracture. At a cluster spacing of 8.0 m, the extension lengths of the edge and middle fractures were nearly identical, with a length difference of only 0.83%. Further increasing the cluster spacing to 13.0 m reduced the difference between the edge and middle fractures to 0.42%. Based on these results, the optimal cluster spacing under the given conditions was determined to be approximately 5.0 m.
Table 7.
Comparison of hydraulic fracture extension lengths at different cluster spacings at a formation temperature of 240 °C.
By comparing the multi-fracture propagation patterns under various formation temperature conditions, it was observed that, under the same cluster spacing, higher formation temperatures led to the formation of more branch fractures and increased hydraulic fracture propagation lengths. Additionally, higher formation temperatures further reduced the optimal cluster spacing, facilitated closer spacing between fractures during hydraulic fracturing, and mitigated the impact of the stress shadow effect on multiple fracture propagation. Based on the simulation, it can be concluded that when the formation temperature was 180 °C, the optimized cluster space was 10.0 m, while it decreased to 8.0 m when the formation temperature was 240 °C.
3.3.4. Effect of Rock Thermal Conductivity on the Extension of Multiple Fractures
To investigate the impact of rock thermal conductivity on the dynamic propagation of multiple hydraulic fractures, the temperature of the deep shale reservoir was set to 200 °C, with a horizontal stress difference of 10.0 MPa and a cluster spacing of 4.0 m. The rock thermal conductivity was varied at 1.2 W/(m·K), 1.3 W/(m·K), 1.4 W/(m·K), 1.5 W/(m·K), and 1.6 W/(m·K). Figure 19 presents the simulation results for the propagation of multiple hydraulic fractures under these different thermal conductivity conditions.
The simulation results indicated that as the thermal conductivity of the rock increased, the difference in extension length between the middle crack and the edge crack gradually decreased. At a thermal conductivity of 1.2 W/(m·K), the hydraulic fracture exhibited a pronounced internal inclusion phenomenon during propagation. This phenomenon was significantly reduced when the thermal conductivity increased to 1.3 W/(m·K). Furthermore, at a thermal conductivity of 1.5 W/(m·K), the three fractures propagated uniformly, accompanied by a substantial increase in the number of branch fractures (Figure 17 and Figure 18 and Table 8).
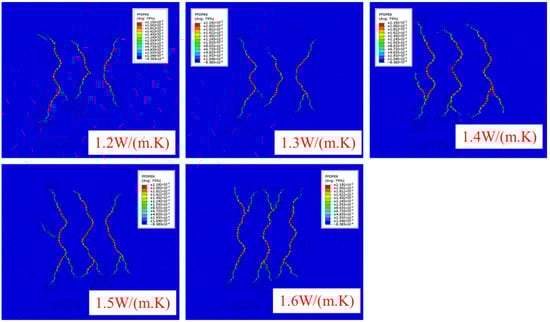
Figure 17.
Dynamic simulation of multiple hydraulic fracture extension under different rock thermal conductivity conditions.
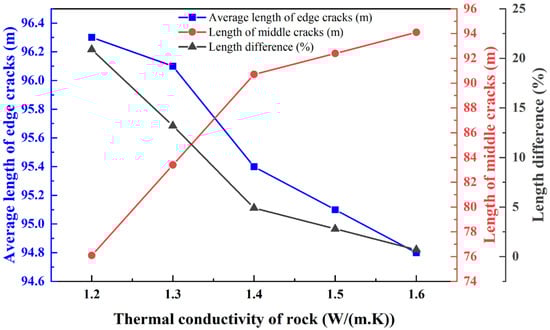
Figure 18.
Comparison of hydraulic fracture extension length under different rock thermal conductivity conditions.
Table 8.
Comparison of hydraulic fracture extension length under different rock thermal conductivity conditions.
Figure 19 illustrates the variation in injection pressure under different rock thermal conductivities. The simulation results revealed that as the thermal conductivity of the rock increased, the hydraulic fracturing injection pressure gradually decreased, and the rock fracture occurred earlier. This observation indicated that higher rock thermal conductivity enhanced the thermal stress fracturing effect induced by the injection of low-temperature fluids while mitigating the “stress shadow” effect during the propagation of multiple fractures.
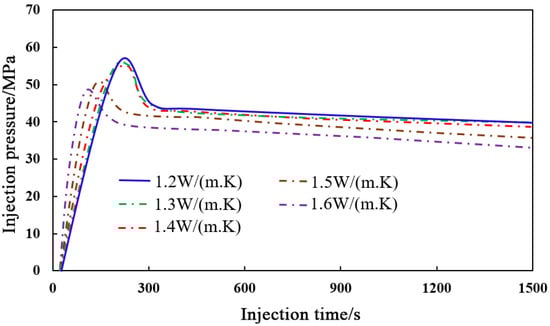
Figure 19.
Changes in injection pressure under different rock thermal conductivity conditions.
4. Discussion and Analysis
To further elucidate the variation in reservoir rock properties during the fracturing of HDR reservoirs, a functional relationship between the degree of reservoir rock damage and permeability was established based on damage mechanics theory. Specifically, Equation (21) provided the calculation formula for determining the degree of reservoir rock damage.
During the research, the physical properties of reservoir rocks under single-fracture expansion conditions were initially analyzed. Figure 20 and Figure 21 illustrated the variations in Young’s modulus and reservoir permeability of the rocks during hydraulic fracturing at different formation temperatures. The analysis of Young’s modulus degradation under single-fracture conditions revealed that as the formation temperature increased, the degradation area of Young’s modulus expanded significantly. Notably, when the formation temperature exceeded 180 °C (specifically reaching 200 °C), the degradation zone of Young’s modulus exhibited a marked increase. Furthermore, Figure 21 demonstrated that due to reservoir damage, the area of the permeability enhancement zone also expanded significantly.
Figure 20.
Comparison of the variation range of the Young’s modulus of reservoir rocks during hydraulic fracturing at different formation temperatures.
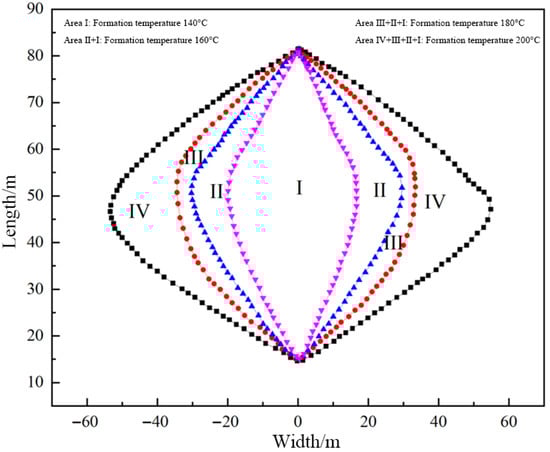
Figure 21.
Comparison of the reservoir rock permeability variation range during hydraulic fracturing at different formation temperatures.
Figure 22 illustrated that at a formation temperature of 140 °C, the average reservoir permeability exhibited a distinct three-peak pattern. The permeability was highest at the main fracture due to its extension and expansion, with a maximum value of 27.4 mD. As the distance from the main fracture increased, the reservoir permeability gradually decreased, showing a sharp decline approximately 12 m away from the main fracture. This decline resulted primarily from compressive deformation of the reservoir rock caused by the fracture surface opening during the formation of the main fracture.
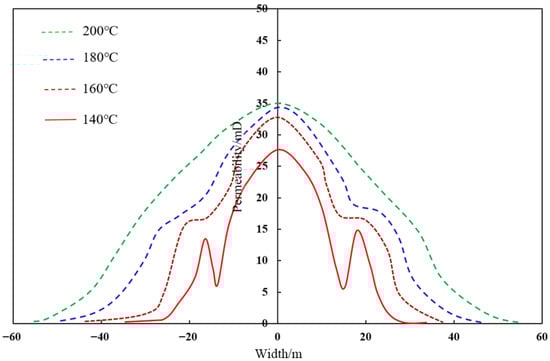
Figure 22.
Comparison of average permeability changes of reservoir rocks during hydraulic fracturing at different formation temperatures.
Beyond the compression zone, permeability slightly increased due to damage induced in the distal rock by the extension of the main fracture and its branches, before eventually returning to the initial permeability value. When the formation temperature increased to 160 °C, the reduction in permeability caused by fracture surface compression was significantly mitigated. This mitigation was mainly attributed to low-temperature-induced thermal stress fracturing, where rock damage from thermal stress compensated for the permeability reduction caused by compression. At formation temperatures of 180 °C and 200 °C, the reservoir permeability decreased gradually from the main fracture to the initial value, with permeability reductions caused by rock compression being fully offset by thermal stress fracturing-induced damage.
5. Conclusions
Thermal stress damage caused by low-temperature fluid injection significantly influenced the propagation of multiple fractures during hydraulic fracturing. Based on linear elastic fracture mechanics theory, this study employed finite element numerical simulations to analyze factors affecting the propagation of multiple fractures in deep shale reservoirs, leading to the following conclusions:
- (1)
- Thermal stress damage induced by low-temperature fluid injection effectively mitigated the restriction imposed by the “stress shadow” effect on the propagation of intermediate fractures, facilitating balanced initiation and propagation of multiple fractures. Additionally, low-temperature-induced thermal stress fracturing significantly reduced both rock fracture pressure and fracture propagation pressure during hydraulic fracturing.
- (2)
- Higher reservoir temperatures and greater rock thermal conductivity intensified the low-temperature-induced thermal stress fracturing effect during hydraulic fracturing, thereby diminishing the influence of horizontal stress differences and cluster spacing on multiple fracture propagation.
- (3)
- With increasing formation temperature, the degradation zone of Young’s modulus in the reservoir rock expanded markedly during hydraulic fracturing, indicating that the stress disturbance zone enlarged as formation temperature increased.
Author Contributions
Conceptualization, B.W. and J.D.; Methodology, B.W. and P.Z.; Software, B.W. and J.D.; Validation, B.W. and J.D.; Formal analysis, K.L.; Investigation, B.W.; Resources, P.Z. and K.L.; Writing—original draft, B.W., J.D., P.Z. and K.L. All authors have read and agreed to the published version of the manuscript.
Funding
This research received no external funding.
Data Availability Statement
The data presented in this study are available on request from the corresponding author. The data are not publicly available due to privacy or ethical restrictions.
Conflicts of Interest
Authors Bin Wang, Jingfeng Dong, Peiyao Zhou and Kaixin Liu were employed by Production Technology Research Institute, PetroChina Xinjiang Oilfield Company.
Abbreviations
The following abbreviations are used in this manuscript:
| Nomenclature | Dimensionless Quantities Are Marked with (*) | ||
| Cauchy tensor (N/m2) | expansion coefficient (°C−1) | ||
| body force (N/m3) | force per unit mass (m/s2) | ||
| Density (kg/m3) | fluid pressure (N/m2) | ||
| damping coefficient (N·s/m) | fluid loss rate (m2/s) | ||
| Displacement (m) | filter coefficient (m/s) | ||
| Strain (*) | fracturing damage degree (*) | ||
| weight function (*) | residual Young’s modulus (Pa) | ||
| jacobian value (*) | Maximum, intermediate, minimum principal stresses (Pa) | ||
| drucker-Prager criterion (Pa) | internal friction angle and cohesion (N/m2) | ||
| bulk density of stone (kg/m3) | drucker-prager criterion material constants (Pa) | ||
| fatigue damage (*) | bulk density of stone (kg/m3) | ||
| elastic modulus (Pa) | fluid viscosity (Pa·s) | ||
| Frequency (Hz) | pore pressure (N/m2) | ||
| compressive strength (Pa) | damage variables (*) | ||
| tensile strength (Pa) | initial elastic modulus (Pa) | ||
| initial permeability (m2) | compression strength (Pa) | ||
| Strain (*) | tensile Strength (Pa) | ||
| tensile principal strain (*) | state Function (Pa) | ||
| rock porosity (%) | rock permeability (m2) | ||
| residual porosity (%) | compressive principal strain (*) | ||
| permeability variation coefficient (*) | ultimate tensile strain (*) | ||
| Initial porosity (%) | Initial porosity (%) | ||
| influence coefficient (Pa−1) | effective stress (Pa) | ||
References
- Aliyu, M.D.; Archer, R.A. A thermo-hydro-mechanical model of a hot dry rock geothermal reservoir. Renew. Energy 2021, 176, 475–493. [Google Scholar] [CrossRef]
- Fu, G.; Peng, S.; Wang, R.; Zhao, J.; Yan, F.; Xie, J.; Yang, Y.; Xie, X.; Ming, Y.; Wang, D.; et al. Seismic prediction and evaluation techniques for hot dry rock exploration and development. J. Geophys. Eng. 2022, 19, 694–705. [Google Scholar] [CrossRef]
- Huang, L.; Liao, X.; Fu, H.; Wang, X.; Weng, D.; Feng, G.; Hu, D. Interaction behaviors between finite-scale natural and hydraulic fractures in hot dry rock geothermal systems. Phys. Fluids 2025, 37, 026614. [Google Scholar] [CrossRef]
- Li, S.; Zhang, D. Three-Dimensional Thermoporoelastic Modeling of Hydrofracturing and Fluid Circulation in Hot Dry Rock. J. Geophys. Res. Solid Earth 2023, 128, 025673. [Google Scholar] [CrossRef]
- Guo, T.; Tang, S.; Liu, S.; Liu, X.; Zhang, W.; Qu, G. Numerical simulation of hydraulic fracturing of hot dry rock under thermal stress. Eng. Fract. Mech. 2020, 240, 107350. [Google Scholar] [CrossRef]
- Mindygaliyeva, B.; Uzun, O.; Amini, K.; Kazemi, H.; Fleckenstein, W. Assessment of two recent hot dry rock thermal energy production projects. Geothermics 2024, 122, 103051. [Google Scholar] [CrossRef]
- Yin, W.; Feng, Z.; Zhao, Y. Investigation on the characteristics of hydraulic fracturing in fractured-subsequently-filled hot dry rock geothermal formation. Renew. Energy 2024, 223, 120061. [Google Scholar] [CrossRef]
- Tang, Z.; Wu, Z.; Zou, J. Appraisal of the number of asperity peaks, their radii and heights for three-dimensional rock fracture. Int. J. Rock Mech. Min. Sci. 2022, 153, 105080. [Google Scholar] [CrossRef]
- Guo, L.; Wang, Z.; Zhang, Y.; Wang, Z.; Jiang, H. Experimental and Numerical Evaluation of Hydraulic Fracturing under High Temperature and Embedded Fractures in Large Concrete Samples. Water 2020, 12, 3171. [Google Scholar] [CrossRef]
- Rinaldi, A.; Nespoli, M. TOUGH2-seed: A coupled fluid flow and mechanical-stochastic approach to model injection-induced seismicity. Comput. Geosci. 2017, 108, 86–97. [Google Scholar] [CrossRef]
- Zhu, Y.; Liu, C.; Zhang, H.; Zhao, C.; Wang, B.; Mao, M.; Geng, H. Micro mechanism investigation of hydraulic fracturing process based a fluid-solid coupling discrete element model. Comput. Geotech. 2024, 174, 106640. [Google Scholar] [CrossRef]
- Colombero, C.; Comina, C.; Vinciguerra, S.; Benson, P.M. Microseismicity of an Unstable Rock Mass: From Field Monitoring to Laboratory Testing. JGR Solid Earth 2018, 123, 1673–1693. [Google Scholar] [CrossRef]
- Guo, T.; Tang, S.; Sun, J.; Gong, F.; Liu, X.; Qu, Z.; Zhang, W. A coupled thermal-hydraulic-mechanical modeling and evaluation of geothermal extraction in the enhanced geothermal system based on analytic hierarchy process and fuzzy comprehensive evaluation. Appl. Appl. Energy 2020, 258, 113981. [Google Scholar] [CrossRef]
- Sun, Z.; Zhang, X.; Xu, Y.; Yao, J.; Wang, H.-X.; Lv, S.; Sun, Z.-L.; Huang, Y.; Cai, M.-Y.; Huang, X. Numerical simulation of the heat extraction in EGS with thermal-hydraulic-mechanical coupling method based on discrete fractures model. Energy 2017, 120, 20–33. [Google Scholar] [CrossRef]
- Li, Y.; Peng, G.; Tang, J.; Zhang, J.; Zhao, W.; Liu, B.; Pan, Y. Thermo-hydro-mechanical coupling simulation for fracture propagation in CO2 fracturing based on phase-field model. Energy 2023, 284, 128629. [Google Scholar] [CrossRef]
- Mou, J.; Yan, X.; Zhang, S.; Shi, L.; Li, D.; Ma, X. Research on CO2 Matrix Penetration Distance in Tight Reservoirs. Xin-Jiang OilGas 2024, 20, 64–71. [Google Scholar] [CrossRef]
- Ma, X.; Hu, D.; Ma, D.; Ji, Y.; Zang, A.; Wang, H.; Ma, Y.; Zhou, H. A shear-based breakdown model for the hydraulic fracturing of hot dry rock. Eng. Fract. Mech. 2025, 320, 111070. [Google Scholar] [CrossRef]
- Al-Yaari, A.; Ching, D.L.C.; Sakidin, H.; Muthuvalu, M.S.; Zafar, M.; Haruna, A.; Merican, Z.M.A.; Yunus, R.B.; Al-Dhawi, B.N.S.; Jagaba, A.H. The effects of nanofluid thermophysical properties on enhanced oil recovery in a heterogenous porous media. Case Stud. Chem. Environ. Eng. 2024, 9, 100556. [Google Scholar] [CrossRef]
- Niu, Q.; Zhao, X.; Chang, J.; Qi, X.; Shangguan, S.; Wang, W.; Yuan, W.; Wang, Q.; Ma, K.; Zhang, Z.; et al. Numerical simulation on physical composite stimulation and geothermal development performance of hot dry rock: A Case study from Matouying Uplift, China. Appl. Therm. Eng. 2025, 267, 125714. [Google Scholar] [CrossRef]
- Li, X.; Zhou, W.; Hao, S.; Wu, T.; Zhang, J.; Tian, Y.; Liu, B. Investigation on the propagation characteristics of tensile fractures crossing interfaces within dry hot rock reservoirs based on the Brazilian split test. Eng. Fract. Mech. 2025, 321, 111127. [Google Scholar] [CrossRef]
- Niu, Q.; Yao, M.; Yuan, J.; Chang, J.; Qi, X.; Shangguan, S.; Wang, Q.; Wang, W.; Yuan, W. Mechanism and Influencing Factor Analysis of Near-Well Stimulation for Hot Dry Rock Reservoirs by Liquid CO2 Phase Transition Blasting: Applied to Matouying Uplift. ACS Omega 2025, 10, 2819–2832. [Google Scholar] [CrossRef]
- Dai, Y.; Hou, B.; Liao, Z. Simulation of hydraulic fracturing in deep hot dry rock reservoir based on phase-field method. Pet. Drill. Tech. 2024, 52, 229–235. [Google Scholar] [CrossRef]
- Fan, H.; Liu, P.; Zhao, Y.; Yang, S.; Zhao, X. Analytical Model of Hydraulic Fracturing for Low Permeability Hot Dry Rock Reservoirs and DEM Simulation Base on Fluid-Solid Coupling. Processes 2023, 11, 976. [Google Scholar] [CrossRef]
- Zhang, W.; Qu, Z.; Guo, T.; Sun, J. Numerical simulation of hydraulic fracturing in hot dry rocks under the influence of thermal stress. Rock Soil Mech. 2019, 40, 2001–2008. [Google Scholar] [CrossRef]
- Xiao, W.; Chen, S.; Yi, Y.; Chen, H.; Ren, J. NMR-Based Experiments of Fracturing Fluid Assisted CO2 Huff-n-Puff for Enhancing Shale Oil Recovery. Xinjiang OilGas 2024, 20, 83–90. [Google Scholar] [CrossRef]
- He, Y.; Guo, Y.; Bi, Z.; Guo, W.; Chang, X. Study of field-scale carbon dioxide fracturing in hot dry rock reservoir based on a new 3D-THM coupled discrete block model. Geoenergy Sci. Eng. 2025, 247, 213675. [Google Scholar] [CrossRef]
- Xiong, F.; Zhu, C.; Feng, G.; Zheng, J.; Sun, H. A three-dimensional coupled thermo-hydro model for geothermal development in discrete fracture networks of hot dry rock reservoirs. Gondwana Res. 2023, 122, 331–347. [Google Scholar] [CrossRef]
- Zhuang, D.; Yin, T.; Li, Q.; Wu, Y.; Tan, X. Effect of injection flow rate on fracture toughness during hydraulic fracturing of hot dry rock (HDR). Eng. Fract. Mech. 2022, 260, 108207. [Google Scholar] [CrossRef]
- Chen, S.; Zhu, H.; Zhao, P.; Wang, Y.; Song, R.; Zuo, Y.; Shi, Y.; Zhou, T. Influence of fracture network characteristics of hot dry rock on heat extraction performance: A numerical simulation study. Geoenergy Sci. Eng. 2025, 245, 213523. [Google Scholar] [CrossRef]
- Suo, Y.; Guan, W.; Dong, M.; Zhang, R.; Wang, K.; He, W.; Fu, X.; Pan, Z.; Guo, B. Study on the heat extraction patterns of fractured hot dry rock reservoirs. Appl. Therm. Eng. 2025, 262, 125286. [Google Scholar] [CrossRef]
- Xu, T.; Yuan, Y.; Jiang, Z.; Hou, Z.; Feng, B. Hot Dry Rock and Enhanced Geothermal Engineering: International Experience and China Prospect. J. Jilin Univ. (Earth Sci. Ed.) 2016, 46, 1139–1152. [Google Scholar] [CrossRef]
- Xie, Z.; Huang, Z.; Sun, Z.; Li, G.; Wu, X.; Zhang, X.; Yang, R.; Long, T.; Zou, W.; Sun, Y.; et al. The interaction behaviors between the hydraulic fracture and natural fracture in hot dry rock. Geoenergy Sci. Eng. 2025, 247, 213731. [Google Scholar] [CrossRef]


Disclaimer/Publisher’s Note: The statements, opinions and data contained in all publications are solely those of the individual author(s) and contributor(s) and not of MDPI and/or the editor(s). MDPI and/or the editor(s) disclaim responsibility for any injury to people or property resulting from any ideas, methods, instructions or products referred to in the content. |
© 2025 by the authors. Licensee MDPI, Basel, Switzerland. This article is an open access article distributed under the terms and conditions of the Creative Commons Attribution (CC BY) license (https://creativecommons.org/licenses/by/4.0/).