Article

A Lightweight Infrared and Visible Light Multimodal Fusion Method for Object Detection in Power Inspection

1
State Grid Sichuan Electric Power Research Institute, Chengdu 610041, China
2
State Grid Sichuan Electric Power Company, Luzhou 646000, China
3
Chuanshen Hongan Intelligent (Shenzhen) Co., Ltd., Shenzhen 518000, China
4
School of Optics and Photonics, Beijing Institute of Technology, Beijing 100081, China
*
Author to whom correspondence should be addressed.
Processes 2025, 13(9), 2720; https://doi.org/10.3390/pr13092720
Submission received: 12 July 2025 / Revised: 6 August 2025 / Accepted: 14 August 2025 / Published: 26 August 2025
(This article belongs to the Special Issue Hybrid Artificial Intelligence for Smart Process Control)

Abstract

Visible and infrared thermal imaging are crucial techniques for detecting structural and temperature anomalies in electrical power system equipment. To meet the demand for multimodal infrared/visible light monitoring of target devices, this paper introduces CBAM-YOLOv4, an improved lightweight object detection model, which leverages a novel synergistic integration of the Convolutional Block Attention Module (CBAM) with YOLOv4. The model employs MobileNet-v3 as the backbone to reduce parameter count, applies depthwise separable convolution to decrease computational complexity, and incorporates the CBAM module to enhance the extraction of critical optical features under complex backgrounds. Furthermore, a feature-level fusion strategy is adopted to integrate visible and infrared image information effectively. Validation on public datasets demonstrates that the proposed model achieves an 18.05 frames per second increase in detection speed over the baseline, a 1.61% improvement in mean average precision (mAP), and a 2 MB reduction in model size, substantially improving both detection accuracy and efficiency through this optimized integration in anomaly inspection of electrical equipment. Validation on a representative edge device, the NVIDIA Jetson Nano, confirms the model’s practical applicability. After INT8 quantization, the model achieves a real-time inference speed of 40.8 FPS with a high mAP of 80.91%, while consuming only 5.2 W of power. Compared to the standard YOLOv4, our model demonstrates a significant improvement in both processing efficiency and detection accuracy, offering a uniquely balanced and deployable solution for mobile inspection platforms.

1. Introduction

As industrialization continues to advance and the electricity demand grows, substations [1,2], as critical nodes within the power system, are essential for ensuring the safe and reliable operation of societal production and daily life [3,4]. Regular inspections of substation equipment, aimed at identifying and promptly addressing potential hazards [5,6,7], are crucial for maintaining the stability of the power grid [8,9]. Optical imaging technologies, particularly visible light imaging for structural assessments and infrared thermal imaging for non-contact temperature monitoring, have become indispensable tools in substation inspections [10,11]. These technologies offer significant advantages over traditional manual inspections, including non-contact operation, high efficiency, and broad coverage [12,13].
However, single-modal optical imaging has inherent limitations. While visible light imaging provides rich details of equipment structures and the surrounding environment, it cannot directly detect abnormal temperature rises caused by current effects or insulation defects [14,15]. In contrast, infrared thermal imaging effectively captures thermal anomalies; however, it typically suffers from lower spatial resolution, poor image contrast, and is influenced by factors such as ambient temperature and emissivity settings. Moreover, it is challenging to correlate hotspots with specific equipment components precisely. Therefore, the integration of the spatial localization information provided by visible light imaging with the temperature distribution data from infrared thermal imaging, i.e., utilizing multimodal optical imaging technology, is an effective approach for a comprehensive and accurate assessment of substation equipment condition.
The application of multimodal optical imaging technology in substation automation inspections continues to face several challenges. Substation environments are complex, with diverse background interferences, and the target equipment varies in size and shape [16]. Additionally, lighting conditions, thermal reflection, and radiation environments can be unpredictable, placing high demands on the stable acquisition and precise analysis of optical images. Furthermore, inspection tasks often require real-time performance, particularly when optical sensors are mounted on mobile platforms such as drones and robots, which necessitates highly efficient and lightweight image processing algorithms.
In recent years, deep learning technologies, as powerful data-driven methods, have shown great potential in optical image processing and analysis [17]. These technologies can automatically learn high-level semantic features from complex images to achieve target detection, recognition, and condition assessment [18,19]. Several studies have investigated the application of deep learning for analyzing visible light or infrared images in substation inspections [20,21]. However, existing methods still have several limitations in multimodal optical information fusion: First, many models have a large number of parameters and high computational complexity, which makes them difficult to meet the real-time processing requirements of mobile optical inspection platforms. Second, the ability to extract features from infrared images with low signal-to-noise ratios and weak textures requires enhancement. The fusion strategy for visible light and infrared, two types of heterogeneous optical information, needs to be further optimized to fully leverage their respective advantages.
To address these challenges, this paper presents CBAM-YOLOv4, a lightweight multimodal fusion model that achieves a superior balance between detection accuracy and computational efficiency for substation inspection. Our primary contribution lies not in inventing new individual components but in a novel synergistic integration and optimization strategy of existing advanced techniques. Specifically, we introduce the CBAM attention mechanism to enhance the model’s focus on critical thermal and structural features, compensating for potential accuracy loss from lightweighting. By employing an effective feature-level fusion strategy, our model demonstrates significant performance gains on edge hardware, providing a practical and intelligent solution for real-time optical inspection tasks on resource-constrained mobile platforms.

2. Research Status and Analysis

In recent years, the integration of artificial intelligence with advanced optical sensing technologies has garnered significant attention in the field of substation inspection, particularly in areas such as multimodal optical information fusion and lightweight models, to enhance the perception and analytical capabilities of automated inspection systems.
In the field of multimodal optical information utilization, research has focused on effectively integrating information from different spectral bands to achieve more comprehensive and reliable equipment condition assessments compared to single-modal approaches. Infrared thermal imaging technology, as a key non-contact temperature measurement method, offers distinct advantages in detecting overheating faults in electrical equipment. Vergura [22] enhanced the accuracy of photovoltaic system diagnostics by optimizing the infrared image acquisition process. Bai [23] combined drone-based infrared diagnostic technology with deep learning to achieve high-precision identification of hotspots in photovoltaic power plants. However, infrared images often suffer from low resolution, blurred edges, sensitivity to environmental thermal radiation interference, and a lack of detailed structural information, which presents challenges for precise fault localization and nature determination [1]. In contrast, visible light images provide high-resolution structural, textural, and color information about equipment, facilitating the identification of surface defects and precise target localization [24]. Therefore, integrating structural context information from visible light with thermal distribution data from infrared imaging is considered a promising direction for improving the accuracy and robustness of power substation inspections [25]. Single-modality information alone is often insufficient for comprehensively assessing equipment status. As illustrated in Figure 1, visible light imaging reveals the structural morphology of the equipment, while infrared thermal imaging reveals its thermal distribution. In Figure 1c, the equipment connection points appear normal in the visible light image, but also show apparent local thermal anomalies and overheating in the infrared image. In Figure 1d, the thermal anomalies at the top of the insulator are much more significant and urgent in the infrared image than any potential appearance issues in the visible light image. Furthermore, recent advances in thermography have focused on overcoming hardware limitations through super-resolution techniques [26], enhancing signal fidelity via physics-constrained decomposition [27], and improving the detection of faint targets using dual-image analysis [28], all of which underscore the ongoing efforts to improve the precision and reliability of infrared data analysis.
On the other hand, to meet the real-time requirements and computational resource constraints of substation inspection equipment (such as drones equipped with optical cameras and inspection robots), research on lightweight image processing models is crucial. While pursuing model lightweighting, it is crucial to avoid the loss of key optical features, particularly weak thermal features in infrared images or small defect features in visible light images, while maintaining or even improving the model’s detection accuracy in complex substation backgrounds remains a core challenge. This challenge becomes especially pronounced when deploying models on resource-constrained edge computing devices, where striking an optimal balance between model efficiency and accuracy is crucial.
In the field of integrated systems and applications for substation inspection, although research has been conducted on trackless robots [29], rail-based robots [30], and drones and intelligent vehicle collaboration systems [31] that have improved the automation level of inspections [32], the optical perception and intelligent analysis capabilities of these systems often have limitations. Many systems employ relatively traditional image processing algorithms or directly apply generic deep learning models, lacking optimization for the specific optical imaging characteristics of substations, such as low contrast and high noise in infrared images, as well as uneven lighting and large-scale variations in visible light images. This results in reduced robustness and accuracy in complex and dynamic real-world inspection environments.
In summary, existing research has made notable progress in leveraging multimodal optical information and lightweight models for substation inspection. However, several challenges remain, including an insufficient understanding of the fusion mechanisms of multimodal optical data, the limited capacity of lightweight models to extract key optical features, and the poor adaptability of these models to real-world optical inspection platforms. This paper tackles these issues by introducing an attention mechanism to optimize the lightweight network architecture, thereby improving the model’s ability to capture and fuse essential features from both visible and infrared images in complex backgrounds.

3. Model Construction

3.1. Construction of a Lightweight Multimodal Optical Image Processing Model Based on CBAM-YOLOv4

YOLOv4 is an advanced real-time object detection algorithm renowned for its excellent balance between high accuracy (mAP) and processing speed (FPS) in the field of object detection. Its outstanding performance makes it a powerful baseline model for many computer vision tasks. The standard YOLOv4 network structure is illustrated in Figure 2, which primarily comprises the backbone feature extraction network (BFEN), the spatial pyramid pooling network (SPPN), and the feature aggregation network (FAN) [33]. BFEN performs feature extraction and cross-stage fusion on the input images, SPPN enhances contextual features through pooling operations, and FAN integrates these features to improve feature extraction and localization accuracy, thereby achieving precise recognition. In applications involving the processing of optical images of substation equipment, the YOLO framework can effectively detect and locate equipment components, providing a foundation for subsequent status assessment.
The standard YOLOv4 model is computationally intensive, making it challenging to ensure real-time performance when directly applied to mobile inspection platforms equipped with optical sensors. To address this issue, this paper conducted targeted lightweight and optimization designs to adapt the model to the processing requirements of multimodal optical images.
(1) Lightweight backbone network for optical inspection platforms: To address the issues of large parameter counts and computationally intensive processing in the standard YOLOv4 model, the original backbone feature extraction network, BFEN, is replaced with MobileNet-v3. MobileNet-v3 is a lightweight convolutional neural network specifically designed for mobile and embedded devices, which achieves this by incorporating depthwise separable convolutions, inverse residual structures, linear bottlenecks, and efficient H-Swish activation functions, as well as Squeeze-and-Excitation (SE) attention modules. The H-Swish activation function is particularly well-suited for quantization. As our experiments in Section 4.4 demonstrate, this allows for significant performance gains on edge hardware with minimal accuracy loss. This enables a significant reduction in model parameters (from approximately 55 million to approximately 45 million) and computational requirements while maintaining high optical feature extraction capabilities. This lightweight design is crucial for enabling real-time image analysis on portable optical detection devices with limited computational resources:
h - s w i s h [ x ] = x R e L U 6 ( x + 3 ) 6
In Equation (1), x represents the input to the neural network layer. ReLU6 is a variant of the ReLU function, which outputs the original input value between 0 and 6 and truncates values outside this range to 0 (for inputs less than 0) or 6 (for inputs greater than 6). Compared to s w i s h , the activation function h - s w i s h can improve efficiency by approximately 15% after quantization, especially in deep networks.
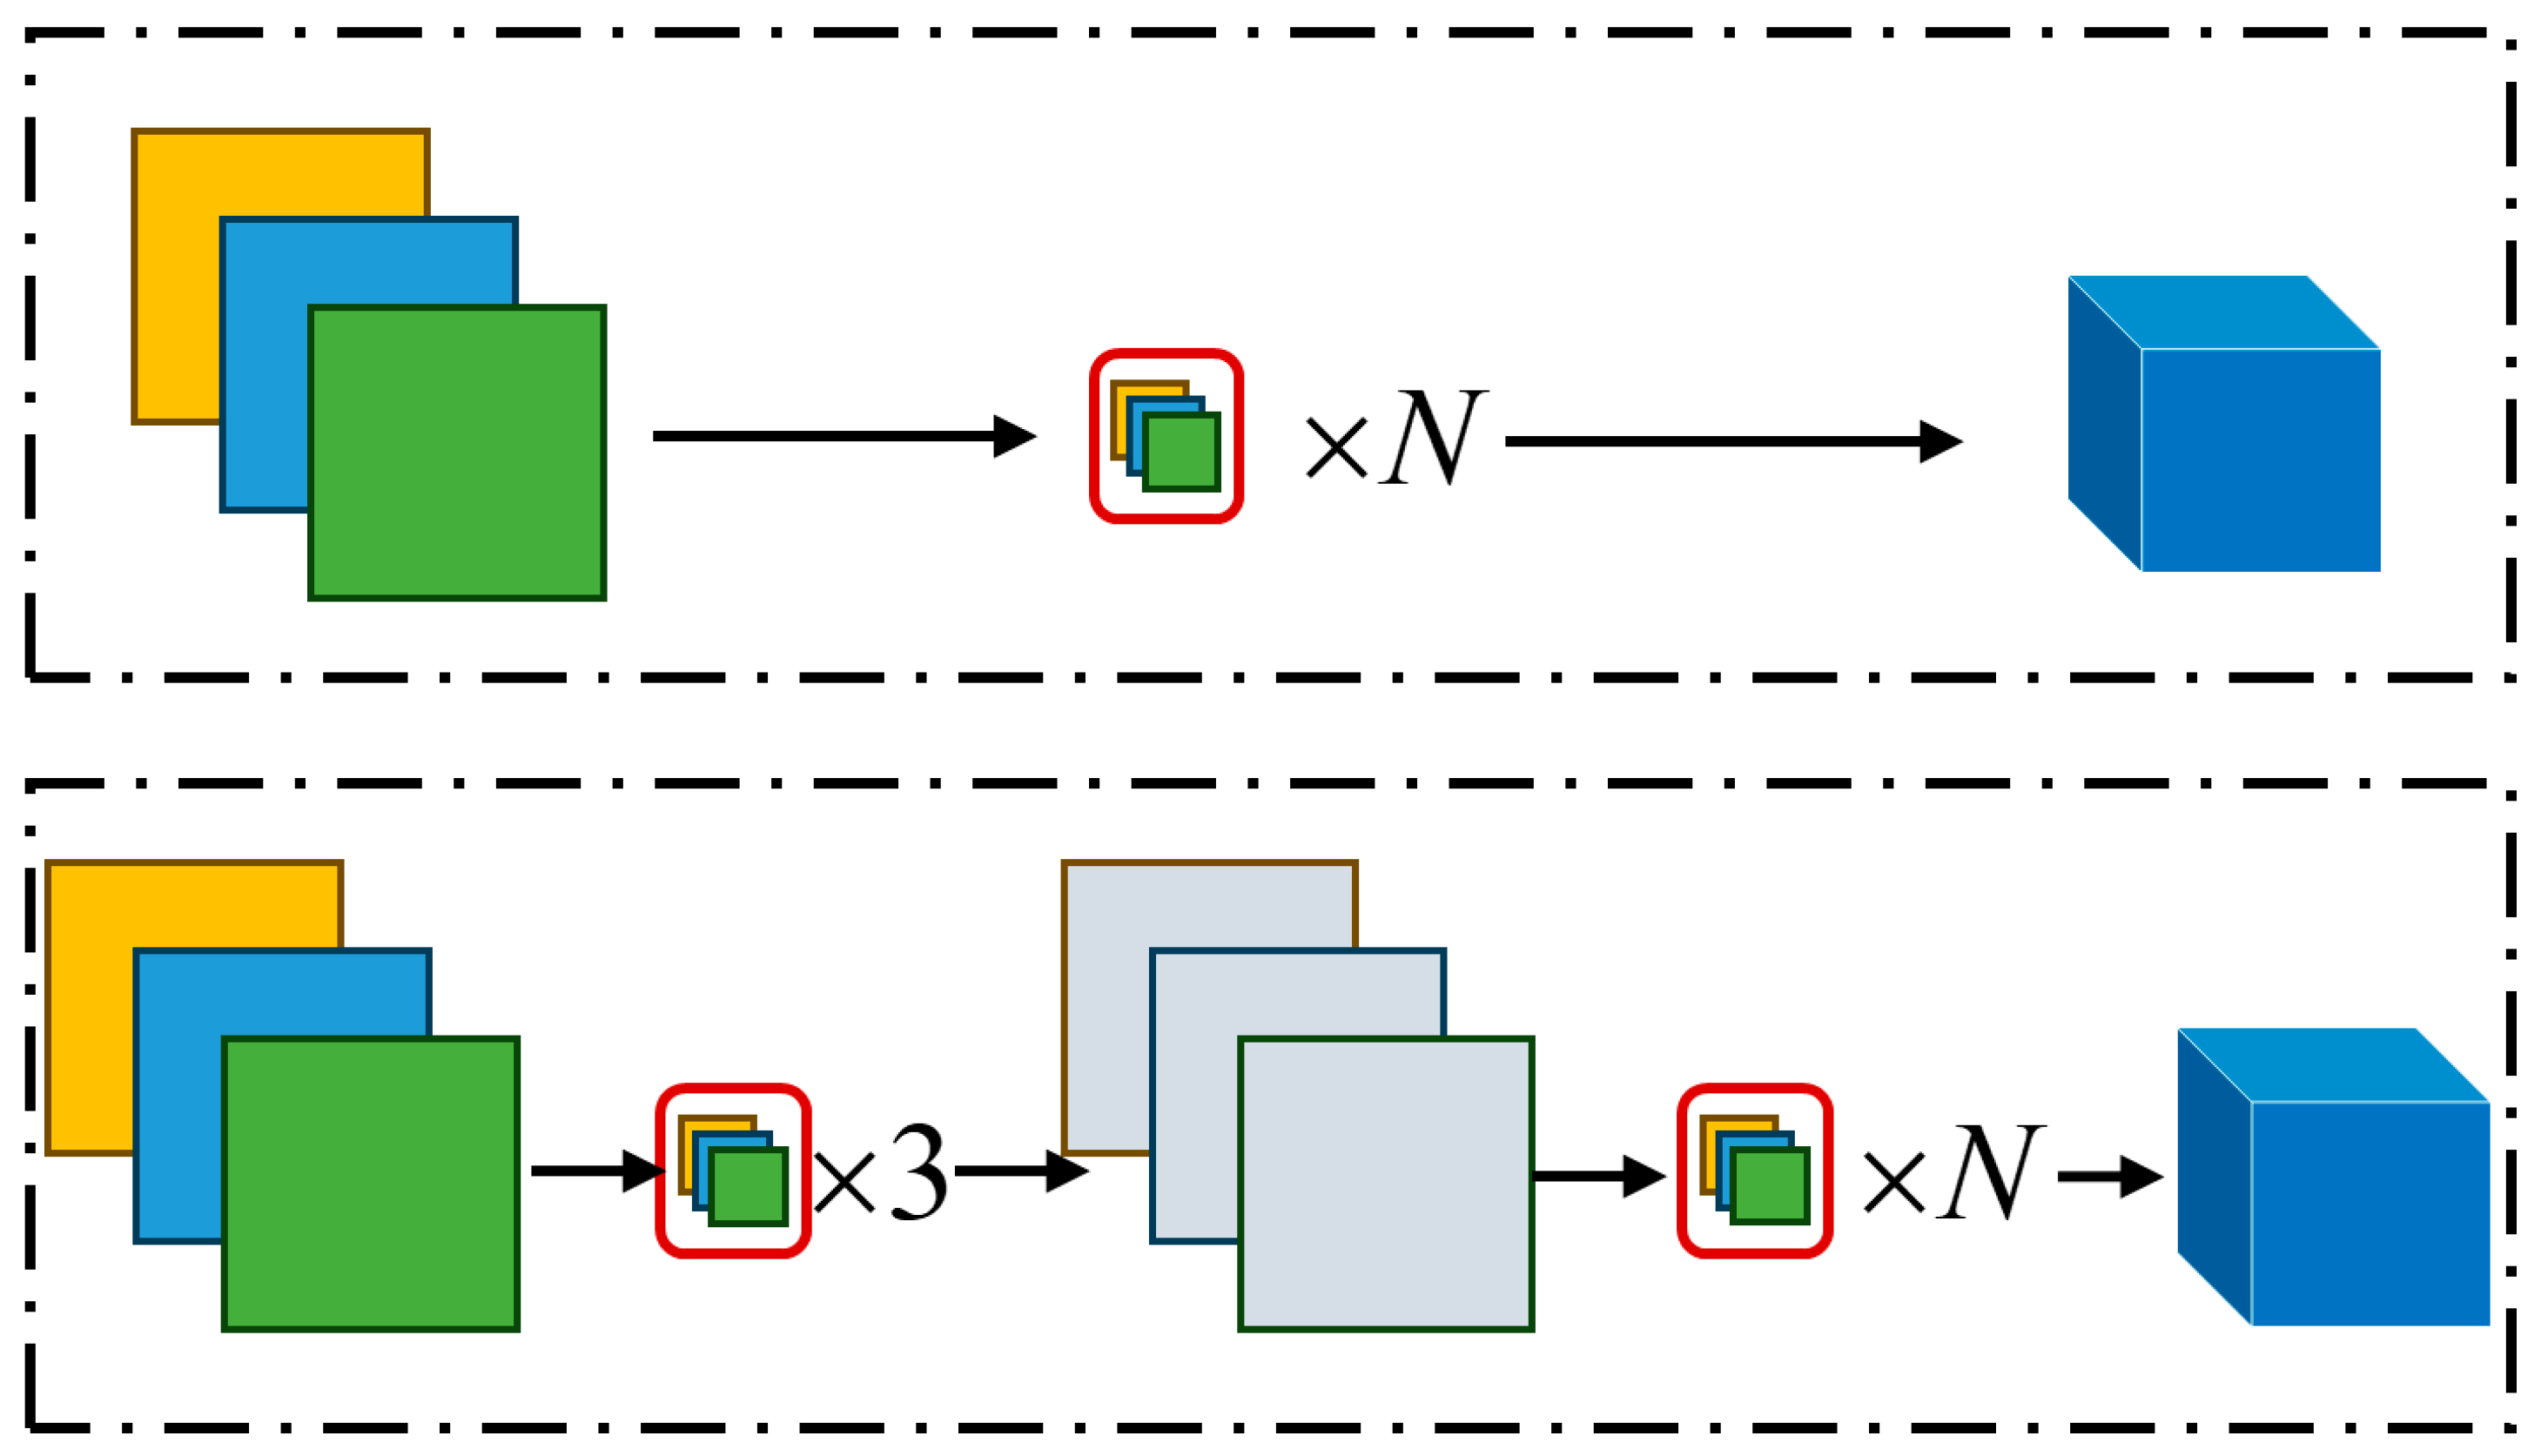
(2) Depthwise separable convolutions optimize optical feature map computation: Although using MobileNet-v3 as the backbone has significantly reduced computation, the computational burden may still be high when processing high-resolution or multi-channel optical image feature maps, especially during the feature fusion stage. To further optimize, this paper replaces the standard 3 × 3 convolutions in the model neck with depthwise separable convolutions. Depthwise separable convolutions decompose standard convolutions into depthwise convolutions and pointwise convolutions (Figure 3). Depthwise convolution applies the convolution kernel independently to each channel of the input optical feature map to capture spatial features, while pointwise convolution combines information across channels via a 1 × 1 convolution. Compared to standard convolution, depthwise convolution achieves similar receptive fields and feature extraction performance while significantly reducing the number of parameters and computational complexity (FLOPs), thereby improving the model’s processing efficiency.
Depthwise convolution uses a convolution kernel with the same number of channels as the input feature map, with each convolution kernel responsible for the convolution operation on one channel. The number of parameters D 0 is calculated as follows, where C is the number of channels in the input feature map.
D 0 = C × 3 × 3 + C × N
The standard convolution process involves convolving 3 × 3 convolution kernels with each channel of the input feature map, and, finally, obtaining a new feature map with N channels. The parameter calculation is as follows:
D 1 = C × H × 3 × 3 × N
In Equation (3), D 1 represents the number of parameters in a standard convolution; C and H denote the length and width of the input feature map; N represents the number of convolution kernels. Since the number of input channels in a standard convolution is much smaller than the number of output channels, and D 2 / D 1 is much smaller than 1, depthwise separable convolution can achieve the same convolution effect while greatly reducing the number of parameters in the convolution.
(3) Introducing CBAM to enhance the expression of key optical features: While the aforementioned lightweighting measures improve efficiency, they also result in a loss of the ability to capture subtle or low-contrast optical features, such as small cracks or stains in visible light images and insignificant early thermal anomalies in infrared images. To address this necessary trade-off and strategically maintain high accuracy, this paper introduces the Convolutional Block Attention Module (CBAM) during the feature fusion stage of the model. CBAM is a lightweight attention module that simultaneously considers the channel dimension and spatial dimension of feature maps, enabling adaptive adjustment of feature weights across different channels and spatial locations. After incorporating the CBAM module, the workflow is illustrated in Figure 4.
CBAM is a lightweight, plug-and-play module that sequentially applies the Channel Attention Module (CAM) and Spatial Attention Module (SAM) to learn the importance of different feature channels and spatial locations, respectively. The channel and spatial attention mechanisms significantly improve feature extraction through weight adjustment, with weights calculated based on the relative importance of features. After passing through CBAM, the module sequentially generates attention maps along the channel and spatial dimensions, and performs feature refinement through element multiplication, achieving a significant improvement in recognition performance despite the lightweight nature of the network. The channel attention feature calculation is as follows:
x j i = exp A i A j i = 1 C exp A i A j
In Equation (4), A i and A j represent the features of channels i and j , respectively; x j i represents the influence of channel i on channel j ; and C represents the length of the input feature map. Multiplying the above results by a scale parameter α yields the final output.
y j = α i = 1 C ( x j A i ) + A j
Spatial attention generates weights based on the similarity of adjacent features:
s j i = e x p ( B i B j ) i = 1 H × W e x p ( B i B j )
In Equation (6), B i and B j represent the characteristics of space i and j , respectively; s j i represents the influence of space i on space j . The more similar the characteristics of the two positions are, the stronger the correlation between them.
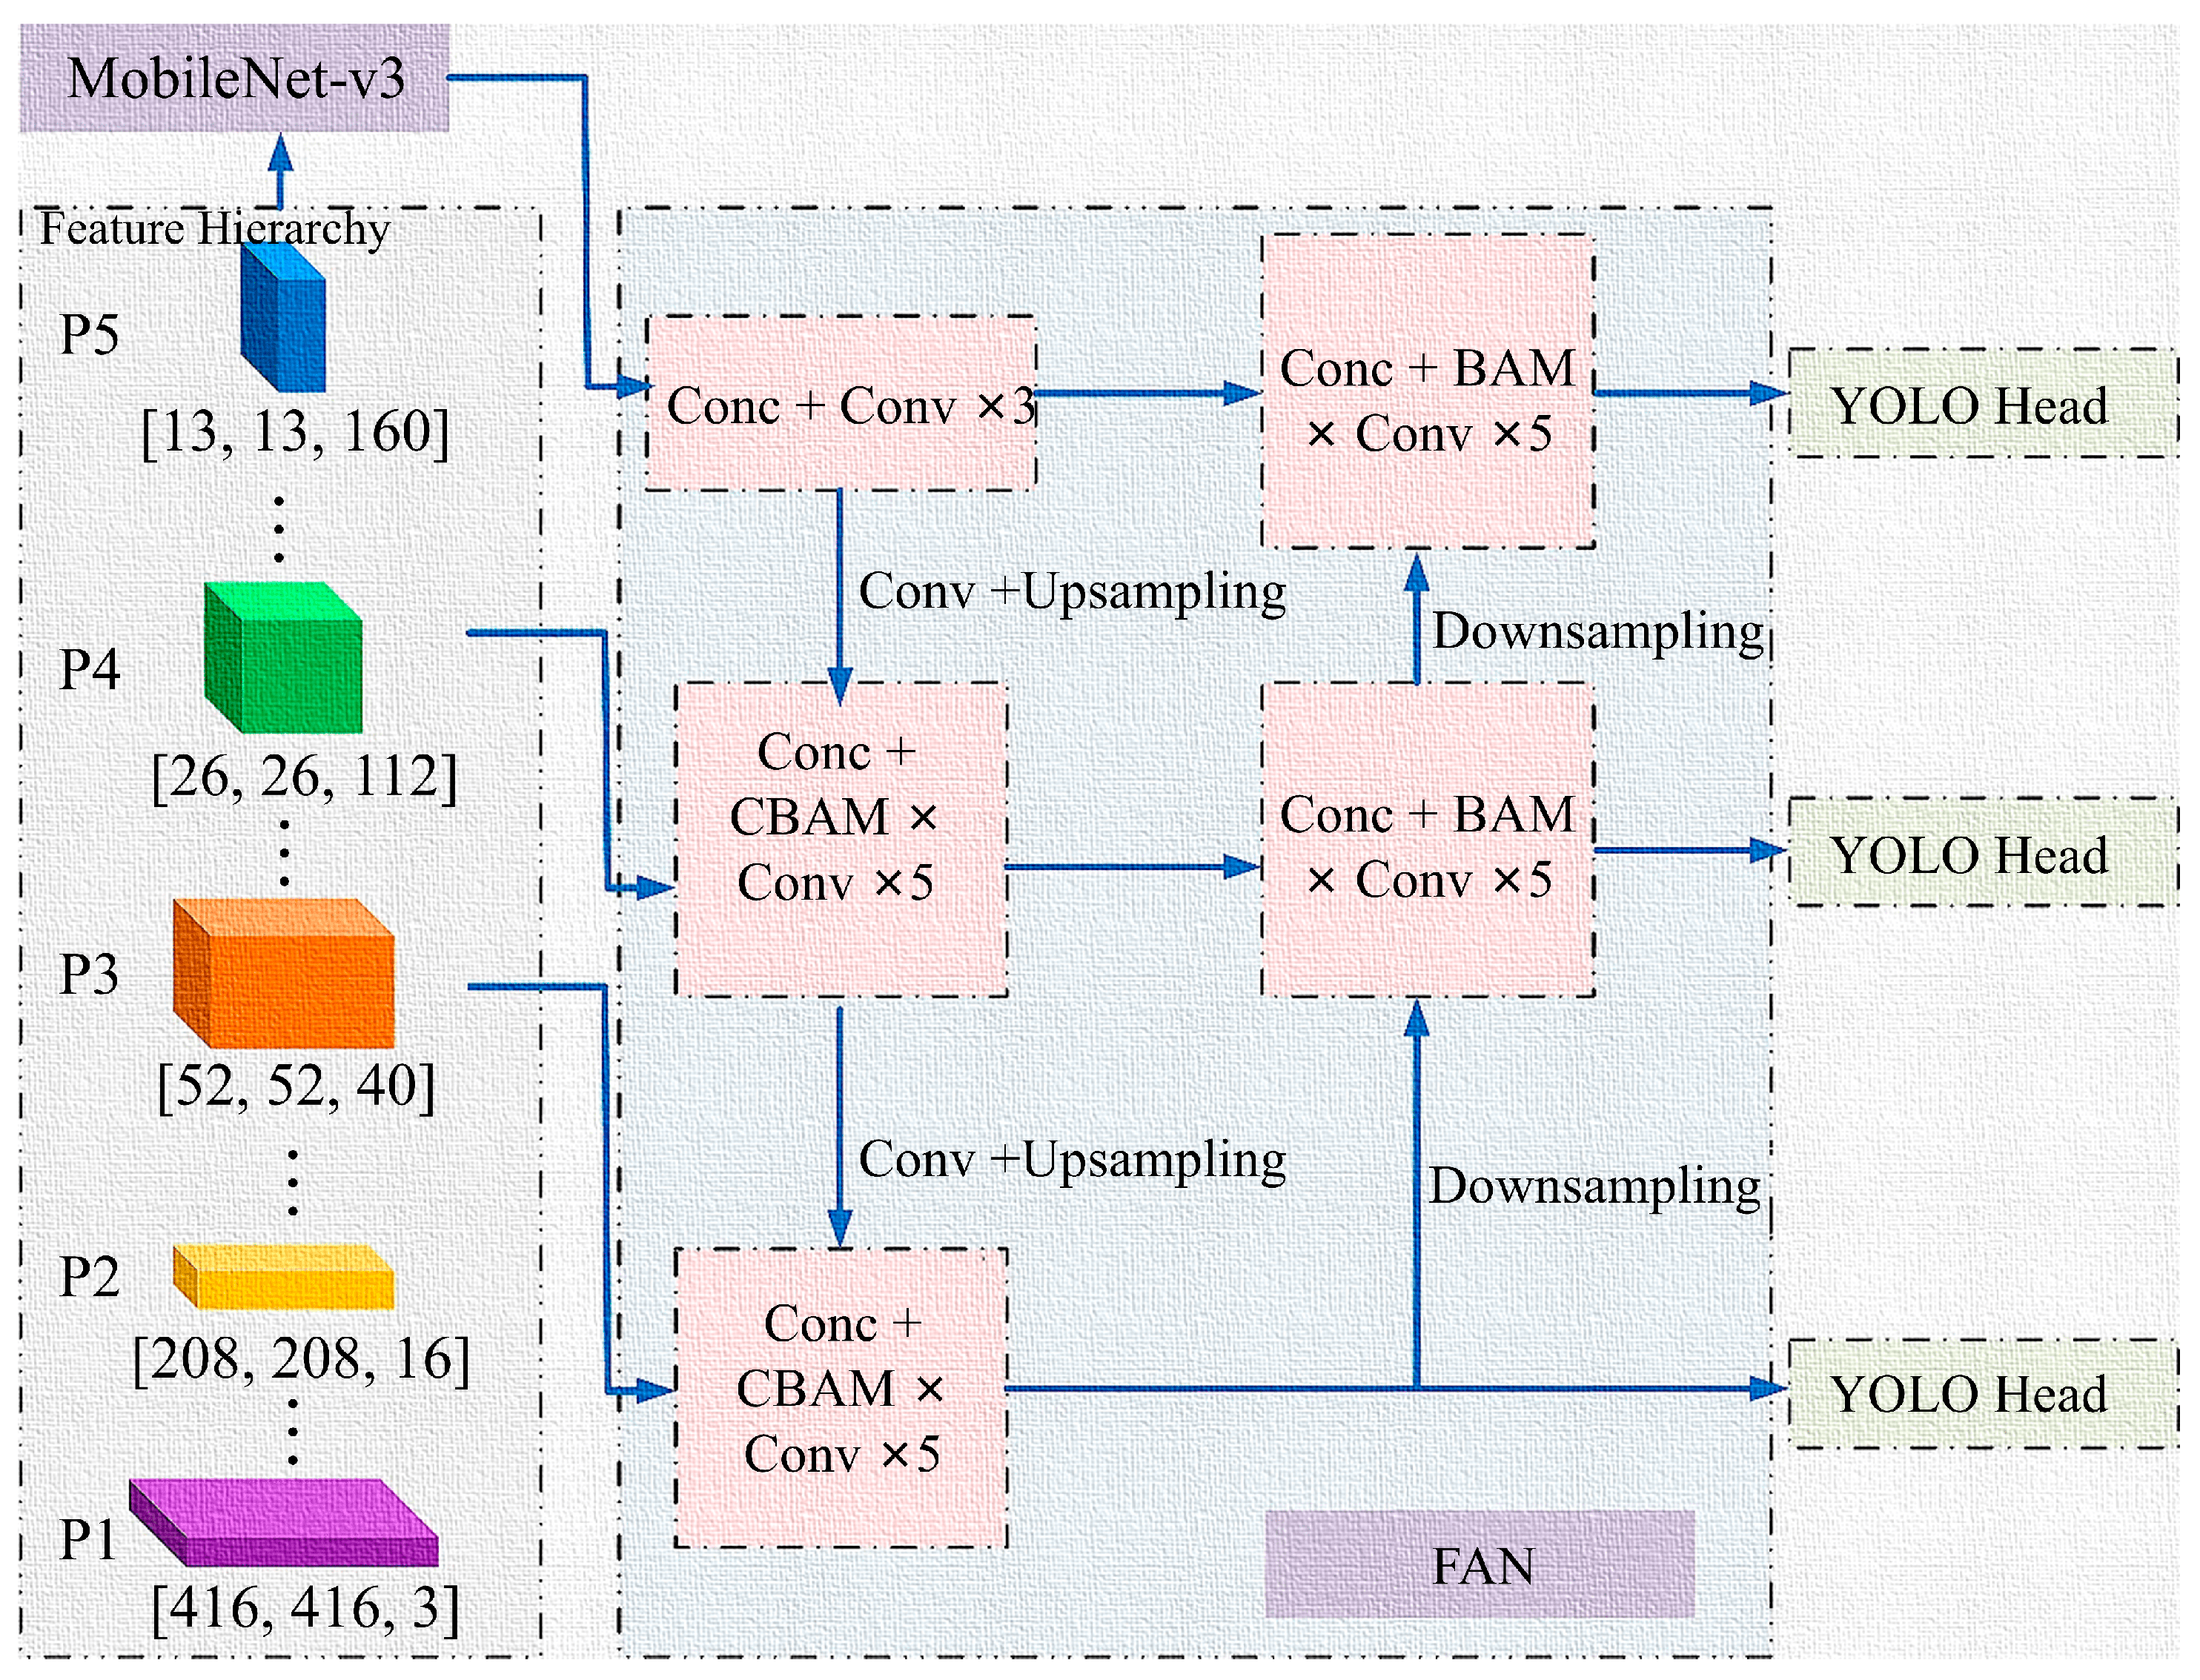
By leveraging cascaded channels and spatial attention, CBAM guides the model to focus on optical features most relevant to the identification and status determination of substation equipment, thereby enhancing the model’s robustness and accuracy under complex backgrounds, varying lighting conditions, and low-contrast infrared images. The introduction of CBAM is not merely an incremental addition but a critical design choice within our lightweight framework, specifically targeting the preservation and intelligent enhancement of crucial features that might be attenuated by aggressive model compression, thereby ensuring the model’s overall performance balance. The overall framework of the improved CBAM-YOLOv4 model is shown in Figure 5. This framework has been optimized explicitly for efficiently processing and analyzing multimodal optical images of substations. The cost-effectiveness of this choice is validated in our ablation study in Section 4.5.

3.2. Multimodal Information Fusion-Driven CBAM-YOLOv4 Application for Substation Inspection

(1) Multimodal data acquisition and preprocessing: Using drones and robotic inspection devices equipped with visible light cameras and infrared thermal imagers to simultaneously collect visible light images and infrared thermal images of substation equipment. Visible light images contain rich visual features such as equipment structure, color, and texture. At the same time, infrared thermal imaging reflects the thermal radiation distribution on the equipment surface, serving as a critical optical basis for determining operational status, particularly thermal faults. For visible light images, multiple techniques, such as histogram equalization, homomorphic filtering, and wavelet transformation, are employed to reduce noise and enhance image quality. Due to the optical characteristics and imaging principles of infrared thermal imagers, raw infrared images often exhibit low contrast and blurred edges, making it challenging to accurately identify and locate thermal anomalies. Therefore, sharpening processing is necessary. This paper employs a second-order differential-based sharpening technique to enhance high-frequency optical details in infrared images. By calculating the gray-scale relationships between pixels and their neighboring pixels, the edges and contours of infrared images are effectively sharpened, thereby improving BFEN’s ability to capture thermal distribution features and providing clearer input for subsequent optical feature extraction. The Laplace transform of a function f ( x , y ) of two variables is defined as follows:
L { f ( x , y ) } = F ( s , t ) = 0 0 f ( x , y ) e s x e t y d x d y
In Equation (7), F ( s , t ) represents the form of the original function f ( x , y ) after Laplace transformation; s and t are complex variables, representing the coordinates related to the variables x and y in the complex plane; e s x and e t y are the kernel functions of the transformation, used to attenuate the corresponding variables of the original function. The mathematical calculation of the second-order Laplace operator is as follows:
2 f = 2 f x 2 + 2 f y 2
In Equation (8), 2 represents the Laplace operator; 2 f x 2 represents the second-order partial derivative of function f with respect to variable x ; 2 f y 2 represents the second-order partial derivative of function f with respect to variable y . In digital image processing, the second-order Laplace operator can be used to enhance details in images. For infrared images of power equipment, this operator highlights edges by calculating the relationship between a pixel and its four adjacent pixels. This operation sharpens the original infrared image by multiplying the gray value of the central pixel by −4 and adding the sum of the gray values of the four nearest pixels. This method can effectively emphasize high-frequency details in infrared images of power equipment, such as component edges, and improve visual contrast, thereby providing more vivid information for subsequent feature extraction.
(2) Fusion of visible light and infrared optical features based on attention mechanism: To effectively integrate optical information from two modalities and fully utilize the structural information of visible light and the thermal information of infrared, this paper adopts a feature-level fusion strategy. The backbone network of the CBAM-YOLOv4 model (BFEN, based on MobileNet-v3) is used to extract visible light image features and infrared thermal imaging image features, respectively:
F v i s C × H × W , F i r C × H × W
In Equation (9), C , H , and W represent the number of channels, height, and width of the feature map, respectively. Subsequently, a weighted fusion method based on the attention mechanism is employed to input F v i s and F i r into the CBAM module, calculating the channel attention weights A c v i s , A c i r C × 1 × 1 and spatial attention weights. These weights reflect the model’s adaptive assessment of the importance of optical information from different modalities, channels, and spatial locations. By applying these weights to the original features, the expression of key optical features such as edges in visible light or high-temperature regions in infrared is enhanced:
F v i s = F v i s A c v i s A s v i s , F i r = F i r A c i r A s i r
denotes element-wise multiplication. The visible light features and infrared features weighted by attention are fused using a weighted average method to obtain the final fused optical feature F fused . The SPPN and FAN input to the model are then processed as follows:
F fused   = α F v i s + ( 1 α ) F i r
In Equation (11), α is the adjustable weight coefficient that balances visible light and infrared features, used to balance the contribution of visible light structural information and infrared thermal information in the fusion features. Its optimal value can be determined through cross-validation or other methods. In our experiments, the optimal value of the fusion weight was determined to be α = 0.5 through cross-validation on our dataset. A sensitivity analysis, detailed in Section 4.3, shows that the model performance is robust around this optimal value.
(3) Object detection based on integrated optical features: Using the trained CBAM-YOLOv4 model, the integrated features are detected to identify key components of electrical equipment (such as bushings, insulators, connectors, etc.) and obtain their bounding box coordinates. The application of CBAM ensures that the model continues to focus on the most distinctive optical features during the integration process.
(4) Temperature estimation based on infrared optical information: After using fusion features to accurately detect and locate device components, it is necessary to further analyze the infrared optical data within the location frame to obtain critical thermal status information and achieve non-contact optical temperature measurement. Convert the infrared thermal imaging image of the corresponding area of the detection frame into a 256-level grayscale image. The grayscale value G gray   ( i , j ) directly reflects the intensity of infrared radiation received by the pixel point:
G g r a y ( i , j ) = 0.39 R ( i , j ) + 0.5 G ( i , j ) + 0.11 B ( i , j )
In Equation (12), R ( i , j ) , G ( i , j ) , and B ( i , j ) represent the pixel values of the red channel, green channel, and blue channel at position ( i , j ) , respectively.
Within a specific temperature range, there is an approximate linear relationship between the grayscale values recorded by an infrared thermal imager and the surface temperature of an object. By calibrating or utilizing the temperature range information contained within the image itself, a linear mapping relationship between grayscale values and actual temperatures can be established, enabling the estimation of temperature values for any pixel or area within the detection frame. This approach achieves a quantitative assessment of the thermal state of the equipment. The minimum and maximum temperatures are typically provided by the infrared optical sensor system:
T = T m i n + g 255 ( T m a x T m i n )
In Equation (13), T represents the temperature of a point in the grayscale image; g represents the grayscale value of that point; T min and T max represent the lowest and highest temperatures in the infrared image of the electrical equipment.
The entire process involves data enhancement operations such as rotation, scaling, flipping, and sharpening of the original optical images, thereby improving the model’s robustness to changes in imaging conditions. The CBAM-YOLOv4 algorithm is used to achieve high-precision optical target recognition. Subsequent processing of infrared optical data extracts key temperature information, ultimately providing comprehensive optical information support for intelligent status monitoring and fault warning in substations.

4. Results and Analysis

4.1. Experimental Setup and Dataset

To validate the effectiveness of the proposed lightweight multimodal optical image processing technology, a dedicated visible-infrared image dataset for substation equipment was constructed and named Visible-Infrared Substation Equipment Dataset (VISED). This dataset was specifically designed to capture the unique and complex characteristics of power equipment images, including diverse anomaly patterns and environmental conditions relevant to real-world inspection scenarios, addressing the current lack of comprehensive public multimodal datasets for this specific domain. The dataset contains 500 pairs of synchronously registered visible images and infrared thermal images collected from multiple real industrial sites and laboratory environments. The main features of the VISED dataset are summarized in Table 1. The visible light images in the dataset provide high-resolution visual optical information, such as equipment structure, color, and texture. In contrast, the infrared thermal imaging images record the thermal radiation distribution on the equipment surface, serving as critical optical evidence for assessing operational status and diagnosing early thermal faults. Selected sample images are shown in Figure 1.
Given the modest size of the VISED dataset, several measures were taken to mitigate the risk of overfitting and enhance model generalizability. First, we employed extensive online data augmentation during training, including random scaling, rotation, flipping, and color jitter for visible light images, which artificially expands the diversity of the training data. Second, our model’s backbone, MobileNet-v3, was pre-trained on the large-scale ImageNet dataset. This transfer learning approach allows the model to leverage robust, generalized features learned from millions of images, significantly reducing the burden on our smaller, specialized dataset. Finally, the model’s performance was evaluated on a completely unseen test set, and the strong results indicate that the model has learned meaningful features rather than simply memorizing the training data.
All models were initially developed and trained on a desktop computer equipped with an Intel Core i5-4590 CPU, 4 GB DDR4 RAM, and an NVIDIA GeForce GT630 GPU, ensuring the comparability of baseline results.
To validate the model’s performance for its intended application on mobile platforms, we conducted additional benchmarking on a representative edge computing device, the NVIDIA Jetson Nano, whose specifications are detailed in Table 2. To achieve optimal inference performance, we utilized the NVIDIA TensorRT framework for model optimization.

4.2. Model Performance Evaluation

To validate the accuracy of the CBAM-YOLOv4 algorithm proposed in this study, it was compared with four other models, including YOLOv4, YOLOv3, lightweight YOLOv4, and Mask R-CNN, through comparative experiments. The evaluation metrics included model weight file size, mean Intersection over Union (mIoU), mean Average Precision (mAP), and frames per second (FPS).
As shown in the performance comparison results in Table 3, the CBAM-YOLOv4 proposed in this paper outperforms all comparison models in terms of mIoU and mAP, achieving 85.12% and 82.28%, respectively. This model can more accurately locate and identify substation equipment components from complex visible light and infrared optical images.
Compared with the baseline model YOLOv4, the mAP improved by 1.61%, demonstrating the effectiveness of CBAM in enhancing key optical feature extraction. The processing speed of CBAM-YOLOv4 reached 31.53 FPS, far exceeding the standard YOLOv4 (13.48 FPS) and Mask R-CNN (9.49 FPS), and outperforming YOLOv3 (19.78 FPS). This is attributed to the significant lightweighting effects achieved through MobileNet-v3 and deep separable convolutions. The high processing speed enables the system to perform real-time optical image stream analysis on mobile platforms.
Compared to the lightweight YOLOv4, which focuses solely on achieving extreme lightweight performance, CBAM-YOLOv4, despite having a slightly larger model, achieves an impressive 22.69% improvement in mAP (82.28% vs. 59.59%). This significant gain underscores CBAM’s crucial role: it demonstrably recovers and enhances the critical feature representation capacity lost due to the aggressive lightweighting necessary for edge deployment. Compared to the classic YOLOv3, CBAM-YOLOv4 outperforms it by 7.51% and 10.34% in mAP and mIoU, respectively, while maintaining a smaller model size, demonstrating the overall progress in algorithm design.
A comparison with another lightweight approach, LightweightYOLOv4, is particularly crucial. Although the Lightweight YOLOv4 model is smaller and slightly faster, its mAP is only 59.59%, significantly lower than the 82.28% achieved by CBAM-YOLOv4 (a difference of 22.69%). Mask R-CNN, while achieving acceptable accuracy, suffers from its massive computational requirements and slow processing speed, making it unsuitable for real-time optical inspection tasks. Compared to the YOLOv3 algorithm, CBAM-YOLOv4 achieves a 7.51% improvement in mAP, a 10.34% improvement in mIoU, a 5 MB reduction in weight file size, and a processing speed over 3.3 times faster (31.53/9.49 FPS).
The overall performance comparison of the five models is summarized in Table 3. Our proposed CBAM-YOLOv4 achieves the highest mAP and mIoU, demonstrating its superior accuracy on the VISED dataset, which is specifically curated for the target application. While Table 3 shows the initial performance metrics on a desktop system, a more detailed and practical evaluation on a representative edge device is provided in Section 4.4, which better reflects the model’s capabilities for its intended application.

4.3. Model Characteristics Analysis

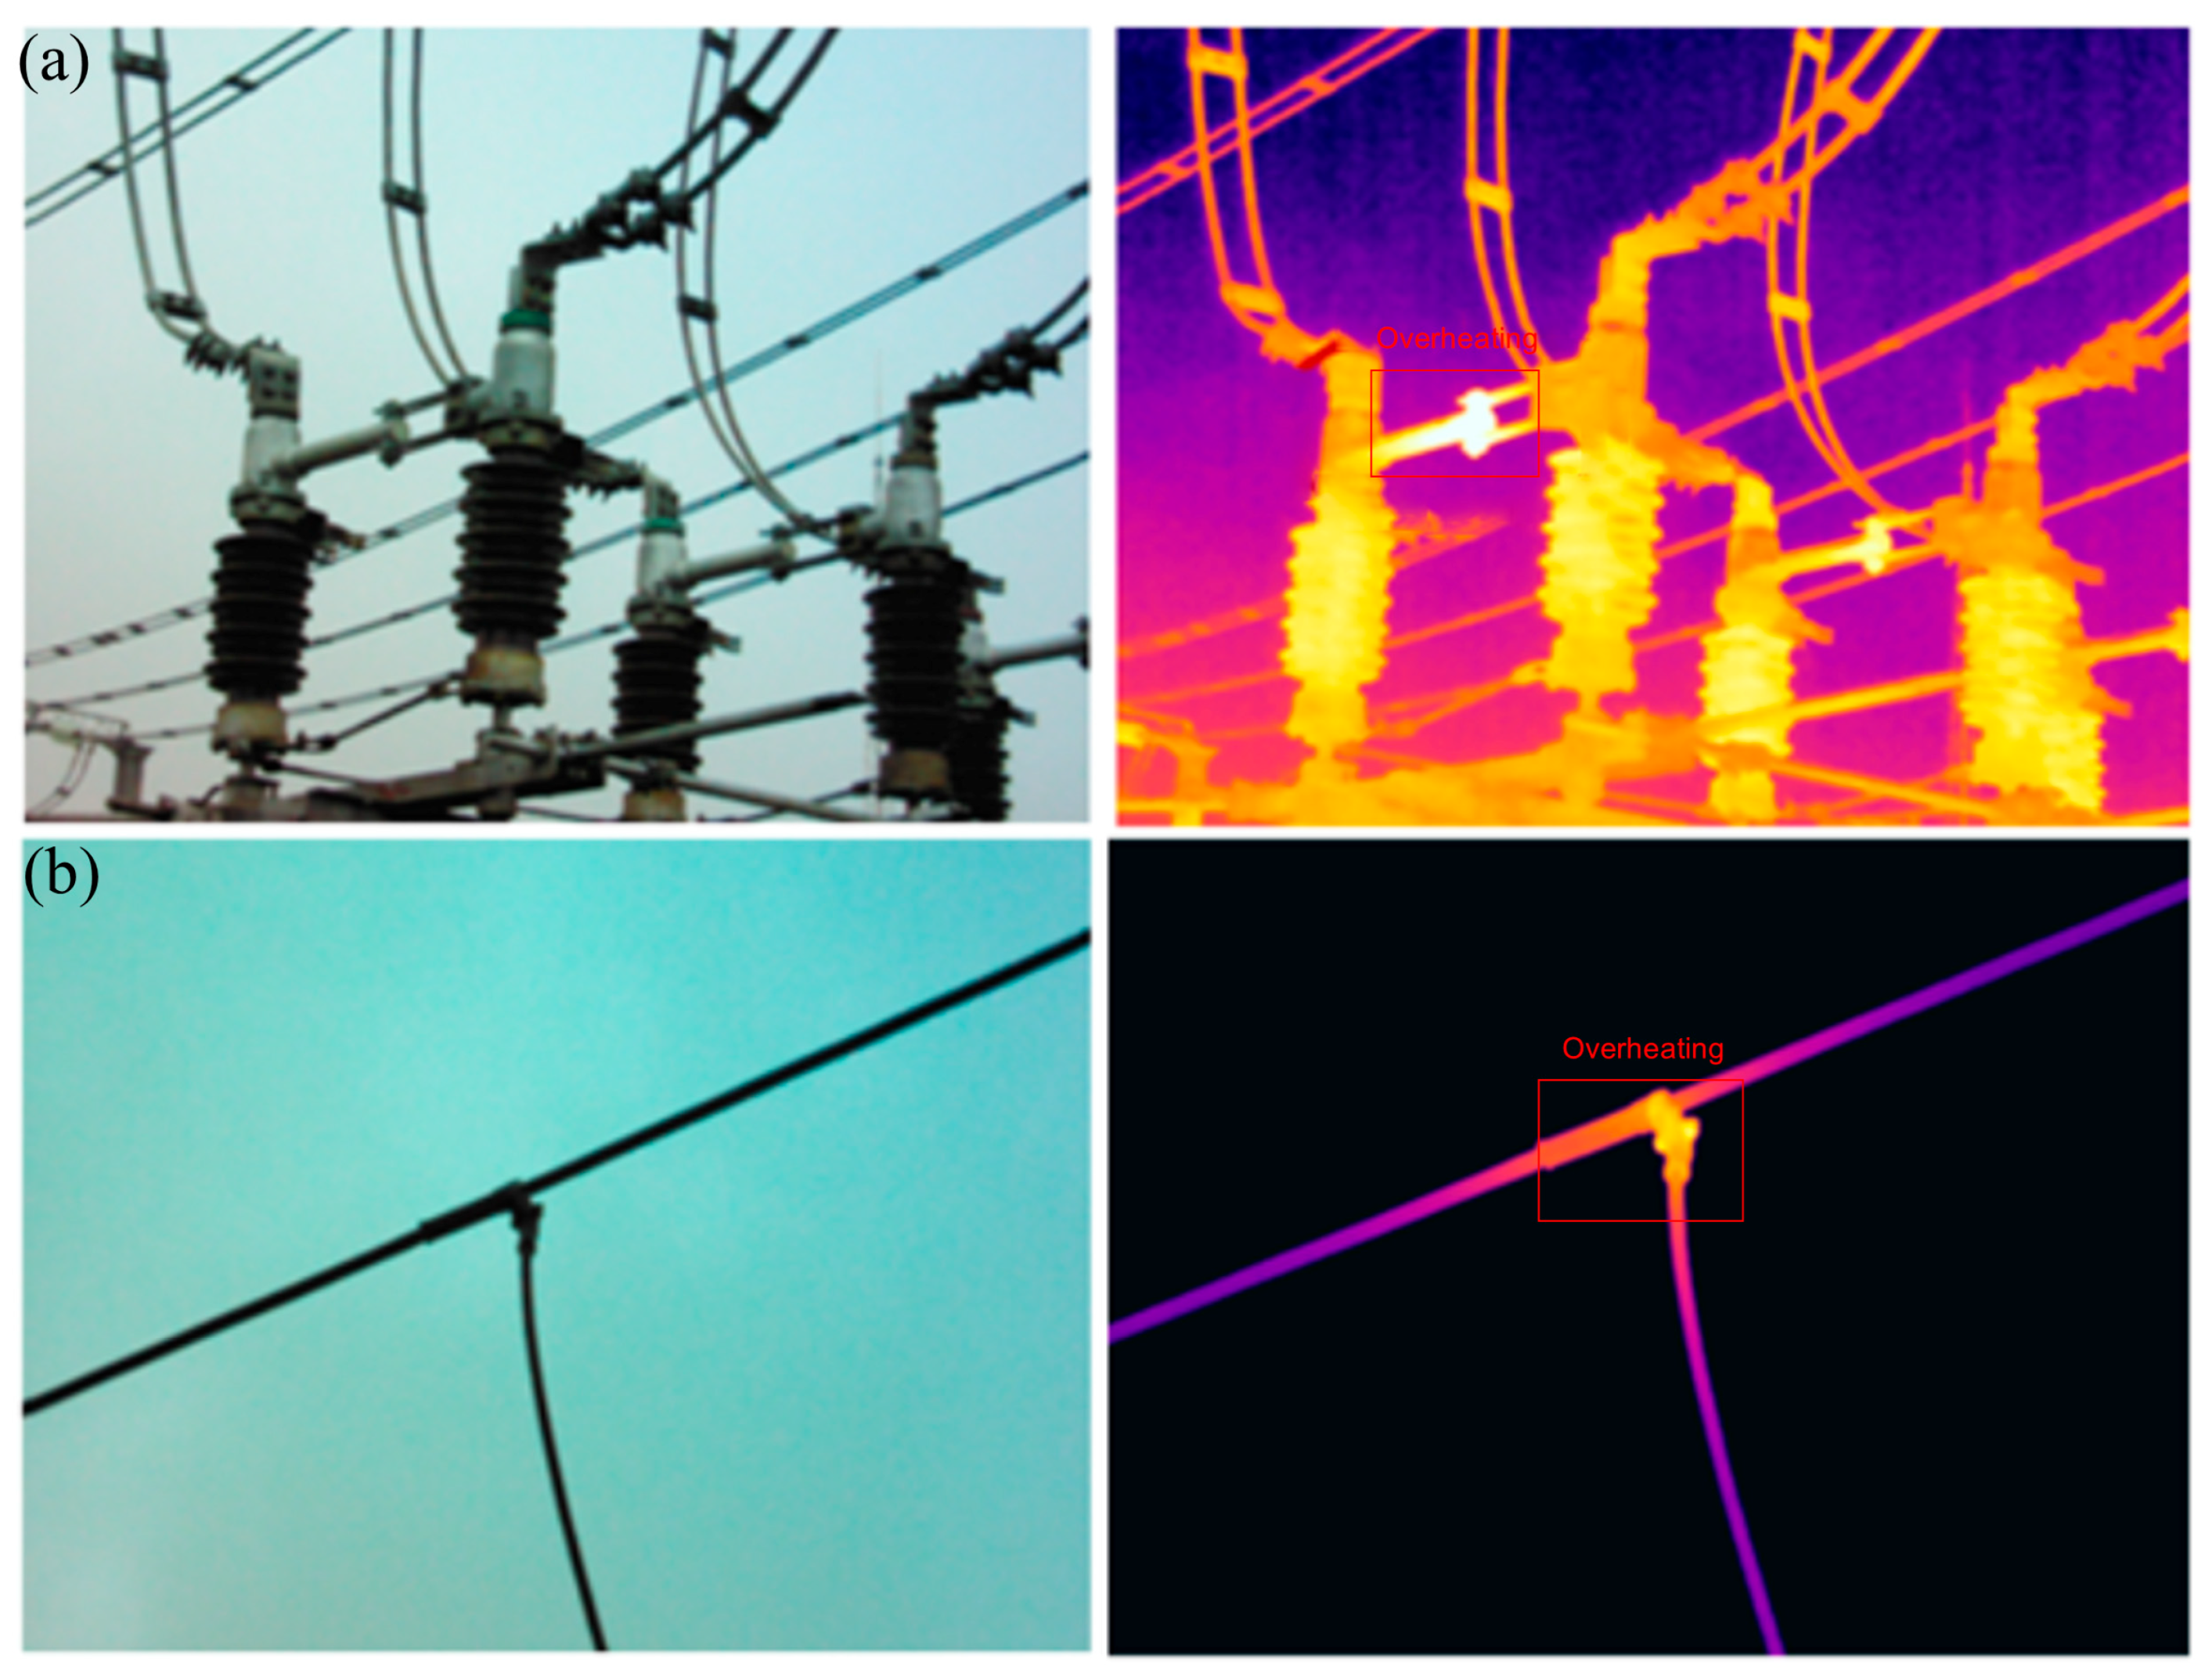
To more intuitively demonstrate the detection performance of the proposed CBAM-YOLOv4 model in actual substation patrol scenarios, Figure 6 shows a typical multimodal optical image target detection result. The left side of the figure shows the visible light image, clearly displaying the structure of the insulators and their connecting hardware; the right side shows the corresponding infrared thermal imaging map. The model successfully detected and localized significant thermal anomalies (indicated by red bounding boxes) at the connection hardware locations in the infrared image, which were not evident in the visible light image. This fully demonstrates the importance of integrating visible light and infrared optical information for accurately identifying potential equipment faults and validates that the proposed model can effectively utilize multimodal features to precisely locate abnormal regions, providing a reliable basis for subsequent temperature estimation and status assessment.
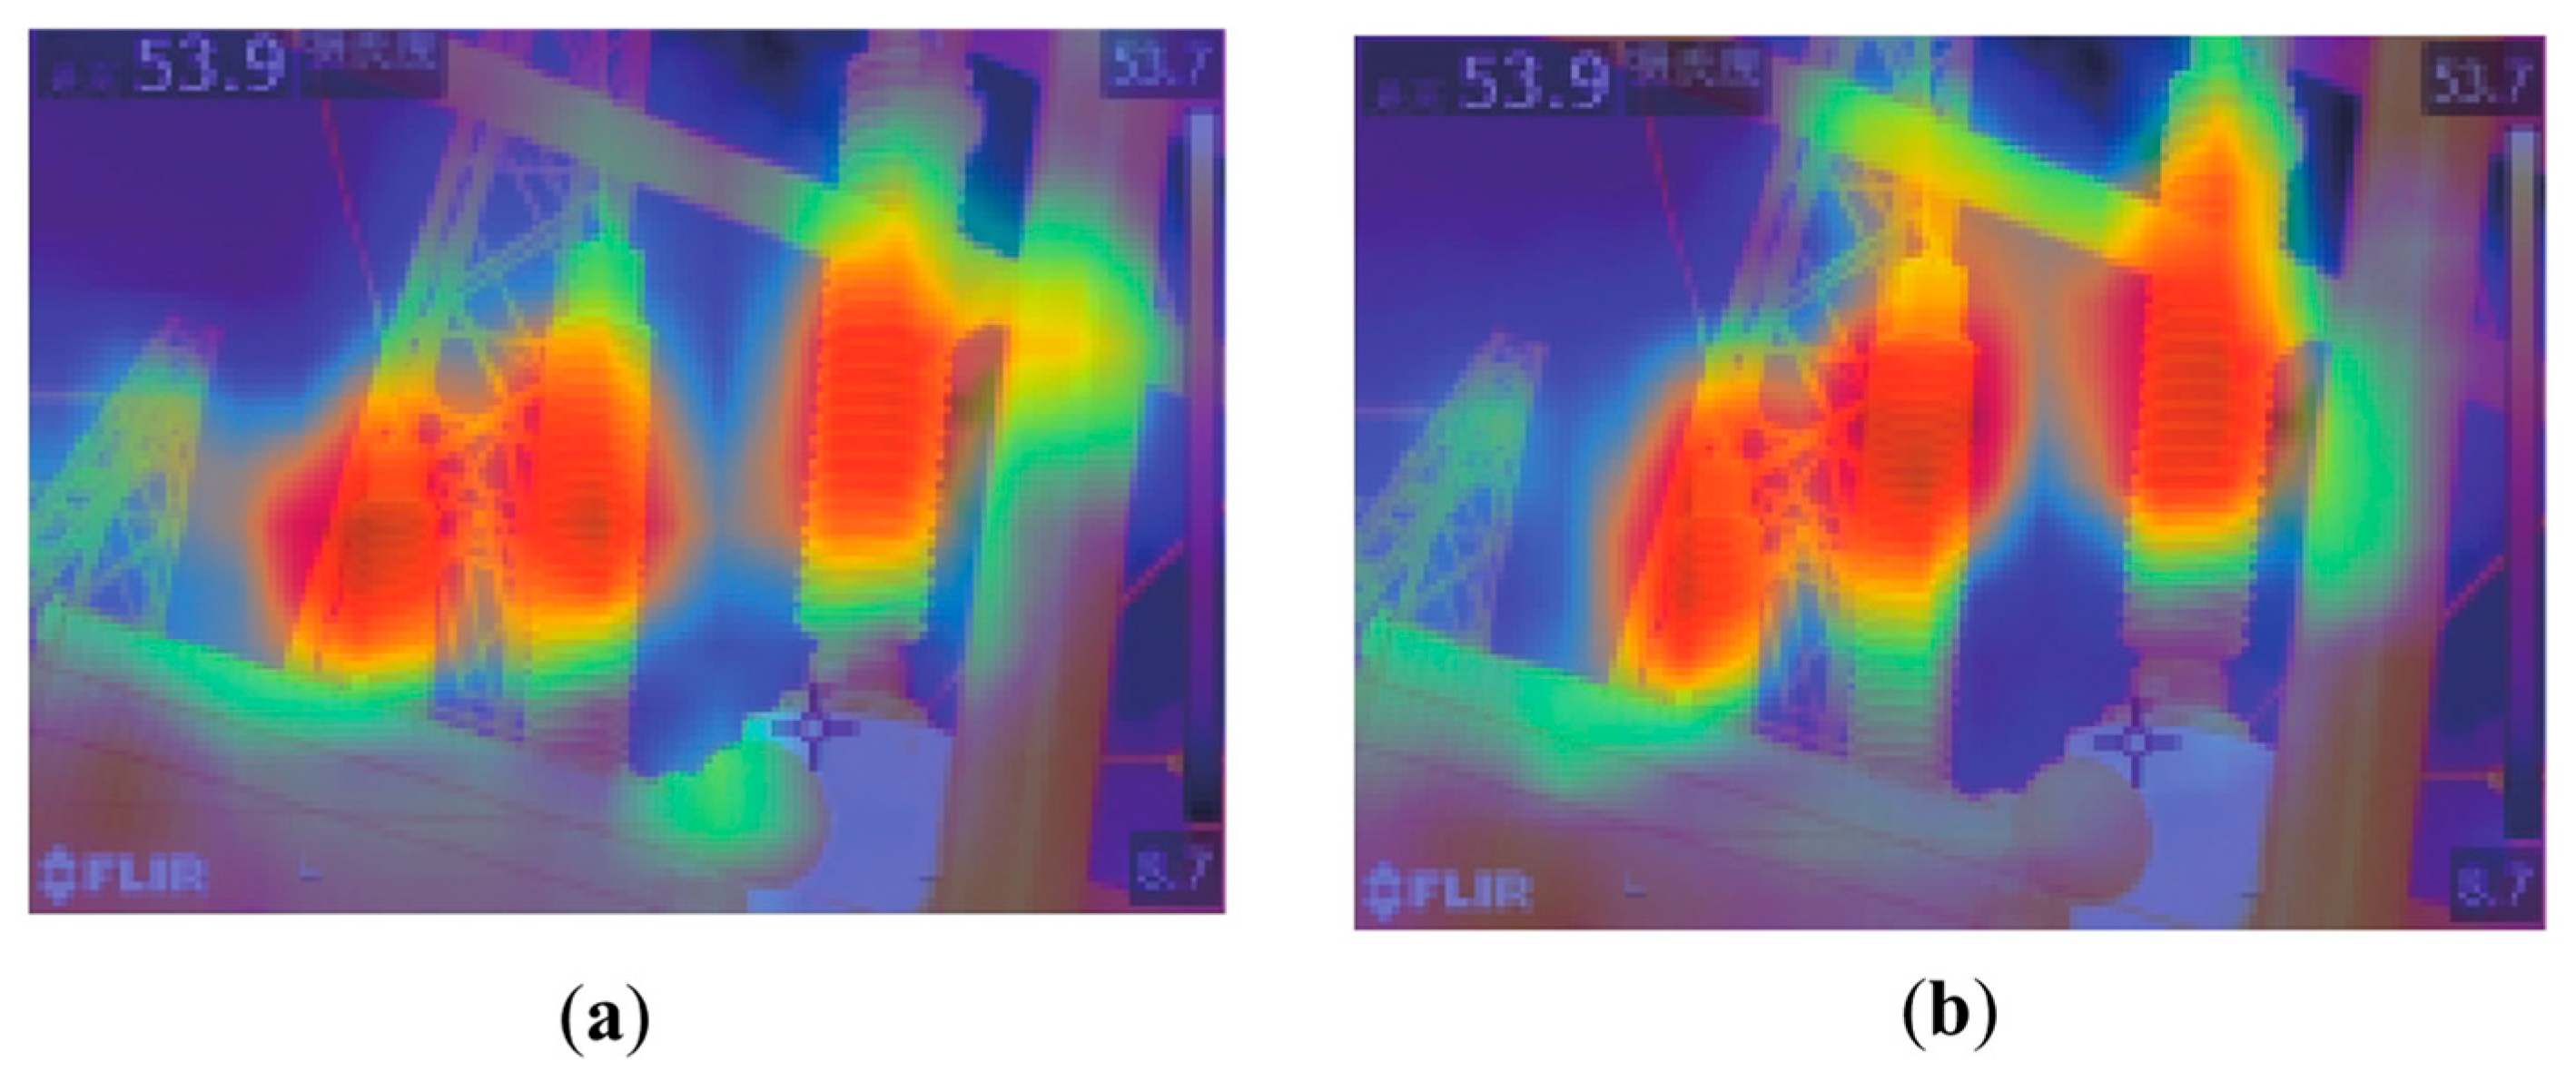
The attention hotspots of various components in power equipment substations were analyzed as shown in Figure 7. Compared with the detection algorithm without CBAM, the attention of the CBAM-YOLOv4 model can be highly concentrated on the key optical regions containing power equipment components in the image. Without CBAM, attention hotspots are scattered, easily affected by optical background or image noise, and are unable to focus effectively on the target optical information. The CBAM module guides the model to focus adaptively and weight the most informative features from the two optical modalities, thereby enhancing the model’s recognition robustness in complex optical environments.
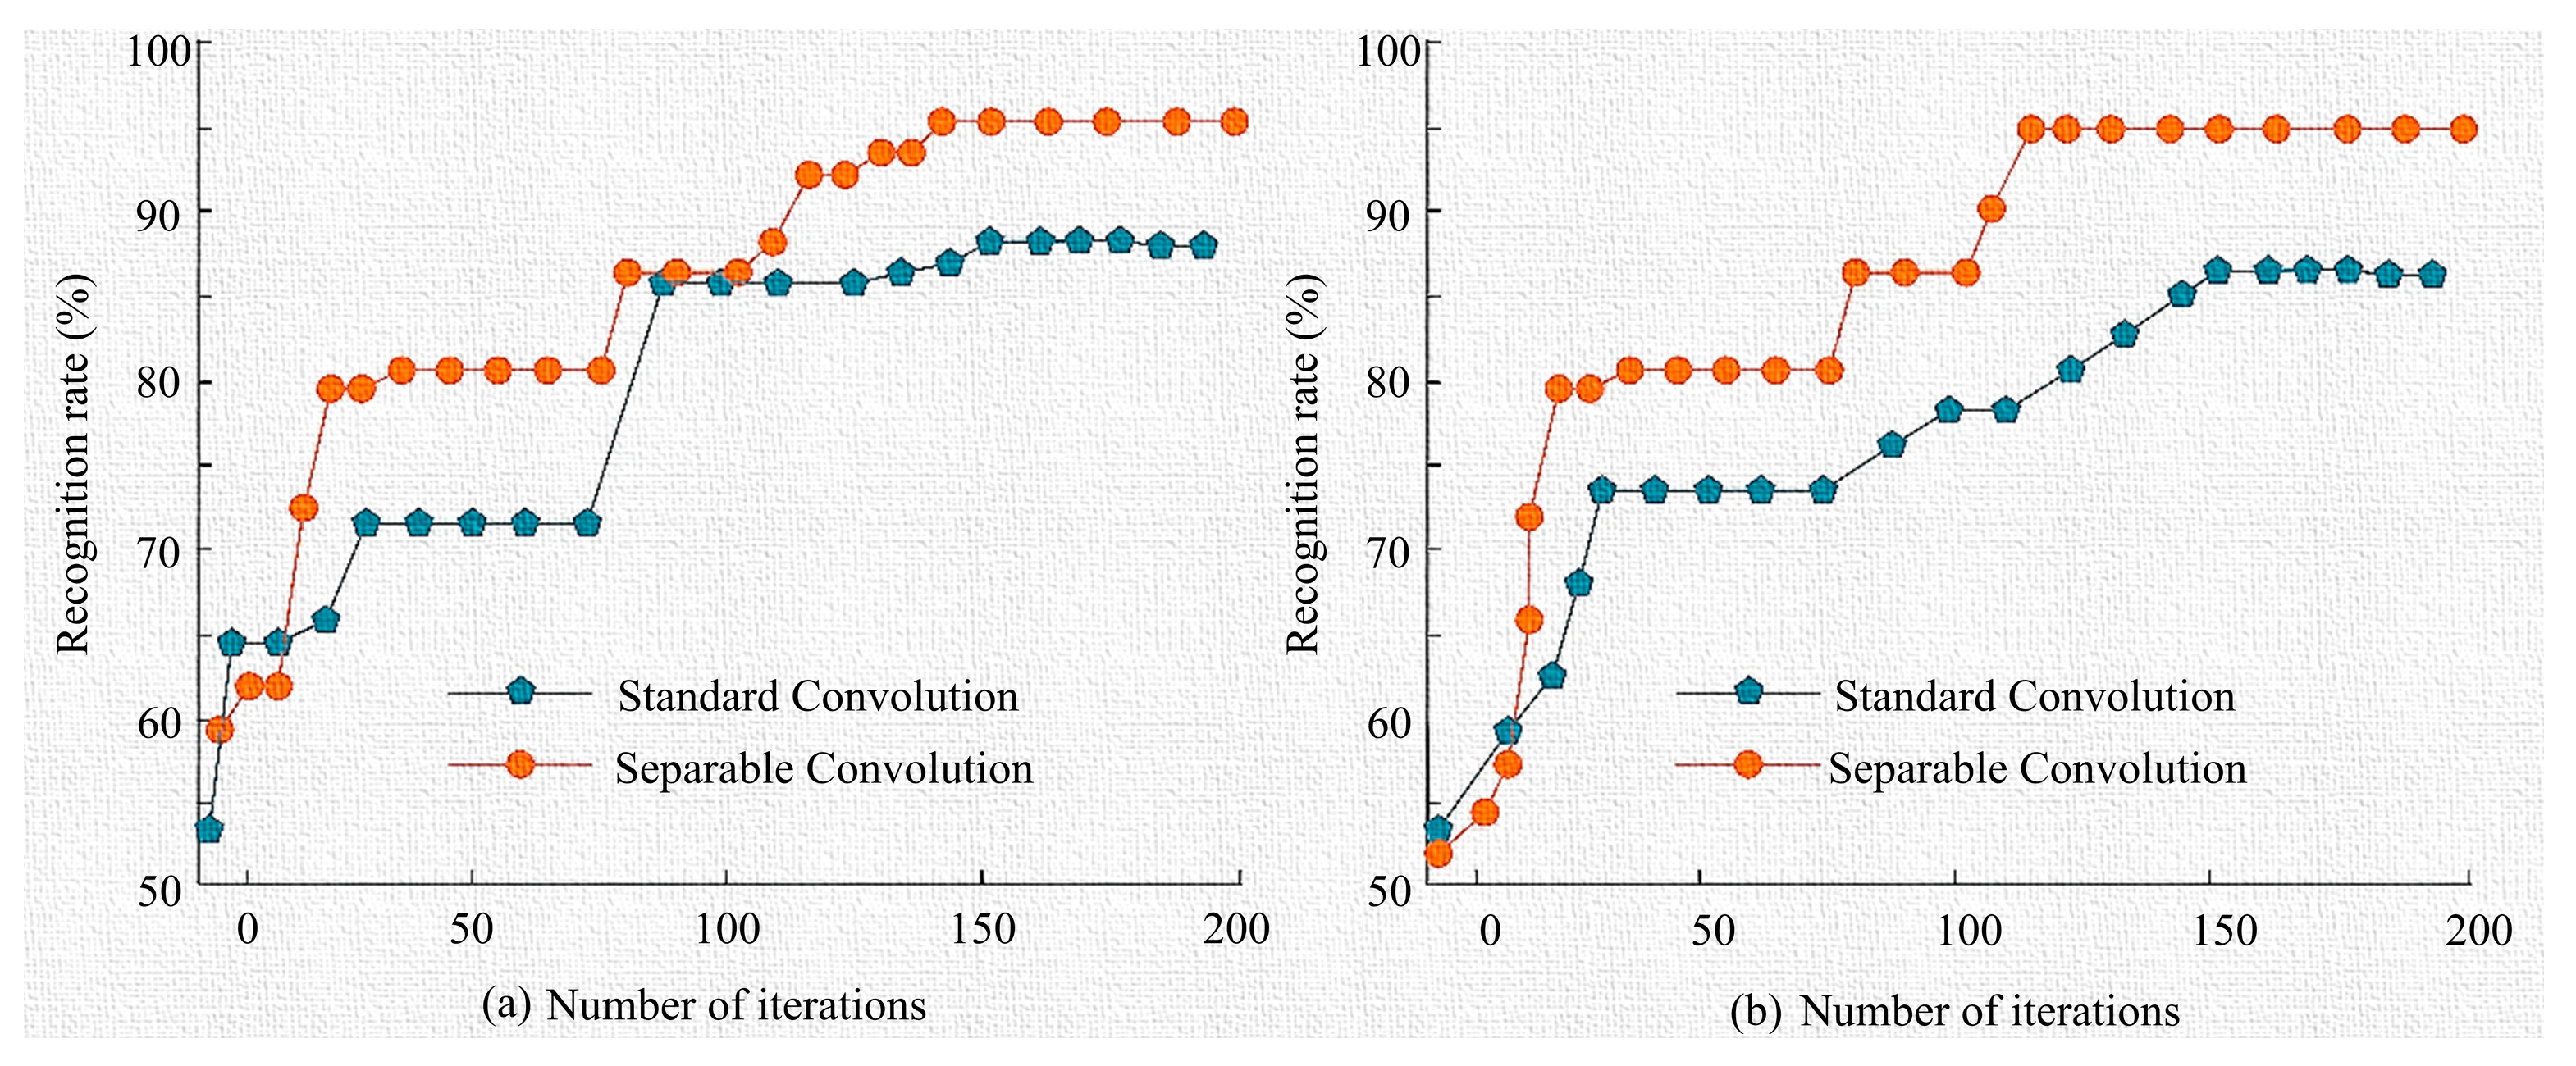
Figure 8 shows the accuracy probability curves of the two models on the training set (Figure 8a) and the test set (Figure 8b) as the number of iterations increases. The results indicate that the model using deep separable convolutions converges faster and achieves significantly higher accuracy than the standard convolutional model in optical image recognition training, validating its effectiveness in lightweight optical inspection models.
The CBAM-YOLOv4 model not only inherits the performance advantages of YOLOv4 but also leverages the feature extraction advantages of CBAM. While significantly enhancing the system’s information representation capabilities and recognition accuracy, the accuracy rate of intelligent inspection has reached 97.5%. The results show that the CBAM-YOLOv4 algorithm did not miss any error points, and the confidence scores of the recognition results were generally high. Practical results demonstrate that this method can effectively eliminate various interferences in multimodal data and automatically diagnose and identify abnormal hotspots. The proposed multimodal fusion strategy inherently enhances robustness to common environmental variations. When visible light quality is compromised by poor illumination or glare, the infrared stream provides stable thermal data, and vice versa. The CBAM module further aids this by focusing on salient target features while suppressing background noise, improving detection reliability in complex scenes.
To address the sensitivity of the model to the fusion weight α, we conducted an analysis by varying its value and observing the impact on mAP. The results are presented in Table 4.
As the results indicate, while α = 0.5 provides the highest mAP, the model’s performance remains robust and high within the range of α from 0.4 to 0.6. This suggests that our fusion strategy is not overly sensitive to the precise value of this hyperparameter, which enhances the model’s reliability in practical applications.

4.4. Edge Device Performance Validation

The results from the Jetson Nano platform, as presented in Table 5, strongly validate our claim of designing a model suitable for edge deployment. Our proposed CBAM-YOLOv4 model achieves an inference speed of 21.7 FPS, which is sufficient for real-time video stream analysis in most power inspection scenarios. Crucially, this performance significantly surpasses that of the standard YOLOv4 (6.8 FPS) and is over 16 times faster than Mask R-CNN on the same edge hardware. While the ‘Lightweight YOLOv4’ baseline is also fast, its mAP is drastically lower than our model (59.59% vs. 82.28%). This demonstrates that our CBAM-YOLOv4 model strikes a superior balance between accuracy and efficiency, making it genuinely effective and practical for resource-constrained edge devices.
Next, to further analyze the deployment potential of our CBAM-YOLOv4 model, we evaluated its performance under different precision levels using NVIDIA’s TensorRT framework. We measured latency, power consumption (using the tegrastats utility), and peak RAM usage. The detailed results are summarized in Table 6.
As shown in Table 6, quantization offers substantial benefits. INT8 quantization, in particular, boosts the inference speed to 40.8 FPS and reduces power consumption to just 5.2 W, with only a minor and acceptable drop in mAP. These metrics confirm that our model is not only accurate but also highly efficient, making it exceptionally well-suited for real-world deployment on power-constrained mobile platforms like drones and robots.

4.5. Ablation Study on Attention Mechanism

To quantify the cost-effectiveness of CBAM, we conducted an ablation study as shown in Table 7. The results demonstrate that CBAM introduces a marginal computational overhead (+1.6 ms latency, +0.2 M parameters) but yields a significantly larger accuracy gain (+2.16% mAP) compared to the simpler SE-Block (+0.93% mAP). This superior performance-to-cost ratio not only validates our choice of CBAM over other lightweight attention mechanisms but also confirms that CBAM actively enhances the model’s feature extraction capabilities, rather than merely compensating for an ‘overly aggressive’ lightweighting strategy. It enables the crucial balance between efficiency and accuracy that is the hallmark of our proposed solution.

5. Conclusions

This paper introduced CBAM-YOLOv4, a lightweight multimodal fusion model for object detection in power inspection. By integrating a MobileNet-v3 backbone, depthwise separable convolutions, and a CBAM attention module, our model achieves a superior balance of accuracy and efficiency. This desirable balance is achieved through a carefully designed synergistic integration and system-level optimization.
The results of the case study demonstrate that the CBAM-YOLOv4 model proposed in this paper performs excellently in handling multimodal optical image tasks in substations. Compared to the standard YOLOv4, it achieves a slight improvement in optical object detection accuracy (mAP increased by 1.61%) while significantly accelerating optical image processing speed (FPS increased by 18.05 frames per second) and reducing model size (reduced by 2 MB). This achieves an excellent balance between optical detection accuracy, real-time processing capability, and hardware deployment feasibility. The robustness and practical applicability of our model are underscored by comprehensive testing on the specialized VISED dataset and its validated performance on power-constrained edge devices. Post-quantization tests on the Jetson Nano demonstrated that the model can achieve an inference speed of 40.8 FPS with a minimal mAP drop, while consuming only 5.2 W of power and requiring 620 MB of RAM, confirming its excellent suitability for real-time, on-board processing in power-constrained mobile inspection systems.
In summary, the lightweight multimodal optical image processing technology proposed in this paper offers an efficient and accurate solution for intelligent patrol inspections in substations, significantly enhancing the comprehensive analysis and utilization of visible and infrared optical information. This has significant practical value for promoting the application of optical detection technology in power system condition monitoring. Future work will focus on enhancing model robustness for all-weather deployment by expanding the dataset with more diverse conditions like fog and rain. Finally, a deeper analysis into modality contributions and failure cases under compromised stream conditions will provide invaluable insights for future model refinements.

Author Contributions

Conceptualization, L.Z., J.K., Y.T., S.X., L.L., and Y.Z.; methodology, L.Z., J.K., Y.T., S.X., L.L., and Y.Z.; software, L.Z., J.K., Y.T., S.X., L.L., and Y.Z.; writing—original draft, L.Z., J.K., Y.T., S.X., L.L., and Y.Z. All authors have read and agreed to the published version of the manuscript.

Funding

This research is funded by the State Grid Sichuan Electric Power Company Science and Technology Project (521997240003).

Data Availability Statement

The original contributions presented in this study are included in the article. Further inquiries can be directed to the corresponding authors.

Acknowledgments

We would like to express our sincere gratitude to the reviewers for your professional opinions and valuable suggestions, and our heartfelt thanks to the editorial board of the journal for their efficient work in supporting the rigorous presentation of the scholarly results. We would like to pay tribute to the academic community.

Conflicts of Interest

Authors Junwei Kuang and Lin Li were employed by State Grid Sichuan Electric Power Company. Author Yingjie Zhou was employed by Chuanshen Hongan Intelligent (Shenzhen) Co., Ltd. The remaining authors declare that the research was conducted in the absence of any commercial or financial relationships that could be construed as a potential conflict of interest.

References

  1. Kim, S.; Kim, D.; Jeong, S.; Ham, J.-W.; Lee, J.-K.; Oh, K.-Y. Fault Diagnosis of Power Transmission Lines Using a UAV-Mounted Smart Inspection System. IEEE Access 2020, 8, 149999–150009. [Google Scholar] [CrossRef]
  2. Piancó, F.; Moreira, A.; Fanzeres, B.; Jiang, R.; Zhao, C.; Heleno, M. Decision-Dependent Uncertainty-Aware Distribution System Planning Under Wildfire Risk. IEEE Trans. Power Syst. 2025, 1–15. [Google Scholar] [CrossRef]
  3. Zhou, N.; Luo, L.; Sheng, G.; Jiang, X. Scheduling the Imperfect Maintenance and Replacement of Power Substation Equipment: A Risk-Based Optimization Model. IEEE Trans. Power Deliv. 2025, 40, 2154–2166. [Google Scholar] [CrossRef]
  4. Raghuveer, R.M.; Bhalja, B.R.; Agarwal, P. Real-Time Energy Management System for an Active Distribution Network with Multiple EV Charging Stations Considering Transformer’s Aging and Reactive Power Dispatch. IEEE Trans. Ind. Appl. 2025, 1–13. [Google Scholar] [CrossRef]
  5. Hrnjic, T.; Dzafic, I.; Ackar, H. Data Model for Three Phase Distribution Network Applications. In Proceedings of the 2019 XXVII International Conference on Information, Communication and Automation Technologies (ICAT), Sarajevo, Bosnia and Herzegovina, 20–23 October 2019; pp. 1–5. [Google Scholar]
  6. Zhang, L.; Hu, L.; Wang, D. Mechanistic Unveiling of Transformer Circuits: Self-Influence as a Key to Model Reasoning 2025. Available online: https://aclanthology.org/2025.findings-naacl.76.pdf (accessed on 1 January 2025).
  7. Chung, Y.; Lee, S.; Kim, W. Latest Advances in Common Signal Processing of Pulsed Thermography for Enhanced Detectability: A Review. Appl. Sci. 2021, 11, 12168. [Google Scholar] [CrossRef]
  8. Shi, B.; Jiang, Y.; Xiao, W.; Shang, J.; Li, M.; Li, Z.; Chen, X. Power Transformer Vibration Analysis Model Based on Ensemble Learning Algorithm. IEEE Access 2025, 13, 37812–37827. [Google Scholar] [CrossRef]
  9. Feng, J.; Shang, R.; Zhang, M.; Jiang, G.; Wang, Q.; Zhang, G.; Jin, W. Transformer Abnormal State Identification Based on TCN-Transformer Model in Multiphysics. IEEE Access 2025, 13, 44775–44788. [Google Scholar] [CrossRef]
  10. Pinho, L.S.; Sousa, T.D.; Pereira, C.D.; Pinto, A.M. Anomaly Detection for PV Modules Using Multi-Modal Data Fusion in Aerial Inspections. IEEE Access 2025, 13, 88762–88779. [Google Scholar] [CrossRef]
  11. Wu, D.; Yang, W.; Li, J. Fault Detection Method for Transmission Line Components Based on Lightweight GMPPD-YOLO. Meas. Sci. Technol. 2024, 35, 116015. [Google Scholar] [CrossRef]
  12. Cao, X.; Yu, J.; Tang, S.; Sui, J.; Pei, X. Detection and Removal of Excess Materials in Aircraft Wings Using Continuum Robot End-Effectors. Front. Mech. Eng. 2024, 19, 36. [Google Scholar] [CrossRef]
  13. Li, C.; Shi, Y.; Lu, M.; Zhou, S.; Xie, C.; Chen, Y. A Composite Insulator Overheating Defect Detection System Based on Infrared Image Object Detection. IEEE Trans. Power Deliv. 2024, 40, 203. [Google Scholar] [CrossRef]
  14. He, Y.; Wu, R.; Dang, C. Low-Power Portable System for Power Grid Foreign Object Detection Based on the Lightweight Model of Improved YOLOv7. IEEE Access 2024, 13, 125301–125312. [Google Scholar] [CrossRef]
  15. Xu, X.; Liu, G.; Bavirisetti, D.P.; Zhang, X.; Sun, B.; Xiao, G. Fast Detection Fusion Network (FDFnet): An End to End Object Detection Framework Based on Heterogeneous Image Fusion for Power Facility Inspection. IEEE Trans. Power Deliv. 2022, 37, 4496–4505. [Google Scholar] [CrossRef]
  16. Wei, J.; Ma, H.; Lu, R. Challenges Driven Network for Visual Tracking. In International Conference on Image and Graphics; Springer: Cham, Switzerland, 2019; pp. 332–344. [Google Scholar]
  17. Wang, K.; Wu, B. Power Equipment Fault Diagnosis Model Based on Deep Transfer Learning with Balanced Distribution Adaptation. In International Conference on Advanced Data Mining and Applications; Springer: Cham, Switzerland, 2018; pp. 178–188. [Google Scholar]
  18. Shen, J.; Liu, N.; Sun, H. Vehicle Detection in Aerial Images Based on Lightweight Deep Convolutional Network. IET Image Process. 2020, 15, 479–491. [Google Scholar] [CrossRef]
  19. Zhou, S.; Liu, J.; Fan, X.; Fu, Q.; Goh, H.H. Thermal Fault Diagnosis of Electrical Equipment in Substations Using Lightweight Convolutional Neural Network. IEEE Trans. Instrum. Meas. 2023, 72, 3240210. [Google Scholar] [CrossRef]
  20. Parico, A.I.B.; Ahamed, T. Real Time Pear Fruit Detection and Counting Using YOLOv4 Models and Deep SORT. Sensors 2021, 21, 4803. [Google Scholar] [CrossRef] [PubMed]
  21. Woo, S.; Park, J.; Lee, J.-Y.; Kweon, I.S. CBAM: Convolutional Block Attention Module. In Proceedings of the European Conference on Computer Vision (ECCV), Munich, Germany, 8–14 September 2018; Volume abs/1807.06521, pp. 3–19. [Google Scholar]
  22. Vergura, S. Correct Settings of a Joint Unmanned Aerial Vehicle and Infrared Camera System for the Detection of Faulty Photovoltaic Modules. IEEE J. Photovolt. 2020, 11, 124–130. [Google Scholar] [CrossRef]
  23. Bai, X.; Wang, R.; Pi, Y.; Zhang, W. DMFR-YOLO: An Infrared Small Hotspot Detection Algorithm Based On Double Multi-Scale Feature Fusion. Meas. Sci. Technol. 2024, 36, 015422. [Google Scholar] [CrossRef]
  24. Wang, R.; Chen, J.; Wang, X.; Xu, J.; Chen, B.; Wu, W.; Li, C. Research on Infrared Image Extraction and Defect Analysis of Composite Insulator Based on U-Net. In Proceedings of the 2021 IEEE 5th Information Technology, Networking, Electronic and Automation Control Conference (ITNEC), Xi’an, China, 15–17 October 2021; Volume 36, pp. 859–863. [Google Scholar]
  25. Hong, F.; Song, J.; Meng, H.; Wang, R.; Fang, F.; Zhang, G. A Novel Framework on Intelligent Detection for Module Defects of PV Plant Combining the Visible and Infrared Images. Sol. Energy 2022, 236, 406–416. [Google Scholar] [CrossRef]
  26. Li, X.; Wang, H.; He, Y.; Gao, Z.; Zhang, X.; Wang, Y. Active Thermography Non-Destructive Testing Going beyond Camera’s Resolution Limitation: A Heterogenous Dual-Band Single-Pixel Approach. IEEE Trans. Instrum. Meas. 2025, 74, 3545520. [Google Scholar] [CrossRef]
  27. Wang, H.; Hou, Y.; He, Y.; Wen, C.; Giron-Palomares, B.; Duan, Y.; Gao, B.; Vavilov, V.P.; Wang, Y. A Physical-Constrained Decomposition Method of Infrared Thermography: Pseudo Restored Heat Flux Approach Based on Ensemble Bayesian Variance Tensor Fraction. IEEE Trans. Ind. Inform. 2023, 20, 3413–3424. [Google Scholar] [CrossRef]
  28. Zhuang, J.; Chen, W.; Guo, B.; Yan, Y. Infrared Weak Target Detection in Dual Images and Dual Areas. Remote Sens. 2024, 16, 3608. [Google Scholar] [CrossRef]
  29. Wang, C.; Yin, L.; Zhao, Q.; Wang, W.; Li, C.; Luo, B. An Intelligent Robot for Indoor Substation Inspection. Ind. Robot. 2020, 47, 705–712. [Google Scholar] [CrossRef]
  30. Dong, L.; Chen, N.; Liang, J.; Li, T.; Yan, Z.; Zhang, B. A Review of Indoor-Orbital Electrical Inspection Robots in Substations. Ind. Robot. 2022, 50, 337–352. [Google Scholar] [CrossRef]
  31. Wang, Q.; Yang, L.; Zhou, B.; Luan, Z.; Zhang, J. YOLO-SS-Large: A Lightweight and High-Performance Model for Defect Detection in Substations. Sensors 2023, 23, 8080. [Google Scholar] [CrossRef]
  32. Kong, D.; Hu, X.; Zhang, J.; Liu, X.; Zhang, D. Design of Intelligent Inspection System for Solder Paste Printing Defects Based on Improved YOLOX. iScience 2024, 27, 109147. [Google Scholar] [CrossRef]
  33. Zhang, N.; Yang, G.; Wang, D.; Hu, F.; Yu, H.; Fan, J. A Defect Detection Method for Substation Equipment Based on Image Data Generation and Deep Learning. IEEE Access 2024, 12, 105042–105054. [Google Scholar] [CrossRef]
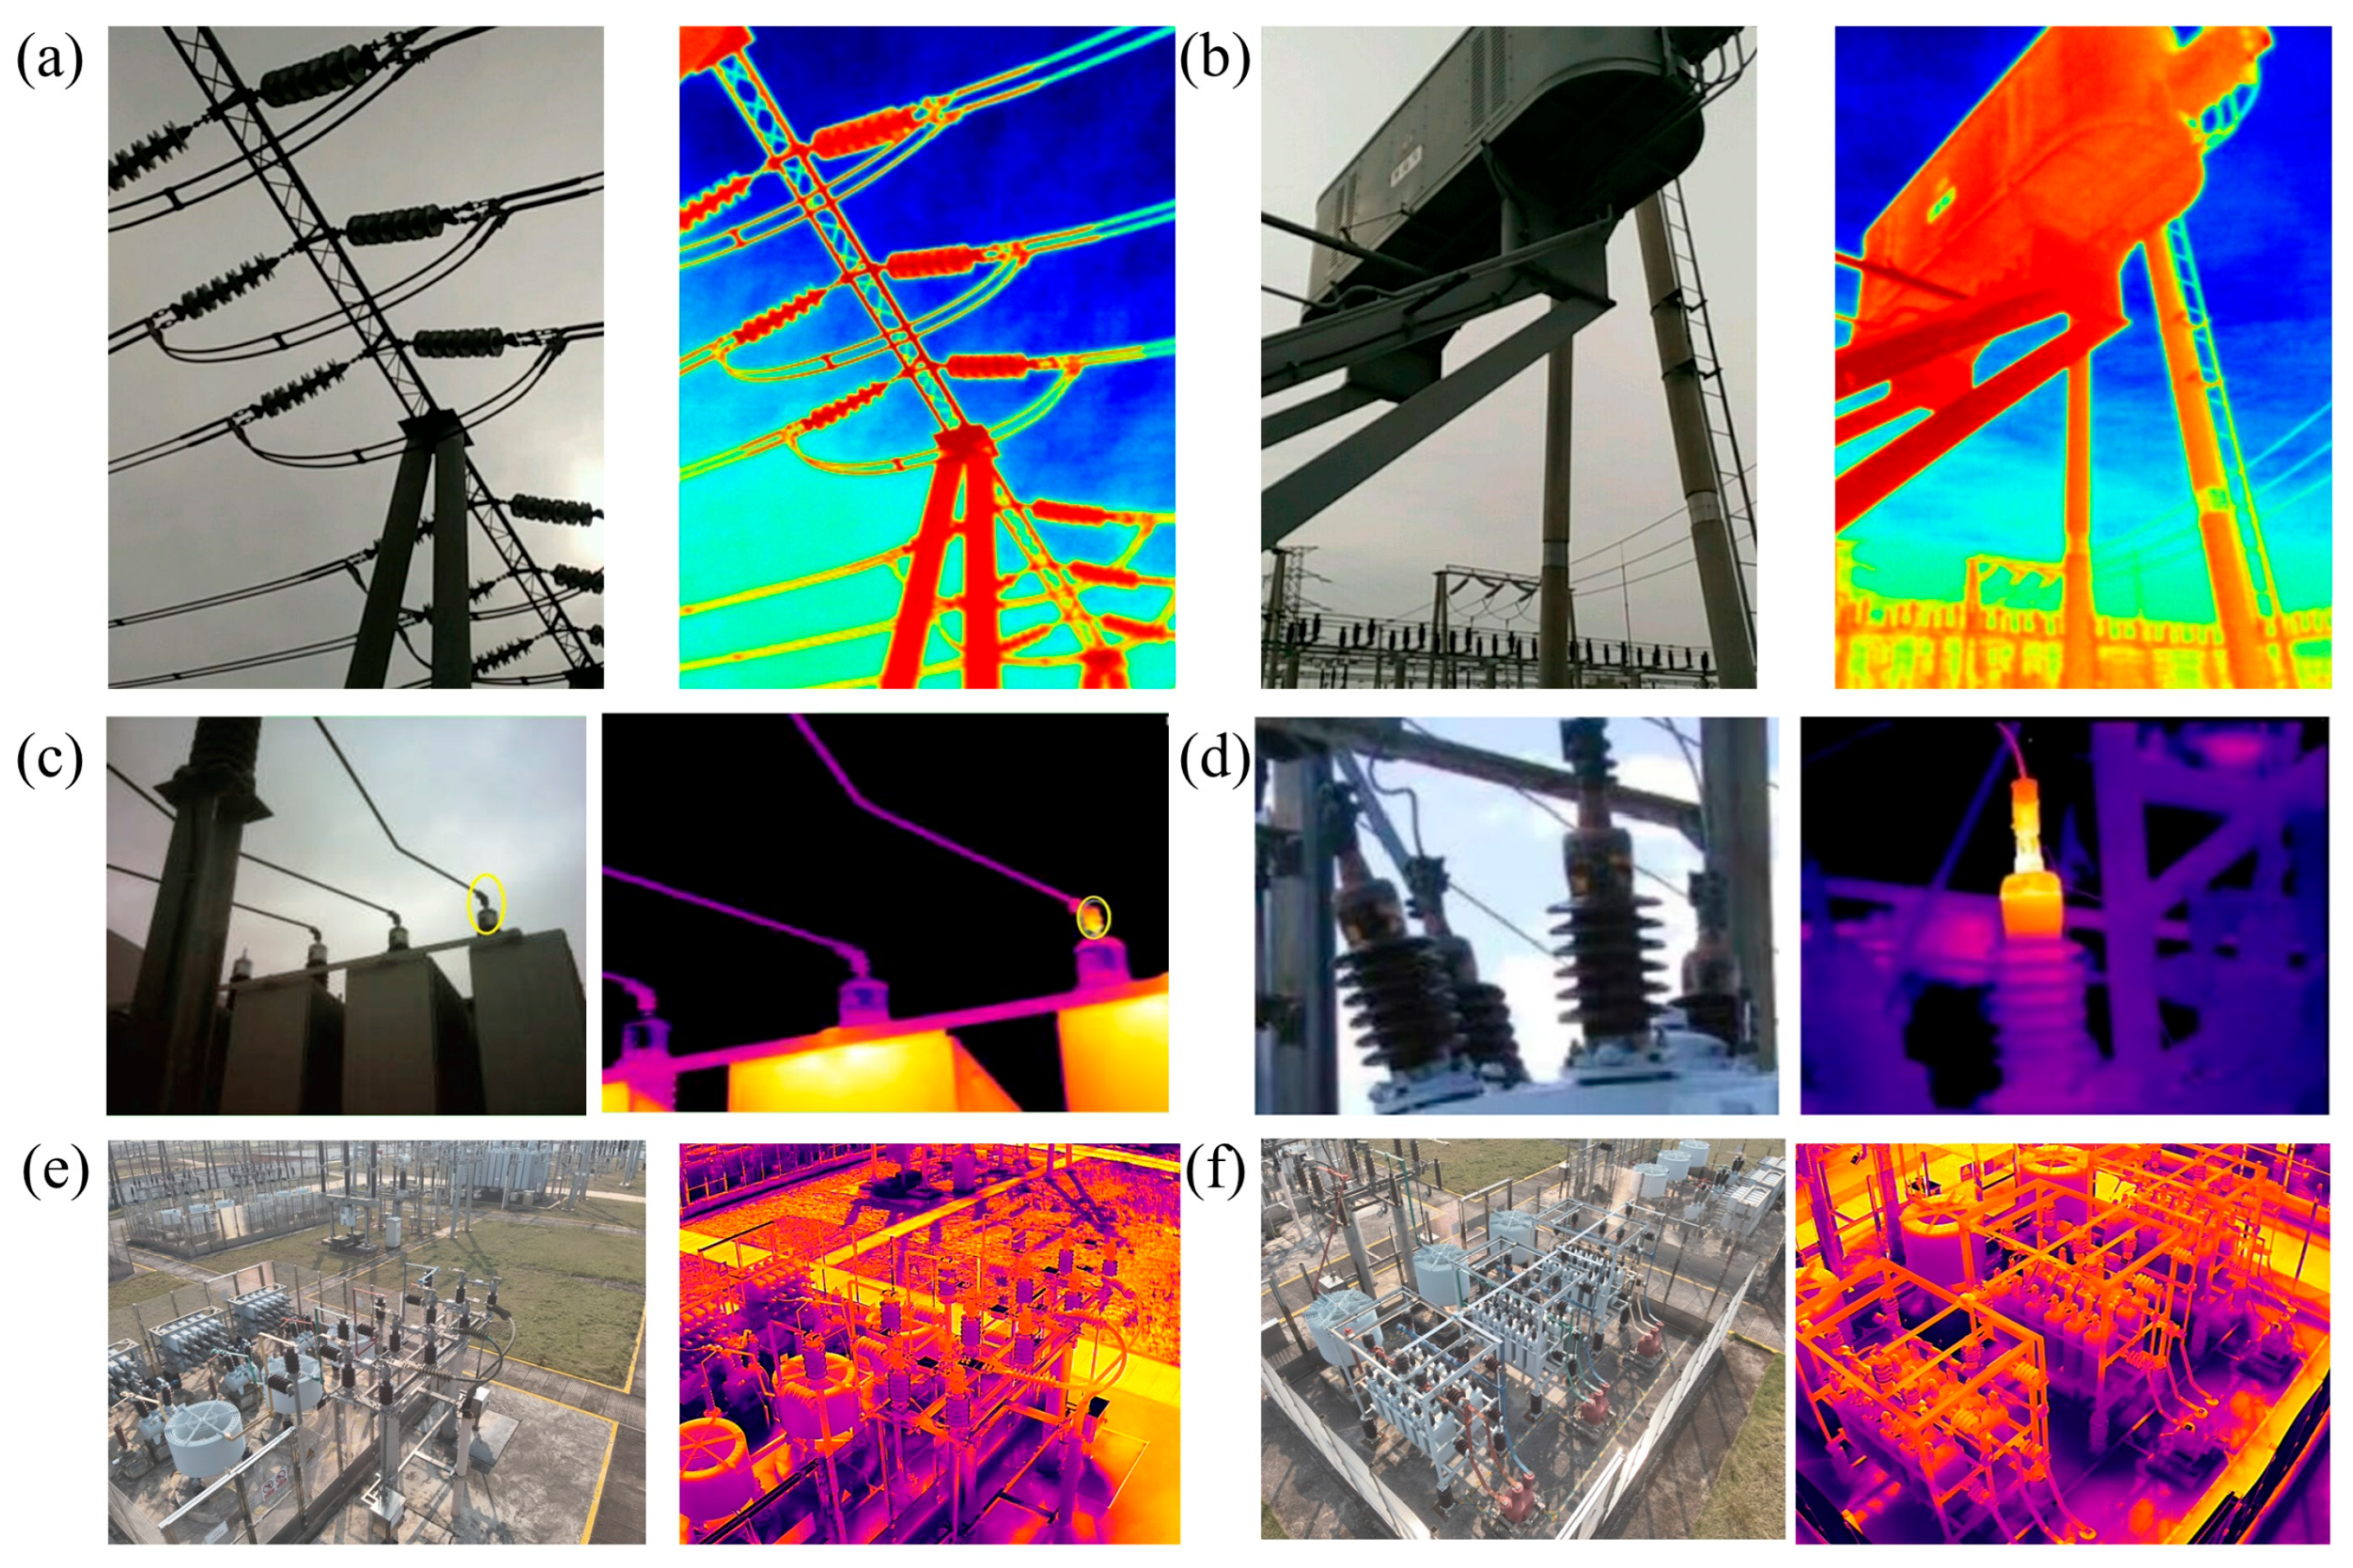
Figure 1. Comparison of visible light (left) and infrared imaging (right) inspection examples of substation equipment: (a) normal insulator string; (b) normal substation equipment; (c) abnormal heat at equipment connection points; (d,e) abnormal heat at insulator connection fittings; (f) abnormal aerial view of substation.
Processes 13 02720 g001
Figure 2. YOLOv4 network structure diagram.
Processes 13 02720 g002
Figure 3. Diagram of standard convolution (Top) and depthwise separable convolution (Bottom) for processing optical feature maps.
Processes 13 02720 g003
Figure 4. Workflow diagram of the CBAM module enhancing optical feature attention.
Processes 13 02720 g004
Figure 5. Overall network framework diagram for improved multimodal optical image object detection.
Processes 13 02720 g005
Figure 6. An example of the detection results from our proposed method. (a) The original visible light image of substation equipment. (b) The detection bounding boxes overlaid on the infrared thermography image.
Processes 13 02720 g006
Figure 7. Visualization of the CBAM-enhanced model’s focus on infrared optical features. (a) Attention Hotspot Areas Without CBAM; (b) Attention Hotspot Areas With CBAM.
Processes 13 02720 g007
Figure 8. Performance comparison of depthwise separable convolution and standard convolution in optical image recognition training. (a) results on the training set; (b) results on the test set.
Processes 13 02720 g008
Table 1. Key features of the VISED dataset.
FeatureDescription/Value
Dataset NameVISED
Data ModalityVisible Light and Infrared Thermography
Total Number of Image Pairs500 pairs
Data SourceMultiple real-world industrial sites and laboratory environments
Equipment TypesTransformers, switches, insulators, capacitors,
connectors, etc.
Covered ScenariosVarious typical substation equipment, including normal conditions and common infrared thermal
anomaly patterns
Image RegistrationSynchronized collection of visible light and infrared images, spatial registration
Data DivisionTraining Set: 250 pairs; Test Set: 250 pairs
Basic PreprocessingImage normalization, noise filtering, etc.
Table 2. Edge device configuration for performance validation.
ComponentSpecifications
DeviceNVIDIA Jetson Nano Developer Kit
CPUQuad-core ARM® Cortex®-A57 MPCore processor
GPU128-core NVIDIA MaxwellTM architecture GPU
Memory4 GB 64-bit LPDDR4
SoftwareNVIDIA JetPack SDK with TensorRT
Table 3. Comparison table of five models.
ModelWeight File Size (MB)mIoU (%)mAP (%)Frames Per Second (FPS)
YOLOv42781.1980.6713.48
YOLOv33074.7874.7719.78
Lightweight YOLOv41964.1959.5925.29
MASK-RCNN2873.7771.189.49
CBAM-YOLOv42585.1282.2831.53
Note: The “Lightweight YOLOv4” baseline refers to our proposed architecture (MobileNetV3 backbone, depthwise separable convolutions) but without the CBAM attention modules.
Table 4. Sensitivity analysis of fusion weight α.
Value of αmAP (%)
0.381.6
0.482
0.5 (Optimal)82.28
0.682.1
0.781.2
Table 5. Performance comparison on the NVIDIA Jetson Nano Edge device.
ModelmAP (%)Inference Speed (FPS) on Jetson Nano
YOLOv480.676.8
YOLOv374.779.5
Lightweight YOLOv459.5918.2
MASK-RCNN71.181.3 (practically unusable)
CBAM-YOLOv482.2821.7
Table 6. Comprehensive deployment metrics for CBAM-YOLOv4 on NVIDIA Jetson Nano.
Precision LevelmAP (%)Latency (ms)FPSAvg. Power (W)Peak RAM (MB)
FP32 (Baseline)82.2846.121.77.81150
FP1682.1531.3326.5780
INT880.9124.540.85.2620
Table 7. Ablation study on the impact of attention nodules.
Model ConfigurationmAP (%)Latency (ms)Parameters (M)
Lightweight YOLOv4 (Baseline)80.1244.524.8
Lightweight YOLOv4 + SE81.0545.224.9
Lightweight YOLOv4 + CBAM (Ours)82.2846.125.0
Note: Baseline refers to our lightweight architecture without any attention module. Metrics are tested on the Jetson Nano (FP32).
Disclaimer/Publisher’s Note: The statements, opinions and data contained in all publications are solely those of the individual author(s) and contributor(s) and not of MDPI and/or the editor(s). MDPI and/or the editor(s) disclaim responsibility for any injury to people or property resulting from any ideas, methods, instructions or products referred to in the content.