Abstract
Optimization of injection molding process parameters is essential for improving product quality and production efficiency. Traditional methods, which rely heavily on operator experience, often result in inconsistencies, high time consumption, high defect rates, and suboptimal energy consumption. In this study, an improved particle swarm optimization (IPSO) algorithm was proposed, integrating dynamic inertia weight adjustment, adaptive acceleration coefficients, and position constraints to address the issue of premature convergence and enhance global search capabilities. A dual-model architecture was implemented: a constraint validation mechanism based on support vector machine (SVM) was enforced per iteration cycle to ensure stepwise quality compliance, while a fitness function derived by extreme gradient boosting (XGBoost) was formulated to minimize cycle time as the optimization objective. The results demonstrated that the average injection cycle time was reduced by 9.41% while ensuring that the product was qualified. The SVM and XGBoost models achieved high performance metrics (accuracy: 0.92; R2: 0.93; RMSE: 1.05), confirming their robustness in quality classification and cycle time prediction. This method provides a systematic and data-driven solution for multi-objective optimization in injection molding, significantly improving production efficiency and energy utilization.
1. Introduction
Injection molding is a pivotal manufacturing process widely utilized for producing plastic components across industries including household appliances, automotive and medical devices [1]. As the core equipment, injection molding machines represent the largest market share among plastic machinery in China. They are responsible for heating and melting plastic granules or powders, and then injecting the molten material into molds [2]. Typically, the machine consists of several key components, including the injection unit, mold clamping device, ejector mechanism, heating system, electrical control system, and drive mechanism [3]. The quality of molded products including dimensional accuracy, surface finish and mechanical properties, is critically influenced by process parameters such as holding pressure, storage speed, injection speed and cooling time [4].
However, in actual injection molding production, process parameter adjustments frequently lack systematic theoretical guidance or data-driven analysis, relying predominantly on operator experience [5]. There are differences in experience levels among workers, and even the same worker may produce inconsistent adjustment results at different times or under different conditions due to subjective judgment biases [6]. Consequently, maintaining consistent product quality within batches is challenging, resulting in dimensional deviations, appearance defects, unstable performance, and elevated defective product rates [7]. When new plastic materials, complex molds, or specialized requirements are encountered, experiential methods often fail to identify optimal parameter combinations. Extensive trial-and-adjustment iterations may be required, consuming significant time and resources to marginally satisfy quality standards. Even when achieved, the injection molding machine typically operates suboptimally, characterized by prolonged cycles, reduced efficiency, and excessive energy consumption [8]. Moreover, personal experience is often an intuitive understanding accumulated by workers over a long period of practice, which is difficult to describe and record with precise data and language. The transmission of such experience mainly depends on verbal communication and on-site demonstrations between mentors and apprentices, which is inefficient and prone to information loss or misunderstanding [9]. The departure of skilled personnel may necessitate extended training periods for new operators, potentially disrupting production or compromising quality. With the increasing demand for high-precision, high-efficiency, and energy-saving manufacturing, intelligent multi-objective optimization methods are urgently needed to minimize cycle times while ensuring quality compliance [10].
To address the pressing demand for intelligent multi-objective optimization highlighted above, metaheuristic algorithms such as particle swarm optimization (PSO) have been actively explored for automating process parameter tuning [11,12,13,14,15,16]. PSO is particularly attractive for engineering optimization due to its simplicity, rapid convergence, and competence in handling high-dimensional search spaces [17,18]. However, when applied to the multi-objective, constrained optimization of injection molding parameters, the standard PSO algorithm exhibits significant limitations that hinder its practical efficacy: (1) Premature convergence in complex search landscapes: The highly nonlinear and often multimodal nature of the injection molding parameter–property relationship renders standard PSO susceptible to premature convergence at local optima [19,20]. This tendency frequently yields suboptimal parameter sets that fail to achieve globally balanced solutions for critical objectives like product quality and cycle time. (2) Parameter sensitivity and convergence issues: The performance of PSO is critically dependent on the manual tuning of control parameters (e.g., inertia weight, acceleration coefficients) [21,22]. In the context of multi-objective injection molding optimization—where conflicting goals (e.g., minimizing cycle time vs. ensuring quality) must be reconciled—improper parameter selection often results in either sluggish convergence or entrapment in inferior solutions, undermining optimization efficiency and reliability. (3) Inadequate handling of process-specific constraints: Crucially, standard PSO lacks inherent mechanisms to rigorously enforce domain-specific constraints, such as stringent product quality specifications and process feasibility limits (e.g., maximum injection pressure) [23,24]. Solutions generated may thus violate critical production constraints, reducing their practical applicability and necessitating costly post-optimization verification or adjustment.
In this paper, an improved particle swarm optimization (IPSO) algorithm integrating dynamic inertia weight adjustment, and adaptive variation in acceleration coefficients was proposed to enhance global search capabilities while avoiding local optima in this paper. In addition, quality constraints have been incorporated to ensure that compliance with product qualification standards is maintained at every positional iteration. This integration ensures that predefined product quality requirements are strictly adhered to by each particle’s positional update throughout the optimization process. A qualitative analysis model based on support vector machine (SVM) is established to ensure the conformity of product quality, while a quantitative analysis model utilizing extreme gradient boosting (XGBoost) is constructed to calculate the injection molding cycle time as the fitness value.
Two primary contributions are made in this research to advance multi-objective optimization in injection molding. Firstly, the IPSO algorithm is proposed, integrating dynamic inertia weight adjustment and adaptive acceleration coefficients. Through this architecture, premature convergence is systematically mitigated, and global search capabilities are enhanced—addressing a critical limitation of standard PSO in complex, constrained problems. Secondly, a dual-model optimization framework is introduced: an SVM-based constraint validation mechanism is employed to ensure iterative quality compliance, while an XGBoost-derived fitness function is utilized to minimize cycle time. Collectively, this study provides a pragmatic yet efficacious resolution to the intricate challenge of injection molding parameter optimization. The proposed IPSO-based methodology markedly curtails cycle time while guaranteeing product quality conformance, thereby constituting a pivotal contribution to the enhancement of production efficiency and the reduction in manufacturing costs in injection molding.
2. Materials and Methods
2.1. Background and Related Work
2.1.1. The Injection Molding Process and Process Parameters
As described in Figure 1, the process of injection molding comprises six distinct steps.
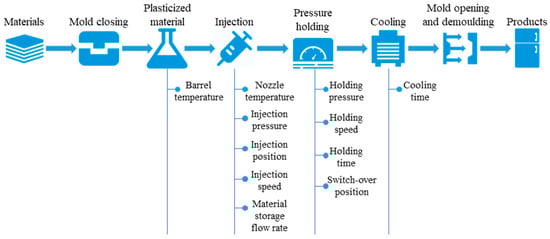
Figure 1.
The injection molding process and process parameters.
Step 1. Mold closing: The movable mold and the stationary mold of the injection mold are closed to form a sealed cavity, thereby preparing for the subsequent steps of plasticized material, injection, pressure holding, and cooling.
Step 2. Plasticized material: The plastic granules are conveyed into the hopper of the injection molding machine via an automatic feeding device and subsequently introduced into the screw heating zone. Through the combined actions of screw rotation and thermal heating, the plastic granules are progressively melted into a uniform melt. The process parameter primarily involved is the barrel temperature .
Step 3. Injection: The molten plastic melt is propelled by the screw and injected into the mold cavity at high pressure and an appropriate velocity. The process parameters primarily involved are the nozzle temperature , injection pressure , injection position , injection speed and material storage flow rate .
Step 4. Pressure holding: After the mold cavity is filled, the machine continues to apply a certain pressure to the melt. This is performed to prevent the formation of voids or dimensional deviations that may occur due to the shrinkage of the plastic during cooling, while also ensuring the smoothness of the product surface. The process parameters primarily involved are the holding pressure , holding speed , holding time and switch-over position .
Step 5. Cooling: The plastic gradually cools and solidifies within the mold cavity. The process parameter primarily involved is the cooling time .
Step 6. Mold opening and demoulding: Upon completion of the cooling process, the injection molding machine opens the mold, and the ejection mechanism pushes the molded part out of the mold cavity.
The majority of the aforementioned parameters are constituted by multiple set values, for example, the barrel temperature includes eight set values (), each corresponding to a different temperature control zone along the barrel. These aforementioned parameters are optimization targets for the injection molding process optimization model. In addition to these parameters, it is necessary to acquire data on environmental temperature, environmental humidity, injection machine identification number, mold number, which significantly influence the injection molding process. These parameters serve as inputs for both the qualitative classification model for injection molding quality and the quantitative regression model for injection molding cycle time, playing a crucial role in the optimization of injection molding process parameters.
Assume that is a vector of process parameters, where . Here, denotes the -th process parameter, and represents the number of process parameters to be optimized. Let denote the quality of injection molding, where signifies that the injection molding is qualified, while indicates that it is unqualified. The function is used to describe the injection molding cycle time. and represent the minimum and maximum values of the -th process parameter, respectively. Thus, the optimization problem can be formulated as the following constrained minimization problem as Equation (1):
Subject to Equation (2):
2.1.2. Particle Swarm Optimization
Particle Swarm Optimization (PSO) is a population-based stochastic optimization algorithm inspired by the collective behavior of biological populations, such as bird flocking or fish schooling. Proposed by Kennedy and Eberhart in 1995, PSO simulates the social dynamics of individuals (particles) collaborating to locate optimal solutions within a multidimensional search space. Each particle represents a potential solution to the optimization problem and adjusts its trajectory based on its own historical experience and the shared knowledge of the swarm.
In traditional PSO, the position and velocity of each particle are updated iteratively according to Equations (3) and (4):
where and denote the velocity and position of the -th particle at iteration , respectively; is the personal best position of the -th particle; represents the global best position found by the entire swarm; is the inertia weight controlling the influence of the previous velocity; and are acceleration coefficients balancing individual and social cognition; and are uniformly distributed random numbers in [0, 1].
The optimization process begins with random initialization of particle positions and velocities. During iterations, particles evaluate their fitness based on an objective function, update their personal best position and the global best position , and adjust their trajectories accordingly. The algorithm terminates when a predefined convergence criterion (e.g., maximum iterations or minimal fitness improvement) is met.
Traditional PSO is renowned for its simplicity, ease of implementation, and rapid convergence in unimodal problems. However, it faces challenges such as premature convergence in complex multimodal landscapes and sensitivity to parameter settings (e.g., ). These limitations motivate the development of improved variants, as discussed in subsequent sections.
2.1.3. Support Vector Machine
SVM is a robust supervised learning model that has been widely applied across various fields due to its excellent performance in handling high-dimensional data and its capability to deal with both linear and nonlinear relationships [25]. The fundamental concept of SVM is to identify the optimal hyperplane in the feature space that maximizes the margin between two classes. This is accomplished by solving a quadratic optimization problem subject to linear constraints. To address nonlinear data, SVM employs kernel functions to map the input data into a higher-dimensional space, thereby enabling linear separation. In this study, an SVM-based qualitative classification model is developed to evaluate the feasibility of injection molding process parameters, ensuring that only solutions meeting quality requirements are retained during optimization.
2.1.4. Extreme Gradient Boosting
XGBoost is a powerful ensemble learning method based on the gradient boosting framework, which has gained widespread attention due to its excellent performance in handling high-dimensional data and its ability to deal with complex relationships [26]. The XGBoost algorithm generates a sequence of weak learners (i.e., classification or regression trees) designed to constitute the final predictive model. Unlike algorithms that construct regression trees in parallel, the sequential approach of XGBoost follows an additive training strategy. First, it trains a single tree to generate an initial prediction. Subsequently, the model is refined by introducing additional trees based on the residuals obtained. Thus, the output of the XGBoost model is the aggregation of outputs from a series of trees. In this study, an XGBoost regression model was employed to quantitatively predict cycle time based on injection molding process parameters, thereby enabling precise fitness evaluation within the IPSO framework.
2.1.5. Kennard–Stone Method
The Kennard–Stone (KS) method is a classical algorithm for partitioning datasets into representative training and testing subsets, ensuring optimal coverage of the feature space [27]. Originally proposed for chemometric applications, it is widely adopted in scenarios requiring balanced sample selection, such as spectral analysis and process optimization [28]. In this study, the KS method is employed to divide historical injection molding process data into training and validation sets, enhancing the reliability of qualitative classification model of injection molding quality used in the IPSO framework. The algorithm procedure is as follows: (1) Compute the pairwise Euclidean distances between all samples in the feature space () according to Equation (5), where is the number of process parameters, and are sample numbers, respectively; (2) Identify the two samples with the maximum distance as the initial training set; (3) For each remaining sample, calculate its minimum distance to the already selected training set, select the sample with the maximum minimum distance and add it to the training set, repeat until the desired training size is achieved.
2.1.6. Sample Set Partitioning Based on Joint X–Y Distances
The sample set partitioning based on joint X–Y distances (SPXY) method extends the Kennard-Stone algorithm by incorporating both feature () and response () information [27]. This dual-criterion approach ensures that training samples are representative in both input and output spaces, making it particularly suitable for regression tasks in injection molding optimization. The algorithm procedure is as follows: (1) Scale and to [0, 1] to eliminate unit disparities; (2) Define a combined distance as Equation (6), where and are the Euclidean distance in -space and -space, respectively, is the number of samples; (3) Follow the KS iterative selection steps but replace with .
2.2. Proposed Methodology and Experimental Design
2.2.1. Improved Particle Swarm Optimization
To address the limitations of traditional PSO in handling complex multimodal optimization problems and avoiding premature convergence, some studies have been conducted. Kessentini et al. proposed a new PSO algorithm with adaptive inertia weight for global optimization, and these results showed that it is very competitive mainly when increasing the dimension of the search space [29]. Zhang et al. proposed a new inertia weight adjusting strategy based on the Bayesian techniques [30]. In this paper, an IPSO algorithm is proposed with dynamic adjustment of inertia weight and acceleration coefficients, as well as adaptive constraints on particle positions. These modifications aim to balance global exploration and local exploitation while ensuring stable convergence, and ensure that the optimized results are usable and will not cause damage to the injection molding equipment. Moreover, the proposed IPSO is distinguished by the integration of a dual-model architecture: a constraint validation mechanism based on SVM is enforced per iteration cycle to ensure stepwise quality compliance, while a fitness function derived by XGBoost is formulated to minimize cycle time as the optimization objective.
Due to the high cost of injection molding process optimization experiments, the available sample data are relatively limited. Additionally, complex nonlinear relationships exist between process parameters and both injection molding quality and cycle time. Therefore, the qualitative classification model for injection molding quality and the quantitative prediction model for injection molding cycle time are required to possess strong generalization capability with small samples, powerful nonlinear fitting ability, high accuracy, and a certain degree of interpretability. Based on the principle of structural risk minimization, SVM is recognized for its excellent generalization performance and strong resistance to overfitting under small-sample conditions. Through the use of kernel functions, high-dimensional nonlinear problems can be efficiently handled, and robustness against data noise is demonstrated. Therefore, SVM is considered highly suitable for the implementation of the qualitative classification model for injection molding quality. Through its Boosting mechanism and built-in regularization, XGBoost is designed to ensure high prediction accuracy and the capability to capture complex relationships. Meanwhile, the risk of overfitting is effectively controlled, and rapid prediction outputs are achieved. Therefore, XGBoost is considered highly suitable for the implementation of the quantitative prediction model for injection molding cycle time.
Adaptive Position Constraints
In traditional PSO, particles may diverge beyond physically meaningful boundaries during optimization, especially in high-dimensional parameter spaces. To mitigate this issue, dynamic constraints are imposed on particle positions based on historical search information. For the -th parameter, the position of the -th particle at iteration , , is bounded as Equation (7):
where and represent the historical minimum and maximum values of the -th parameter, respectively. This constraint dynamically restricts particles within a 10% expansion range of historical extremes, a boundary empirically determined by experienced workers, which are designed to ensure the safety of the injection molding machine while maintaining a high rate of qualified injection molded products. It prevents excessive deviation while retaining flexibility for exploration.
Linearly Decreasing Inertia Weight
The inertia weight significantly influences the trade-off between global exploration and local exploitation. Unlike the fixed in traditional PSO, a linear reduction strategy is adopted as Equation (8):
where and denote the initial and final inertia weights, is the current iteration, and is the maximum number of iterations. Initially, a larger promotes global search, while the gradual decrease to enhances local refinement in later stages.
Adaptive Acceleration Coefficients
The acceleration coefficients (individual cognition) and (social cognition) are dynamically adjusted to regulate the influence of personal and global best positions. The proposed strategy employs time-dependent linear adaptation as Equations (9) and (10):
Here, increases linearly from to , emphasizing individual experience in early iterations, while decreases from to , prioritizing swarm collaboration as the search progresses. This asymmetric adjustment ensures a smooth transition from diversified exploration to intensified exploitation.
Optimization Workflow
The procedure of the IPSO algorithm is shown in Figure 2.
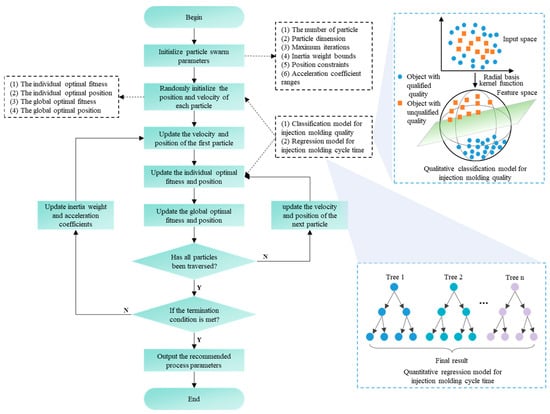
Figure 2.
The procedure of the IPSO algorithm.
Step 1: Initialize swarm parameters, including the number of particles , maximum iterations , inertia weight bounds (, ), acceleration coefficient ranges (, , , ) and position constraints.
Step 2: Randomly assign initial positions and velocities to each particle within the constrained search space by Equation (7). Subsequently, assess the quality of each particle through a qualitative classification model for injection molding quality to determine whether it meets the qualification criteria. Reinitialized particles that fail to meet the quality standards until all particles are deemed qualified. Subsequently, calculate the cycle time for each particle using a quantitative prediction model for injection molding cycle time, and this cycle time is utilized as the fitness value. Then, initialize the individual optimal position, individual optimal fitness, global optimal position, and global optimal fitness.
Step 3: Update the velocity and position of the first particle using dynamically adjusted parameters as Equations (4) and (11):
where , and are calculated according to Equations (8)–(10).
Step 4: Calculate the current fitness of the particle using the quantitative prediction model of injection molding cycle time. Then, predict the quality of the particle using the qualitative classification model of injection molding quality. If the quality is qualified, compare the current fitness with the individual optimal fitness and update the individual optimal position and fitness.
Step 5: Compare the individual optimal fitness with the global optimal fitness and update the global optimal fitness and position.
Step 6: Determine whether all particles have been traversed: (1) If there are still particles that have not been traversed, update the velocity and position of the next particle in the swarm by Equations (4) and (11), then repeat steps 4 to 6; (2) If all particles have been traversed, proceed to step 9.
Step 7: Determine whether the termination condition is met, such as reaching the maximum number of iterations: (1) If the termination condition is not met, update inertia weight and acceleration coefficients by Equations (8)–(10), then repeat steps 3 to 9; (2) If the termination condition is met, output the process parameter values corresponding to the global optimal position as the recommended values.
Advantages of Improved Particle Swarm Optimization
The proposed improvements address traditional PSO’s sensitivity to parameter settings and tendency for premature convergence. By dynamically adjusting , and , the algorithm maintains a balance between exploration and exploitation. Additionally, adaptive position constraints prevent particles from straying into impractical regions, particularly critical in injection molding parameter optimization where parameters must adhere to physical machine limits.
2.2.2. Experimental Design and Data Acquisition
As depicted in Figure 3, the overall experimental procedure of this study is structured into three sequential stages: (1) orthogonal experimentation to acquire the dataset required for subsequent modeling; (2) development of a qualitative classification model for injection molding quality to impose constraints on both particle initialization and iterative optimization, and construction of a quantitative prediction model for injection molding cycle time to serve as the fitness function; and (3) on-site implementation of the proposed IPSO algorithm for the optimization of injection molding process parameters, thereby validating its practical efficacy.
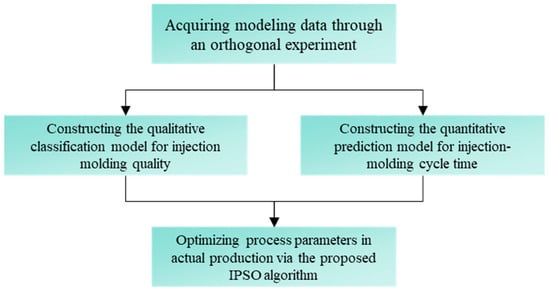
Figure 3.
The overall experimental procedure.
For data acquisition, an orthogonal experimental design approach was utilized, with the process detailed as follows: Five distinct injection molding machines utilized for manufacturing outer drums of rolling drum washing machines were selected from the Haier Group’s manufacturing facility in Hefei, Anhui Province. These machines were chosen as the focus of this study because they represent the typical models and production processes employed at the facility and necessitate optimization of process parameters during routine production operations. For each injection molding machine, three pieces of production data corresponding to qualified products were selected from the historical production records of the machine over a three-day period. The data encompassed the injection molding process parameters mentioned in Section 2.1, as well as the injection machine identification number, mold number, ambient temperature, and ambient humidity. For each injection molding process parameter, three levels (high level, central level, and low level) were established, specifically, the central level was set as the corresponding parameter value from each piece of production data, the high level was set at 110% of the corresponding parameter value, and the low level was set at 90% of the corresponding parameter value. Using Minitab software (version 22.1.0, Minitab LLC, State College, PA, USA), Taguchi’s parameter design method and orthogonal arrays, 27 experimental combinations were arranged. As a result, for each injection molding machine, a total of 81 experimental combinations were generated.
For each injection molding machine, the molds utilized in the historical production data, in conjunction with the process parameters specified in each experimental combination, were employed to conduct the injection molding process. The following parameters were meticulously recorded: process parameters, injection machine identification number, ambient temperature, ambient humidity, mold number, injection cycle time, and product quality.
2.2.3. Evaluation
To comprehensively evaluate the performance of the proposed optimization method, both qualitative and quantitative metrics were employed for the injection molding quality classification model and cycle time prediction model, respectively.
For the qualitative classification model of injection molding quality, the evaluation was conducted using four widely recognized metrics in machine learning: Accuracy, Precision, Recall, and F1-score. Accuracy quantifies the overall correctness of the classification model by calculating the ratio of correctly predicted samples (both qualified and unqualified) to the total samples. Precision reflects the model’s ability to avoid false positives, defined as the proportion of correctly predicted qualified samples among all samples classified as qualified. Recall measures the model’s capability to identify true positives, representing the ratio of correctly predicted qualified samples to the actual qualified samples. F1-score harmonizes Precision and Recall, providing a balanced evaluation of the model’s robustness. These metrics were calculated using a confusion matrix derived from the test dataset. The computational formulas have already been described in Reference [31].
For the quantitative prediction model of injection molding cycle time, the evaluation focused on coefficient of determination (R2) and root mean square error (RMSE). R2 evaluates the proportion of variance in cycle time explained by the model, where a value closer to 1 indicates stronger predictive performance. RMSE quantifies the average deviation between predicted and actual cycle time values, with lower values signifying higher prediction accuracy.
3. Results and Discussion
3.1. Qualitative Classification of Injection Quality
The qualitative classification model for injection molding quality plays a crucial role in the IPSO algorithm, as it ensures that only solutions meeting the specified quality requirements are retained during the optimization process. A detailed description is provided in this section regarding the construction results of the qualitative classification model of injection quality based on SVM.
3.1.1. Sample Set Partitioning
Through the implementation of the experiments in Section 2.2, a total of 405 pieces of data were obtained, with each type of injection molding machine yielding 81 pieces of data. Subsequently, 25 pieces of data corresponding to qualified product quality and 25 pieces of data corresponding to unqualified product quality were randomly selected from the data of each type of injection molding machine. In total, 250 pieces of data were thus obtained for the construction of the injection molding quality qualitative classification model. Balancing the number of positive and negative samples enables the model to focus more evenly on the features of both classes during the training process.
For each type of injection molding machine, the Kennard-Stone method was employed to select 20 pieces of data from both the qualified and unqualified quality samples, respectively, for the establishment of the qualitative classification model. The remaining samples were then used to evaluate the performance of the quantitative classification model. In this manner, the entire dataset was divided into a training set and a prediction set in a ratio of 4:1. Specifically, the training set comprised 200 pieces of data, while the prediction set included 50 pieces of data. Compared with the random selection method, this sample set partitioning approach ensures that the samples in the training set are uniformly distributed in the feature space. This uniformity allows the training set to more accurately represent the overall feature distribution of the entire dataset, thereby enhancing the generalization capability of the model. Moreover, the uniform distribution of samples in the training set exposes metrics the model to a more diverse range of data during the training process, which helps to mitigate the risk of overfitting.
3.1.2. Results of Model
An SVM-based model is designed to address the qualitative classification of injection molding quality. The model was trained using cross-validation and grid search, with a regularization parameter of 10 and a kernel parameter of 0.001 for the radial basis function (RBF) kernel.
The qualitative classification model for product quality was evaluated using a confusion matrix to analyze its performance in distinguishing between qualified and unqualified products. The confusion matrix obtained from the test dataset is presented as described in Figure 4. As delineated in Table 1, the model’s accuracy, precision, recall, and F1 score all attain a value of 0.92, as computed from the confusion matrix. These results suggest that the proposed model effectively captures the critical features influencing product quality in injection molding.
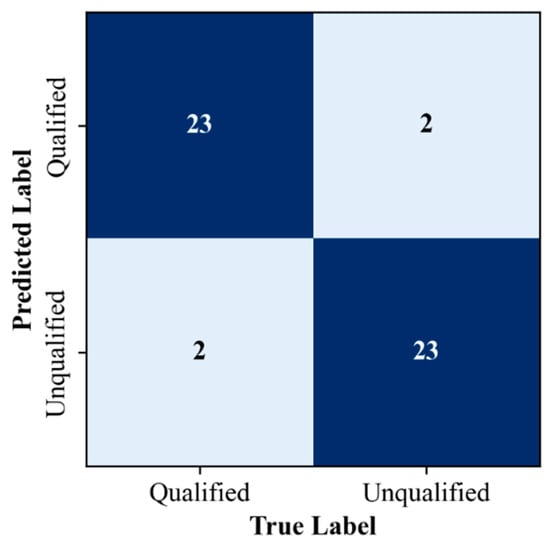
Figure 4.
The confusion matrix of qualitative classification model on prediction set.

Table 1.
The metrics of qualitative classification model on prediction set.
3.2. Quantitative Prediction of Cycle Time
3.2.1. Sample Set Partitioning
In the course of conducting the experiments detailed in Section 2.2, a comprehensive dataset comprising 405 pieces of data were successfully amassed. Specifically, each distinct type of injection molding machine contributed precisely 81 pieces of data to this aggregate dataset. For each type of injection molding machine, 50 pieces of data were randomly selected from the 81 available pieces of data, resulting in a dataset comprising 250 pieces of data. This dataset was specifically utilized for the construction of the quantitative prediction model for injection molding cycle time.
The SPXY method was utilized to partition the dataset for each type of injection molding machine, with 40 pieces of data being selected for the development of the quantitative prediction model. The residual samples were subsequently employed to assess the model’s performance. Consequently, the entire dataset was segmented into a training set and a prediction set, maintaining a ratio of 4:1. Specifically, the training set consisted of 200 pieces of data, whereas the prediction set contained 50 pieces of data.
3.2.2. Results of Model
A model based on XGBoost was constructed to quantitatively analyze the injection cycle time through injection molding process parameters. The model was trained using cross-validation and grid search, with the number of trees of 100, the maximum depth of each tree of 7, the learning rate of 0.01, the subsampling rate for instances of 0.7, the subsampling rate for features of 0.9, the minimum loss reduction threshold of 0, and the L2 regularization coefficient of 1.5.
As listed in Table 2, the model achieved an R2 value of 0.93, indicating that 93% of the variance in cycle time can be explained by the selected process parameters and their interactions. This high R2 value demonstrates the model’s strong alignment with the experimental data and its effectiveness in capturing the nonlinear relationships inherent in the injection molding process. The RMSE, a measure of prediction accuracy, was calculated as 1.05, reflecting the average deviation between the predicted and actual cycle times. This low error value suggests that the model provides precise and reliable estimates, which are critical for real-time process optimization. A visual comparison of predicted versus actual cycle time values, as illustrated in Figure 5, further corroborates the model’s performance. The data points are closely distributed along the diagonal line (y = x), with minimal outliers, indicating a high degree of consistency between predictions and experimental observations.
Table 2.
The metrics of quantitative prediction model.
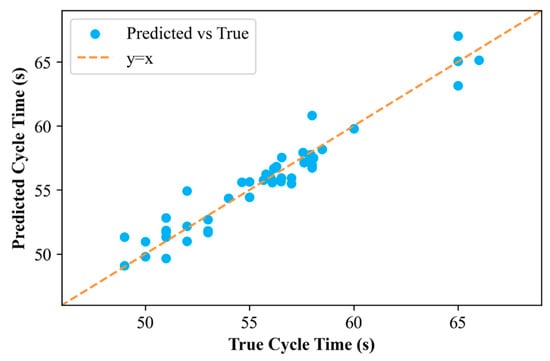
Figure 5.
The results of quantitative prediction model on prediction set.
3.3. Optimization of Injection Molding Process Parameters
In pursuit of the optimal combination of process parameters to ensure product quality while minimizing injection molding cycle time, the improved particle swarm optimization (IPSO) algorithm was employed for parameter optimization. The algorithm was configured with the following settings: the maximum inertia weight was set to 0.9, the minimum inertia weight to 0.1, the maximum individual acceleration factor to 2, the minimum individual acceleration factor to 1, the maximum social acceleration factor to 2, the minimum social acceleration factor to 1, and the maximum number of iterations was established at 100. To demonstrate the superiority of the IPSO algorithm, the standard PSO algorithm was also employed. In the standard PSO algorithm, the inertia weight was set to 0.7, while both the individual acceleration coefficient and the social acceleration coefficient were configured to 2.
The IPSO algorithm was empirically validated within the context of actual injection molding production processes. Operators were required to input the injection molding machine identification number, mold number, ambient temperature, and ambient humidity. Upon receiving this information, the program would generate a recommendation for the optimal combination of process parameters. The testing procedure was as follows: at the commencement of each production batch, the operator initially adjusted the process parameters based on their experience. Once stable and qualified product production was achieved, the current injection molding cycle time was recorded. Subsequently, the parameters were adjusted to the optimal combination recommended by the algorithm, and injection molding was performed again. The qualification of the product and the current injection molding cycle time were then documented. For each injection molding machine used in the modeling process, 20 experiments were conducted, yielding a total of 100 pieces of data. The mean fitness values for 50 independent runs for the IPSO and the standard PSO algorithms corresponding to the first data are presented in Figure 6. It is evident that the fitness value variation in the IPSO algorithm is more stable and gradual, with a significantly lower fitness value achieved upon completion of the iterations. In contrast, the standard PSO algorithm is observed to prematurely converge near a local optimum. Consistent trends are also observed in the other data. These results suggest that the IPSO algorithm demonstrates enhanced stability and global search capability during the optimization process, thereby enabling more effective identification of solutions that approach the global optimum. The product quality obtained based on the process parameters recommended by the algorithm is all qualified. Moreover, the comparison of injection molding cycle times for the 100 experiments is depicted in Figure 7. The blue and orange points in the figure correspond to the injection molding cycle times obtained using the process parameters before and after optimization by the proposed algorithm, respectively. It is evident that the optimization of process parameters via the proposed algorithm yields a significant improvement in injection molding cycle time. Calculations indicate an average reduction of 9.41% relative to the performance of operator-defined parameters, decreasing the mean cycle time from 55.30 s to 50.09 s. A paired t-test confirmed the statistical significance of this reduction (t (99) = 15.6539, p < 0.0001). Notably, the algorithm-optimized parameters substantially reduced process variability (SD = 2.39) compared to operator-defined parameters (SD = 4.23). The mean reduction of 5.20 s (95% CI [4.54, 5.86]) was further supported by an exceptionally low p-value (p ≈ 1.0 × 10⁻⁶ at α = 0.05) and a large t-statistic, underscoring the robustness of the improvement. In addition, statistical analysis via the two-sided Wilcoxon rank-sum test revealed a significant difference in cycle time distributions between the operator-defined and IPSO-optimized parameter sets (p < 0.0001, α = 0.05). Consequently, the null hypothesis asserting equal distributions is rejected, indicating that the IPSO algorithm yields a statistically significant reduction in injection molding cycle times relative to manual parameter adjustment.
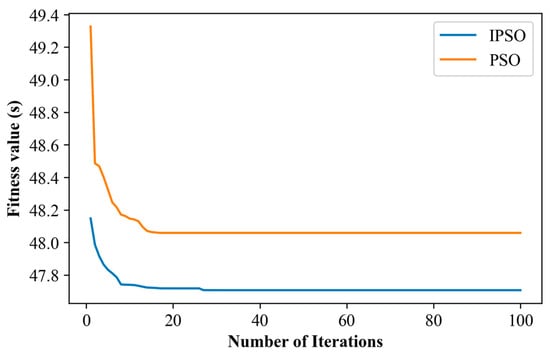
Figure 6.
The mean fitness values for 50 independent runs.
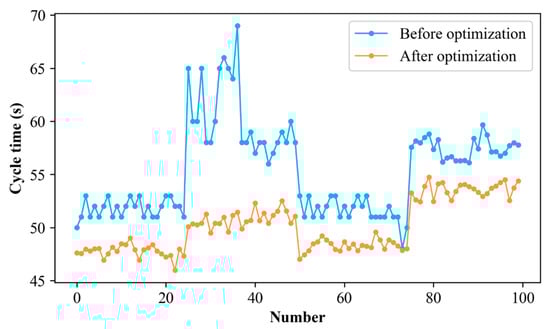
Figure 7.
Cycle time before and after optimization.
These results demonstrate that the improved particle swarm optimization (IPSO) algorithm proposed in this paper performs remarkably well in the optimization of process parameters. Through continuous iteration and optimization, it can efficiently search for more optimal combinations of process parameters. This enables various aspects of the injection molding process (such as injection speed, holding pressure, cooling time, etc.) to achieve more rational and efficient configurations while meeting the quality requirements of the products. Consequently, the cycle time is effectively reduced. The reduction in cycle time implies that more products can be manufactured within the same time frame. In a given working day, multiple additional production cycles can be added, thereby significantly enhancing production efficiency. The improvement in production efficiency leads to cost reduction. On one hand, the energy consumption per unit product is decreased due to the shortened operating time of the equipment. On the other hand, labor costs are also reduced, as the same workforce can produce a greater number of products within a unit of time.
Despite the satisfactory performance of the IPSO algorithm in optimizing injection molding process parameters, several limitations and practical constraints must be acknowledged when applying this method. The algorithm demands considerable computational resources to execute optimization tasks, and its runtime escalates markedly with an increasing number of parameters to be optimized. Additionally, the construction of the optimization model relies heavily on actual data from the injection molding process. However, acquiring high-quality and comprehensive data in real production settings is challenging. For example, certain injection molding machines may lack the capability to accurately measure key parameters, such as the temperature distribution within the mold, thereby compromising the accuracy of the optimization model. Theoretically, this approach is universally applicable to the optimization of injection molding process parameters, irrespective of machine model, mold design, or material type. However, in practical applications, it is essential to fine-tune the algorithm parameters in accordance with specific machines and production conditions to ensure optimal performance across diverse scenarios.
4. Conclusions
An improved particle swarm optimization (IPSO) algorithm was developed to optimize injection molding parameters, effectively balancing product quality and cycle time reduction. Limitations of traditional PSO were addressed by incorporating dynamic inertia weight, adaptive acceleration coefficients, and position constraints. This mitigated premature convergence and enhanced global search capabilities. A dual-model architecture was implemented, integrating: (a) an SVM-based constraint validation mechanism enforcing stepwise quality compliance through real-time classification (accuracy: 0.92), and (b) an XGBoost-derived fitness function optimizing cycle time prediction (R2: 0.93) as the computational objective. Experimental validation demonstrated a 9.41% reduction in cycle time without compromising product quality, leading to significant improvements in production efficiency and cost savings. The practical value of the IPSO-based framework in real-world manufacturing environments is highlighted by these outcomes.
Author Contributions
Z.Y.: writing—original draft, software, funding acquisition, visualization, validation. X.L.: writing—review and editing, methodology. L.W.: writing—review and editing, data curation. L.C.: resources, supervision. Y.W.: conceptualization, investigation, formal analysis. All authors have read and agreed to the published version of the manuscript.
Funding
The work was financially supported by National Natural Science Foundation of China (grant number 62303272), Shandong Provincial Natural Science Foundation (grant number ZR2022QF038), Postdoctoral Innovation Project of Shandong Province (grant numbers SDCX-ZG-202203036, SDCX-ZX-202400319), Taishan Industrial Experts Program (grant number tscx202306029) and Shandong Postdoctoral Science Foundation (grant numbers SDBX202302038, SDBX2023063).
Data Availability Statement
The original contributions presented in this study are included in the article. Further inquiries can be directed to the corresponding authors.
Conflicts of Interest
All authors were employed by COSMOPlat Institute of Industrial Intelligence (Qingdao) Co., Ltd. The authors declare that the research was conducted in the absence of any commercial or financial relationships that could be construed as a potential conflict of interest.
References
- Souza, A.F.d.; Howarth, J.L.L.; Arendarchuck, B.E.; Popiolek, A.M.; Treml Junior, C.A.; Kavilha, C. Alternative materials to shorten injection mold manufacturing and molding cycles. Polímeros 2024, 34, e20240023. [Google Scholar] [CrossRef]
- Knoll, J.; Heim, H.-P. Analysis of the Machine-Specific Behavior of Injection Molding Machines. Polymers 2024, 16, 54. [Google Scholar] [CrossRef]
- Wang, X.; Ma, Y.; Dang, K.; Zhao, B.; Chen, A.; Yang, W.; Xie, P. Fault diagnosis of injection molding machine non-return valve based on data-driven model. J. Manuf. Process. 2024, 117, 145–153. [Google Scholar] [CrossRef]
- Ying, Z.; Jiang, X.; Zhang, Y.; Li, S.; Shen, G.; Yang, J.; Zhou, H. Two-stage dynamic adjustment strategy for weight consistency improvement in injection molding process. Int. J. Adv. Manuf. Technol. 2024, 134, 1111–1125. [Google Scholar] [CrossRef]
- Tan, M.; Peng, S.; Huo, Y.; Li, M. Multi-Objective Optimization of Injection Molding Parameters for Manufacturing Thin-Walled Composite Connector Terminals. Materials 2024, 17, 3949. [Google Scholar] [CrossRef]
- Satoshi, K. Process parameters optimization in plastic injection molding using metamodel-based optimization: A comprehensive review. Int. J. Adv. Manuf. Technol. 2022, 121, 7117–7145. [Google Scholar] [CrossRef]
- Satadru, K.; Datta, D. Process parameter optimization of plastic injection molding: A review. Int. J. Plast. Technol. 2015, 19, 1–18. [Google Scholar] [CrossRef]
- Dang, X.-P. General frameworks for optimization of plastic injection molding process parameters. Simul. Model. Pract. Theory 2014, 41, 15–27. [Google Scholar] [CrossRef]
- Fernandes, C.; Pontes, A.J.; Viana, J.C. A Gaspar-Cunha, Modeling and Optimization of the Injection-Molding Process: A Review. Adv. Polym. Technol. 2018, 37, 429–449. [Google Scholar] [CrossRef]
- Cheng, F.-J.; Chang, C.-H.; Wen, C.-H.; Hwang, S.-J.; Peng, H.-S.; Chu, H.-Y. Out-of-Mold Sensor-Based Process Parameter Optimization and Adaptive Process Quality Control for Hot Runner Thin-Walled Injection-Molded Parts. Polymers 2024, 16, 1057. [Google Scholar] [CrossRef]
- Ma, X.; Liu, M.; Hou, Z.; Guo, M.; Yu, Z.; Tong, X.; Liu, H.; Guo, F. Optimization of process parameters for Trifolium pratense L. seed granulation coating using GA-BP neural network. Heliyon 2024, 10, e38003. [Google Scholar] [CrossRef] [PubMed]
- Liu, M.; Ma, X.; Feng, W.; Jing, H.; Shi, Q.; Wang, Y.; Huang, D.; Wang, J. Optimization of Operation Parameters and Performance Prediction of Paddy Field Grader Based on a GA-BP Neural Network. Agriculture 2024, 14, 1283. [Google Scholar] [CrossRef]
- Zhang, H.; Zhao, Z.; Wei, Y.; Liu, Y.; Wu, W. A Self-Tuning Variable Universe Fuzzy PID Control Framework with Hybrid BAS-PSO-SA Optimization for Unmanned Surface Vehicles. J. Mar. Sci. Eng. 2025, 13, 558. [Google Scholar] [CrossRef]
- Sun, Q.; Zhong, J.; Shi, P.; Xu, H.; Wang, Y. An improved reactive force field parameter optimization framework based on simulated annealing and particle swarm optimization algorithms. Comput. Mater. Sci. 2025, 251, 113776. [Google Scholar] [CrossRef]
- Birdal, R.G. Air pollution impact on forecasting electricity demand utilizing CNN-PSO hyper-parameter optimization. Environ. Res. Commun. 2024, 6, 055022. [Google Scholar] [CrossRef]
- Feng, T.; Deng, S.; Duan, Q.; Mao, Y. Application of Local Search Particle Swarm Optimization Based on the Beetle Antennae Search Algorithm in Parameter Optimization. Actuators 2024, 13, 270. [Google Scholar] [CrossRef]
- Liu, F.; Pang, J.; Xu, Z. Multi-Objective Optimization of Injection Molding Process Parameters for Moderately Thick Plane Lens Based on PSO-BPNN, OMOPSO, and TOPSIS. Processes 2024, 12, 36. [Google Scholar] [CrossRef]
- Wu, J.; Zhang, C.-H.; Cui, N.-X. PSO algorithm-based parameter optimization for HEV powertrain and its control strategy. Int. J. Automot. Technol. 2008, 9, 53–59. [Google Scholar] [CrossRef]
- Li, Z.; Wang, H.; Fei, L.; Peng, M.; Xian, Z.; Zhou, G. Multi-parameter optimization of NPP simulation models using enhanced particle swarm method. Prog. Nucl. Energy 2025, 184, 105671. [Google Scholar] [CrossRef]
- Huang, C.-L.; Dun, J.-F. A distributed PSO–SVM hybrid system with feature selection and parameter optimization. Appl. Soft Comput. 2008, 8, 1381–1391. [Google Scholar] [CrossRef]
- Zong, T.; Li, J.; Lu, G. Parameter estimation of multivariable Wiener nonlinear systems by the improved particle swarm optimization and coupling identification. Inf. Sci. 2024, 661, 120192. [Google Scholar] [CrossRef]
- Yusup, N.; Zain, A.M.; Hashim, Z.M.S. Overview of PSO for optimizing process parameters of machining. Procedia Eng. 2012, 29, 914–923. [Google Scholar] [CrossRef]
- Zheng, J.; Wang, X.; Huang, X.; Shi, Y.; Zhang, X.; Wang, Y.; Wang, D.; Wang, J.; Zhang, J. Adaptive control system of header for cabbage combine harvester based on IPSO-fuzzy PID controller. Comput. Electron. Agric. 2025, 232, 110044. [Google Scholar] [CrossRef]
- Marini, F.; Walczak, B. Particle swarm optimization (PSO). A tutorial. Chemom. Intell. Lab. Syst. 2015, 149, 153–165. [Google Scholar] [CrossRef]
- Zhang, G.; Ge, Y.; Pan, X.; Sadat Afsharzadeh, M.; Ghalandari, M. Optimization of energy consumption of a green building using PSO-SVM algorithm. Sustain. Energy Technol. Assess. 2022, 53, 102667. [Google Scholar] [CrossRef]
- Li, J.; Zhang, S.; Wang, X. Data-driven multi-objective optimization of road maintenance using XGBoost and NSGA-II. Autom. Constr. 2024, 168, 105750. [Google Scholar] [CrossRef]
- Yang, Z.; Xiao, H.; Zhang, L.; Feng, D.; Zhang, F.; Jiang, M.; Sui, Q.; Jia, L. Fast determination of oxide content in cement raw meal using NIR spectroscopy with the SPXY algorithm. Anal. Methods 2019, 11, 3936–3942. [Google Scholar] [CrossRef]
- Morais, C.L.M.; Santos, M.C.D.; Lima, K.M.G.; Martin, F.L. Improving data splitting for classification applications in spectrochemical analyses employing a random-mutation Kennard-Stone algorithm approach. Bioinformatics 2019, 35, 5257–5263. [Google Scholar] [CrossRef]
- Kessentini, S.; Barchiesi, D. Particle swarm optimization with adaptive inertia weight. Int. J. Mach. Learn. Comput. 2015, 5, 368. [Google Scholar] [CrossRef]
- Zhang, L.; Tang, Y.; Hua, C.; Guan, X. A new particle swarm optimization algorithm with adaptive inertia weight based on Bayesian techniques. Appl. Soft Comput. 2015, 28, 138–149. [Google Scholar] [CrossRef]
- Yang, Z.; Lu, X.; Chen, L. Discriminating the adulteration of varieties and misrepresentation of vintages of Pu’er tea based on Fourier transform near infrared diffuse reflectance spectroscopy. Front. Chem. 2025, 13, 1546702. [Google Scholar] [CrossRef] [PubMed]


Disclaimer/Publisher’s Note: The statements, opinions and data contained in all publications are solely those of the individual author(s) and contributor(s) and not of MDPI and/or the editor(s). MDPI and/or the editor(s) disclaim responsibility for any injury to people or property resulting from any ideas, methods, instructions or products referred to in the content. |
© 2025 by the authors. Licensee MDPI, Basel, Switzerland. This article is an open access article distributed under the terms and conditions of the Creative Commons Attribution (CC BY) license (https://creativecommons.org/licenses/by/4.0/).