Article

Numerical Simulation and Analysis of Performance of Switchable Film-Insulated Photovoltaic–Thermal–Passive Cooling Module for Different Design Parameters

1
School of Electric Power, South China University of Technology, Guangzhou 510640, China
2
Guangdong Province Key Laboratory of High Efficient and Clean Energy Utilization, South China University of Technology, Guangzhou 510640, China
3
Guangdong Province Engineering Research Center of High Efficient and Low Pollution Energy Conversion, Guangzhou 510640, China
4
Gokin Solar Co., Ltd., Office 1102, 58 Huajin Street, Hengqin, Zhuhai 519000, China
*
Author to whom correspondence should be addressed.
Processes 2025, 13(8), 2471; https://doi.org/10.3390/pr13082471
Submission received: 13 July 2025 / Revised: 30 July 2025 / Accepted: 31 July 2025 / Published: 5 August 2025
(This article belongs to the Special Issue Numerical Simulation of Flow and Heat Transfer Processes)

Abstract

Photovoltaic–thermal (PVT) technology has attracted considerable attention for its ability to significantly improve solar energy conversion efficiency by simultaneously providing electricity and heat during the day. PVT technology serves a purpose in condensers and subcoolers for passive cooling in refrigeration systems at night. In our previous work, we proposed a switchable film-insulated photovoltaic–thermal–passive cooling (PVT-PC) module to address the structural incompatibility between diurnal and nocturnal modes. However, the performance of the proposed module strongly depends on two key design parameters: the structural height and the vacuum level of the air cushion. In this study, a numerical model of the proposed module is developed to examine the impact of design and meteorological parameters on its all-day performance. The results show that diurnal performance remains stable across different structural heights, while nocturnal passive cooling power shows strong dependence on vacuum level and structural height, achieving up to 103.73 W/m2 at 10 mm height and 1500 Pa vacuum, which is comparable to unglazed PVT modules. Convective heat transfer enhancement, induced by changes in air cushion shape, is identified as the primary contributor to improved nocturnal cooling performance. Wind speed has minimal impact on electrical output but significantly enhances thermal efficiency and nocturnal convective cooling power, with a passive cooling power increase of up to 31.61%. In contrast, higher sky temperatures degrade nocturnal cooling performance due to diminished radiative exchange, despite improving diurnal thermal efficiency. These findings provide fundamental insights for optimizing the structural design and operational strategies of PVT-PC systems under varying environmental conditions.

1. Introduction

Environmental concerns, including intensified climate change and the increasing frequency of extreme weather events resulting from energy consumption, have prompted countries worldwide to accelerate the transition of their energy systems toward renewable sources. It is projected that, by 2050, non-fossil fuels will account for approximately 34% of global primary energy consumption [1], while it was revealed that China had already raised its share to 17.5% by 2023 [2]. Among various renewable options, solar energy has emerged as a highly abundant and cost-effective primary source, attracting significant attention from both academia and industry [3]. Photovoltaic (PV) technology enables the conversion of solar radiation into electricity. However, the maximum conversion efficiency of currently commercialized monocrystalline silicon cells remains limited to 24.9% [4], leaving a substantial portion of solar energy underutilized. Alternatively, photothermal (PT) technology utilizes solar radiation to supply domestic hot water or drive cooling systems integrated with low-temperature heat sources. Given the structural similarities and functional complementarity between PV and PT modules, the integration of both has led to the development of photovoltaic–thermal (PVT) technology. This type of technology helps to improve total energy output [5] while maintaining a compact and efficient system configuration [6].
In recent years, researchers have increasingly adopted computational fluid dynamics (CFD) to analyze performance improvements in PVT modules. These investigations have primarily concentrated on enhancing heat transfer efficiency and reducing thermal losses. Key strategies include employing working fluids with higher thermal conductivity [7], designing optimized heat exchange structures [8], and incorporating phase change materials (PCMs) [9]. Within the field of working fluid research, nanofluids have attracted considerable attention due to their superior thermal conductivity and improved heat transfer performance. Ali et al. [10] investigated the effects of Al2O3-Cu/water nanofluids at varying volume fractions and Reynolds numbers on the thermal performance of PVT modules equipped with single- and double-serpentine absorber channels. Within a volume fraction range of 0% to 1%, and as the Reynolds number increased from 500 to 2000, the convective heat transfer coefficient increased by 27% to 36% for single-serpentine channels and by 44% to 55% for double-serpentine channels. Awais et al. [11] examined the effects of both the volume concentration of Al2O3/water nanofluids and the cross-sectional geometry of serpentine tubes. In low-to-high-serpentine tube configurations, nanofluids with a 5% volume concentration achieved a 17.8% increase in the heat transfer coefficient compared with those with a 1% concentration. Kazemian et al. [12] compared the thermal and electrical performance of four different hybrid nanofluids in a PVT-PT series-integrated system. Among these, the multiwall carbon nanotube–silicon carbide hybrid nanofluid demonstrated the highest average overall energy efficiency of 70.40%, which exceeded that of the other nanofluids by 0.09% to 4.01%. In the context of optimizing heat exchange structures, efforts have been devoted to improving the channel configurations of absorber plates and the cross-sectional geometries of tubes. The two fundamental flow channel arrangements on the absorber plate are series and parallel, with other designs generally regarded as modifications of these basic types [3,13]. Zhang et al. [14] proposed a bifurcated tree-like channel and analyzed the impact of branch quantity on the thermal performance of PVT modules. Considering both pressure drops and energy losses, they identified that the optimal configuration involved two bifurcations. Kazem et al. [15] conducted a comparative analysis of PVT modules featuring spiral-type, parallel-type, and web-type flow channels. Overall, the spiral-type configuration achieved a 6.6% improvement in thermal efficiency compared with the parallel-type. Furthermore, the cross-sectional geometry of the flow channels significantly influences the heat exchange surface area, thereby directly impacting the thermal resistance between the PV panel and the working fluid. In a comparative study of PVT modules featuring circular, semi-circular, and square channels, the semi-circular configuration exhibited the best thermal performance [16]. In addition, PCMs absorb excess heat from PV panels, thereby lowering their operating temperature [17], and subsequently release the stored heat during the solidification process, which can be utilized for domestic hot water [18]. Ben Zohra et al. [19] integrated two types of PCMs on the rear side of PV panels, resulting in a 42.5% increase in electrical output compared with modules without PCMs. Al Arni et al. [20] developed a PVT module incorporating multi-layer nano-enhanced PCMs, where the melting temperature could be adjusted by modifying the nanoparticle volume concentration. Among the tested configurations, a three-layer structure with a graded nanoparticle distribution achieved the highest thermal efficiency of 68.2%.
PVT technology enables the simultaneous generation of electrical and thermal energy during daytime through rear-side heat exchange structures on PV panels but remains inactive during nighttime [21]. Passive cooling (PC) technology, which operates without an external power input, utilizes radiative heat exchange with the sky and convective heat transfer with the ambient atmosphere to achieve cooling. Under typical ambient conditions (~300 K), the maximum net cooling power attainable through radiative cooling is approximately 140 W/m2 [22], which is an order of magnitude lower than the intensity of solar radiation [23]. Therefore, integrating PVT technology with nocturnal PC in a PVT-PC module can enhance its all-day performance. At night, the PVT-PC module can utilize passive cooling either as a condenser, enabling the condensation of the working fluid [24], or as a subcooler, providing additional subcooling to the refrigerant before it enters the expansion device [25]. Zhang et al. proposed a solar-assisted heat pump system that incorporates a roll-bond PVT module functioning as a nocturnal passive condenser, and experimentally demonstrated its feasibility [26]. Subsequently, the channel configuration was optimized, leading to a 12.5% increase in the cooling capacity of the PVT module [6].
However, the PVT module faces significant structural compatibility challenges between its diurnal and nocturnal modes [27,28]. As shown in Figure 1, while the diurnal mode requires a glazed structure to minimize convective heat losses, the cover simultaneously impedes thermal exchange between the PV panel and the ambient atmosphere at night [29]. Additionally, the nocturnal cooling performance of the module depends on the spectral characteristics of both the cover and the emitting surface. In contrast, the nocturnal mode benefits from an uncovered structure, which reduces thermal resistance to the ambient atmosphere and enhances heat dissipation during the passive cooling process. However, this configuration significantly limits thermal energy gain during the day. Specifically, a covered module can produce up to 26% more energy during the day compared with an uncovered one [30], while an uncovered module can harness an additional 10 to 20% cooling energy at night through convective heat exchange [31]. In our previous studies [25,32], a compact photovoltaic–thermal–passive cooling (PVT-PC) module incorporating a switchable ethylene tetrafluoroethylene (ETFE) film insulation was proposed, and the performance was measured experimentally. This design enables transitions between glazed and unglazed structures by inflating or deflating the air cushion. However, the module’s performance is highly sensitive to the structural height of the air cushion and internal vacuum level. For example, increased structural height or reduced vacuum can decrease the contact area between the cover and the PV surface, thereby elevating thermal resistance and impairing nocturnal passive cooling power. Conversely, a taller structural height may improve diurnal thermal insulation, enhancing thermal energy collection. Moreover, cooling energy acquisition under varying meteorological conditions remains insufficiently understood. Therefore, a comprehensive investigation of these coupled effects is essential for optimizing the all-day performance of the PVT-PC module.
In this study, a numerical model of the switchable film-insulated PVT-PC module was developed and validated against previously reported experimental data [32]. The deformation behavior of the flexible cover was subsequently analyzed to characterize the geometry of the air cushion in the nocturnal unglazed structure. Thereafter, the impacts of key design parameters, such as the air cushion structural height and vacuum level, as well as critical meteorological variables, including wind speed and sky temperature, on module performance were investigated. The remainder of this article is structured as follows. Section 2 describes the operating principles and modeling methodology of the proposed module. Section 3 investigates the effects of key parameters on the module’s performance. Section 4 concludes the study by summarizing the principal findings.

2. Physical and Numerical Modeling

To simplify the numerical model, the development of the PVT-PC module is based on the following assumptions:
(1)
The boundary condition is considered static. The shape of the module’s air cushion, and the degree of fit between the flexible cover and the photovoltaic cells are primarily influenced by the internal and external pressure differences, while remaining largely insensitive to changes in sky temperature. The external pressure is equal to the ambient pressure, which is related to the ambient atmosphere. Given the good air tightness of the air cushion, the internal pressure can be considered constant. Therefore, the use of static boundary conditions yields simulation results with satisfactory accuracy.
(2)
The switching of the module’s operating mode is extremely rapid, typically completed within a few minutes. The impact of operational conditions, such as solar radiation and ambient temperature, are minimal. Therefore, the PVT-PC module can be regarded as operating under steady-state conditions [33].
(3)
There is no contact thermal resistance between all components [34].
(4)
The thermophysical properties of all solid materials are considered invariant with temperature [35].
(5)
The effects of dust accumulation and partial shading on the module surface are negligible [36].
(6)
All external surfaces of the module, except the top surface, are treated as adiabatic boundaries [35].
(7)
Solar radiation is incident perpendicularly on the top surface of the module and applied as a surface heat source [37].
(8)
The sky is idealized as an equivalent blackbody [38].

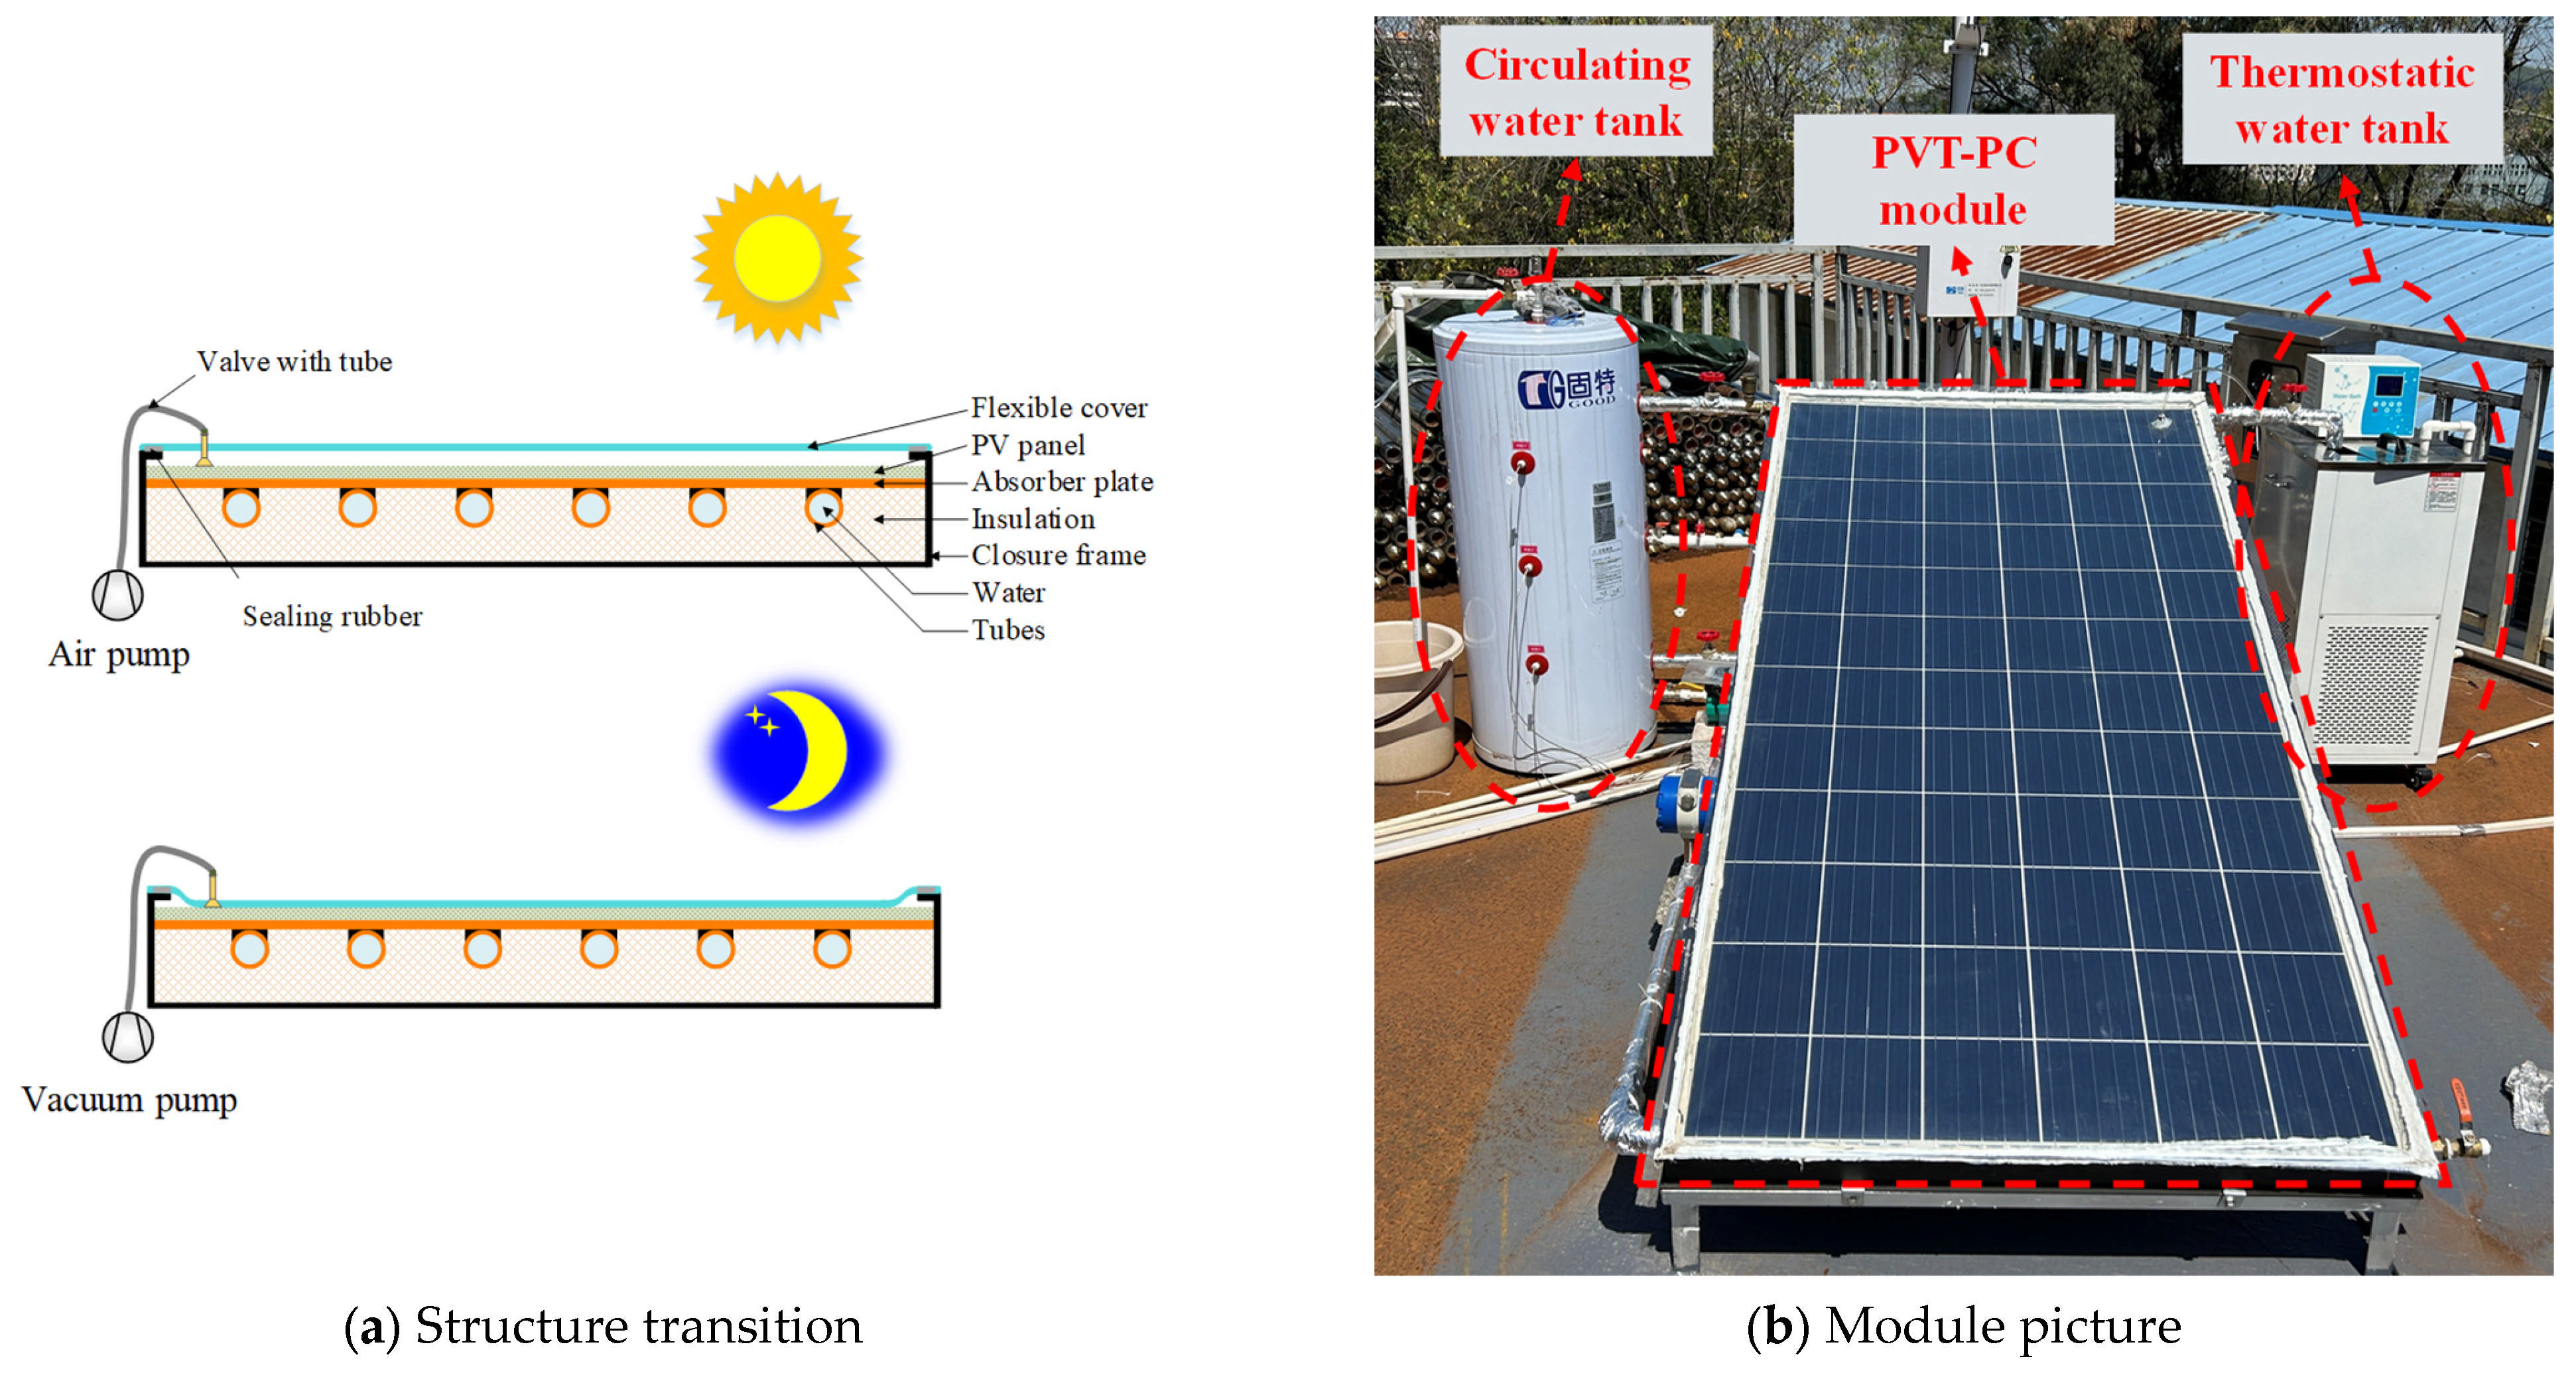
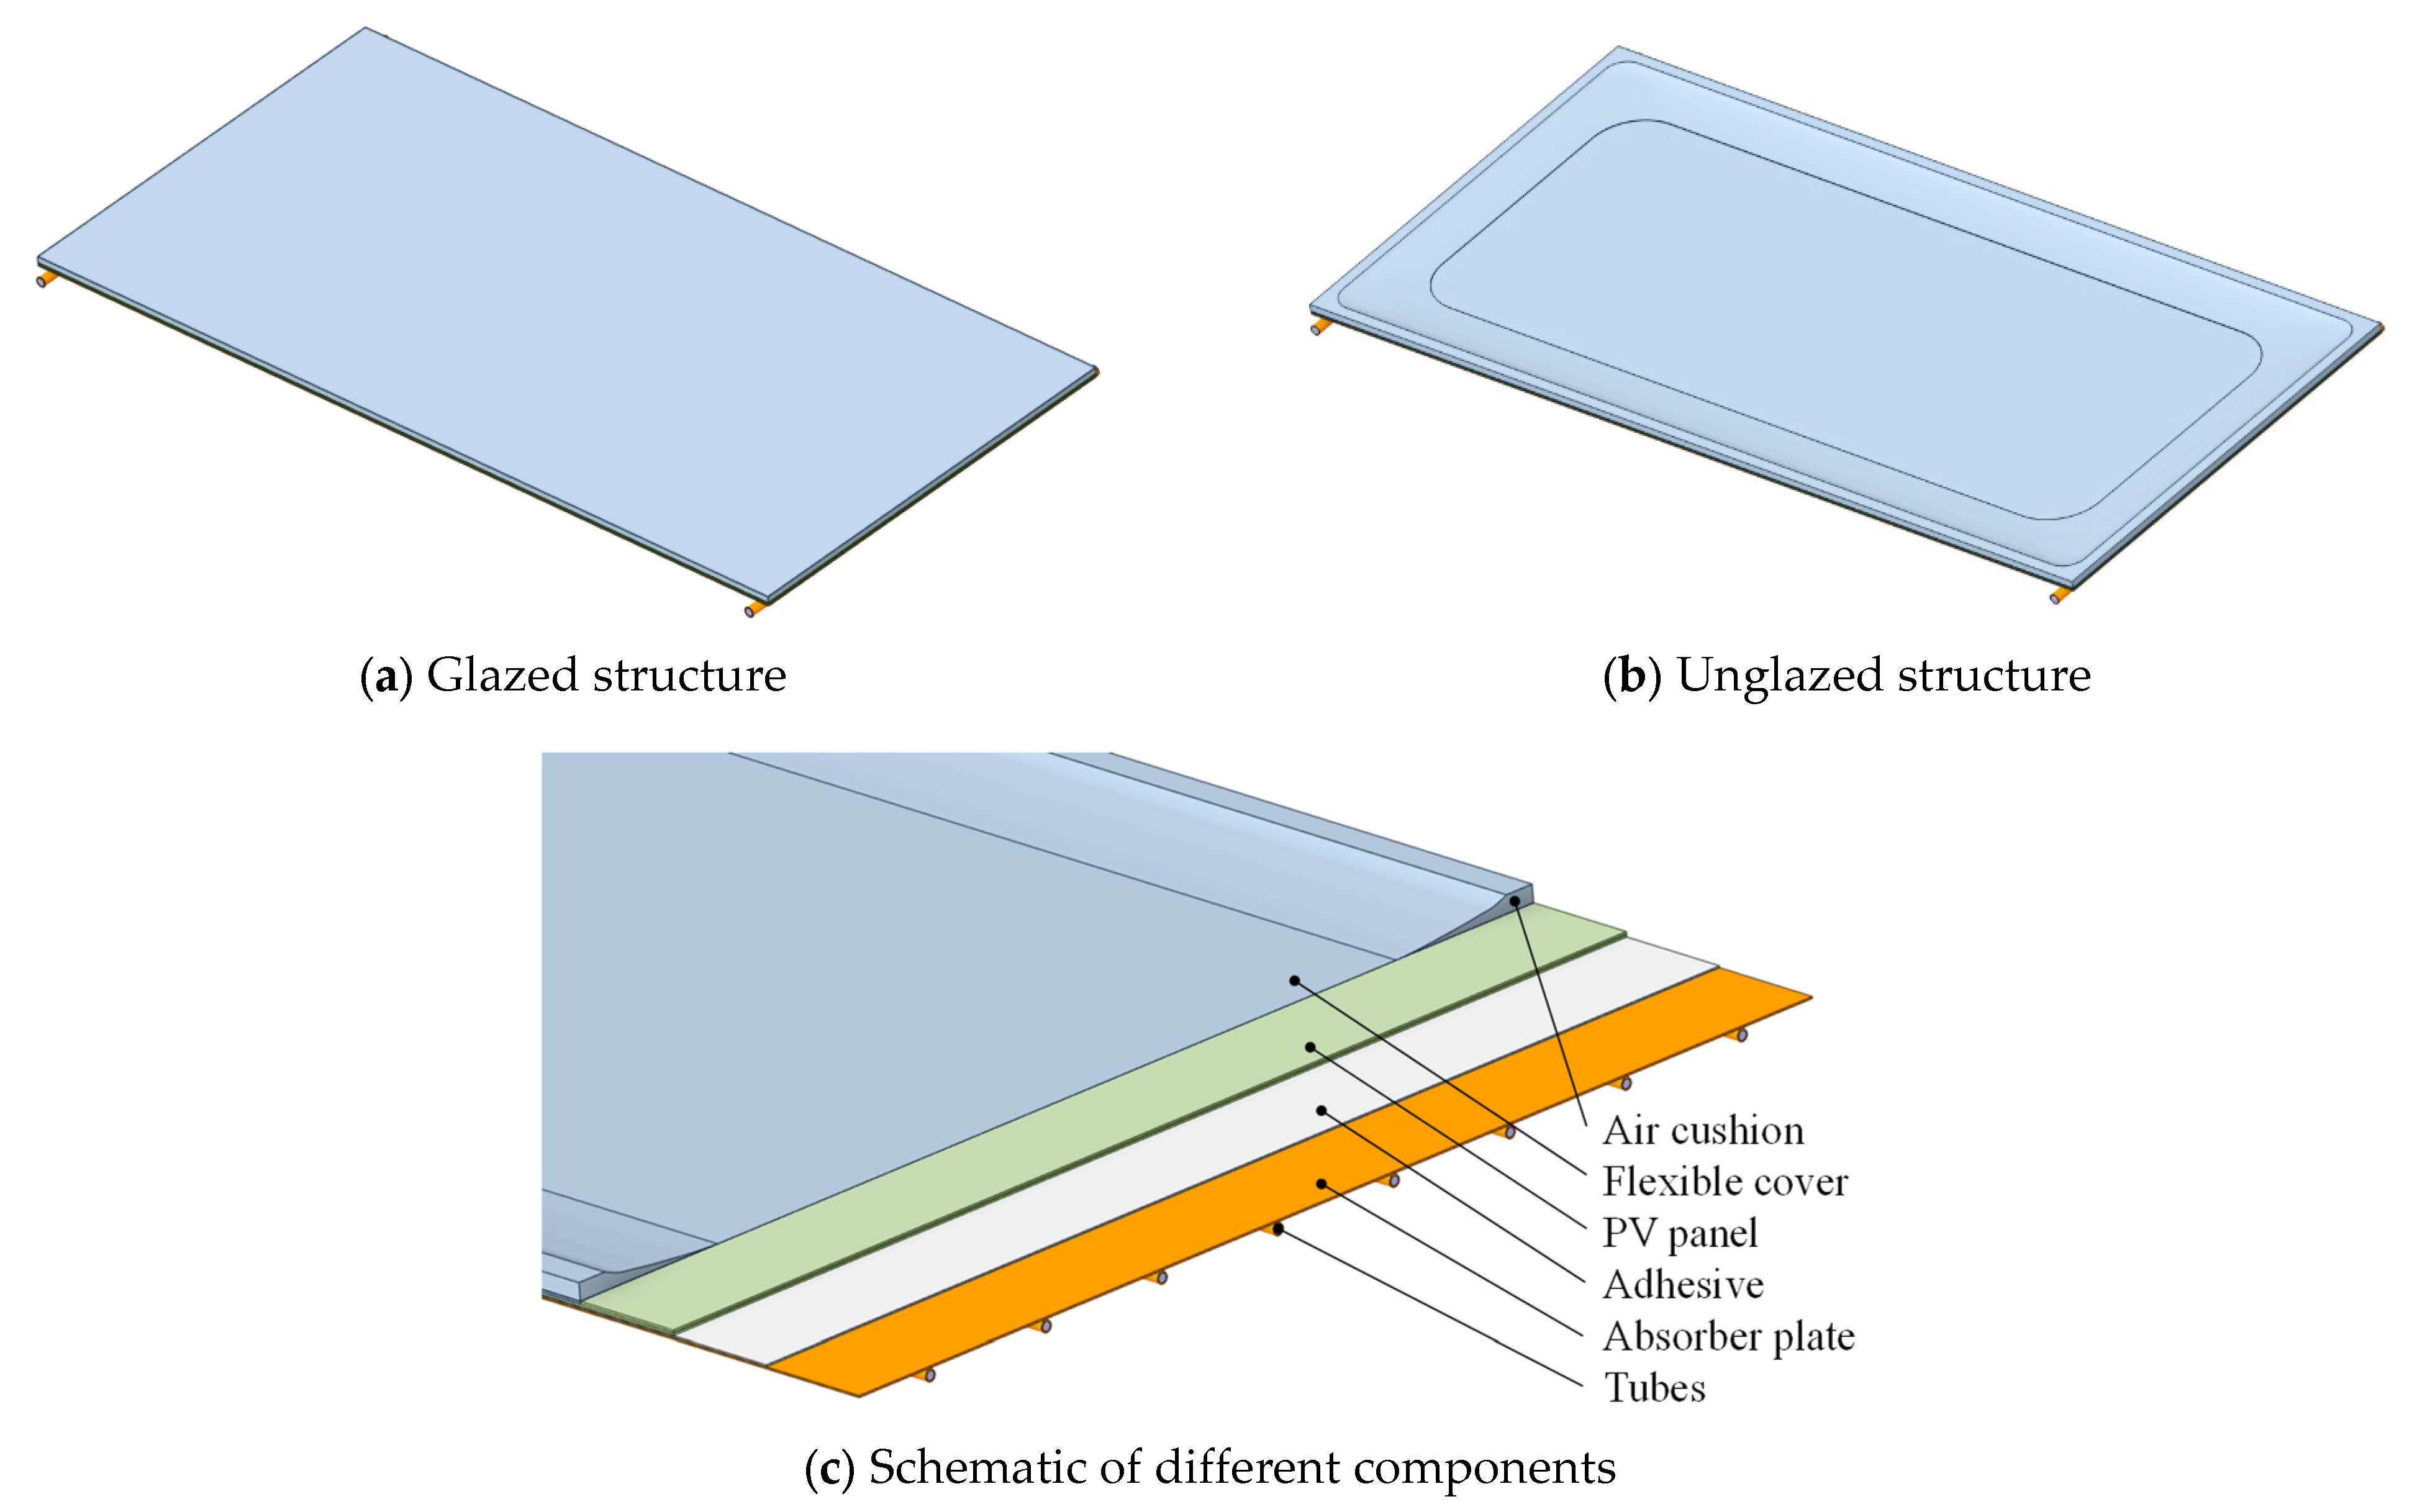
2.1. Physical Module

A schematic of the proposed module, along with a picture of it, is displayed in Figure 2. The physical model of the PVT-PC module is shown in Figure 3c, while the corresponding geometry and material properties of the module and PV panel are detailed in Table 1 and Table 2, respectively. The model comprises a flexible cover, an air cushion, a PV panel, an absorber plate, a tube, and a working fluid (water). The PV panel and the absorber plate are bonded together by an adhesive layer. The structural intricacies of the PV panel are neglected, and it is an idealized isotropic model. Its average thermophysical properties are calculated based on the weighted contributions of its constituent materials [37]. Instead of conventional glass, an ETFE film is used as the flexible cover. Once sealed with silicone, it forms an inflatable air cushion between the film and the PV panel. By inflating or deflating this air cushion, the module transitions between a glazed and unglazed structure, corresponding to diurnal and nocturnal modes, respectively. The operating principles of the module during daytime and nighttime are as follows:
The diurnal mode: As shown in Figure 3a, before activating the diurnal mode, the air pump inflates the cushion with air, transforming the module into a glazed structure. The resulting 15 mm thick air cushion reduces thermal losses and enhances the thermal output performance.
The nocturnal mode: As shown in Figure 3b, before initiating the nocturnal mode, the vacuum pump removes air from the cushion, causing the flexible cover plate to conform closely to the PV panel. This reduces thermal resistance between the module and the environment, thereby enhancing passive cooling performance at night.
Water is selected as the working fluid for the proposed module due to its high heat capacity. Considering the temperature dependence of the thermophysical properties of both air and water, the air is treated as an incompressible ideal gas, while water properties are calculated using empirical fitting expressions, as shown in Table 3.

2.2. Thermal Modeling

The heat transfer mechanisms of the proposed module during the diurnal and nocturnal modes are shown in Figure 4. In the diurnal mode, the PV cell converts part of the solar radiation transmitted through the flexible cover into electricity, while the leftovers are conducted into the working fluid. Simultaneously, the PV cell dissipates thermal energy to the environment through thermal radiation and convection. In the nocturnal mode, heat is gradually conducted from the working fluid to the PV panel, which then dissipates to the sky and the ambient atmosphere through thermal radiation and convection.
Equations (1)–(3) illustrate the conservation of continuity, momentum, and energy within the fluid domain. Continuity:
( ρ f V f ) = 0  
Momentum:
ρ f ( V f ) V f = p + ( μ V f ) + ρ f g
Energy:
( ρ f c p , f T f V f ) = ( λ f T f )
In the solid domain, where no internal motion occurs, only the energy conservation is considered.
λ s 2 ( T s ) γ e el + S = 0
where γ = 1 for the PV panel; γ = 0 for the other components.
Under daytime operating conditions, and in accordance with assumption (6), the incident solar radiation is applied to the PV cell layer as an equivalent heat source, Sτα.
S τ α = G τ film τ PV , glass α PV ξ δ PV
The electric power per unit volume, eel, of the PV cell is calculated as follows:
e el = S τ α η ref ( 1 β ref ( T PV T ref ) )

2.2.1. Boundary Conditions

The upper surface of the proposed module is influenced by both radiation and convection, including the emissive power from the surface to the sky, Erad, the atmospheric radiative power absorbed by the surface, Eatm, and the convective heat transfer power between the surface and the ambient environment, Pconv.
n λ T = E rad E atm P conv
The emissive power of the upper surface, Erad, is calculated as follows:
E rad = ε ¯ PV σ T PV 4
where ε ¯ PV denotes the effective emissivity of the PV panel surface and can be calculated as follows:
ε ¯ PV = 0 ε PV λ τ film λ E b λ , T PV d λ E b T PV
where ε PV λ denotes the emissivity of the PV panel, which is considered to be 0.9 [41]. τ film λ denotes the spectral transmittance of the ETFE film, as determined in the authors’ previous study [32]. E b λ , T PV and E b T PV refer to the spectral emissive power and total emissive power of a blackbody at the PV panel temperature, respectively.
The atmospheric radiation absorbed by the surface, Eatm, is calculated using Equation (10) [42]. Since atmospheric radiation primarily originates from several hundred meters above the ground and is concentrated in spectral bands where water vapor and carbon dioxide are strongly absorbed [43], the ambient temperature is commonly used to represent atmospheric radiation [44].
E atm = ε ¯ PV ε ¯ sky σ T a 4
The effective sky emissivity increases with rising atmospheric water vapor content [43] and is calculated as follows [38]:
ε ¯ sky = 0.711 + 0.56 t d 100 + 0.711 t d 100 2
The dew point temperature, Td, is calculated as follows [45]:
T d = 5319 5319 T a ln φ 100 273.15
Based on assumption (7), the sky temperature, Tsky, is introduced to represent the atmosphere as an equivalent blackbody.
T sky = ε ¯ sky 0.25 T a
After simplification, the atmospheric radiation absorbed by the upper surface, Eatm, can be expressed as
E atm = ε ¯ PV σ T sky 4
The convective heat transfer power between the upper surface and the environment, Pconv, is calculated as follows:
P conv = h T a T PV
where h is the convective heat transfer coefficient. In the diurnal mode, the flexible cover impedes part of the convective heat transfer. Thus, the convective heat transfer coefficient, h, can be determined as follows [46]:
h = 2.8 + 3 V wind
While in the nocturnal mode, the flexible cover remains in close contact with the PV panel, thereby reducing the thermal resistance of heat exchange between the panel and the surrounding environment. Under this condition, the convective heat transfer coefficient, h, is calculated as follows [46]:
h = 8.3 + 2.5 V wind
The remaining surfaces are assumed to follow adiabatic boundary conditions:
n λ T = 0

2.2.2. Performance Evaluation

In the authors’ previous study [32], several indicators were established to evaluate the performance of the proposed module. For the mechanism of acquiring cooling energy during nighttime, a simplified analysis was conducted following the method of Chow et al. [47]. The corresponding evaluation metrics are presented herein.
In the diurnal mode, the performance of the proposed module is evaluated based on the first law of thermodynamics. The electrical efficiency, η el , thermal efficiency, η th , and overall efficiency, η o , are defined as follows:
η el = e el A PV δ PV G A PVT
η th = m ˙ c w ( T out T in ) G A PVT
η o = η th + ξ η e η p
In the nocturnal mode, the passive cooling power is calculated as follows:
P cool = m ˙ c w ( T in T out ) A PVT
The passive cooling process of the proposed module consists of radiative and convective heat transfer, namely P cool = P rad + P conv . The radiative cooling power, Prad, and convective cooling power, Pconv, are calculated as follows:
P rad = h rad ( T PV T sky )
P conv = h conv ( T PV T a )
where hrad and hcond are the equivalent radiative heat transfer coefficient and the equivalent conductive heat transfer coefficient of the proposed module. The percentage of the radiative cooling power of the module is defined as follows:
η rad = P rad P cool

2.3. Numerical Solution

The governing equations are solved using Ansys Fluent 2023. The Realizable k-ε model is employed to solve the Navier–Stokes equations using a pressure-based solver with the Coupled scheme for pressure–velocity coupling. Both convective and diffusive terms are discretized using a second-order upwind scheme, while the pressure equation is discretized with a second-order scheme. The convergence criterion for the energy equation residual is set to 10−6, and those for the continuity and momentum equations are set to 10−5. The inlet boundary condition is defined as a mass flow inlet, while the outlet is defined as a pressure outlet. All fluid–solid interfaces are subjected to a no-slip condition, and interfaces between different component layers are treated as coupled boundary conditions.

2.4. Grid Independency

The physical model is imported into Fluent Meshing, where a polyhedral–hexahedral core mesh is used for numerical discretization. Under steady-state conditions with a solar irradiance of 1000 W/m2, an ambient temperature of 24.21 °C, an inlet temperature of 24.90 °C, and a working fluid mass flow rate of 0.015 kg/(s·m2), a mesh independence analysis is conducted by constructing meshes with varying densities to minimize discretization errors caused by differences in mesh quality. As shown in Table 4, the outlet temperatures for mesh densities of 2.41 million and 2.94 million elements are 34.296 °C and 34.327 °C, respectively, with a negligible difference of only 0.09%. Further increasing the mesh density yields minimal improvement in accuracy. Considering both computational cost and simulation accuracy, a mesh with 2.41 million elements is selected for the subsequent numerical simulations.

2.5. Validation

To further validate the effectiveness of the numerical model, quasi-steady-state experimental data from a previous study [32], obtained for the PVT-PC module with a glazed configuration during daytime and an unglazed configuration at night, were used for model verification. In actual experimental testing, the inlet temperatures of the module were regulated using a thermostatic water tank to maintain a specific difference from the ambient temperature. Once quasi-steady-state conditions were reached for each operating scenario, data from the final 2 min were recorded for performance analysis. Quasi-steady state was defined by maintaining temperature fluctuations after relaxation time within ±0.2–0.3 °C over approximately 10 min. The relative error between the simulated and experimental values is calculated using the following equation:
RE = X exp X sim X exp × 100 %
Table 5 and Table 6 present a comparison between the experimental and the simulated results of the PVT-PC module under quasi-steady-state conditions, using a glazed configuration during the day and an unglazed configuration at night. The relative error between the experimental and simulated outlet temperatures ranges from 0.09% to 1.25% during the day and from 0.09% to 0.62% at night, all within an acceptable range. These findings demonstrate that the established numerical model can accurately predict the thermal performance of the module under varying operating conditions.

3. Results and Discussion

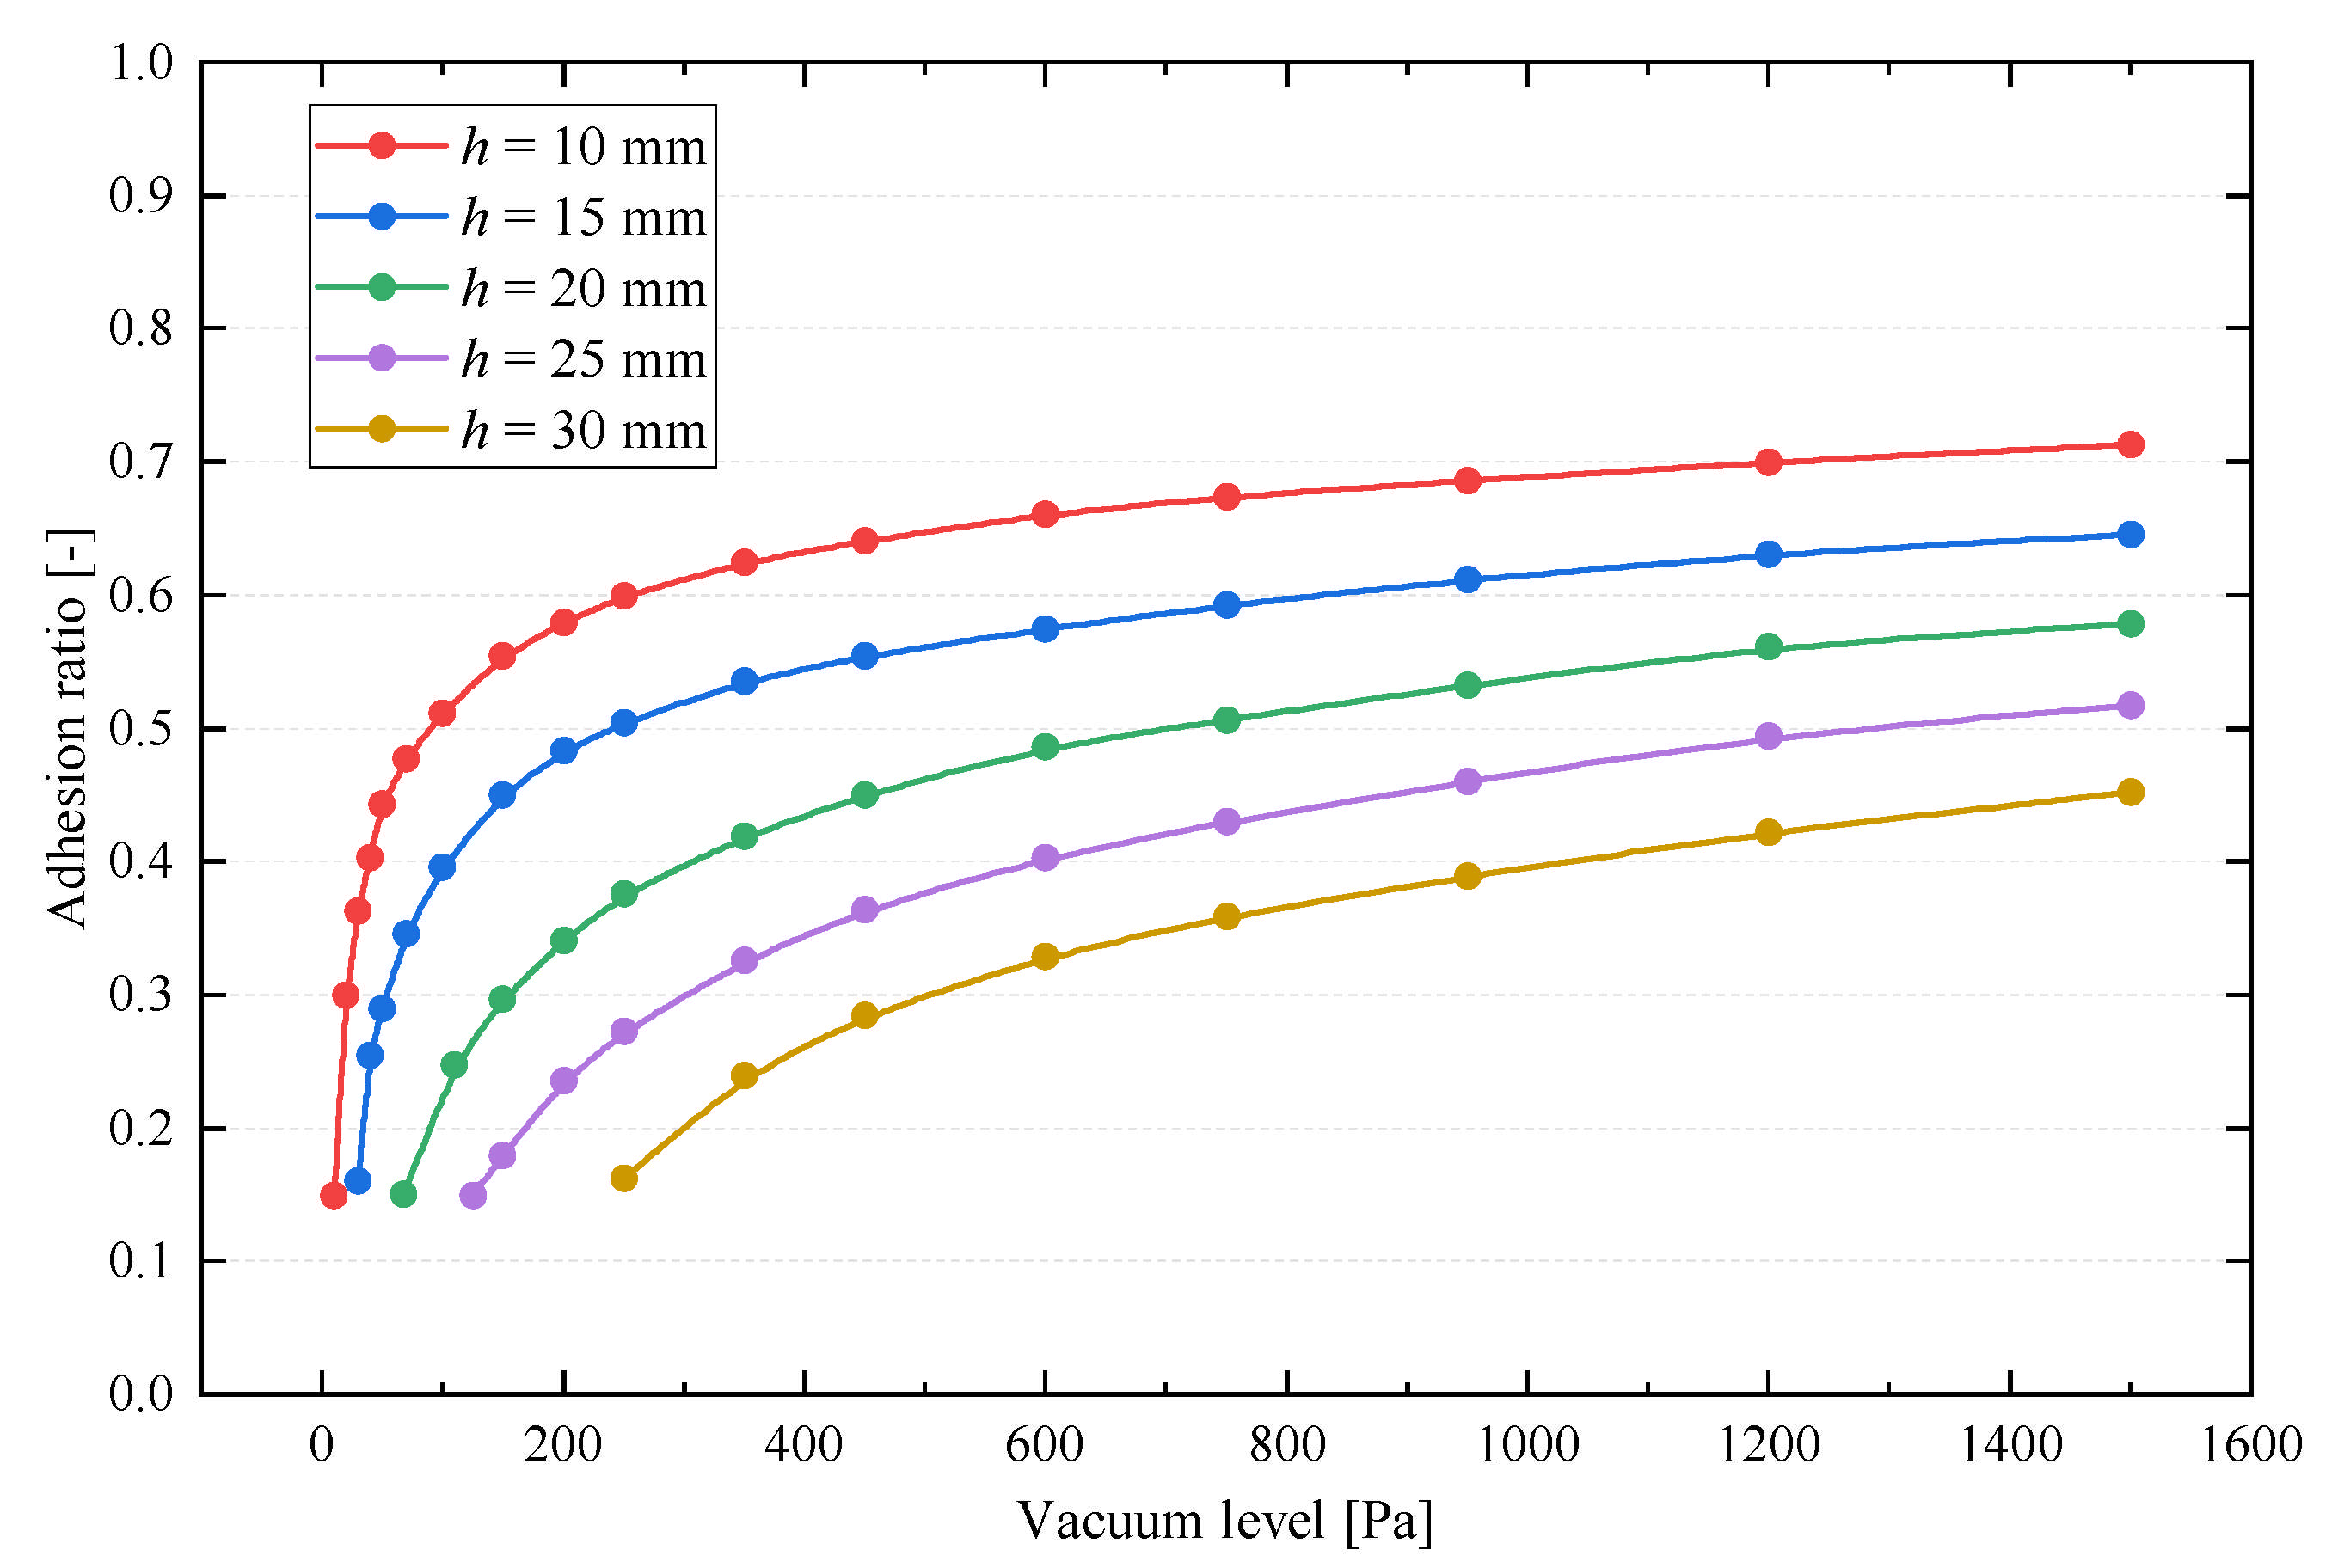
3.1. The Deformation Behavior of the Flexible Cover

The configuration of the air cushion directly affects the module’s performance and is closely related to the deformation behavior of the flexible cover. Therefore, this section presents the deformation behavior of the cover under various critical design parameters, such as the air cushion structural height, h, and the vacuum level, Pv, within the air cushion.
Figure 5 shows the deformation of the flexible cover under varying vacuum levels, with the structural height set at 15 mm. When the vacuum level is relatively low, the deformation of the flexible cover remains minimal. For instance, at a vacuum level of 20 Pa, the maximum deformation is only 13.1 mm. However, as the vacuum level increases, the flexible cover begins to conform the PV panel, forming an adhesion region with a rounded rectangular shape. When the deformation reaches its maximum value, which corresponds to the structural height of the air cushion, the flexible cover is in full contact with the surface of the PV panel, leaving no air gap between them in that region. As the vacuum level rises from 10 Pa to 300 Pa, the adhesion ratio between the cover and the PV panel increases progressively from 32.47% to 52.67%. The adhesion ratio is defined as the ratio of the area corresponding to the maximum deformation of the flexible cover to its total area.
Figure 6 illustrates the variation in the adhesion ratio under different structural height and vacuum levels. As the structural height of the air cushion increases, the adhesion ratio gradually decreases, while the vacuum required to initiate adhesion correspondingly increases. For example, when the structural height is 10 mm, a vacuum of only 10 Pa is sufficient to achieve adhesion. However, at a height of 30 mm, the required vacuum increases to 250 Pa. In addition, the adhesion ratio rises with increasing vacuum levels, exhibiting a pronounced marginal effect. It is attributed to the greater deformation required of the flexible cover at higher structural heights in order for it to conform to the PV panel. Meanwhile, excessive height limits the maximum attainable conform area between the two components. It is important to note that the upper limit of the adhesion ratio is determined not only by structural design parameters but also by the material properties of the flexible cover. Excessive vacuum levels may induce stresses that exceed the elastic limit of the material, leading to yielding and potential structural failure. Therefore, it is essential to analyze the stress distribution and structural safety of the flexible cover.
The Von Mises criterion reflects the distortion energy within a material subjected to complex stress states. Compared with the maximum shear stress (Tresca) criterion, the Von Mises criterion shows better agreement with experimental data under multiaxial stress conditions. Figure 7 illustrates the distribution of Von Mises equivalent stress at a vacuum level of 1500 Pa and a structural height of 15 mm. The equivalent stress in the flexible cover exhibits clear symmetry, with the lowest value of only 0.79 MPa occurring at the four corners. Stress levels are moderately elevated in the central adhesion region, while significant stress concentrations appear at the edges of the adhesion region. This is attributed to greater localized deformation in these regions, which, in turn, subjects the material to higher tensile forces. In regions of stress concentration, when stress approaches the material’s yield strength, localized plastic deformation or even structural failure may occur earlier than in other areas. From a structural safety perspective, the maximum stress observed at the corners of the adhesion region is the critical factor in determining the mechanical reliability of the flexible cover. Yin et al. [48] proposed a safety evaluation indicator for ETFE materials, where the safety factor is defined as the ratio of the material’s yield strength to the maximum stress of the flexible cover:
f s = σ s σ m
Table 7 presents the maximum stress and yield strength of the ETFE flexible cover and the corresponding safety factors under different structural heights and vacuum levels. As the structural height increases, the maximum stress on the ETFE flexible cover rises significantly from 5.57 MPa to 11.32 MPa, while the safety factor correspondingly decreases from 3.23 to 1.59. This reduction in the safety factor indicates a potential threat to the structural integrity of the cover. Consequently, in the following subsection, the maximum vacuum level is limited to 1500 Pa to reduce the risk of structural failure.

3.2. Effect of Critical Design Parameters

The structural height and vacuum level in the air cushion determine the ratio of adhesion between the flexible cover and the PV panel, thereby significantly influencing the performance of the module. This section investigates the combined effects of structural height and vacuum level on the overall performance of the PVT-PC module. Additionally, the base case of operating conditions for the PVT-PC module are presented in Table 8.

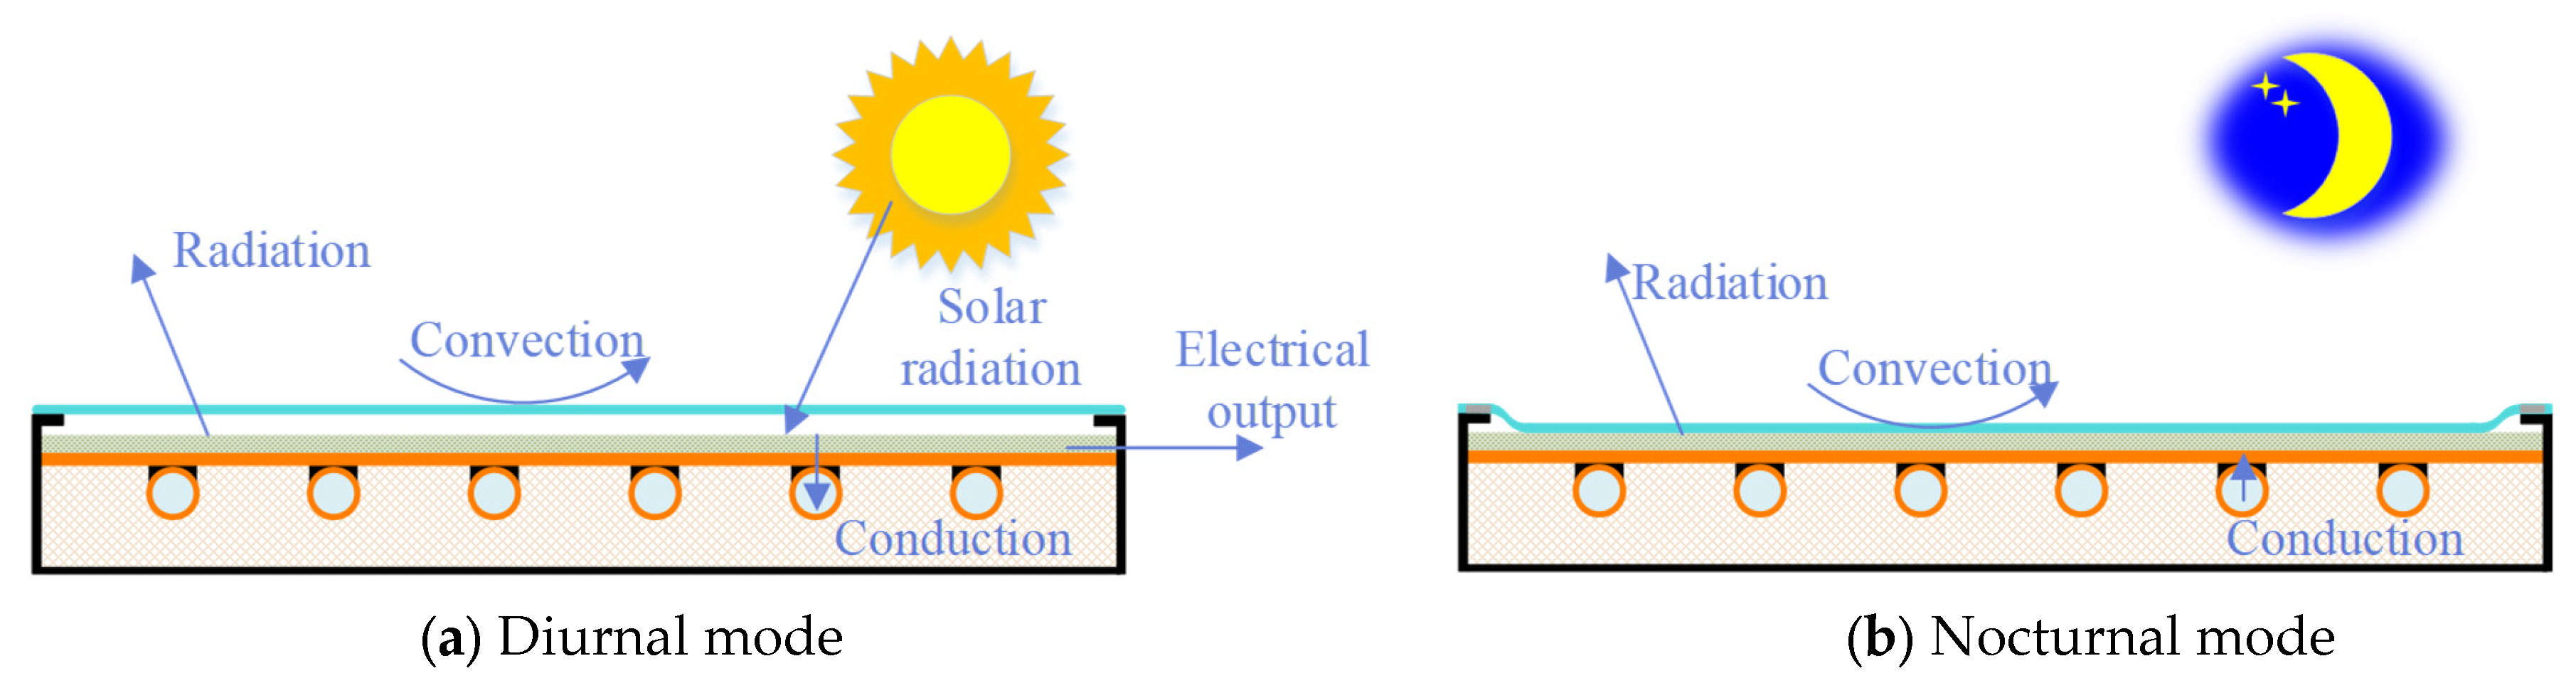
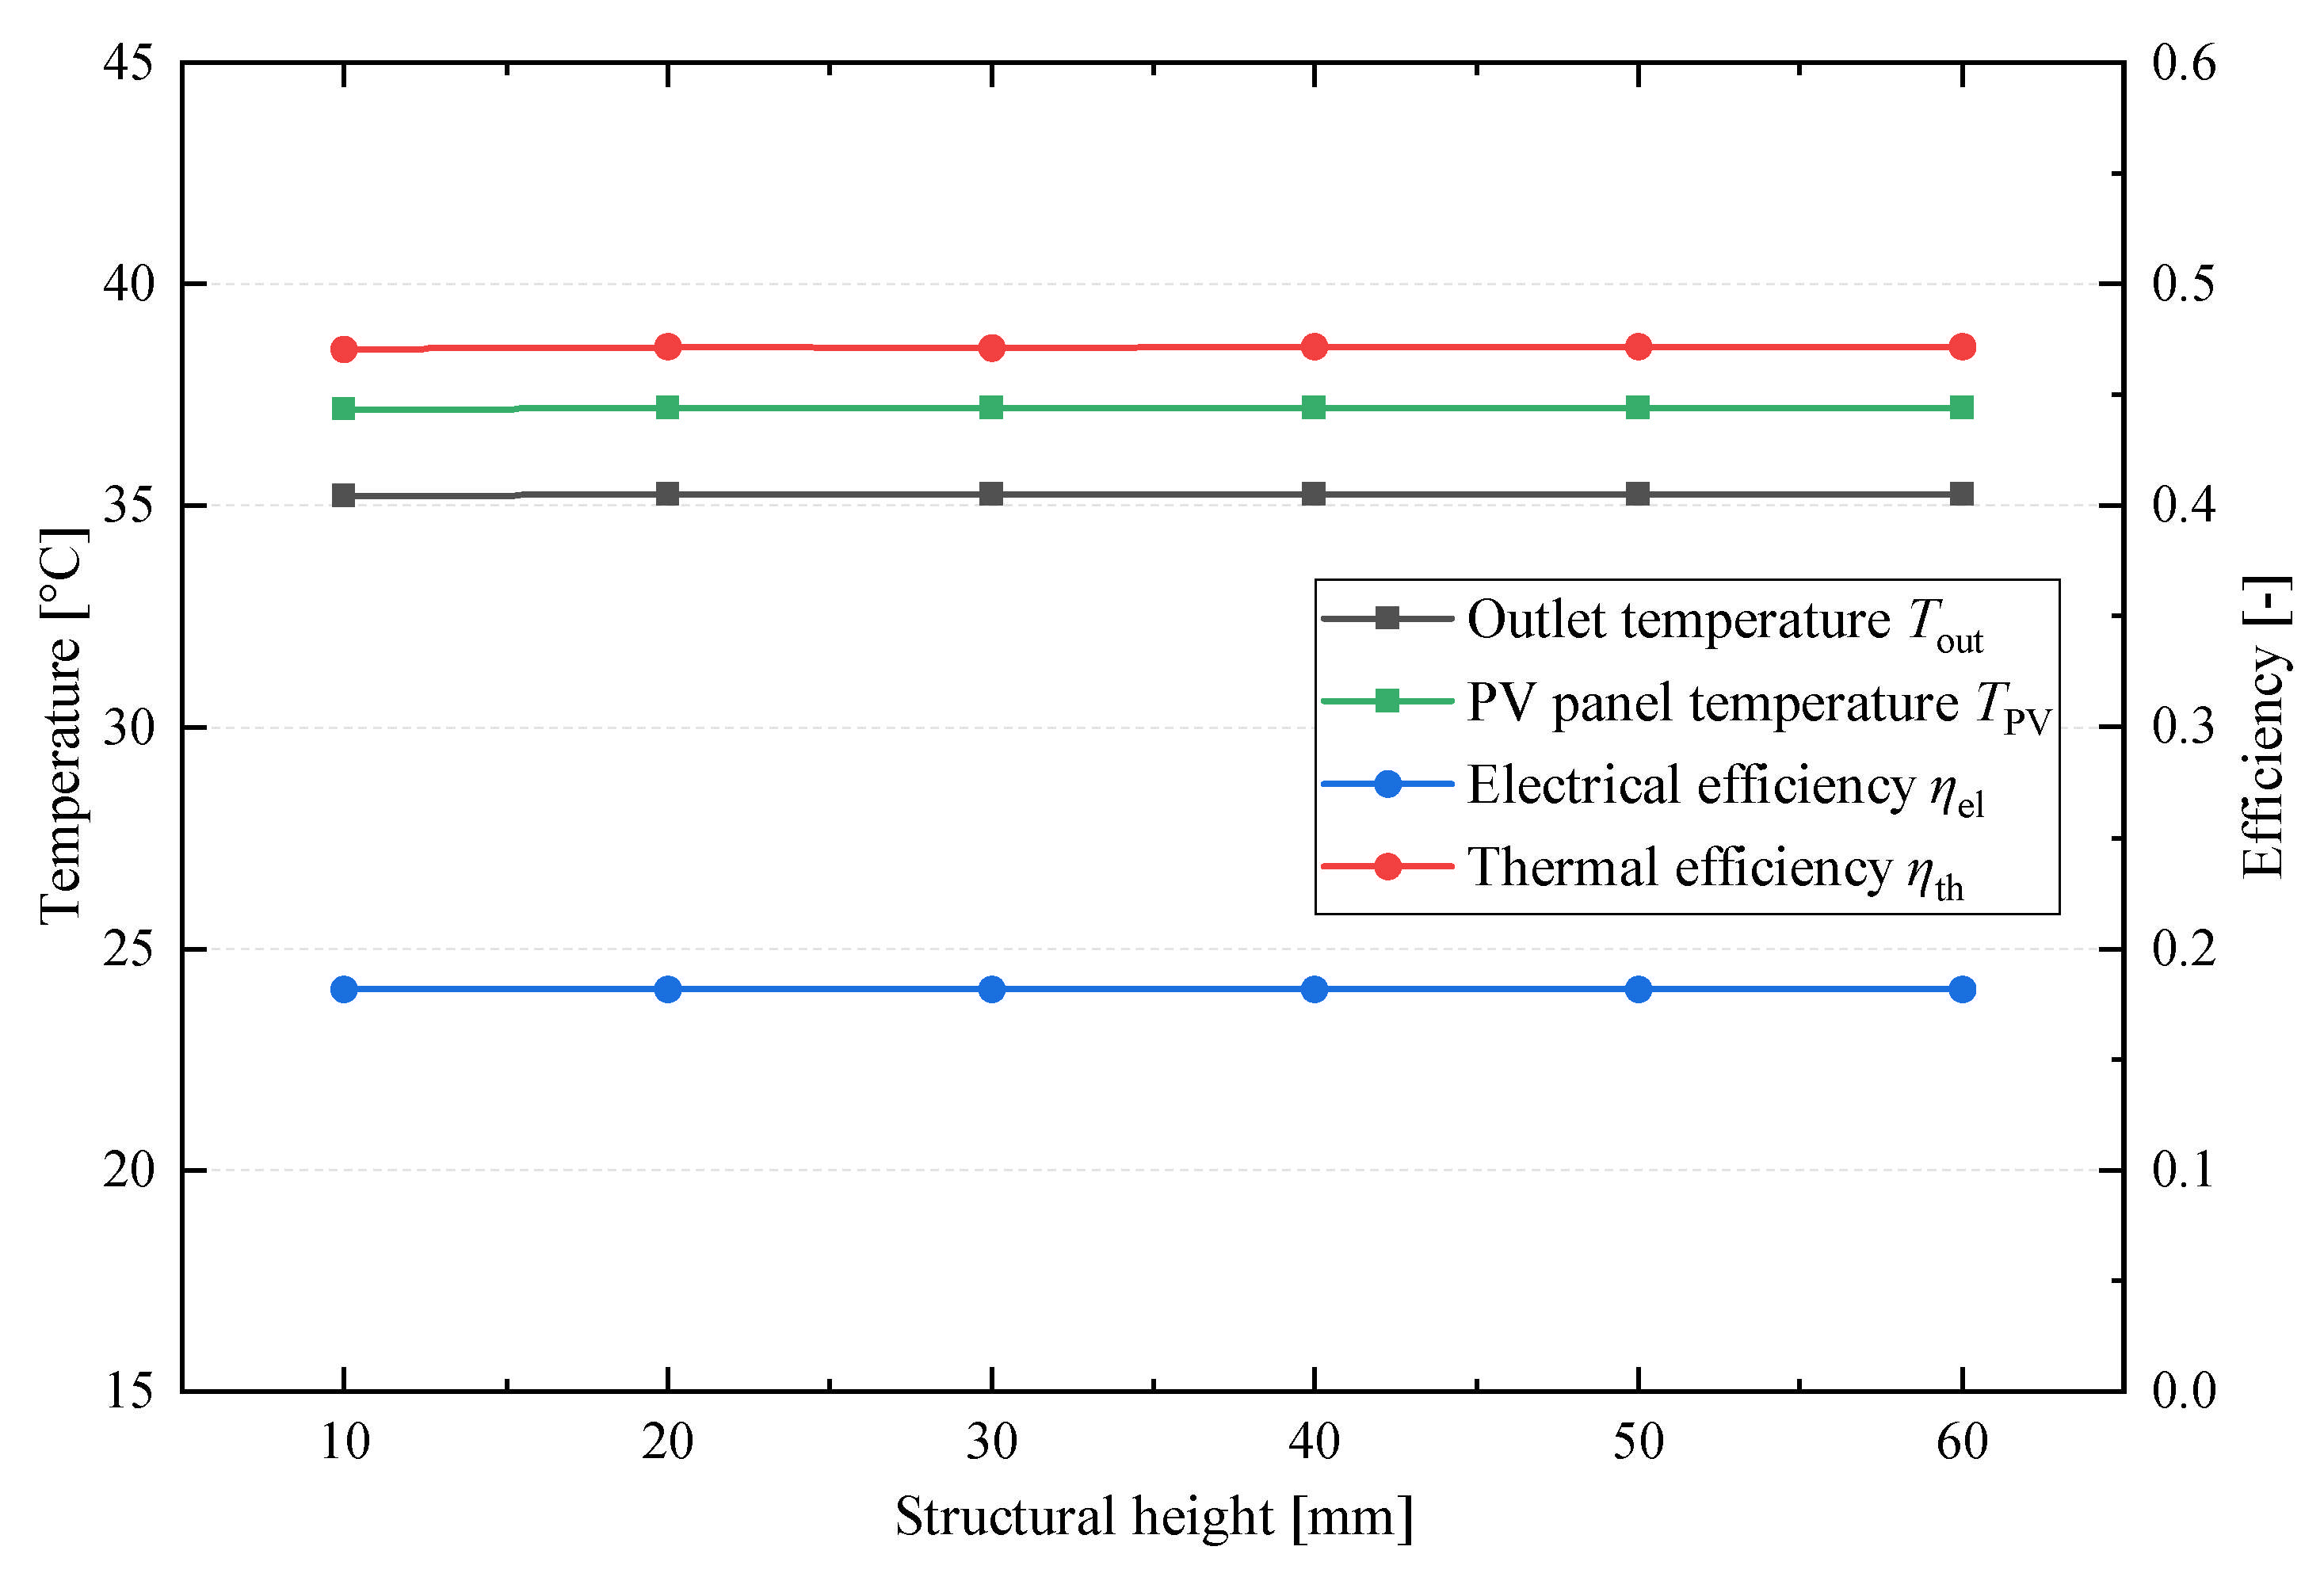
3.2.1. Effect of Structural Height on Diurnal Performance

Figure 8 illustrates the effect of structural height on the diurnal performance of the module. As the height increases from 10 mm to 60 mm, the outlet temperature and PV panel temperature show no significant variation, stabilizing at approximately 35.25 °C and 37.21 °C, respectively. Similarly, both the electrical and thermal efficiencies remain nearly constant at around 18.17% and 47.25%, respectively.
The thermal losses during the diurnal operation primarily result from convective and long-wave radiative heat losses. The air cushion effectively suppresses convective heat transfer between the environment and the PV panel surface, thereby reducing convective thermal losses. Although increasing the structural height enhances the convective strength of the internal air, the flow remains relatively slow, leading to a limited convective heat transfer effect. As shown in Figure 9, when the structural height increases from 10 mm to 60 mm, the maximum airflow velocity within the cushion reaches only 3.82 cm/s. Meanwhile, the module’s long-wave radiative heat loss is governed by the surface temperature of the PV cell and is independent of the structural height. In conclusion, the structural height of the air cushion exerts a minimal effect on the module’s diurnal performance, a finding consistent with the results reported in Ref. [50].

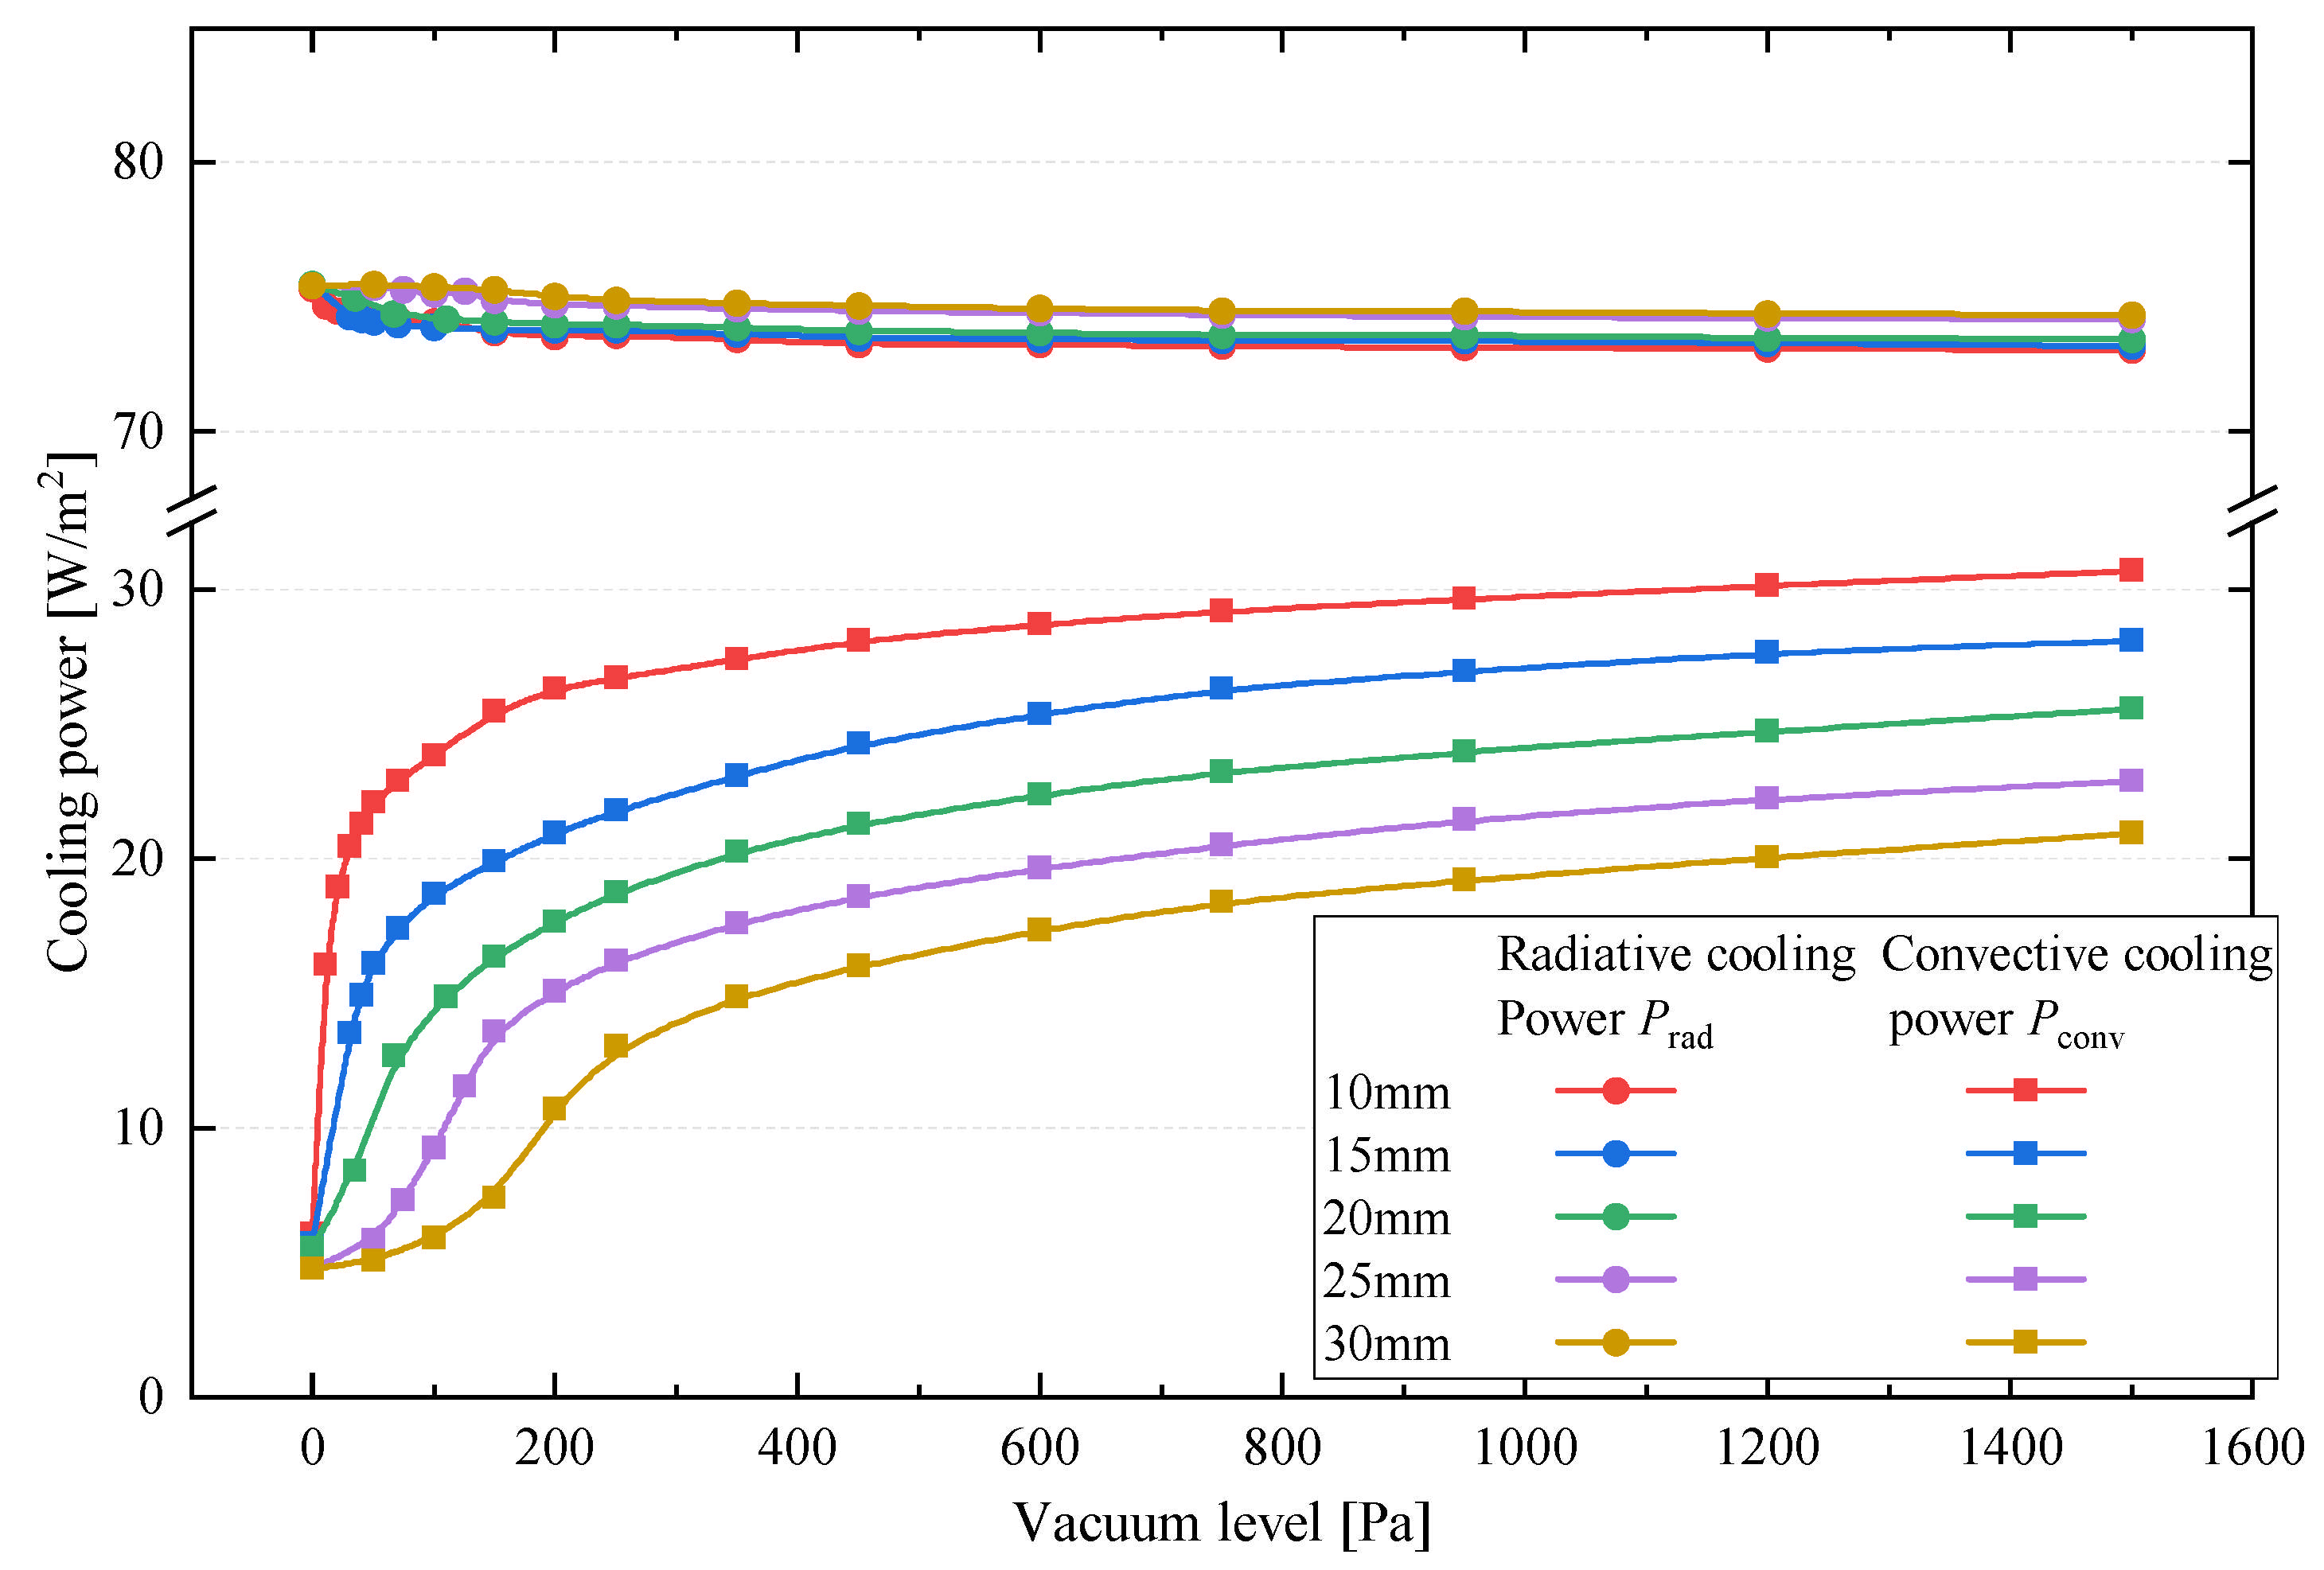
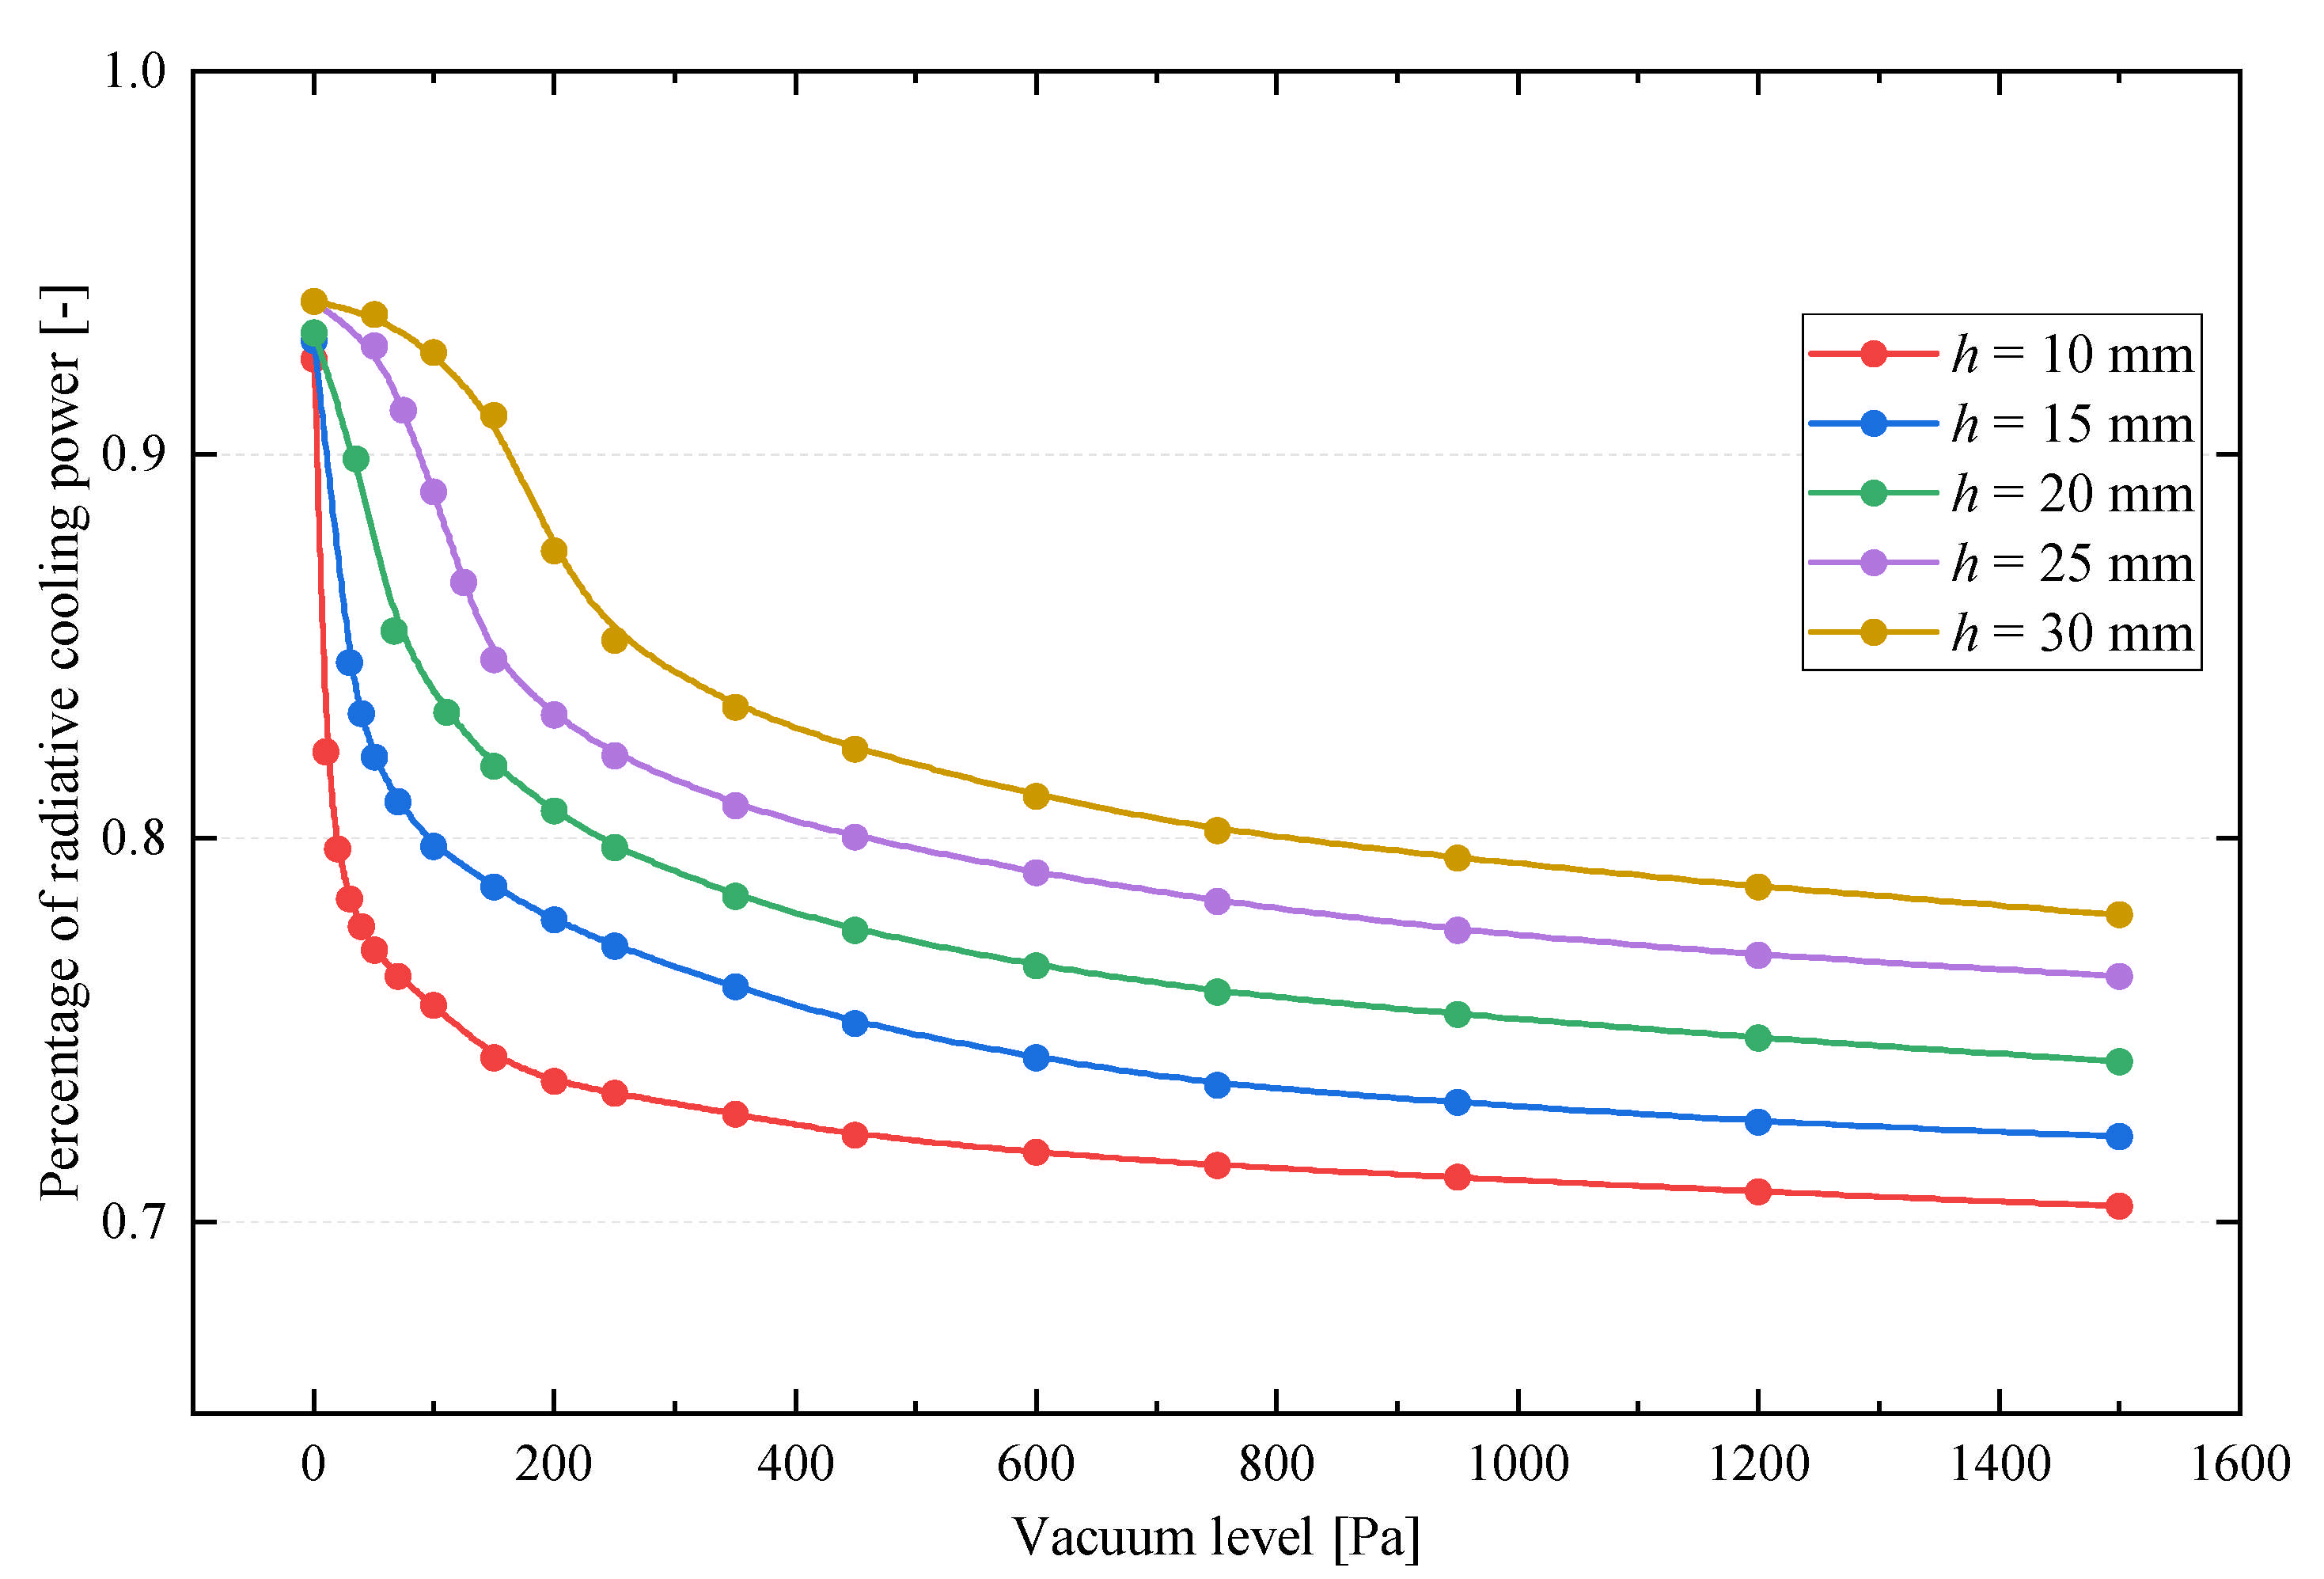
3.2.2. Effect of Structural Height and Vacuum Level on Nocturnal Performance

Figure 10 shows the effect of structural height and vacuum level on the passive cooling power of the module. At all structural heights, the passive cooling power increases consistently with rising vacuum levels inside the cushion. As the vacuum level intensifies, the flexible cover deforms and gradually adheres to the surface of the PV panel. This adhesion process can be divided into three distinct stages: non-adherence, initial adherence, and full adherence. During the non-adherence stage, a substantial volume of air remains between the PV panel and the environment, hindering convective heat transfer. Consequently, the augmentation in passive cooling power as vacuum levels rise is relatively limited. In the initial adherence stage, the passive cooling power increases rapidly. This is attributed to a substantial decrease in air mass within the air cushion, which leads to a significant reduction in thermal resistance between the PV panel and environment. Finally, during the full adherence stage, the enhancement of convective heat transfer approaches saturation. The passive cooling power increases at a diminishing rate before stabilizing near its maximum value.
Due to the structural constraints of the module, the maximum adhesion ratio between the flexible cover and the PV panel decreases with increasing air cushion structural height. Such a reduction leads to a corresponding decline in the maximum passive cooling power. For example, under a vacuum level of 1500 Pa, the passive cooling power reaches 103.73 W/m2 at 10 mm structural height but decreases to 95.32 W/m2 at 30 mm, representing a reduction of 8.1%. In addition, the maximum passive cooling power under the reference operating conditions corresponds to the cooling power of the unglazed PVT module, which is calculated to be 104.58 W/m2. Furthermore, when the structural height is relatively small, the distinction between the non-adherence and initial adherence stages becomes less clear. This is primarily because the adhesion state between the flexible cover and the PV panel becomes highly sensitive to slight variations in vacuum. For instance, at 10 mm structural height, increasing the vacuum from 0 Pa to 50 Pa raises the adhesion ratio from 0% to 44.35%. Therefore, within the bounds of engineering feasibility, reducing the structural height of the air cushion can substantially enhance the passive cooling performance at lower vacuum levels. This strategy not only alleviates stress on the flexible cover but also improves the structural integrity and operational safety.
To further analyze the cooling energy acquisition during the passive cooling process, we assessed the composition of passive cooling power under different air cushion structural heights and vacuum levels, and Figure 11 presents our findings. The passive cooling process consists of both radiative and convective cooling. As the process height increases, radiative cooling power exhibits a slight increase, primarily due to there being more air within the cushion. This increase weakens convective heat exchange between the PV panel and the ambient atmosphere, raising the cell temperature. In contrast, as the vacuum level rises, radiative cooling power slightly decreases because the reduction in convective thermal resistance enhances heat dissipation, lowers the cell temperature, and, consequently, reduces radiative emission. Importantly, the maximum variation in radiative cooling power remains below 2%, suggesting that the effects of structural height and vacuum level on radiative cooling performance are minimal. Meanwhile, convective cooling power follows a trend similar to that of the passive cooling power and is significantly influenced by both the structural height and vacuum level. For example, at a structural height of 30 mm and a vacuum level of 1500 Pa, the convective cooling power reaches 20.97 W/m2, representing an increase of 16.17 W/m2 (336.8%) compared with that of a conventional glazed PVT module with a glass cover (at 0 Pa). This enhancement in passive cooling performance is primarily driven by intensified convective heat transfer resulting from adjustments to the air cushion shape. A smaller structural height proves more effective in amplifying this effect. For instance, at a vacuum level of 1500 Pa, a 10 mm structural height yields a 10.87% increase in passive cooling power compared with the 30 mm configuration, with convective cooling power increasing by 11.35 W/m2 (46.40%).
Figure 12 presents the percentage of radiative cooling power during the passive cooling process under varying structural heights and vacuum levels. When the vacuum level within the air cushion is 0 Pa, radiative cooling accounts for approximately 93.19% of the passive cooling power across different structural heights. This indicates that radiative heat transfer is not the only cooling mechanism in glazed PVT modules. Although the air cushion hinders convective heat exchange between the PV panel and the ambient atmosphere, the ambient temperature remains lower than that of the panel, inducing weak convective currents due to the temperature gradient across the upper and lower surfaces of the cushion. As the vacuum level increases, the percentage of radiative cooling power gradually decreases, exhibiting an inverse trend compared with the passive cooling power. This occurs because the radiative heat exchange between the module and the sky remains largely unaffected by changes in structural height or vacuum level, as indicated by the equivalent radiative heat transfer coefficient, hrad, calculated to be 3.93 W/(m2·K). In contrast, higher vacuum levels enhance convective heat transfer, thereby reducing the relative contribution of radiative cooling to the passive cooling performance. The rate and extent of the decline vary across three stages. In the non-adherence stage, the reduction in radiative percentage is modest but accelerates progressively. In the initial adherence stage, the decline becomes significantly sharper, while in the full adherence stage the trend gradually levels off. For instance, at a structural height of 30 mm, during the non-adherence stage (0–150 Pa), the radiative cooling percentage drops from 94.02% to 91.01%, with the rate of decline increasing from 0.0071%/Pa to 0.052%/Pa. In the initial adherence stage (150–750 Pa), it further decreases to 80.19%, with the rate decelerating from 0.052%/Pa to 0.0047%/Pa. In the full adherence stage (750–1500 Pa), the percentage declines slightly from 80.19% to 78.00%, with the rate of change becoming increasingly gradual.

3.3. Effect of Critical Operating Parameters

Building upon the previous findings on the effects of air cushion structural height and vacuum level, this section fixes the structural height at 15 mm and the vacuum level at 600 Pa in order to further investigate the influence of key meteorological parameters, namely wind speed and sky temperature. The reference operating conditions for the proposed PVT-PC module are summarized in Table 8.

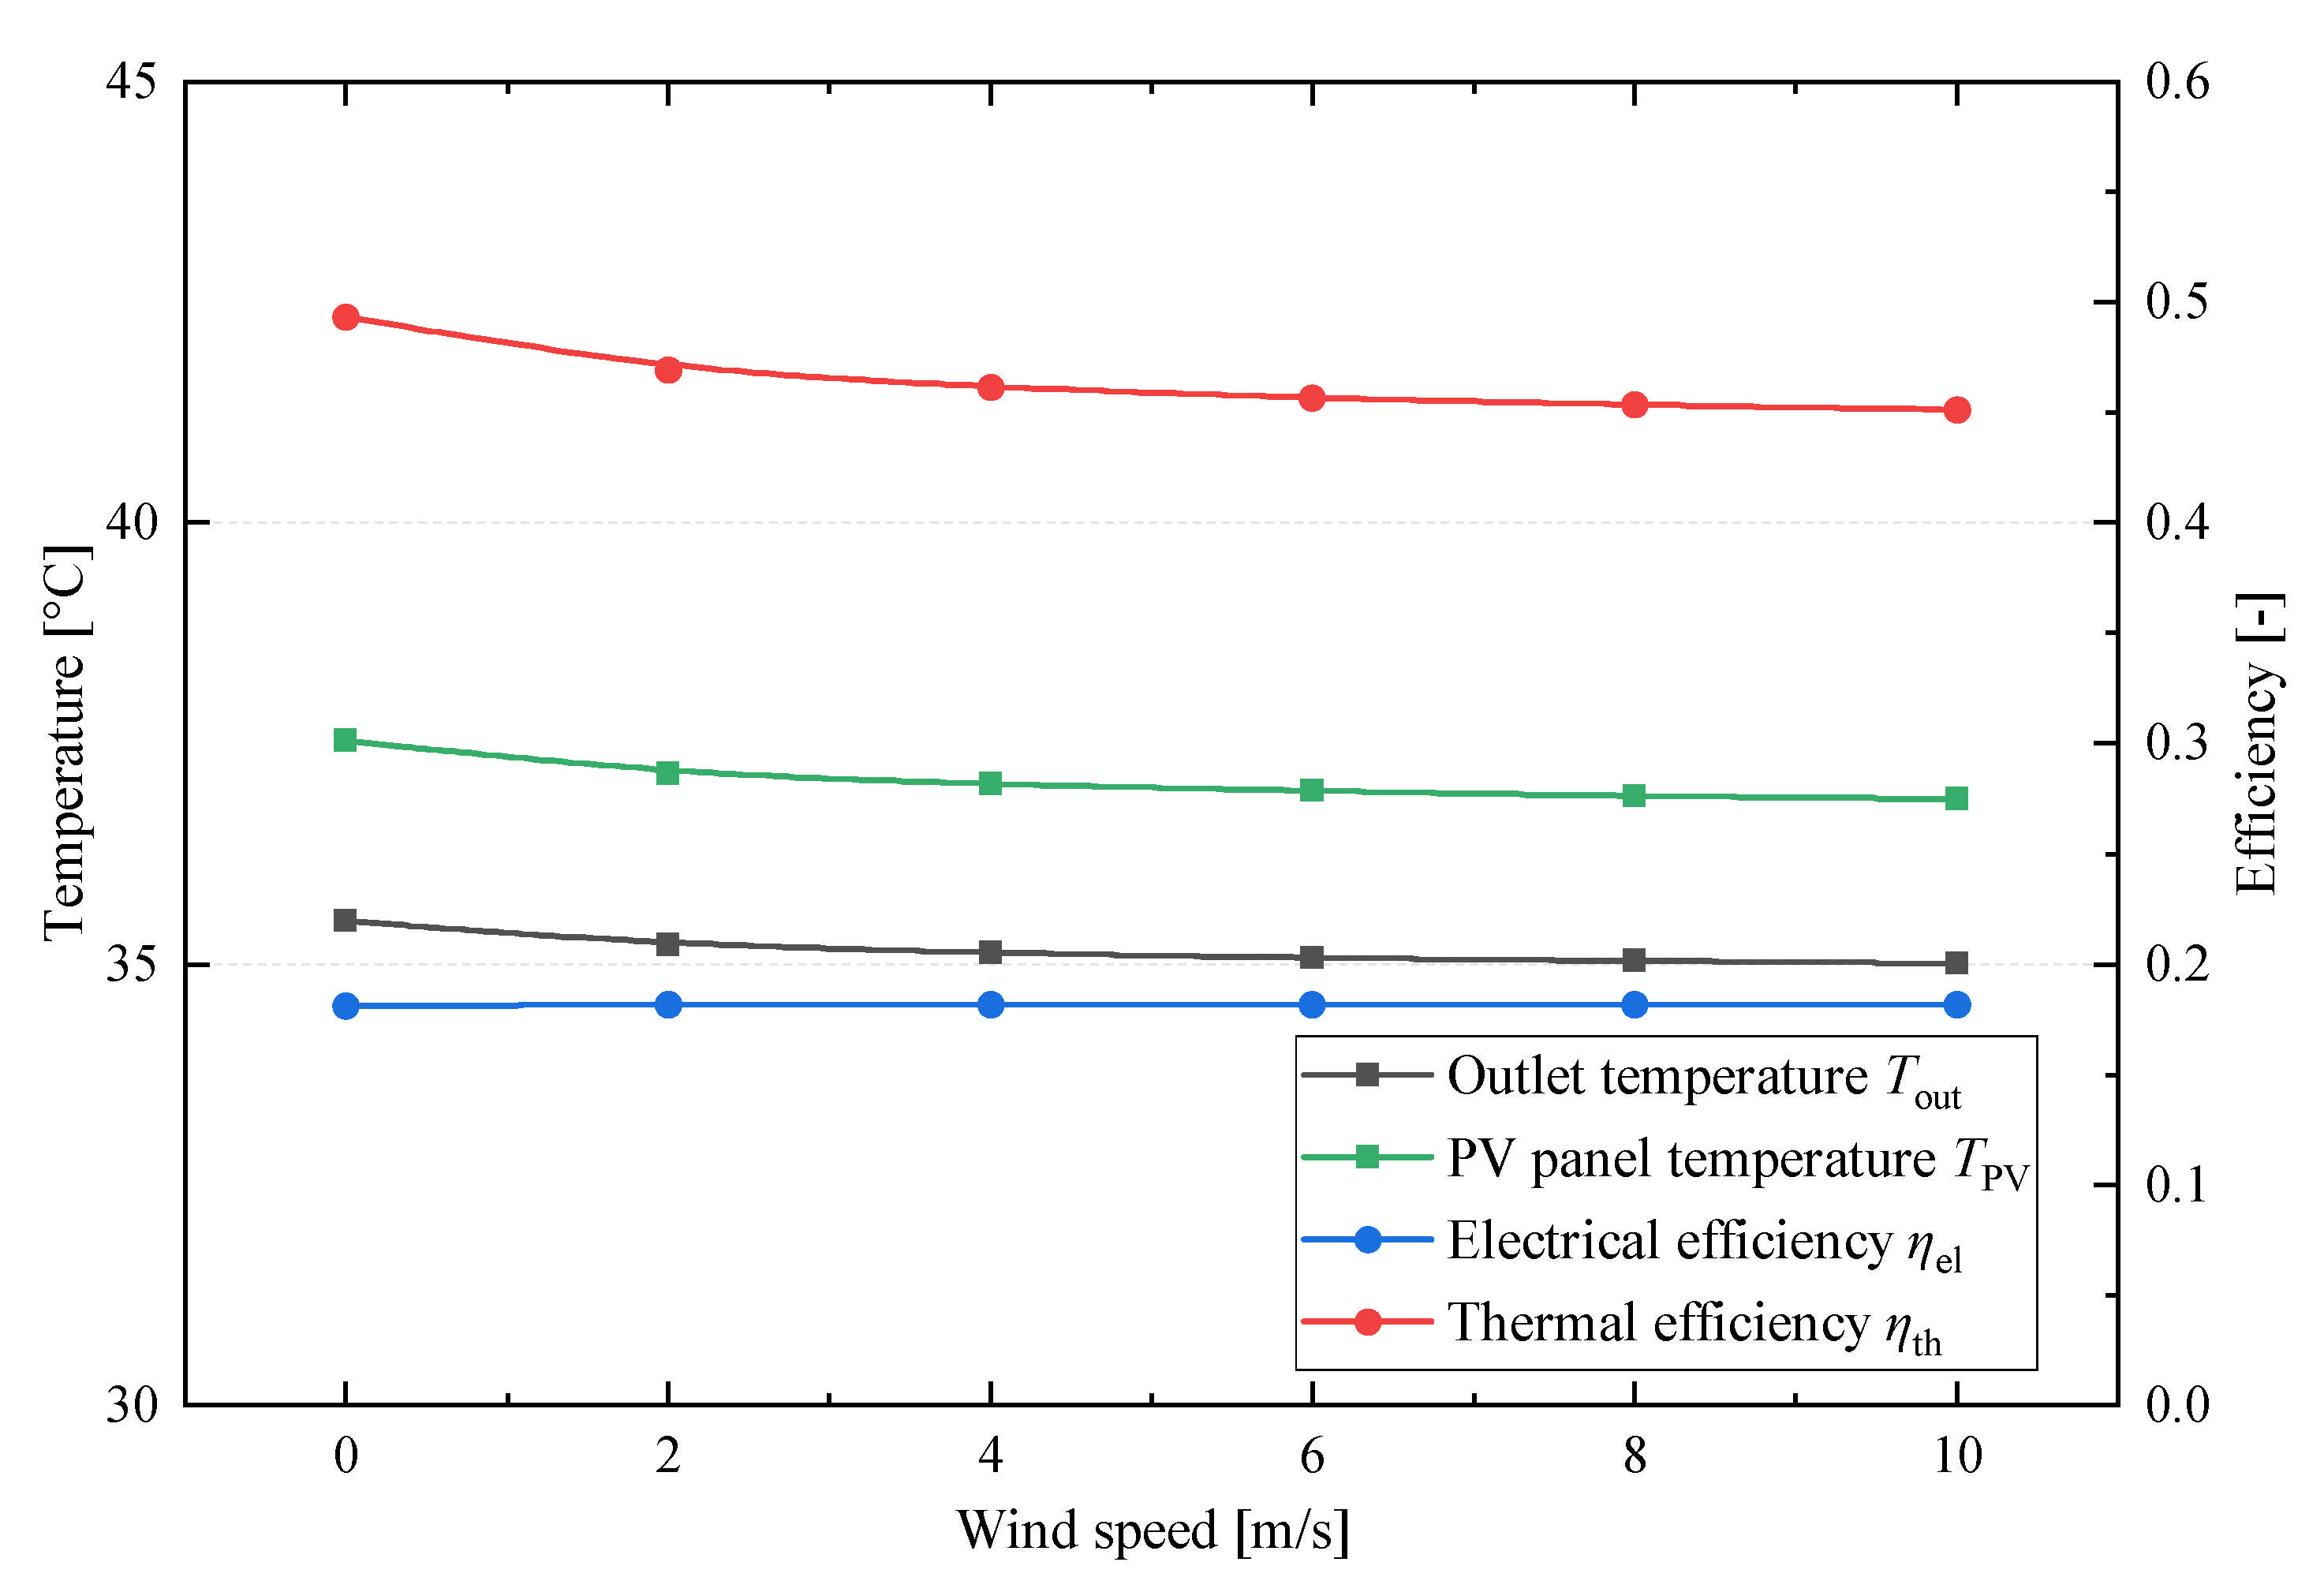
3.3.1. Effect of Wind Speed on PVT-PC Module Performance

Figure 13 illustrates the effect of wind speed on the outlet temperature, PV panel temperature, and electrical and thermal efficiencies of the module during diurnal operation. The electrical efficiency exhibits minimal sensitivity to increasing wind speed, rising by only 0.05% as the wind speed increases from 0 m/s to 10 m/s. At reduced structural heights, convective heat transfer within the cushion is suppressed, leading to a modest 0.66 °C decrease in the PV panel temperature. Concurrently, the outlet temperature decreases from 35.49 °C to 35.02 °C, and the thermal efficiency declines from 49.37% to 45.13%. As described by Equations (16) and (17), wind speed directly affects the convective heat transfer coefficient between the module and the ambient atmosphere, thereby altering the intensity of convective heat exchange. These results demonstrate that, unlike electrical performance, the thermal output is significantly more sensitive to variations in wind speed.
Figure 14 presents the effect of wind speed on passive cooling power, radiative cooling power, convective cooling power, and the percentage of radiative cooling power during nocturnal operation. As the wind speed increases, the passive cooling power rises from 92.48 W/m2 to 121.72 W/m2, marking a 31.61% increase. Notably, the radiative cooling power experiences a slight decline due to a 0.57 °C reduction in the PV panel temperature, caused by stronger winds. In contrast, the convective cooling power increases significantly from 17.95 W/m2 to 49.44 W/m2, causing the percentage of radiative cooling to drop from 80.59% to 59.38%. These findings further underscore the pronounced influence of wind speed on the nighttime passive cooling performance.

3.3.2. Effect of Sky Temperature on PVT-PC Module Performance

Figure 15 shows the variation in sky temperature. According to Equations (11) and (12), the sky temperature is determined by the ambient temperature and relative humidity, which, together, define the atmospheric thermal radiation and consequently affect the radiative heat exchange between the module and the sky. Accordingly, this subsection investigates the effect of sky temperature on the proposed module’s diurnal and nocturnal performance. Based on recent meteorological data from the Guangzhou region, the considered range of sky temperatures needs to be from −20 °C to 40 °C to enable a comprehensive analysis of its effect.
Figure 16 shows the effect of sky temperature on diurnal performance. Variations in sky temperature directly influence the radiative heat exchange between the module and the sky. As the sky temperature increases, radiative heat loss from the module decreases, leading to a 3.72 °C rise in the PV panel temperature and a corresponding 0.29% reduction in electrical efficiency. In contrast, the thermal performance improves markedly with higher sky temperatures. The temperature difference between the inlet and outlet rises from 4.15 °C to 6.85 °C, consequently increasing thermal efficiency from 37.36% to 61.72% and enhancing overall efficiency, with an increase from 55.64% to 79.71%. Furthermore, the rate of thermal efficiency improvement accelerates with increasing sky temperature. For instance, the growth rate increases from 0.298%/°C at −20 °C to 0.526%/°C at 40 °C.
Figure 17 illustrates the effect of sky temperature on nocturnal performance, including passive cooling power, radiative cooling power, convective cooling power, and the percentage of radiative cooling power. As the sky temperature increases from −20 °C to 40 °C, the passive cooling power decreases significantly, from 167.58 W/m2 to −3.276 W/m2, eventually becoming insufficient to maintain effective cooling. According to Figure 18, the increase in sky temperature enhances the equivalent radiative heat transfer coefficient from 3.35 W/(m2·K) to 4.63 W/(m2·K). However, the temperature difference between the PV panel and the sky declines rapidly from 46.34 °C to −10.15 °C, resulting in a sharp decrease in radiative cooling power from 155.24 W/m2 to −45.59 W/m2. This effect is caused by intensified atmospheric thermal radiation at higher sky temperatures, which leads to greater radiative energy absorption by the panel, weakening its cooling capability. When the sky temperature exceeds 30 °C, the panel becomes cooler than the sky, producing a net heat gain from atmospheric radiation and causing the radiative cooling power to become negative. In contrast, the convective cooling power increases with a rising sky temperature, rising from 12.34 W/m2 to 42.32 W/m2, due to a 3.81 °C increase in panel temperature that enhances heat exchange with the ambient atmosphere. Despite this, the percentage of radiative cooling declines significantly from 92.63% at −20 °C to 34.06% at 25 °C. Beyond this point, the module can no longer rely on radiative mechanisms and must depend entirely on convective heat transfer to dissipate thermal energy.

3.4. Economic Analysis

In conjunction with previous research conducted by our group, the daytime photothermal energy harvested by the PVT module amounts to 275.15 kWh/m2. When converted into cooling energy via a lithium bromide absorption refrigeration system (assuming a coefficient of performance (COP) of 0.6), this yields 165.1 kWh/m2 of cooling energy. Taking a conventional vapor compression refrigeration system as a benchmark, this amount of cooling energy corresponds to an electricity saving of 33.02 kWh/m2. Furthermore, the average cooling energy generated through nighttime passive cooling is 51.4 W/m2. Assuming that cooling is required for half of the year (i.e., 4380 h annually), the total nighttime passive cooling energy produced by the PVT module over the course of a year is 225.13 kWh/m2. When this cooling energy is utilized via subcooling in a vapor compression refrigeration system—delivering an equivalent amount of cooling at the evaporator—it can save 45.03 kWh/m2 of electricity (the COP of the vapor compression refrigeration system is assumed to be 5.0). Considering the average electricity price in Guangzhou—0.667 CNY/kWh—the module costs and returns are as Table 9:

4. Conclusions and Future Scope

This paper developed a numerical model for a switchable film-insulated photovoltaic–thermal–passive cooling (PVT-PC) module and analyzed the effects of key design parameters, such as the air cushion structural height and vacuum level, on the shape of the air cushion and the overall performance of the module. It also elucidated the patterns of cold energy acquisition during nocturnal passive cooling and investigated the influence of meteorological parameters, including wind speed and sky temperature, on module performance. The main conclusions of this paper are as follows:
(1) The adhesion ratio between the flexible cover and the PV panel increases with rising vacuum levels and gradually reaches a plateau, while it decreases with increasing air cushion structural height. Significant stress concentrations are observed at the four corners of the adhesion region. To ensure structural integrity, the vacuum level should be maintained below 1500 Pa.
(2) The air cushion structural height has minimal impact on the module’s diurnal performance, with its electrical and thermal efficiencies remaining stable at approximately 18.17% and 47.25%, respectively. In contrast, the nocturnal passive cooling power decreases with increasing structure height but increases with higher vacuum levels. For example, at a structural height of 10 mm and a vacuum level of 1500 Pa, the module achieves a passive cooling power of 103.73 W/m2, approximating that of an unglazed PVT module (104.58 W/m2). Across the range of vacuum levels and structural heights studied, the maximum variation in radiative cooling power remains within 2%. The enhancement in passive cooling performance is primarily attributed to intensified convective heat transfer driven by changes in the air cushion shape, with lower structural heights being more favorable for this effect. Specifically, under a vacuum level of 1500 Pa, a structural height of 10 mm results in a 10.87% increase in passive cooling power compared with a height of 30 mm, corresponding to an increase in convective cooling power of 11.35 W/m2 (46.40%). Conversely, the percentage of radiative cooling power exhibits a trend opposite to that of the passive cooling power.
(3) Wind speed has a negligible effect on the module’s diurnal electrical efficiency but exerts a significantly greater influence on its thermal efficiency. During nocturnal mode, passive cooling power increases markedly with wind speed, reaching an improvement of up to 31.61%. This improvement is primarily attributed to intensified convective heat transfer, as convective cooling power increases with wind speed. In contrast, both the radiative cooling power and the percentage of radiative cooling power exhibit a decreasing trend.
(4) An increase in sky temperature raises the module’s daytime operating temperature, leading to a slight decrease in electrical efficiency while markedly improving thermal efficiency, which rises from 37.36% to 61.72%. Additionally, the passive cooling power declines sharply with increasing sky temperature, eventually becoming insufficient to sustain cooling output. Specifically, radiative cooling power drops dramatically from 155.24 W/m2 to −45.59 W/m2, while convective cooling power increases from 12.34 W/m2 to 42.32 W/m2. Meanwhile, the percentage of radiative cooling power decreases significantly as sky temperature rises.
(5) The payback period of the module proposed in this article is approximately 8.64 years.
However, this study still possesses certain limitations, primarily stemming from the numerical modeling process, which did not consider the impact of variations in the sky view factor, resulting from the module’s inclined placement, on performance. Instead, solar radiation was idealized as a perpendicular heat source incident on the module surface, and the sky was simplified as an equivalent blackbody.
Numerical simulations can offer a more detailed understanding of the heat transfer mechanisms. However, their low computational efficiency makes them less suitable for power forecasting and multi-objective optimization. Therefore, machine learning methods, capable of linking input parameters to performance outputs, are recommended for achieving accurate and efficient predictions. In addition, the proposed module could be integrated with heat pumps or absorption chillers in order to utilize its subcooling potential within refrigeration cycles, thereby enabling exploration of its applicability in specific practical scenarios.

Author Contributions

C.J.: investigation, methodology, writing—original draft. Z.L.: conceptualization, resources, supervision, writing—review and editing. T.J.: formal analysis, writing—review and editing. Z.X. (Zihan Xu): formal analysis. Z.X. (Zhiqun Xu): resources. B.S.: supervision. All authors have read and agreed to the published version of the manuscript.

Funding

This research and the APC was funded by (1) the Innovation and Entrepreneurship Team Project of Hengqin-Guangdong-Macao Deep Cooperation Zone under the contract No. 2120004000416 and (2) the Key Laboratory of Efficient and Clean Energy Utilization of Guangdong Higher Education Institutes under the contract No. KLB10004.

Data Availability Statement

Data are contained within the article.

Acknowledgments

This work was supported by (1) the Innovation and Entrepreneurship Team Project of Hengqin-Guangdong-Macao Deep Cooperation Zone under the contract No. 2120004000416 and (2) the Key Laboratory of Efficient and Clean Energy Utilization of Guangdong Higher Education Institutes under the contract No. KLB10004.

Conflicts of Interest

Authors Zihan Xu, Zhiqun Xu and Bin Sun were employed by the company Gokin Solar Co., Ltd. The remaining authors declare that the research was conducted in the absence of any commercial or financial relationships that could be construed as a potential conflict of interest.

Nomenclature

A Area, m2 λ Wavelength, μm
Thermal conductivity, W/(m·K)
a Cooling power loss coefficient, W/m2 μ Viscosity, Pa·s
c Specific heat capacity, J/(kg·K) ρ Density, kg/m3
e el Electric output power per unit volume of photovoltaic cell, W/m3 σ Stefan–Boltzmann constant, W/(m2·K4)
E Emissive power, W/m2 σ s Yield strength, MPa
f s Safety factor, - σ m Maximum stress, MPa
F R Heat removal factor, - τ Transmissivity, -
g Gravitational acceleration, m/s2 τ α The product of the transmissivity of the cover and the absorptivity of the absorbing surface, -
G Solar irradiance, W/m2 ξ Packing factor, -
G ¯ Average solar irradiance, W/m2Abbreviation and subscripts
H Total incident solar energy, MJaAmbient
h Equivalent heat transfer coefficient, W/(m2·K)
Convective heat transfer coefficient, W/(m2·K)
Air cushion structural height, mm
abAbsorber plate
I Current, AatmAtmosphere
m ˙ Mass flow rate, kg/sbBlackbody
M Mass/Mass of water in the water tank, kgcoolPassive cooling
P Cooling power, W/m2
pressure, Pa
condConductive
P v Vacuum level inside the air cushion, PaconvConvective
S Solid domain heat source per unit volume, W/m3dDew point
T Temperature, KelElectrical
T ¯ Average temperature, °CexpExperimental
Δ T Temperature difference, KfFluid
t Temperature, °C/Time, sglGlazed
Δ t Recording interval of the data logger, sinModule inlet
V Velocity, m/soOverall
V ¯ Average velocity, m/soutModule outlet
Greek symbolspPanel/power plant
α Absorptivity, -PVPhotovoltaic panel
β Temperature coefficient of photovoltaic cells, -radRadiative
δ Thickness, mrefReference
ε Emissivity, -sSolid
ε ¯ Effective emissivity, -simSimulated
φ Relative humidity, %RHskySky
φ ¯ Average relative humidity, %RHthThermal
γ Coefficient, -uglUnglazed
η Efficiency, -
Percentage, -
wWater

References

  1. U.S. Energy Information Administration International Energy Outlook. 2023. Available online: https://www.eia.gov/outlooks/ieo/ (accessed on 3 April 2025).
  2. National Development and Reform Commission Mid-Term Evaluation Report on the Implementation of the Fourteenth Five-Year Plan. Available online: https://www.ndrc.gov.cn/fzggw/wld/zsj/zyhd/202312/t20231227_1362958.html (accessed on 7 March 2025).
  3. Herrando, M.; Wang, K.; Huang, G.; Otanicar, T.; Mousa, O.B.; Agathokleous, R.A.; Ding, Y.; Kalogirou, S.; Ekins-Daukes, N.; Taylor, R.A.; et al. A Review of Solar Hybrid Photovoltaic-Thermal (PV-T) Collectors and Systems. Prog. Energy Combust. Sci. 2023, 97, 101072. [Google Scholar] [CrossRef]
  4. National Renewable Energy Laboratory Champion Photovoltaic Module Efficiency Chart. Available online: https://www.nrel.gov/pv/module-efficiency (accessed on 3 April 2025).
  5. Wolf, M. Performance Analyses of Combined Heating and Photovoltaic Power Systems for Residences. Energy Convers. 1976, 16, 79–90. [Google Scholar] [CrossRef]
  6. Basalike, P.; Peng, W.; Zhang, J.; Lu, S. Numerical Analysis of Roll Bond Photovoltaic Thermal Working as a Condenser during Nighttime. Renew. Energy 2022, 181, 194–206. [Google Scholar] [CrossRef]
  7. Mahmood Alsalame, H.A.; Lee, J.H.; Lee, G.H. Performance Evaluation of a Photovoltaic Thermal (PVT) System Using Nanofluids. Energies 2021, 14, 301. [Google Scholar] [CrossRef]
  8. Poredoš, P.; Tomc, U.; Petelin, N.; Vidrih, B.; Flisar, U.; Kitanovski, A. Numerical and Experimental Investigation of the Energy and Exergy Performance of Solar Thermal, Photovoltaic and Photovoltaic-Thermal Modules Based on Roll-Bond Heat Exchangers. Energy Convers. Manag. 2020, 210, 112674. [Google Scholar] [CrossRef]
  9. Jurčević, M.; Nižetić, S.; Marinić-Kragić, I.; Jakić, M.; Arıcı, M. Towards Resilient Operation of Photovoltaic-Thermal Collector with Incorporated Organic Phase Change Material: Numerical and Experimental Investigation. Sustain. Energy Technol. Assess. 2023, 60, 103465. [Google Scholar] [CrossRef]
  10. Ali, A.; Alhussein, M.; Aurangzeb, K.; Akbar, F. The Numerical Analysis of Al2O3Cu/Water Hybrid Nanofluid Flow inside the Serpentine Absorber Channel of a PVT; the Overall Efficiency Intelligent Forecasting. Eng. Anal. Bound. Elem. 2023, 157, 82–91. [Google Scholar] [CrossRef]
  11. Awais, M.; Saad, M.; Ayaz, H.; Ehsan, M.M.; Bhuiyan, A.A. Computational Assessment of Nano-Particulate (Al2O3/Water) Utilization for Enhancement of Heat Transfer with Varying Straight Section Lengths in a Serpentine Tube Heat Exchanger. Therm. Sci. Eng. Prog. 2020, 20, 100521. [Google Scholar] [CrossRef]
  12. Kazemian, A.; Salari, A.; Ma, T.; Lu, H. Application of Hybrid Nanofluids in a Novel Combined Photovoltaic/Thermal and Solar Collector System. Sol. Energy 2022, 239, 102–116. [Google Scholar] [CrossRef]
  13. Guarracino, I.; Freeman, J.; Ramos, A.; Kalogirou, S.A.; Ekins-Daukes, N.J.; Markides, C.N. Systematic Testing of Hybrid PV-Thermal (PVT) Solar Collectors in Steady-State and Dynamic Outdoor Conditions. Appl. Energy 2019, 240, 1014–1030. [Google Scholar] [CrossRef]
  14. Zhang, L.; Chang, R.; Zhang, C.; Yu, C. Improving Thermal Performance and Energy Production of Photovoltaic Thermal Collector by Bifurcating Tree-like Cooling Channels. Therm. Sci. 2025, 21. [Google Scholar] [CrossRef]
  15. Kazem, H.A.; Al-Waeli, A.H.A.; Chaichan, M.T.; Al-Waeli, K.H.; Al-Aasam, A.B.; Sopian, K. Evaluation and Comparison of Different Flow Configurations PVT Systems in Oman: A Numerical and Experimental Investigation. Sol. Energy 2020, 208, 58–88. [Google Scholar] [CrossRef]
  16. Hissouf, M.; Feddaoui, M.; Najim, M.; Charef, A. Performance of a Photovoltaic-Thermal Solar Collector Using Two Types of Working Fluids at Different Fluid Channels Geometry. Renew. Energy 2020, 162, 1723–1734. [Google Scholar] [CrossRef]
  17. Deka, M.J.; Kamble, A.D.; Das, D.; Sharma, P.; Ali, S.; Kalita, P.; Bora, B.J.; Kalita, P. Enhancing the Performance of a Photovoltaic Thermal System with Phase Change Materials: Predictive Modelling and Evaluation Using Neural Networks. Renew. Energy 2024, 224, 120091. [Google Scholar] [CrossRef]
  18. Lari, M.O.; Sahin, A.Z. Effect of Retrofitting a Silver/Water Nanofluid-Based Photovoltaic/Thermal (PV/T) System with a PCM-Thermal Battery for Residential Applications. Renew. Energy 2018, 122, 98–107. [Google Scholar] [CrossRef]
  19. Ben Zohra, M.; Riad, A.; Alhamany, A. Optimizing the Conception of Hybrid PV/PCM by Optimizing the Heat Transfer at the Contact Interface and by Integrating Two Types of PCM. Results Eng. 2022, 16, 100614. [Google Scholar] [CrossRef]
  20. Al Arni, S.; Mahdi, J.M.; Abed, A.M.; Hammoodi, K.A.; Hasan, H.A.; Homod, R.Z.; Khedher, N.B. Novel Multi-Layer Nano-Modified PCM Configuration for Efficient Thermal Management of Photovoltaic-Thermal Systems. J. Energy Storage 2024, 103, 114352. [Google Scholar] [CrossRef]
  21. Song, Z.; Zhang, Y.; Ji, J.; Wang, C. Analysis of Night Behavior and Negative Running for PVT System. Energy 2024, 301, 131555. [Google Scholar] [CrossRef]
  22. Zhai, Y.; Ma, Y.; David, S.N.; Zhao, D.; Lou, R.; Tan, G.; Yang, R.; Yin, X. Scalable-Manufactured Randomized Glass-Polymer Hybrid Metamaterial for Daytime Radiative Cooling. Science 2017, 355, 1062–1066. [Google Scholar] [CrossRef] [PubMed]
  23. Zhao, B.; Hu, M.; Ao, X.; Pei, G. Performance Evaluation of Daytime Radiative Cooling under Different Clear Sky Conditions. Appl. Therm. Eng. 2019, 155, 660–666. [Google Scholar] [CrossRef]
  24. Liang, R.; Zhou, C.; Zhang, J.; Chen, J.; Riaz, A. Characteristics Analysis of the Photovoltaic Thermal Heat Pump System on Refrigeration Mode: An Experimental Investigation. Renew. Energy 2020, 146, 2450–2461. [Google Scholar] [CrossRef]
  25. Chen, H.; Li, Z.; Sun, B. Performance Evaluation and Parametric Analysis of an Integrated Diurnal and Nocturnal Cooling System Driven by Photovoltaic-Thermal Collectors with Switchable Film Insulation. Energy Convers. Manag. 2022, 254, 115197. [Google Scholar] [CrossRef]
  26. Zhou, C.; Liang, R.; Riaz, A.; Zhang, J.; Chen, J. Experimental Investigation on the Tri-Generation Performance of Roll-Bond Photovoltaic Thermal Heat Pump System during Summer. Energy Convers. Manag. 2019, 184, 91–106. [Google Scholar] [CrossRef]
  27. Fu, Z.; Li, Y.; Liang, X.; Lou, S.; Qiu, Z.; Cheng, Z.; Zhu, Q. Experimental Investigation on the Enhanced Performance of a Solar PVT System Using Micro-Encapsulated PCMs. Energy 2021, 228, 120509. [Google Scholar] [CrossRef]
  28. Lee, J.W.; Song, M.S.; Jung, H.S.; Kang, Y.T. Development of Solar Radiation Spectrum-Controlled Emulsion Filter for a Photovoltaic-Thermal (PVT) System. Energy Convers. Manag. 2023, 287, 117087. [Google Scholar] [CrossRef]
  29. Kazemian, A.; Hosseinzadeh, M.; Sardarabadi, M.; Passandideh-Fard, M. Effect of Glass Cover and Working Fluid on the Performance of Photovoltaic Thermal (PVT) System: An Experimental Study. Sol. Energy 2018, 173, 1002–1010. [Google Scholar] [CrossRef]
  30. Hissouf, M.; Feddaoui, M.; Dayf, A. Analysis of the Exergy Performances of a Glazed and Unglazed PV/T Collector under Different Conditions. Int. J. Heat Mass Transf. 2024, 226, 125447. [Google Scholar] [CrossRef]
  31. Bilbao, J.I.; Sproul, A.B. Night Radiative Cooling with Unglazed Pvt-Water Collectors: Experimental Results and Estimation of Cooling Potential. In Proceedings of the Ises Solar World Congress 2015, Daegu, Republic of Korea, 8–12 November 2015; International Solar Energy Society: Freiburg im Breisgau, Germany, 2016; pp. 1–8. [Google Scholar]
  32. Jiao, C.; Li, Z.; Xu, Z.; Sun, B.; Ma, W.; Ooi, K.T. Development and Test of Switchable Film Insulated Photovoltaic-Thermal-Passive Cooling Module. Sol. Energy Mater. Sol. Cells 2025, 282, 113427. [Google Scholar] [CrossRef]
  33. Maadi, S.R.; Navegi, A.; Solomin, E.; Ahn, H.S.; Wongwises, S.; Mahian, O. Performance Improvement of a Photovoltaic-Thermal System Using a Wavy-Strip Insert with and without Nanofluid. Energy 2021, 234, 121190. [Google Scholar] [CrossRef]
  34. Khanna, S.; Reddy, K.S.; Mallick, T.K. Optimization of Solar Photovoltaic System Integrated with Phase Change Material. Sol. Energy 2018, 163, 591–599. [Google Scholar] [CrossRef]
  35. Maadi, S.R.; Khatibi, M.; Ebrahimnia-Bajestan, E.; Wood, D. Coupled Thermal-Optical Numerical Modeling of PV/T Module—Combining CFD Approach and Two-Band Radiation DO Model. Energy Convers. Manag. 2019, 198, 111781. [Google Scholar] [CrossRef]
  36. Duffie, J.A.; Beckman, W.A. Solar Engineering of Thermal Processes, 4th ed.; Wiley: Hoboken, NJ, USA, 2013. [Google Scholar]
  37. Zheng, X.; Zhou, Y. A Three-Dimensional Unsteady Numerical Model on a Novel Aerogel-Based PV/T-PCM System with Dynamic Heat-Transfer Mechanism and Solar Energy Harvesting Analysis. Appl. Energy 2023, 338, 120899. [Google Scholar] [CrossRef]
  38. Berdahl, P.; Martin, M. Emissivity of Clear Skies. Sol. Energy 1984, 32, 663–664. [Google Scholar] [CrossRef]
  39. White, F.M. Fluid Mechanics, 7th ed.; McGraw-Hill: New York, NY, USA, 2011. [Google Scholar]
  40. Ebrahimnia-Bajestan, E.; Moghadam, M.C.; Niazmand, H.; Daungthongsuk, W.; Wongwises, S. Experimental and Numerical Investigation of Nanofluids Heat Transfer Characteristics for Application in Solar Heat Exchangers. Int. J. Heat Mass Transf. 2016, 92, 1041–1052. [Google Scholar] [CrossRef]
  41. Bellos, E.; Tzivanidis, C. Investigation of a Nanofluid-Based Concentrating Thermal Photovoltaic with a Parabolic Reflector. Energy Convers. Manag. 2019, 180, 171–182. [Google Scholar] [CrossRef]
  42. Zhao, D.; Aili, A.; Zhai, Y.; Xu, S.; Tan, G.; Yin, X.; Yang, R. Radiative Sky Cooling: Fundamental Principles, Materials, and Applications. Appl. Phys. Rev. 2019, 6, 21306. [Google Scholar] [CrossRef]
  43. Granqvist, C.G.; Hjortsberg, A. Radiative Cooling to Low Temperatures: General Considerations and Application to Selectively Emitting SiO Films. J. Appl. Phys. 1981, 52, 4205–4220. [Google Scholar] [CrossRef]
  44. Raman, A.P.; Anoma, M.A.; Zhu, L.; Rephaeli, E.; Fan, S. Passive Radiative Cooling below Ambient Air Temperature under Direct Sunlight. Nature 2014, 515, 540–544. [Google Scholar] [CrossRef]
  45. Shukuya, M. Exergy: Theory and Applications in the Built Environment; Springer Science + Business Media: Berlin/Heidelberg, Germany, 2012; ISBN 1-4471-4573-9. [Google Scholar]
  46. Zhao, D.; Aili, A.; Zhai, Y.; Lu, J.; Kidd, D.; Tan, G.; Yin, X.; Yang, R. Subambient Cooling of Water: Toward Real-World Applications of Daytime Radiative Cooling. Joule 2019, 3, 111–123. [Google Scholar] [CrossRef]
  47. Chow, T.T. Performance Analysis of Photovoltaic-Thermal Collector by Explicit Dynamic Model. Sol. Energy 2003, 75, 143–152. [Google Scholar] [CrossRef]
  48. Yin, Y.; Chen, W.; Hu, J.; Zhao, B.; Huang, X. Photothermal-Structural-Fluid Behaviors of PV-ETFE Cushion Roof in Summer: Numerical Analysis Using Three-Dimensional Multiphysics Model. Energy Build. 2020, 228, 110448. [Google Scholar] [CrossRef]
  49. Hu, J.; Chen, W.; Zhao, B.; Wang, K. Uniaxial Tensile Mechanical Properties and Model Parameters Determination of Ethylene Tetrafluoroethylene (ETFE) Foils. Constr. Build. Mater. 2015, 75, 200–207. [Google Scholar] [CrossRef]
  50. Suhendri, S.; Hu, M.; Dan, Y.; Su, Y.; Zhao, B.; Riffat, S. Building Energy-Saving Potential of a Dual-Functional Solar Heating and Radiative Cooling System. Energy Build. 2024, 303, 113764. [Google Scholar] [CrossRef]
Figure 1. Cover structure of the PVT module.
Processes 13 02471 g001
Figure 2. Schematic and picture of the proposed module.
Processes 13 02471 g002
Figure 3. Physical model of the proposed module.
Processes 13 02471 g003
Figure 4. Heat transfer mechanisms in the PVT-PC module.
Processes 13 02471 g004
Figure 5. Deformation of the flexible cover (in mm) under varying vacuum levels when the structural height is 15 mm.
Processes 13 02471 g005
Figure 6. The effect of the structural height and vacuum level on the adhesion ratio.
Processes 13 02471 g006
Figure 7. Von Mises equivalent stress (in MPa) of the flexible cover at a vacuum level of 1500 Pa and a structural height of 15 mm.
Processes 13 02471 g007
Figure 8. Effect of structural height on the diurnal performance of the module.
Processes 13 02471 g008
Figure 9. Airflow velocity within the air cushion at different structural heights (in cm/s).
Processes 13 02471 g009
Figure 10. Effect of structural height and vacuum level on passive cooling power.
Processes 13 02471 g010
Figure 11. Effect of structural height and vacuum level on the composition of passive cooling power.
Processes 13 02471 g011
Figure 12. Effect of structural height and vacuum level on the percentage of the radiative cooling power.
Processes 13 02471 g012
Figure 13. Effect of wind speed on the outlet temperature, PV panel temperature, and electrical and thermal efficiencies.
Processes 13 02471 g013
Figure 14. Effect of wind speed on passive cooling power, radiative cooling power, convective cooling power, and percentage of radiative cooling power.
Processes 13 02471 g014
Figure 15. Variation in sky temperature with ambient temperature and relative humidity.
Processes 13 02471 g015
Figure 16. Effect of sky temperature on the outlet temperature; PV panel temperature; and electrical, thermal, and overall efficiencies.
Processes 13 02471 g016
Figure 17. Effect of sky temperature on passive cooling power, radiative cooling power, convective cooling power, and percentage of radiative cooling power.
Processes 13 02471 g017
Figure 18. Effect of sky temperature on equivalent radiative heat transfer coefficient.
Processes 13 02471 g018
Table 1. Geometry and material properties of the PVT-PC module.
ComponentDescriptionValue
Flexible cover (ETFE film)Length/width/thickness (mm)1986/986/0.15
Density (kg/m3)300
Specific heat capacity [J/(kg·K)]1260
Thermal conductivity [W/(m·K)]0.23
PV panelThickness (mm)4.33
Weighted average density (kg/m3)2133.1
Weighted average specific heat capacity [J/(kg·K)]935.6
Weighted average thermal conductivity [W/(m·K)]24.2
Adhesive layerThickness (mm)1.5
Density (kg/m3)2500
Specific heat capacity [J/(kg·K)]1300
Thermal conductivity [W/(m·K)]1.6
Absorber plateThickness (mm)1
Density (kg/m3)2719
Specific heat capacity [J/(kg·K)]871
Thermal conductivity [W/(m·K)]202.4
Branch tubeSpacing length/length/outer diameter/inner diameter (mm)120/1926/10/8
Density (kg/m3)8978
Specific heat capacity [J/(kg·K)]381
Thermal conductivity [W/(m·K)]387.6
Header tubeOuter diameter/inner diameter (mm)22/20
InsulationThickness (mm)50
Density (kg/m3)45
Specific heat capacity [J/(kg·K)]840
Thermal conductivity [W/(m·K)]0.036
Air cushionHeight (mm)15
Table 2. Geometry and material properties of the PV layer.
ComponentThickness (mm)Density (kg/m3)Specific Heat Capacity [J/(kg·K)]Thermal Conductivity [W/(m·K)]
Encapsulated3.030005001.8
Si layer0.232330677148
EVA0.5096020900.35
Tedlar0.10120012500.2
Table 3. Water properties (temperature-dependent expressions).
PropertyExpressionUnits
Viscosity [39] μ w = 1.788 × 10 3 exp 1.704 1448.538 T w + 521926.58 T w 2 Pa·s
Density [40] ρ w = 0.003 × T w 2 + 1.505 × T w + 816.781 kg/m3
Specific heat capacity [40] c w = 0.0000463 × T w 3 + 0.0552 × T w 2 20.86 × T w + 6719.637 J/(kg·K)
Thermal conductivity [40] λ w = 0.000007843 × T w 2 + 0.0062 × T w 0.54 W/(m·K)
Table 4. Grid independency.
GridCell No.Tout (°C)
1546,94133.581
2950,34833.819
31,357,65234.067
42,084,91234.194
52,417,69534.296
82,941,39734.327
93,597,61634.334
Table 5. The experimental and simulated results in the diurnal mode.
No.G (W/m2)Ta (°C)Tin (°C)Tout,exp (°C)Tout,sim (°C)RE (%)
197022.521.0129.9830.130.51
298023.623.0732.3532.610.81
398024.224.9034.3234.290.09
496423.727.6536.3236.781.25
591023.730.3837.4637.081.02
686024.333.3340.3440.640.76
779725.335.9242.4642.530.16
875725.138.6843.8344.070.54
Table 6. The experimental and simulated results in the nocturnal mode.
No.Ta (°C)Tin (°C)Tout,exp (°C)Tout,sim (°C)RE (%)
131.528.5728.7528.630.40
231.130.7930.6530.560.28
330.732.5632.0832.050.09
430.635.3234.2434.450.62
530.537.6736.2236.220.01
630.439.9338.0137.840.44
730.342.1840.0639.850.52
Table 7. Yield strength, maximum stress, and safety factor of the flexible cover under varying structural heights and vacuum levels.
Structural height h (mm)/vacuum level Pv (Pa)10/150015/150020/150025/150030/1500
Yield   strength ,   σ s (MPa) at 22 °C [49]17.97
Maximum   stress ,   σ m (MPa)5.577.098.399.3511.32
Safety   factor ,   f s (-)3.232.532.141.921.59
Table 8. The reference operating conditions.
Operating ConditionsDiurnal ModeNocturnal Mode
T in (°C)3030
T a (°C)2525
φ (%RH)5050
T sky (°C)99
G (W/m2)7000
V wind (m/s)1.51.5
m ˙ [kg/(s·m2)]0.0150.015
Table 9. The cost recovery period of the module.
The Increased Initial Investment/(CNY∙m−2)Electricity Price
Returns/(CNY∙m−2)
Payback
Period/Year
45052.068.64
Disclaimer/Publisher’s Note: The statements, opinions and data contained in all publications are solely those of the individual author(s) and contributor(s) and not of MDPI and/or the editor(s). MDPI and/or the editor(s) disclaim responsibility for any injury to people or property resulting from any ideas, methods, instructions or products referred to in the content.

