Abstract
Effective in situ H2S removal is essential for the utilization of small, remote natural gas wells, where centralized treatment is often unfeasible. This study presents an integrated environmental–economic assessment of two such processes, LO-CAT® and triazine-based absorption, using a scenario-based framework. Environmental impacts were assessed via the Waste Reduction Algorithm (WAR), considering both Potential Environmental Impact (PEI) generation and output across eight categories, while economic performance was analyzed based on equipment, chemical, energy, environmental treatment, and labor costs. Results show that the triazine-based process offers superior environmental performance due to lower toxic emissions, whereas LO-CAT® demonstrates better economic viability at higher gas flow rates and H2S concentrations. An integrated assessment combining monetized environmental impacts with economic costs reveals that the triazine-based process becomes competitive only if environmental impacts are priced above specific thresholds. This study contributes a practical evaluation framework and scenario-based dataset that support sustainable process selection for decentralized sour gas treatment applications.
1. Introduction
Global energy consumption is expected to increase by approximately 33% between 2024 and 2050, with natural gas contributing to around 42% of this growth, equivalent to an annual demand rise of about 2% [1]. Given its versatility, reliability, and relatively lower emissions of carbon dioxide and nitrogen oxides compared to other fossil fuels, natural gas is poised to play a pivotal role in meeting future energy needs.
Taking China as an example, both the government and industry stakeholders have set clear targets to increase natural gas production in response to growing demand and energy security concerns. A key strategy involves the development of stranded gas resources—natural gas reserves that are geographically remote or exist in small, economically challenging volumes [2]. By tapping into these unconventional sources, China aims to diversify its supply and enhance the resilience of its energy system.
Stranded gas resources are characterized by wide geographical dispersion and relatively small individual accumulations. Despite these limitations, they represent nearly 40% of the world’s total natural gas reserves [1]. While single-well production rates are usually low, the aggregate potential of these resources offers a significant supplementary source of global natural gas supply. Compared to large, centralized gas fields, the development of stranded gas resources exhibits several distinct characteristics. Small and distributed wells typically require lower investment due to their limited exploration and extraction scales, as well as simpler infrastructure needs. Moreover, their production is highly flexible, enabling rapid adjustment of output in response to market demand [3].
Given the low per-well output and production decline over time, the economic and technical viability of natural gas extraction from small, distributed wells relies heavily on mobility, reliability, operational simplicity, energy efficiency, and sufficient yield [1]. Among these operational considerations, sour gas sweetening plays a critical role, as hydrogen sulfide (H2S) present in raw gas poses significant technical, economic, and environmental challenges due to its toxicity and corrosiveness. Therefore, to support the efficient utilization of these wells, there is a pressing need for desulfurization units that are scalable, compact, and easily deployable.
Historically, stranded gas resources have received limited attention, resulting in relatively few studies focused on small-scale desulfurization technologies. Among the available references, Deng et al. [2] conducted a comparative analysis of three methods suitable for decentralized applications, including triazine-based absorption, LO-CAT®, and SourCat™, specifically targeting sour gas treatment from stranded sources. A sensitivity analysis using the Morris One-At-a-Time method revealed that desulfurization costs are primarily affected by raw material prices and parameters related to sulfur content. In the study by Mukta et al. [4], the same three desulfurization technologies were evaluated under varying gas flow rates and H2S concentrations. The results suggested that SourCat™ is the most cost-effective option for flow rates exceeding 100 thousand standard cubic feet per day, regardless of H2S concentration. In contrast, the triazine-based absorption proved more suitable for smaller systems, while LO-CAT® demonstrated favorable performance only under very high flow rates combined with low H2S concentrations. Similar studies have been reported in the literature [5,6], highlighting the value of process simulation in evaluating the techno-economic performance of small-scale desulfurization technologies under different operating conditions.
Previous studies on small-scale desulfurization processes have primarily focused on techno-economic analysis, with limited consideration given to the associated environmental impacts. Consequently, pollution emissions are often overlooked, and a unified, comprehensive evaluation framework for screening desulfurization technologies is lacking. To address these gaps, this study integrates both economic and environmental impact assessments across varying gas flow rates and H2S concentrations. Environmental impacts are monetized and incorporated into total cost calculations, thereby enabling a more holistic comparison of different scenarios through regression analysis. The main contributions of this study are twofold: (1) the application of the Waste Reduction algorithm (WAR) to evaluate the environmental impacts of small-scale desulfurization and (2) the integration of monetized environmental impacts with economic results to support comprehensive process evaluation. The remainder of this paper is organized as follows: Section 1 introduces the research background; Section 2 describes the processes and methodologies; Section 3 presents and discusses results; and Section 4 provides the conclusions and future directions.
2. Process and Methodology Description
In this study, two alternative small-scale natural gas sweetening processes are examined: triazine-based absorption process and LO-CAT® process. To ensure a fair and consistent comparison, both processes were evaluated under identical conditions representative of small-scale distributed gas wells. The detailed feed gas composition is provided in Table A1 in Appendix A. For regulatory compliance, the H2S removal efficiencies of both the chelated iron solution and the triazine solution were uniformly set at 99%, ensuring that the treated gas meets the Category II limit of China’s national standard [7], which restricts H2S concentration to a maximum of 20 mg/m3. Moreover, as methane does not chemically react with either solution, no natural gas loss occurs in either process. These parameters and assumptions were consistently applied across all scenarios to maintain comparability in the environmental and economic assessments.
2.1. Process Description
2.1.1. LO-CAT® Process
The LO-CAT® process employs a patented wet scrubbing and liquid redox system that utilizes a chelated iron solution to convert H2S into elemental sulfur. In the absorber vessel, H2S present in the raw gas is absorbed by a sodium ferric ethylenediaminetetraacetate solution (commonly referred to as the LO-CAT solution), where ferric ions oxidize H2S to solid sulfur while being reduced to ferrous ions (Equation (1)). In the oxidizer vessel, oxygen from ambient air reoxidizes the ferrous ions back to ferric ions, which are then recycled to the absorber (Equation (2)) [8]. A pH level between 8 and 9 is maintained using NaOH or KOH to prevent iron precipitation and to enhance H2S absorption efficiency [2]. A fresh LO-CAT solution is periodically added to compensate for losses associated with wet sulfur cake removal. The absence of toxic chemicals, combined with the low-cost regeneration capability, makes this process particularly well-suited for small and distributed gas wells.
Figure 1 illustrates the process flow diagram of the LO-CAT® system. Raw gas first enters a separator to remove moisture, thereby preventing dilution of the LO-CAT solution, before flowing into the bottom of the oxidation tower. Simultaneously, the LO-CAT solution is introduced at the top of the tower. Within the tower, the dried raw gas undergoes absorption and redox reactions with the solution, effectively removing H2S. The purified gas is discharged to the natural gas pipeline, while the elemental sulfur and ferrous ion-rich liquid stream exits from the bottom of the tower and is directed to the regeneration tower. In the regeneration tower, ferrous ions are oxidized by oxygen from injected air and, together with the replenished LO-CAT solution, are recycled back to the oxidation tower, thus completing the redox cycle. Solid sulfur is subsequently separated by filtration, with the mass fraction of wet sulfur cake ranging from 30% to 90%, depending on the filter type. Based on the literature [5], a representative mass fraction of 48% is adopted in this study to balance water retention with solution recovery efficiency.
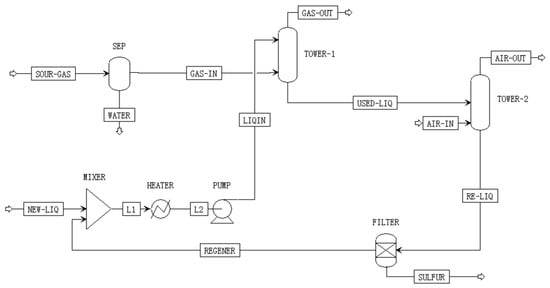
Figure 1.
LO-CAT® process flow diagram.
2.1.2. Triazine-Based Absorption Process
Triazines are six-membered rings composed of three nitrogen and three carbon atoms [9]. Among them, 1,3,5-tris-(2-hydroxyethyl) hexahydro-s-triazine, commonly referred to as MEA triazine, is the most frequently used triazine for H2S removal [10]. As depicted in Figure 2, one mole of triazine reacts with two moles of H2S to produce dithiazine while releasing two moles of amine. The byproducts, thiadiazine and dithiazine, are highly water-soluble, biodegradable, and exhibit very low toxicity [11]. Triazines perform optimally under neutral to alkaline pH conditions and are particularly effective for removing low concentrations of H2S.
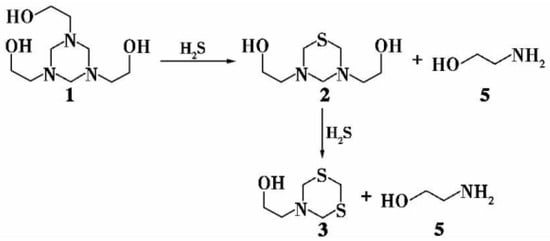
Figure 2.
Reaction of H2S with Triazines.
Direct injection of triazine into H2S-containing gas streams enhances scavenging efficiency and reduces the overall chemical consumption [12]. In this study, the process flow diagram of the triazine-based absorption system is illustrated in Figure 3, adapted from the literature [4]. Raw gas, at temperatures ranging from 10 to 70 °C, enters the absorption tower containing a 52 wt% triazine-based scavenger solution. The gas–liquid mixture then flows into a decanter, where phase separation occurs. Purified gas exits from the top of the decanter and is routed to the natural gas pipeline, while the spent scavenger is discharged from the bottom. To ensure that the H2S concentration remains below 20 ppm and to prevent solid formation, triazine is injected with a 10% excess. Reference [13] reports that triazine-based desulfurization products are practically non-toxic, as indicated by their median effective concentration (EC50) values. According to the Petroleum Refining Pollutant Discharge Standard [14] and common industrial practices in China, the reacted triazine can be discharged directly. However, despite their low toxicity and environmentally benign properties, all disposal practices must comply with local environmental regulations, and additional requirements may apply depending on site-specific permits and effluent discharge standards.
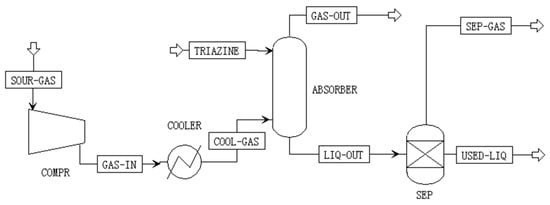
Figure 3.
Triazine-based absorption process flow diagram.
2.2. Methodology Description
To facilitate a comprehensive comparison between the two alternative processes, multiple scenarios were developed based on variations in gas flow rate and H2S concentration in the feed gas. Subsequently, the methodologies employed for environmental impact assessment (using the WAR [15]) and economic evaluation are described in detail.
2.2.1. Scenarios Formation
In this study, three levels of the gas flow rate and corresponding H2S concentrations were defined based on operational data from Southwest Oil & Gas Field Company, PetroChina (Sichuan, China) and relevant Chinese national standards. Wells producing between 1 × 10⁴ and 1 × 10⁵ Nm3/day are typically classified as small-scale, while those below 1 × 10⁴ Nm3/day are generally considered uneconomical to develop. Wells exceeding 1 × 10⁵ Nm3/day are regarded as medium-scale and are suitable for conventional desulfurization technologies such as amine absorption. The selected H2S concentration range of 200–2000 ppm falls within the “low-sulfur” category defined by China’s natural gas pool standard [16], and aligns with field data commonly observed in Southwest China. This combination of gas flow rates and H2S levels defines a realistic and technically feasible operating window for the evaluated desulfurization processes.
As summarized in Table 1, these scenarios comprehensively capture the variability in both gas throughput and sulfur content, reflecting typical operating conditions of small-scale and distributed gas wells. This structured approach enables a detailed and systematic comparison of the two alternative sweetening processes. For clarity and ease of reference, each scenario is labeled using a two-letter code; for example, ‘LM’ denotes a scenario with a low flow rate and medium H2S concentration. Based on the defined scenarios and following the methodology in [4], Aspen Plus was employed to simulate material flows for both the LO-CAT® and triazine-based absorption processes, which served as the basis for subsequent environmental and economic assessments. The two alternative processes were modeled using different thermodynamic approaches: the Non-Random Two-Liquid (NRTL) model for the triazine-based process and the ELECNRTL model for LO-CAT®. In the triazine system, H2S reacts rapidly and stoichiometrically with excess triazine. Given the fast kinetics and the predominance of liquid-phase interactions among organic components and sulfur species, the NRTL model was chosen to describe the system’s non-ideal liquid behavior. In contrast, the LO-CAT® process involves complex aqueous-phase chemistry with ionic species such as chelated iron (Fe3+/Fe2+), sulfide (HS−/S2−), and hydroxide (OH−). The ELECNRTL model, which extends NRTL to electrolyte systems, captures both short-range molecular and long-range electrostatic interactions, making it well-suited for modeling reactive absorption and redox chemistry in LO-CAT® [8]. For more detailed information regarding the simulation setup, Table A2 in Appendix A can be referred to.

Table 1.
Scenario definitions based on gas flow rate and H2S concentration levels.
2.2.2. Environmental Analysis
In this study, the Waste Reduction Algorithm (WAR) [15,17] is employed to evaluate the environmental impacts of the two alternative processes. Based on the concept of an environmental impact balance (analogous to mass and energy balances), the WAR utilizes process data (e.g., flow rates, mass fractions, energy consumption) in conjunction with toxicological information to quantify the Potential Environmental Impacts (PEIs) associated with a process [18]. Specifically, PEIs refer to the environmental burden that a given amount of material or energy would impose if released directly into the environment [19]. For steady-state processes, the PEI balance is expressed by the equation shown in Equation (3).
In Equation (3), and represent the input and output PEIs associated with the chemical process, while and represent those of the energy generation process. and refer to the PEI contributions from waste energy losses in the chemical and energy generation processes, respectively, and is the rate of PEI generation within the system.
As noted in the literature [19], the two alternative natural gas sweetening processes do not involve waste energy emissions, and the PEI associated with energy-related emissions is typically negligible compared to that associated with material emissions. Therefore, Equation (3) can be simplified accordingly, as shown in Equation (4).
Following established practice [20], two categories of PEI indicators are considered in this study: those associated with process output (PEIout = ), and those associated with PEI generation within the system (PEIgen = ). According to the literature [21], (or ) and for calculating PEIout and PEIgen can be mathematically expressed as in Equation (5).
In these equations, represents the mass (or energy) flow rate of stream j (input or output), xkj is the fraction of chemical species (or energy form) k in stream j, denotes the specific PEI of chemical (or energy form) k in impact category l, and is the relative weighting factor assigned to category l. In the WAR, toxicological impacts are classified into eight distinct categories, as summarized in Table 2. Following standard practice [17], equal weighting was applied to all eight impact categories. It is important to note that these weights can be adjusted to reflect the preferences of decision-makers or comply with local environmental regulations concerning pollutant limits.
Table 2.
Environmental impact categories used in the WAR [22].
2.2.3. Economic Analysis
This study evaluates the economic performance of the triazine-based absorption and LO-CAT® processes across all scenarios by calculating the H2S removal cost, which includes equipment investment, chemical consumption, energy usage, environmental treatment fees, and labor costs. A three-year operational period was assumed for both processes, based on the typical performance of small-scale desulfurization units, which generally maintain stable output during the initial years followed by a gradual decline. This assumption is supported by relevant research [2,5]. An annual operating time of 330 days was adopted, reflecting both industry practices and empirical experience. The economic analysis was conducted accordingly to ensure consistency with realistic operating conditions and established industry norms. The baseline data and key assumptions used in the economic evaluation, based on small-scale gas well operations in Sichuan, China, are summarized in Table A3 in Appendix A.
3. Results and Discussion
This section first presents the environmental and economic analysis results for the defined scenarios. Based on these findings, a comprehensive comparison of the two processes is provided, followed by a discussion of their theoretical and practical implications.
3.1. Results
3.1.1. Environmental Analysis Results
After applying the WAR, the environmental analysis results for the investigated scenarios were obtained. It is important to note that the reacted triazine solution is discharged directly from the system. In contrast, the chelated iron solution used in the LO-CAT® process is designed for full recycling but still experiences unavoidable losses [23]. Based on operational data and research reports [24], the average loss is estimated at approximately 0.267 tons of chelated iron solution per ton of sulfur removed. Accordingly, both the discharged triazine solution and the chelated iron losses were modeled as output streams in the WAR analysis to ensure accurate quantification of environmental impacts.
As an illustrative case, the high-gas-flow-rate scenario (10 × 104 m3/day) was selected to demonstrate the results. The output and generation rates of PEIs for both the LO-CAT® process and the triazine-based absorption process at different H2S concentrations are shown in Figure 4 and Figure 5, respectively.
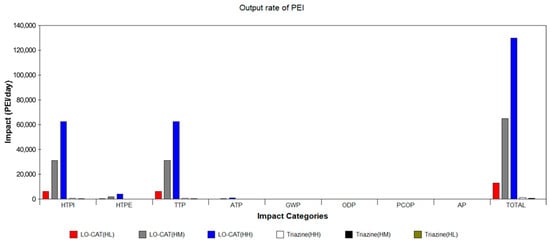
Figure 4.
Output rate of PEIs for the two processes under the high-gas-flow-rate scenario.
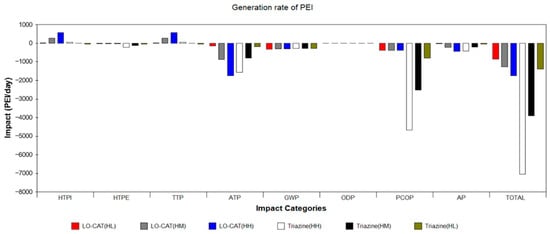
Figure 5.
Generation rate of PEIs for the two processes under the high-gas-flow-rate scenario.
Firstly, in terms of PEIout, the total environmental impact of the LO-CAT® process is consistently higher than that of the triazine-based absorption process under identical conditions, with the overall impact increasing as the H2S concentration rises. Within the LO-CAT® process, the dominant contributors to environmental impact are HTPI and TTP, which together account for more than 90% of the total PEIout. Additional contributions are observed from HTPE and ATP, whereas categories such as GWP, ODP, PCOP, and AP have a negligible impact. The elevated PEI output rate in the LO-CAT® process is primarily attributed to the generation of wet sulfur cake, which is classified as hazardous waste due to residual LO-CAT solution if not properly treated. In contrast, the triazine-based absorption process primarily produces reacted triazine byproducts (e.g., thiodiazine), which are known to be readily biodegradable and exhibit relatively low toxicity [25]. Consequently, no significant contributions to the eight categorized environmental impact indicators are observed for this process, as illustrated in Figure 4.
Figure 5 presents the PEIgen of both processes, where positive values indicate environmental burdens and negative values reflect environmental benefits. The LO-CAT® process exhibits negative impacts in HTPI and TTP while providing emission reduction benefits in ATP, GWP, PCOP, and AP. Overall, the LO-CAT® process demonstrates a net positive environmental effect in terms of the PEI generation rate, with these benefits increasing proportionally with higher H2S concentrations under the high-gas-flow-rate scenario. In comparison, the triazine-based absorption process displays superior environmental performance regarding PEIgen. It notably achieves substantial reductions in the PCOP indicator and shows pronounced environmental benefits across ATP, AP, GWP, and HTPE. Moreover, these positive effects also intensify with increasing H2S content.
Similarly, the PEI output and generation rates for the medium- and low-flow rate scenarios were calculated using the WAR. For clarity, Figure 6 presents only the total PEI values (output and generation) under different H2S concentrations. Overall, both the LO-CAT® and triazine-based processes show positive PEIout values across all treatment capacities, indicating negative environmental impacts from their effluents. However, the LO-CAT® consistently exhibits significantly higher emissions than the triazine-based process, regardless of the gas flow rate. Additionally, the total PEIout increases with higher gas flow rate and H2S concentrations.
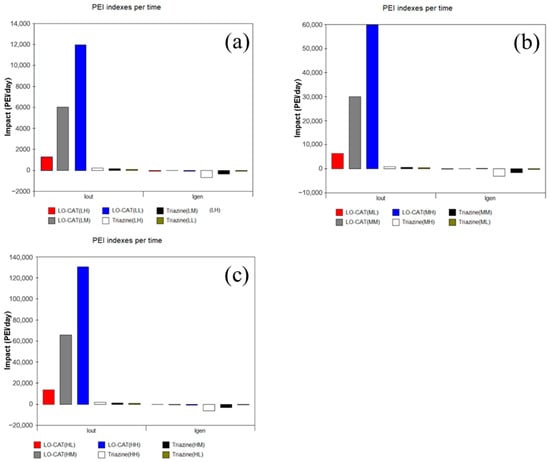
Figure 6.
PEIout and PEIgen for the two processes with (a) low-, (b) medium-, and (c) high-flow rates.
From the perspective of the PEI generation rate, both processes yield negative values, indicating an overall environmental benefit from desulfurization. For the LO-CAT® process, PEIgen remains slightly below zero with minor fluctuations across scenarios, suggesting that while key pollutants such as H2S are effectively removed, the release of by-products like wet sulfur cake limits the net environmental gain. In contrast, the triazine-based process demonstrates a more pronounced reduction in PEIgen, attributable to the low environmental toxicity of the reacted triazine solution.
3.1.2. Economic Analysis Results
The economic analysis of the two small-scale natural gas sweetening processes includes equipment investment (C1), chemical consumption (C2), energy cost (C3), environmental treatment fee (C4), and labor cost (C5). Since small-scale gas wells typically experience a decline in productivity after approximately three to five years, in line with this operational characteristic, the costs are categorized into one-time investment (C1) and three-year operating costs (C2–C5). As an example, the cost breakdown under the high gas flow rate scenario (10 × 104 m3/day) is offered below.
Figure 7 shows that under a high flow rate and H2S concentrations ranging from 200 to 2000 ppm, the total three-year cost for the LO-CAT® process increases from 7.90 to 9.35 million Chinese Yuan (CNY), reflecting a gradual rise with increasing H2S levels. As observed, equipment, energy, and labor costs remain relatively constant due to the fixed gas flow rate and represent the major cost components. In contrast, chemical consumption (LO-CAT solvent) and environmental treatment (wet sulfur cake) costs increase proportionally with H2S concentration. For example, at 200 ppm, the solvent and disposal costs account for 3.2% and 0.45% of the total, respectively, rising to 14.9% and 3.6% at 2000 ppm.
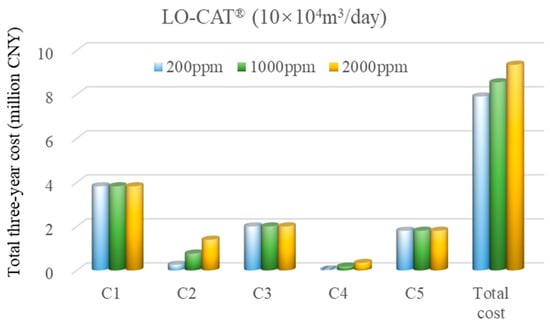
Figure 7.
Cost breakdown for the LO-CAT® process under the high-flow-rate scenario.
As shown in Figure 8, for the triazine-based absorption process under the high-gas-flow-rate scenario, the total cost is primarily driven by chemical consumption. With increasing H2S concentrations, the share of chemical costs rises sharply from 67.5% at 200 ppm to 92.5% at 2000 ppm. The remaining costs, i.e., energy, labor, and equipment, contribute marginally. Notably, this process avoids environmental treatment costs due to the inherently non-toxic and environmentally benign nature of its emissions.
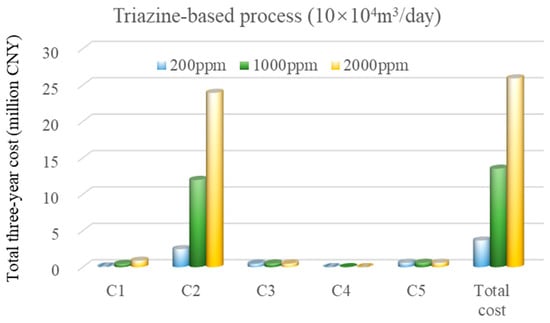
Figure 8.
Cost breakdown for the triazine-based absorption process under the high-flow-rate scenario.
The above analysis outlines the cost breakdown of the two processes under the high-flow-rate scenario. To facilitate comparison across different flow rates, the unit cost per gas volume, obtained by normalizing the total cost to gas throughput, is presented in Figure 9.
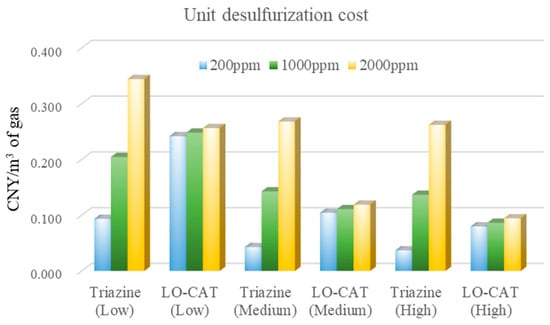
Figure 9.
Unit desulfurization costs of the two processes across all investigated scenarios.
As shown in Figure 9, the unit desulfurization cost for the LO-CAT® process decreases with increasing gas volume. Specifically, when the flow rate rises from 1 × 10⁴ to 5 × 10⁴ m3/day, the cost drops from 0.242–0.256 to 0.104–0.119 CNY/m3. A further increase to 10 × 104 m3/day results in only a slight reduction to 0.080–0.094 CNY/m3. Notably, at a fixed gas volume, the cost remains relatively stable despite large variations in H2S concentration (200–2000 ppm).
In contrast, for the triazine-based absorption process, unit costs at medium and high flow rates are comparable and lower than those at low flow rates under the same H2S level. However, the unit cost is highly sensitive to H2S concentration and rises significantly with increasing feed gas content. For example, at a high flow rate, the cost increases from 0.037 CNY/m3 with low H2S concentration to 0.262 CNY/m3 with high H2S concentration.
To further explore cost drivers, a ±20% variation was applied to each individual cost item in the sensitivity analysis (see Figure A1 in the Appendix A). The results show that the economic performance of the triazine-based absorption process is mainly influenced by chemical consumption (C2), with labor cost (C5) also exerting a noticeable effect. By contrast, for the LO-CAT® process, equipment investment (C1) is the primary factor impacting overall economic performance, while energy cost (C3) and labor cost (C5) also contribute to cost fluctuations to some extent.
Based on this economic analysis, the triazine-based absorption process is more cost-effective than LO-CAT® at an H2S concentration of 200 ppm. At 1000 ppm, it remains economical at low gas flow rates, whereas LO-CAT® becomes more favorable at medium and high flow rates. When the H2S concentration reaches 2000 ppm, LO-CAT® consistently demonstrates lower unit costs than the triazine-based process across the entire gas flow range.
3.2. Discussion
3.2.1. Comprehensive Comparison Based on Monetized PEI
The analysis reveals that the triazine-based absorption process is both more economical and environmentally favorable than LO-CAT® under low-flow-rate conditions. However, although the economic advantage of the triazine-based process diminishes with increasing H2S concentration, particularly at higher flow rates, its environmental benefits become more pronounced. To reconcile the trade-off between economic and environmental considerations, this study adopts an integrated assessment approach that monetizes environmental impacts and incorporates them into the total cost, enabling a comprehensive comparison of the two alternative processes.
In the WAR analysis, PEIgen is typically more suitable during early-stage process design, as it provides a comprehensive view of potential environmental impacts across all units, supporting system-wide optimization. For instance, in full-chain natural gas treatment, including dehydration, desulfurization, decarbonization, and liquefaction, PEIgen helps identify environmental hotspots for targeted improvement. However, in this study, both evaluated processes exhibit slightly negative PEIgen values, indicating limited environmental benefits from H2S removal alone. Consequently, PEIout was adopted to quantify and monetize the impacts, as it more accurately reflects the actual environmental burden discharged from the desulfurization process. This choice not only aligns with practical regulatory concerns but also follows established practices in related studies [20].
Notably, the normalized PEIout (NPEIout) values across different gas flow rates show high consistency (Table 3). Relative deviations from the mean are within 6%, indicating that H2S concentration is the dominant factor affecting PEI output per unit volume, while the scale effect is negligible. Accordingly, the average NPEIout values across different capacities were used for plotting and curve fitting in Figure 10. Both the LO-CAT® and triazine-based processes exhibit a strong linear relationship between NPEIout and H2S concentration, with R2 = 1 for each process.
Table 3.
The values and normalized data for the output rate of PEI across all the scenarios.
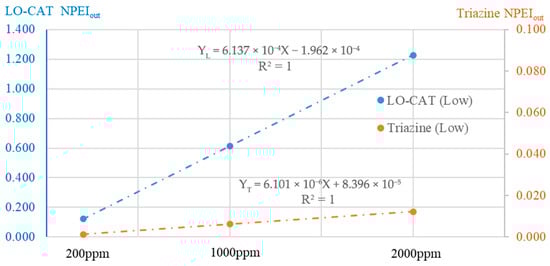
Figure 10.
Linear correlation between normalized PEIout and H2S concentration.
Similarly, the economic analysis results under low-, medium-, and high-flow-rate scenarios were fitted to trend curves, with the corresponding equations presented in Figure 11a–c. For instance, as shown in Figure 11a (low-flow scenario), the unit desulfurization costs for the triazine-based process and LO-CAT® converge at an H2S concentration of 1330 ppm, both reaching 0.251 CNY/m3, indicating equivalent economic performance at this point.
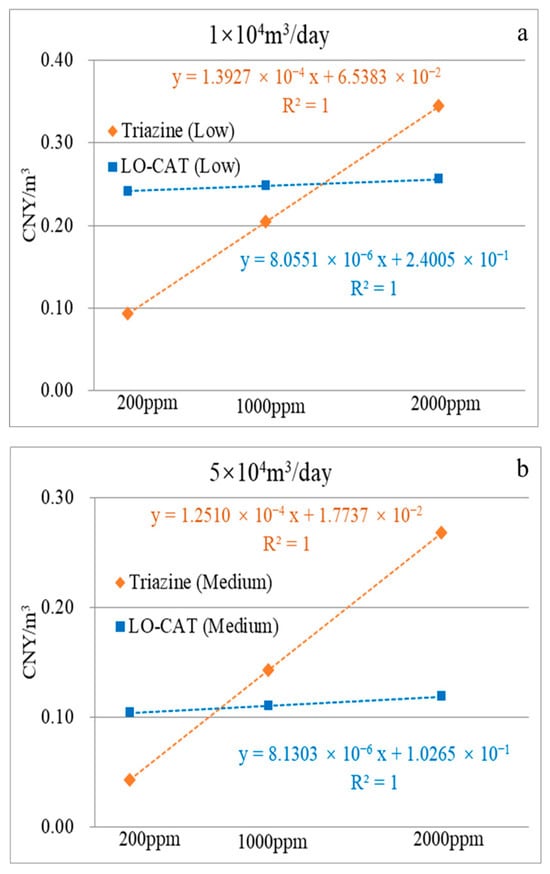
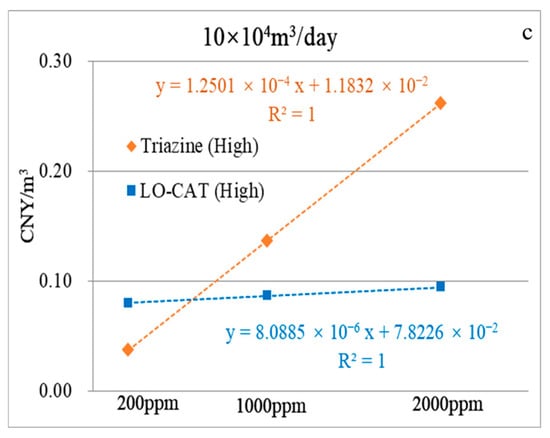
Figure 11.
Linear correlation between unit desulfurization cost and H2S concentration at low- (a), medium- (b), and high-flow rates (c).
To enable a comprehensive comparison, environmental impacts were monetized using NPEIout and a unit cost coefficient (CPEI). Under low-flow conditions, the triazine-based process incurs lower unit desulfurization costs than LO-CAT® when H2S concentration is ≤1330 ppm. By integrating the regression results from Figure 10 and Figure 11a, the total cost equations were derived as 0.2562 + 1.2272 × CPEI for LO-CAT® (Equation (6)), and 0.3400 + 0.0123 × CPEI for the triazine-based process (Equation (7)).
For the LO-CAT® process,
For the triazine-based process,
At CPEI = 0.0723 CNY/PEI and an H2S concentration of 2000 ppm, both processes reach the same total cost (0.3449 CNY/m3). Thus, across the full range of H2S concentrations (200–2000 ppm), the triazine-based process remains the more cost-effective option under this environmental pricing scenario.
As shown in Figure 11b,c, the triazine-based process remains more cost-effective at H2S concentrations of ≤726 ppm for the medium-flow scenario and ≤567 ppm for the high-flow scenario. To reach cost parity at 2000 ppm when accounting for monetized NPEIout, higher environmental cost coefficients are required—namely, 0.1226 CNY/PEI for the medium-flow and 0.1378 CNY/PEI for the high-flow scenario, corresponding to total costs of 0.2694 and 0.2635 CNY/m3, respectively.
3.2.2. Practical and Theoretical Implications
Based on environmental and economic analyses, along with the integrated comparison using monetized PEIout, this study offers both practical and theoretical implications. From a practical standpoint, the following key insights can be highlighted:
- At low-gas-flow rates (1 × 10⁴ m3/day) and H2S concentrations ≤ 1330 ppm, the triazine-based absorption process proves to be both economically and environmentally advantageous, making it the recommended option. In contrast, under higher-flow conditions (5 × 10⁴ – 10 × 104 m3/day) and elevated H2S levels (>726 ppm for medium flow or >567 ppm for high flow), the LO-CAT® process offers a more favorable cost–benefit ratio and becomes the preferred choice. These findings provide scenario-specific guidance for process selection, enabling more informed and balanced decisions based on operational scale and H2S concentration.
- From a cost-control perspective, the LO-CAT® process is particularly sensitive to chemical consumption and the environmental treatment costs associated with wet sulfur cake disposal, both of which escalate with increasing H2S concentrations. Enhancing solvent efficiency and improving sulfur by-product management are therefore critical for reducing operational expenses. As for the triazine-based process, chemical consumption constitutes the dominant cost component and is highly dependent on H2S content, underscoring the importance of optimizing chemical utilization or exploring cost-effective alternative scavengers to reduce the unit desulfurization cost.
- From an environmental perspective, the LO-CAT® process generates wet sulfur cake classified as hazardous waste, requiring stringent environmental management to avoid secondary pollution. In contrast, the triazine-based absorption process emits non-toxicity by-products and should prioritize continuous monitoring and optimization to enhance its positive influence on environmental indicators. Moreover, both processes contribute positively to the PEI generation rate due to their effective H2S removal, supporting their application in small-scale or remote well scenarios where environmental benefits and operational simplicity are essential.
In addition, the theoretical implications could be summarized as follows:
- The integration of the WAR with scenario-based economic analysis across different gas flow rates and H2S concentrations demonstrates the robustness of this combined approach for assessing the environmental and economic performance of desulfurization processes. The observed strong linear relationships between PEIout (or unit cost) and H2S concentration not only validate the model’s predictive capability but also provide a solid foundation for future methodological refinements and broader applications in similar process evaluations.
- By incorporating monetized environmental burdens (NPEIout) into total cost analysis, this study develops a systematic dual-perspective decision-making framework that concurrently considers economic and environmental factors. This approach provides both methodological insights and empirical evidence to advance decision-making theory in engineering, reinforcing its theoretical basis and promoting broader industrial application.
4. Conclusions and Future Direction
This study conducted a comparative environmental and economic analysis of two desulfurization processes suitable for on-site H2S removal in small-scale, remote natural gas wells. The environmental assessment employed the WAR, evaluating both the output rate and generation rate of Potential Environmental Impact (PEI) across eight impact categories. Overall, both processes demonstrated positive performance in PEI generation, primarily due to effective H2S removal. However, regarding PEI output, each process introduced different levels of environmental burden. Specifically, the LO-CAT® process shows higher environmental impacts due to the production of wet sulfur cake, a hazardous byproduct. Within the range of gas flow rates and H2S concentrations examined, the triazine-based absorption process consistently outperformed LO-CAT®, delivering more favorable environmental outcomes.
In the economic analysis, several cost components were considered, including equipment investment, chemical consumption, energy costs, environmental treatment fees, and labor expenses. The results indicate that for the LO-CAT® process, equipment investment, energy, and labor costs are the primary contributors and remain relatively stable due to the fixed gas flow rate. In contrast, the cost of the triazine-based process is highly sensitive to H2S concentration, increasing significantly with rising sulfur content in the feed gas. Overall, the LO-CAT® process demonstrates superior economic performance across the majority of operating conditions, particularly at medium-to-high-gas-flow rates and elevated H2S concentrations.
Considering the trade-offs between environmental and economic performance, this study proposes an integrated comparison approach by monetizing the PEI output and combining it with economic analysis results. The findings indicate that for the triazine-based process, which offers clear environmental benefits but incurs relatively higher economic costs, to fully outperform the LO-CAT® process, the environmental impact would need to be valued at 0.0723, 0.1226, and 0.1378 CNY per PEI under low-, medium-, and high-flow-rate scenarios, respectively. Under these pricing conditions, even at an H2S concentration of 2000 ppm, the total costs, including monetized environmental impacts, of both processes would be equivalent.
In summary, this study investigates in situ H2S removal processes tailored for small-scale and remote natural gas wells. It presents the first comprehensive, scenario-based evaluation of their environmental, economic, and integrated performance across varying gas flow rates and H2S concentrations. The results offer meaningful insights into the comparative strengths of two representative desulfurization processes. Additionally, the proposed analytical framework provides methodological support for future industrial-scale assessments, with implications for both research and practical application.
Despite these contributions, several areas require further exploration. While the WAR effectively quantifies the generation and output rates of potential environmental impacts within defined process boundaries, future research could incorporate Life Cycle Assessment (LCA) to capture the full life-cycle environmental impacts. In particular, LCA can be applied to evaluate multiple stages involved in the small-scale natural gas system, including upstream extraction, midstream processing, downstream transportation and distribution, and even post-decline well management. This comprehensive scope enables a holistic understanding of environmental trade-offs across the entire value chain. This study focuses on the LO-CAT® and triazine-based absorption processes; however, emerging alternatives such as SourCat™ should be considered in future evaluations. SourCat™ applies catalytic oxidation to convert H2S into elemental sulfur directly within the gas stream and shows potential benefits in terms of both cost and environmental impact. Its exclusion in this work is mainly due to the lack of publicly available kinetic and thermodynamic data. Future studies are encouraged to include such technologies, as relevant data become available, to support a more complete comparison of desulfurization options. Furthermore, it is worth noting that the present analysis is confined to environmental and economic dimensions. Future research should expand the assessment framework to incorporate additional technical factors (e.g., mobility and maintenance complexity), as well as social aspects (e.g., policy support and inherent safety). A more comprehensive evaluation of this kind would better reflect the multifaceted nature of sustainability. In this context, multi-criteria decision-making (MCDM) approaches offer a robust means of navigating trade-offs and facilitating the selection of optimal desulfurization technologies.
Author Contributions
Q.W. contributed to the study conception; Methodology design and Data collection were performed by Q.W., X.C. and X.P.; Formal analysis and investigation were conducted by all the authors; The first draft of the manuscript was written by Q.W. and D.X. Funding acquisition: D.X.; Supervision: P.L. and D.X. All authors have read and agreed to the published version of the manuscript.
Funding
This study was supported by the Natural Science Foundation of Chongqing, Grant No. CSTB2023NSCQ-MSX0826; Science and Technology Research Program of Chongqing Municipal Education Commission, China, Grant No. KJQN202101512; and Foundation of Chongqing University of Science & Technology (Grant No. 2019001).
Data Availability Statement
All data generated or analyzed during this study are included in this published article [and its Appendix A].
Conflicts of Interest
Authors Qing Wen, Xin Chen, Xingrui Peng, Yanhua Qiu, Kunyi Wu, Yu Lin are employed by the company Southwest Oil & GasField Company, PetroChina. The remaining authors declare that the research was conducted in the absence of any commercial or financial relationships that could be construed as a potential conflict of interest.
Abbreviations
The following abbreviations are used in this manuscript:
| AP | Acidification Potential |
| ATP | Aquatic Toxicity Potential |
| CNY | Chinese Yuan |
| GWP | Global Warming Potential |
| HTPE | Human Toxicity Potential by Exposure |
| HTPI | Human Toxicity Potential by Ingestion |
| LCA | Life Cycle Analysis |
| MCDM | Multi-Criteria Decision-Making |
| NRTL | Non-Random Two-Liquid |
| ODP | Ozone Depletion Potential |
| PCOP | Photochemical Oxidation or Smog Formation Potential |
| PEI | Potential Environmental Impact |
| PEIgen | Generation Rate of PEI |
| PEIout | Output Rate of PEI |
| TTP | Terrestrial Toxicity Potential |
| WAR | Waste Reduction Algorithm |
Appendix A
Table A1.
Gas compositions used in this work under different H2S concentrations.
Table A1.
Gas compositions used in this work under different H2S concentrations.
| Component | 200 ppm H2S | 1000 ppm H2S | 2000 ppm H2S |
|---|---|---|---|
| CO2 | 0.0200 | 0.0200 | 0.0200 |
| CH4 | 0.9411 | 0.9403 | 0.9393 |
| H2S | 0.0002 | 0.0010 | 0.0020 |
| N2 | 0.0321 | 0.0321 | 0.0321 |
| C2H6 | 0.0050 | 0.0050 | 0.0050 |
| C3H8 | 0.0009 | 0.0009 | 0.0009 |
| n-Butane | 0.0002 | 0.0002 | 0.0002 |
| n-Pentane | 0.0002 | 0.0002 | 0.0002 |
| n-Hexane | 0.0003 | 0.0003 | 0.0003 |
| CO2 | 0.0200 | 0.0200 | 0.0200 |
Table A2.
Modules and parameters in the simulations.
Table A2.
Modules and parameters in the simulations.
| Main Unit in Figure 1 | Simulation block | Description |
| Sep | Flash | Removes moisture from the raw gas |
| Tower-1 | RStoic | Simulates the oxidation of H2S to elemental sulfur and the reduction of Fe3+ to Fe2+ |
| Tower-2 | RStoic | Simulates the oxidation of Fe2+ back to Fe3+ by oxygen from air |
| Filter | Sep | Separates the sulfur produced from the iron chelate solution |
| Main Unit in Figure 3 | Simulation block | Description |
| COMPR | Compr | Stabilizes the inlet pressure of the raw gas |
| COOLER | Heater | Cools the compressed raw gas to 50 °C |
| ABSORBER | RStoic | Simulates the reaction between triazine and H2S |
| SEP | Sep | Separates the desulfurized natural gas from the reacted triazine solution |
Table A3.
Data for the economic assessment.
Table A3.
Data for the economic assessment.
| Triazine-Based Absorption | LO-CAT® | |
|---|---|---|
| Chemicals | 17.5 CNY/kg triazine | 15 CNY/kg LO-CAT solvent |
| Energy | 0.84 CNY/kwh | 0.84 CNY/kwh |
| Environmental treatment fee | - | 115 CNY/ton wet sulfur cake |
| Labor cost | CNY 100,000 per person per year | |


Figure A1.
Sensitivity analysis considering ± 20% variation in key cost factors.
References
- Kim, J.; Seo, Y.; Chang, D. Economic evaluation of a new small-scale LNG supply chain using liquid nitrogen for natural-gas liquefaction. Appl. Energy 2016, 182, 154–163. [Google Scholar] [CrossRef]
- Deng, Y.S.; Xu, S.; Webb, K.; Wright, H.; Dimick, P.S.; Cremaschi, S.; Eden, M.R. Sensitivity Analysis of Desulfurization Costs for Small-Scale Natural Gas Sweetening Units. In Computer Aided Chemical Engineering; Elsevier: Amsterdam, The Netherlands, 2020; Volume 48, pp. 973–978. [Google Scholar] [CrossRef]
- Shams, A.; Eini, S.; Farhadi, F. The evaluation of the flexibility of four small-scale LNG liquefaction processes using multiple natural gas feedstocks. Energy 2025, 325, 136138. [Google Scholar] [CrossRef]
- Mukta, C.B.; Cremaschi, S.; Eden, M.R. Operational Envelopes of Cost-effective Sour Gas Desulfurization Processes. In Computer Aided Chemical Engineering; Elsevier: Amsterdam, The Netherlands, 2022; Volume 49, pp. 1009–1014. [Google Scholar] [CrossRef]
- Xu, S.; Deng, Y.S.; Webb, K.; Wright, H.; Dimick, P.S.; Cremaschi, S.; Eden, M.R. Sour Gas Sweetening Technologies for Distributed Resources—A Process Simulation Study. In Computer Aided Chemical Engineering; Elsevier: Amsterdam, The Netherlands, 2020; Volume 48, pp. 1483–1488. [Google Scholar] [CrossRef]
- Xu, S.; Deng, Y.; Cremaschi, S.; Eden, M.; Webb, K.; Wright, H.; Dimick, P. Process Simulation Study of Sour Gas Sweetening Technologies for Distributed Resources. In Proceedings of the AIChE Annual Meeting, Orlando, FL, USA, 10–15 November 2019. [Google Scholar]
- GB Standard 17820-2018; Standardization Administration of China. Natural Gas: Beijing, China, 2018.
- Kazemi, A.; Malayeri, M.; Kharaji, A.G.; Shariati, A. Feasibility study, simulation and economical evaluation of natural gas sweetening processes—Part 1: A case study on a low capacity plant in iran. J. Nat. Gas Sci. Eng. 2014, 20, 16–22. [Google Scholar] [CrossRef]
- Taylor, G.; Matherly, R. Structural Elucidation of the Solid Byproduct from the Use of 1,3,5-Tris(hydroxyalkyl)hexahydro-s-triazine Based Hydrogen Sulfide Scavengers. Ind. Eng. Chem. Res. 2011, 50, 735–740. [Google Scholar] [CrossRef]
- Taylor, G.; Smith-Gonzalez, M.; Wylde, J.; Oliveira, A.P. H2S Scavenger Development During the Oil and Gas Industry Search for an MEA Triazine Replacement in Hydrogen Sulfide Mitigation and Enhanced Monitoring Techniques Employed During Their Evaluation. In Proceedings of the SPE International Conference, Galveston, TX, USA, 16–19 February 2019. [Google Scholar]
- Subramaniam, R.; Yasa, S.; Bertrand, T.; Fontenot, B.; Dupuis, T.F.; Hernandez, R. Advanced simulation of H2S scavenging process with triazine at different depths of gas well. J. Nat. Gas Sci. Eng. 2018, 49, 417–427. [Google Scholar] [CrossRef]
- Eylander, J.G.R.; Salma, H.A.H.T.; Yuan, M.; Callaway, M.; Johnstone, J.R. The development of low-sour gas reserves utilizing direct-injection liquid hydrogen sulphide scavengers. In Proceedings of the SPE Annual Technical Conference and Exhibition, Houston, TX, USA, 20–22 October 2001. [Google Scholar]
- Liu, L.; Guo, J.; Xue, X.; Wei, W.; Zhang, R.; Zhang, D.; Ke, C.; Zhang, Z. Desulfurization performance and products evaluation of three triazine desulfurizers. Mod. Chem. Ind. 2020, 40, 113–117. (In Chinese) [Google Scholar]
- GB Standard 31570-2015; Emission Standard of Pollutants for Petroleum Refining Industry. Standardization Administration of China: Beijing, China, 2015. (In Chinese)
- U.S. EPA. Waste Reduction Algorithm for Chemical Process Simulation and Waste Reduction. Available online: https://www.epa.gov/chemical-research/waste-reduction-algorithm-chemical-process-simulation-waste-reduction (accessed on 25 June 2025).
- GB Standard 26979-2011; Classification and Evaluation Method of Natural Gas Pool. Standardization Administration of China: Beijing, China, 2011. (In Chinese)
- Figueiredo, F.R.; Prata, D.M. Environmental Assessment and Eco-Efficiency Analysis of the Dividing Wall Distillation Column for Separating a Benzene–Toluene–Xylene Mixture. Processes 2025, 13, 391. [Google Scholar] [CrossRef]
- Young, D.; Scharp, R.; Cabezas, H. The waste reduction (WAR) algorithm: Environmental impacts, energy consumption, and engineering economics. Waste Manag. 2000, 20, 605–615. [Google Scholar] [CrossRef]
- Sepiacci, P.; Depetri, V.; Manca, D. A systematic approach to the optimal design of chemical plants with waste reduction and market uncertainty. Comput. Chem. Eng. 2017, 102, 96–109. [Google Scholar] [CrossRef]
- Meramo, S.; Gonzalez-Quiroga, A.; Gonzalez-Delgado, A. Technical, Environmental, and Process Safety Assessment of Acetone-Butanol-Ethanol Fermentation of Cassava Residues. Sustainability 2022, 14, 16185. [Google Scholar] [CrossRef]
- Young, D.M.; Cabezas, H. Designing sustainable processes with simulation: The waste reduction (WAR) algorithm. Comput. Chem. Eng. 1999, 23, 1477–1491. [Google Scholar] [CrossRef]
- Barrett, W.M.; Baten, J.V.; Martin, T. Implementation of the waste reduction (WAR) algorithm utilizing flowsheet monitoring. Comput. Chem. Eng. 2011, 35, 2680–2686. [Google Scholar] [CrossRef]
- Buryan, P. Losses of an iron complex and ethylenediaminetetraacetic acid during gas desulfurization. Chem. Pap. 2017, 71, 673–677. [Google Scholar] [CrossRef]
- Zhao, K. Study on technology and economic adaptability of complex iron desulfurization process in sour gas wells. Chem. Eng. Oil Gas 2022, 51, 29–34. (In Chinese) [Google Scholar]
- Saji, V.S. Research advancements in sulfide scavengers for oil and gas sectors. Rev. Chem. Eng. 2019, 37, 663–686. [Google Scholar] [CrossRef]
Disclaimer/Publisher’s Note: The statements, opinions and data contained in all publications are solely those of the individual author(s) and contributor(s) and not of MDPI and/or the editor(s). MDPI and/or the editor(s) disclaim responsibility for any injury to people or property resulting from any ideas, methods, instructions or products referred to in the content. |
© 2025 by the authors. Licensee MDPI, Basel, Switzerland. This article is an open access article distributed under the terms and conditions of the Creative Commons Attribution (CC BY) license (https://creativecommons.org/licenses/by/4.0/).