Article

Carbon Emission Accounting and Identifying Influencing Factors of UHV Project Based on Material List

by
Huijuan Huo
1,
Gang Dan
2,
Peidong Li
1,
Shuo Wang
1,
Xin Qie
2,
Yaqi Sun
3,*,
Cheng Xin
1 and
Tianqiong Chen
1
1
State Grid Economic and Technological, Research Institute Co., Ltd., Beijing 102209, China
2
State Grid Corporation of China, Beijing 100032, China
3
School of Economics and Management, North China Electric Power University, Beijing 102206, China
*
Author to whom correspondence should be addressed.
Processes 2025, 13(7), 2007; https://doi.org/10.3390/pr13072007
Submission received: 20 March 2025 / Revised: 7 June 2025 / Accepted: 9 June 2025 / Published: 25 June 2025

Abstract

China’s UHV power grid, a core “new infrastructure” initiative, is vital for its next-generation power systems. This study quantifies UHV project carbon emissions using a carbon source inventory system, identifies key drivers via Random forest regression (RFR) and SHAP interpretable ML models, and validates findings with a 1000 kV UHV AC project in southwest China. Results highlight material production (97% emissions) and construction phases (3%) as primary carbon sources. The proposed solutions are as follows: ① green materials (low-carbon concrete) and modular construction; ② digital tools for optimized project management. These strategies enable emission reductions while supporting China’s carbon neutrality goals.

1. Introduction

An ultra-high-voltage (UHV) power grid refers to a voltage transmission network with AC 1000 kV and DC plus or minus 800 kV and above. It can cover long distances and has large capacity and low loss transmission power, so a UHV transmission line is the carrier of the new energy supply system. UHV project construction is a key way to promote low-carbon energy transformation. UHV substations are the key facility for UHV transmission lines in a power system and are mainly responsible for the conversion and distribution of electric energy [1]. The core role of a UHV substation is to convert UHV electrical energy (1000 kV and above AC or ±800 kV and above DC) into UHV (such as 500 kV, 220 kV) or high-voltage (such as 110 kV) electrical energy for further distribution and use. This conversion is a key link to achieve efficient transmission of electricity from the power plant to the user. UHV transmission projects play a vital role in optimizing regional resource allocation and promoting the transformation of superior resources, especially for the transmission and consumption of new energy, which is an effective way to transport large-scale renewable energy [2].
China is under unprecedented pressure to reduce carbon emissions, and UHV projects are important for alleviating environmental pressures and regulating the power structure [3]. UHV transmission projects can significantly reduce the quantity and intensity of regional carbon emissions by promoting energy substitution, improving power generation capacity, promoting industrial agglomeration, and improving output efficiency [4]. However, the construction of UHV projects will consume a large number of high-carbon-emission building materials such as concrete and steel [5]. During the transportation process, the carbon emissions produced vary greatly depending on the distance of the material and the mode of transportation [6]. In the long run, the construction of UHV lines is beneficial to economic development by reducing pollutant emissions and absorbing more clean energy [7]. However, in the short term, it is necessary to clarify the carbon emission characteristics of the whole life cycle of UHV projects through carbon emission accounting and to clarify the carbon reduction responsibilities of each link, so as to formulate effective carbon emission reduction policies and promote the low-carbon transformation of UHV projects. In contrast, the EU’s Carbon Border Adjustment Mechanism (CBAM) mandates that infrastructure projects adopt a full supply chain carbon accounting system, covering both direct and indirect emissions [8]. Due to the lack of a federal standard, the United States has seen a 23% increase in coal power carbon intensity due to the adoption of different methods by various states [9]. The Belo Monte project in Brazil demonstrates that China’s ultra-high-voltage technology can reduce cross-border transmission losses by 40%.
At present, carbon emission accounting for the UHV sector mainly focuses on its construction and operation phase, and the methods used mainly include life cycle assessment model (LCA) and input–output model (EI-LCA) [10]. The life cycle assessment model (LCA) is a tool used to evaluate the environmental impact of a product, service, or activity throughout its entire life cycle, covering all stages from raw material acquisition, production, and use to disposal. The input–output model (EI-LCA) is a model that combines input–output analysis and life cycle assessment. By analyzing the input–output relationship among various sectors in the economic system, it assesses the environmental impact in the life cycle of products or services. It is possible to assess the environmental impact of the entire life cycle from raw material acquisition to disposal, including the collection of input (e.g., raw materials, energy) and output (e.g., emissions, waste) data at all stages of the product life cycle [11]. Life cycle assessment (LCA) can provide a scientific basis for environmental policies and standards, evaluate the environmental performance of supply chains and product lines, and is key to evaluating their economic potential and environmental impact characteristics [12]. However, the objects described by LCA are complex product production and consumption activities with a large space–time span, and such activities are constantly changing, so it is difficult to repeatedly measure and statistically analyze them, which leads to a difficult problem in the data quality assessment and control of LCA [13]. The input–output model is built based on the input–output table, which can trace the upstream industrial chain of the products of each department [14]. In 2024, direct, indirect, and implied carbon emissions of various industries in Guangdong Province were calculated using the input–output model (EI-LCA), and the carbon emission reduction potential model was used for in-depth analysis [15]. However, the input–output model relies on the static data relationships between industries, making it suitable for the regional economy and evaluation of economic effects of larger projects [16]. Therefore, to minimize truncation and aggregation errors as much as possible, the hybrid life cycle assessment model was proposed. This method combines input–output models with process life cycle assessment models, fully leveraging the high resolution of the latter while supplementing it with the former to achieve more accurate results.
However, the carbon emission characteristics of UHV projects cannot be comprehensively investigated and evaluated only through carbon emission accounting. In order to carry out UHV low-carbon construction work in a targeted manner, the key factors affecting UHV carbon emissions need to be identified first. An exploratory data analysis method can be used to analyze the heterogeneous effects of factor flows on reducing carbon emission intensity by taking into account multiple factors [17]. Random forest regression (RFR) model is an ensemble learning algorithm based on decision tree for regression tasks (predicting continuous values). Random forest classification is a widely adopted machine learning method for building predictive models in a variety of research fields. However, as models become more complex, machine learning explanations can be quite difficult [18]. The SHAP model is a model interpretation method based on game theory, which quantifies the contribution of each feature to a single prediction through Shapley value. The SHAP technique allows us to analyze a single sample using a force diagram and provides a measure of the importance of each geochemical input attribute in the model output [19]. By analyzing the contribution of each input feature to the model, the factors with the highest contribution of the three variables are obtained. The above research methods have reference significance for the analysis of influencing factors in the UHV field.
In summary, the construction process involves a series of complex tasks, such as material transportation, construction machinery construction, production process installation, and installation of equipment materials, and it is difficult to capture the carbon footprint during this period. Therefore, in this paper, the process life cycle assessment model is used to calculate the carbon emission footprint to solve the problem of data acquisition and quality. Considering that the current accounting method has unclear data definition and a data volume that is too complex, and it cannot clearly affect the key influencing factors under carbon emission in a targeted way, this paper proposes a carbon emission measurement boundary of UHV projects from the perspective of the whole life cycle, establishes the carbon emission accounting model for UHV projects, and quantitatively analyzes major carbon emission scenarios. Through the SHAP model [20], aiming at the factors affecting carbon emissions during UHV building consumption and power engineering consumption, the three factors with the highest contribution were obtained, and specific emission reduction strategies were proposed. Through the above research, an effective system can be established for the calculation of carbon emissions in the consumption of construction and power engineering in UHV projects, which can provide support for carbon emission accounting and carbon emission reduction of UHV projects.

2. UHV Carbon Emission Calculation Model

2.1. Carbon Emission Estimation Boundary of UHV Projects

A cost list is a detailed list of all cost items and the corresponding amount; a project cost list can allow for tracing the input and output of the project, to calculate the carbon emissions in the construction process [21]. Based on the cost list, the carbon emission list was constructed, and the classification method of carbon emission components and the calculation of carbon emission sources for UHV construction were realized [22]. According to the current regulations on cost preparation and calculation of UHV projects in China, combined with the carbon emission characteristics of construction, the carbon emission inventory of UHV projects can be divided into five sublists: sublist of construction consumption, power project consumption, equipment input sublist, construction process sublist, and other project sublist; the specific sublist is shown in Table 1. In the construction project, the sublist of construction consumption is a detailed list obtained after comprehensive calculation of materials and labor services according to the design requirements, mainly including the details of the consumption of raw materials such as cement, steel, sand, and stone. In power engineering, the sublist of power engineering consumption details the materials required for construction, such as copper, aluminum alloy, etc. The sublist of equipment inputs mainly covers the machinery and equipment required and used in construction and power works [23]. In addition, the construction process sublist records the resources and activities at all stages of power engineering construction, including material transportation, mechanical construction, installation, etc. Other project sublists deal with additional costs that may be incurred during construction, such as contract changes, research tests, feasibility studies, etc.
In UHV projects, the main costs include the sublist of materials consumed by construction and power engineering, the cost of machinery and equipment in the sublist of equipment input, and the costs that may be incurred in the construction process and other project sublists [24]. Construction consumption is mainly used for all kinds of raw materials, while power engineering consumption not only includes building materials unique to power engineering such as power towers and DC fields, but also involves the purchase of lighting, air conditioning, ventilation, and other equipment. Equipment investment is mainly used to purchase converters, relays, reactors, and other key power equipment. These different types of buildings have significant differences in material use and carbon emissions.
From a life cycle perspective, the production, transportation, and construction processes of building materials are the primary sources of emissions [25] for UHV projects and are key components in carbon emission accounting. Among these, the carbon emissions from building consumption and power engineering mainly come from the production and transportation of materials, with clear carbon footprints that can be relatively accurately analyzed and calculated [26]. In summary, considering the difficulty of data acquisition, this paper focuses on the main stages that significantly impact UHV building carbon emissions and for which data are available, based on the carbon emission accounting list. The scope of UHV-project-building carbon emissions is defined as the production and transportation stages of building materials. Equipment input (accounting for less than 0.5% of carbon contribution) and other projects (land acquisition and immigration carbon contribution is about 0.03%) are excluded, because the carbon footprint of equipment has been indirectly calculated through the input–output table (Formula (3)). Secondly, land change carbon emissions require regional biomass data, which are difficult to standardize [27].

2.2. Construction of the Carbon Emission Accounting Model

Currently, research on carbon emissions from materials and energy is relatively comprehensive both domestically and internationally, providing authoritative data on the carbon emission factors for material production and processing as well as energy production and consumption. In light of this, this paper draws on the approaches of Su et al. [28] and Zhang [29], using input–output tables to analyze the carbon emissions of projects in the construction process sublist. It also adopts the ideas of Huang et al. [30] to establish the following model.
For all projects involved in the two sublists of construction consumption and power engineering consumption, all carbon emissions generated in the mining, refining, synthesis, transportation, and other processes are calculated as follows:
C E m a t e r i a l = ( 1 + ω i ) × m i × E F i
In the formula, CEmaterial represents the total carbon emissions of all the projects in the above two sublists; ωi represents the type i material loss rate brought about by the construction process and construction process; mi 1 represents the amount of material i consumed in construction and power engineering; and EFi represents the carbon emission factor of material i (kgCO2e/unit). According to the research conclusions drawn by Gustavsson et al., among the items listed in the production consumption and construction consumption involved in the project, the loss rate of concrete is 1.5%, the abandonment rate of steel is 15%, and the abandonment rate of other materials is assumed to be 5%.
In this paper, the specific operation methods for the carbon emission analysis of projects in the sublist of the construction process are based on the following equation:
C E p r o j e c t = P j × E I j
In the formula, CEproject represents the carbon emission value of the carbon emission projects in the construction process sublist; Pj represents the investment of element j in the carbon emission project; and EIj represents the carbon emission intensity of the element j after conversion by the department splitting method.
This paper analyzes the carbon emissions of the two sublists of equipment input and other items, and the specific operation calculations are as follows:
E n , y e a r s t a n d a r d = I n × C P I y e a r C P I y e a r s t a n d a r d × P P P y e a r s t a n d a r d 1 × E I n
In the formula, En,year−standard represents the carbon emission of the investment amount of the n project in the base period; In represents the investment amount of the n item; CPIyear and CPIyear−standard represent the Chinese consumer price index for the planned investment year and the base period, respectively; PPPyear−standard represent the base period of the China-to-the-US purchasing power parity index; and EIn represents the sector carbon emission intensity of the n project. On this basis, the carbon emissions of the two sublists of equipment input and other projects sum up to:
C E i n v e s t m e n t = E n , y e a r s t a n d a r d × C P I y e a r U I y e a r s t a n d a r d
In the formula, CEinvestment represents the sum of carbon emissions in the two sublists of equipment input and other projects; CPIyear refers to China’s carbon emission intensity in the project input year; UIyear−standard is the US carbon emission intensity in the base period.
To sum up, the overall carbon emission in the construction phase of the UHV project is the sum of the results of process-based life cycle carbon emission accounting and life cycle carbon emission accounting based on input and output, namely,
C E t o t a l = C E m a t e r i a l + C E p r o j e c t + C E i n v e s t m e n t
The data sources of the parameters are shown in the following Table 2:

3. Analysis of Influencing Factors of Carbon Emissions of UHV Projects

3.1. Extraction of Influencing Factors

UHV equipment needs a variety of raw materials, such as copper, aluminum, steel, and other metal materials, as well as insulation materials, electronic components, etc. The production and transportation of these raw materials will produce a certain amount of carbon emissions, so the use of these raw materials will have a direct impact on the carbon emissions of UHV projects [33]. If raw materials with low energy consumption and low emission are used, such as environmentally friendly composite materials instead of the traditional cast iron or steel plate, carbon emissions can be reduced in the production stage. The upstream part of the UHV industry mainly involves the supply of various raw materials and components needed for UHV electrical appliances, including metal materials, sensors, insulation materials, and electronic components. Midstream equipment manufacturing involves the manufacturing of UHV transmission equipment, distribution equipment, substation equipment, etc., and the raw materials required include steel, concrete, etc. The downstream part of the UHV industry chain mainly involves the construction and operation of the UHV power grid, including distribution network equipment, power supply side, and other application fields, and requires a large number of metal materials such as copper, aluminum, etc. In the construction process of UHV projects, due to the clear carbon emission footprint in the production process of materials, the carbon emission generated by material input accounts for 32.860% of the total carbon emission in the construction stage of the project, and its main sources can be relatively accurately analyzed and calculated. Therefore, according to the carbon emission characteristics of UHV engineering construction and referring to the relevant literature, the use of steel, cement, aluminum, sand, copper, insulation materials, and other materials is extracted as the influencing factors of carbon emission. Insulating materials were not included in the main factors because SHAP pre-analysis showed that their contribution was less than 2%, and the carbon emission factor of organic materials such as epoxy resin was highly dispersed (±58%), which affected the stability of the model.

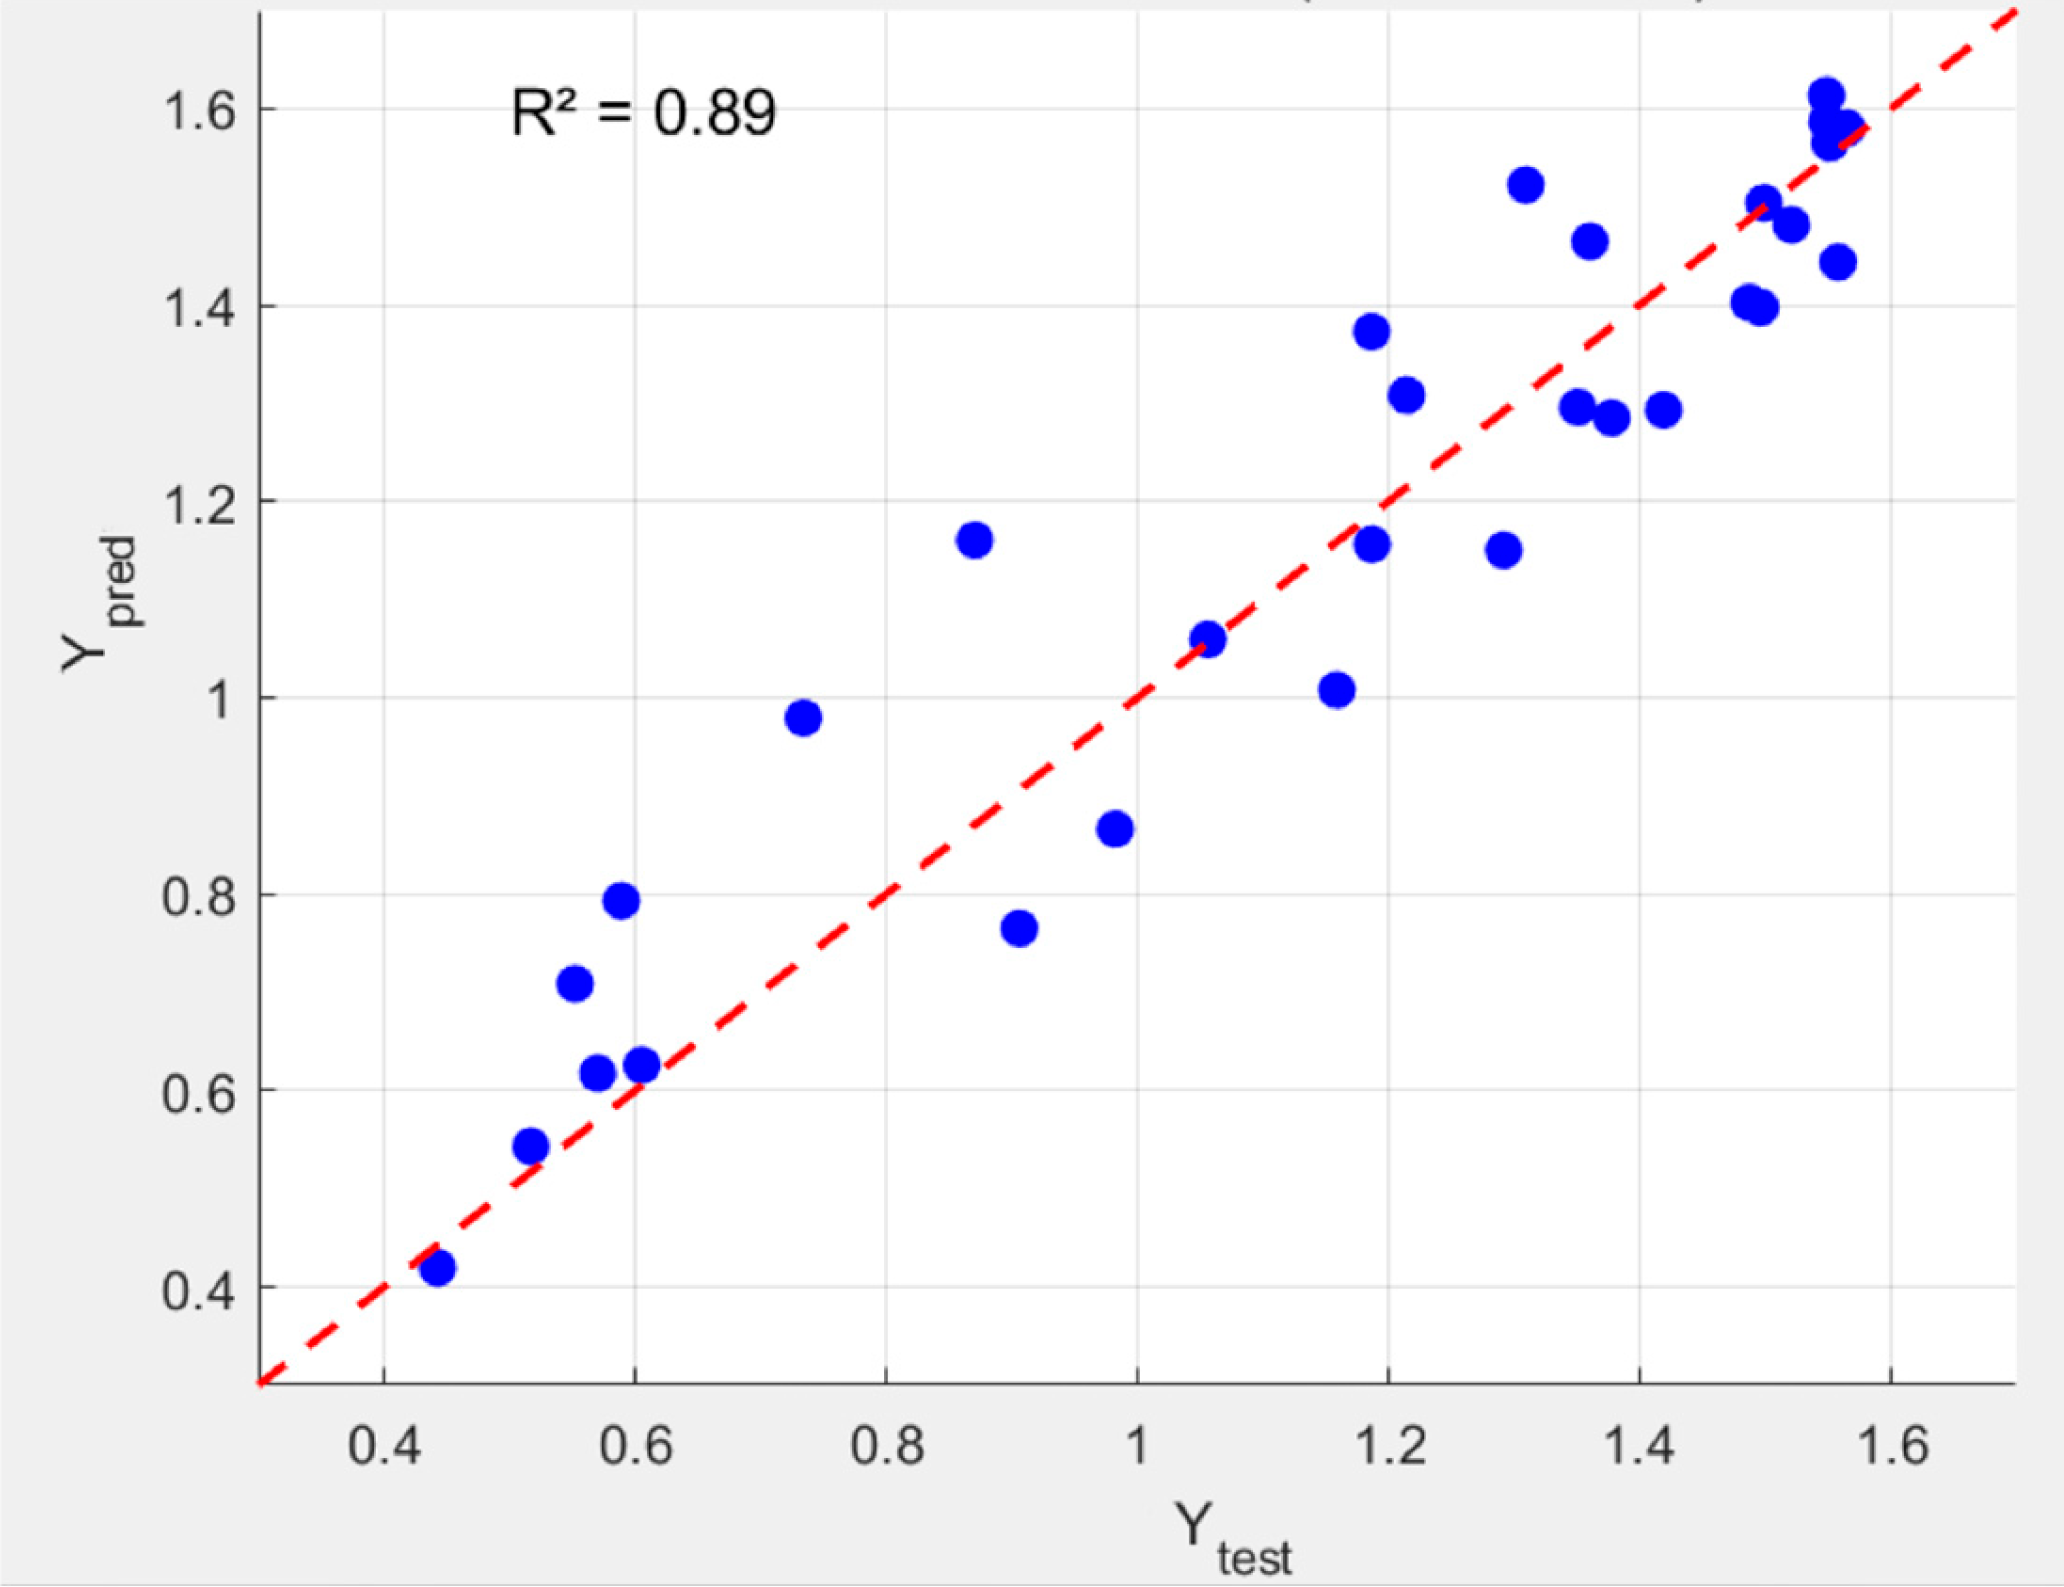
3.2. Identification of the Key Influencing Factors

Based on the carbon emission data of UHV engineering, a data set was created containing the influencing factors and carbon emission data, defining the influencing factors as the input characteristics, and the carbon emissions as the target output. Random forest regression (RFR) and SHAP models were used to evaluate the importance of these features and rank them accordingly to determine the main factors affecting the full-cycle carbon emissions of UHV engineering. The random forest regression (RFR) model is an ensemble learning algorithm based on decision trees for regression tasks (predicting continuous values). The SHAP model is a model interpretation method based on game theory, which quantifies the contribution of each feature to a single prediction through Shapley values.
Using the RFR model, the contribution of each feature to the model accuracy was measured by calculating the Gini index. As an integrated learning method, random forest is composed of multiple decision trees, which performs well in solving complex classification and regression problems [34]. Compared with other machine learning techniques, random forest is easy to implement, highly interpretive, and can effectively avoid overfitting and multicollinearity problems. Therefore, the RFR model was chosen in this study to explore the nonlinear connection between the carbon emissions of UHV projects and their influencing factors.
The Gini index is an indicator to evaluate the quality of sample ordering. In the RFR model, by comparing the contribution of each feature to improve the accuracy of the model, it is found that the greater the contribution, the more the Gini index decreases [35]. The importance of the feature reflects the magnitude of its contribution to improving model accuracy. The importance FI(Xi) of the feature variable Xi (i = 1, 2, 3,⋯) can be calculated by the following formula:
F I ( X i ) = 1 N n = 1 N v N Δ i ( X i , v )
In the formula, Δi(Xi,v) represents the reduction in Gini index on node v using the feature variable Xi. SHAP values were calculated through the SHAP model to assess the contribution of the feature to the carbon emission value. SHAP model is an additive explanatory model based on Shapley value. By verifying the contribution of characteristic variables to the carbon emission measurement, it was found that the greater the contribution, the greater the SHAP value. Feature importance represents the contribution degree of the feature variable to the measured carbon emission value. Assuming that the j th feature element of sample i is xij, the Shapley value of the feature element is the contribution of xij to the measured value f(xij), denoted as ϕij(f, xi). The specific formula is as follows:
ϕ i j ( f , x i ) = S x il x i p \ x i j S ! ( P S 1 ) ! P ! ( f x i ( S x i j ) f x i ( S ) )
In the formula, xi1…, xip are a collection of all the feature variables. P is the number of all the input features. S is the permutation subset, and fxi(S xij) − fxi(S) is the marginal contribution of the feature i in the subset S.

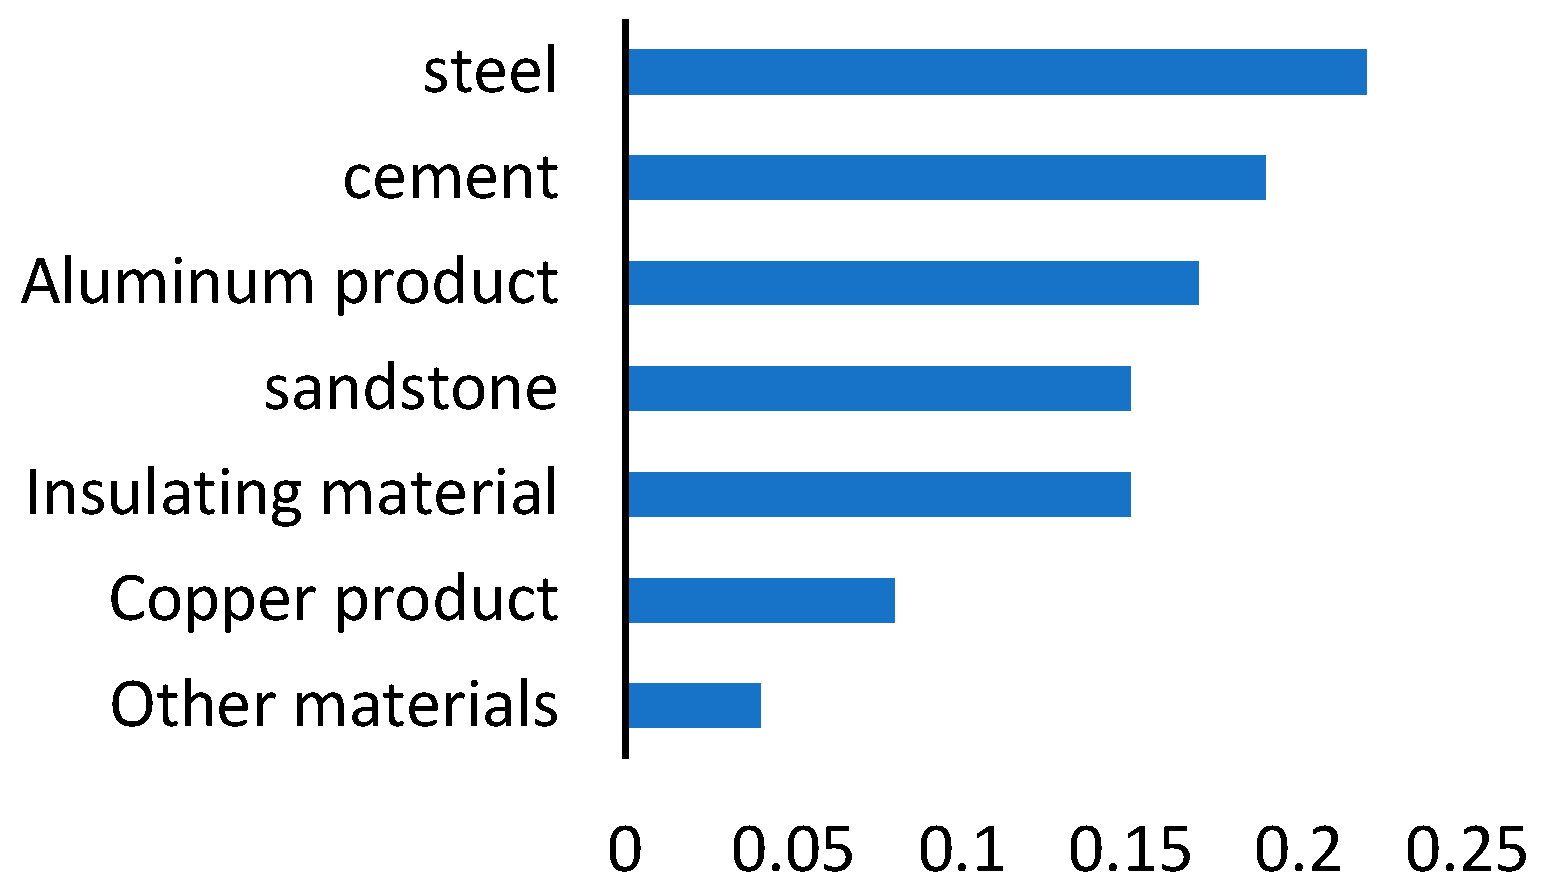
3.3. Identification of Key Factors Affecting Carbon Emissions

Multiple linear regression models and a random forest model were constructed separately with carbon emission as the output variable and the use of relevant raw materials as the characteristic variable. Comparing the goodness of fit (R2) and prediction error (RMSE), the results are shown in Figure 1. The random forest model had an R2(0.89) greater than the multiple linear regression model’s R2 (0.26); the random forest model’s RMSE (0.68) was lower than the multiple linear regression model’s RMSE (3.97), indicating that the random forest model can provide a better interpretation. The Pearson correlation coefficient, as the degree of linear correlation between two variables, has values between −1 and 1. The greater the absolute value of the correlation coefficient, the stronger the linear correlation.
The data set covers the engineering list of 12 UHV projects in China from 2015 to 2024 (total sample size N = 1248), and the training set/test set is divided according to a ratio of 7:3. The RFR hyperparameters are optimized by 5-fold cross-validation (tree depth = 15, number of trees = 200), and the feature standardization process is based on Z-score method. The horizontal axis in Figure 1 shows the contribution of each feature to the purity improvement of the carbon emission measurement model, which represents the importance of the feature to the measurement value. The importance of carbon emission measurement was measured by random forest regression model and Formula (6), and the results are shown in Figure 2. It can be seen that steel, cement, and aluminum have the most significant influence on the carbon emissions of UHV engineering, followed by sand and copper, and the cumulative importance of the first five features is 88%; copper and other materials make little contribution to the carbon emission of the whole life cycle of the track-laying base. The carbon footprint of steel (contributing 62%) is attributed to blast furnace steelmaking, which emits CO2 1.9–2.3 tons per ton, 10 times that of concrete (Table 3, and the steel used for UHV tower bases, which accounts for 38–45% of the total project mass. The energy intensity of aluminum electrolysis (12–15 MWh/t) further amplifies this impact [36].
In summary, the carbon accounting of UHV projects provides a data base for enterprise ESG management by quantifying the life cycle emissions of the project, including construction, material manufacturing, transmission and distribution losses, etc. Its high-carbon factor identification (such as SF6 use, line loss rate) can be targeted to optimize the green supply chain and technology upgrade, while meeting ESG information disclosure requirements and reducing financing risks. More importantly, through the closed loop of carbon footprint management, planning renewable energy access, EPD certification equipment procurement, and carbon sink supporting, the project emission reduction is transformed into the sustainable competitiveness of enterprises, and clean energy transformation and ESG strategy are promoted [37]. Deep synergy helps to achieve the dual goals of environmental responsibility fulfillment and low-carbon value creation.

4. Case Analysis

4.1. Project Overview and Data

This project (construction from 2023 to 2025) integrates southwest hydropower (68%) and photovoltaic (32%) power, and replaces the original 6220 kV lines with 2 km × 209.2 km double-circuit lines in the same tower, which is expected to reduce CO2 by 46,000 tons per year. The proportion of coal power in the regional power grid will be reduced from 45% to 29% (2025 target). The selected object of the case calculation is a 1000 kV UHV AC project in a certain area of southwest China. The sending end covers an area of 25.00 hectares, and the receiving end covers an area of 17.57 hectares. The total length of the line is about 2 km × 209.2 km, which is set by the double circuit of the same tower, and the transformer capacity is 24 million kVA. This project is the construction of a UHV AC backbone power grid project in southwest China. According to the construction quantity list of the case, the consumption of building materials used in the construction stage of the case is calculated, and then, the carbon emission generated by the consumption of building materials is calculated according to the carbon emission coefficient of various building materials. In order to take into account the authority and regional characteristics of building materials, the recommended value in the “Building Carbon Emission Calculation Standard” is first used to select carbon materials.
In the field of building carbon emission research [38], due to common reasons such as limited available research data, the existing research on calculating building carbon emission in the construction stage mostly adopts the calculation method based on the bill of quantities and construction quota. Among them, according to the “Urban Rail Transit Engineering Estimate quota”, the construction machinery type required by the specific project of the subway construction project is determined, and according to the “national unified construction machinery class quota”, the energy type and dosage of various construction machinery work are determined. Based on the carbon emission coefficient of fossil energy (kgCO2/GJ) given in the IPCC National Greenhouse Gas Inventory Guide in 2006 and the corresponding energy calorific value (kJ/kg) given in the General Rules of Comprehensive Energy Consumption Calculation of China, the carbon emission coefficient (kgCO2/kg) of gasoline and diesel fossil energy needed in this paper is selected [39]. The bill of quantities is shown in Table 4 and Table 5.

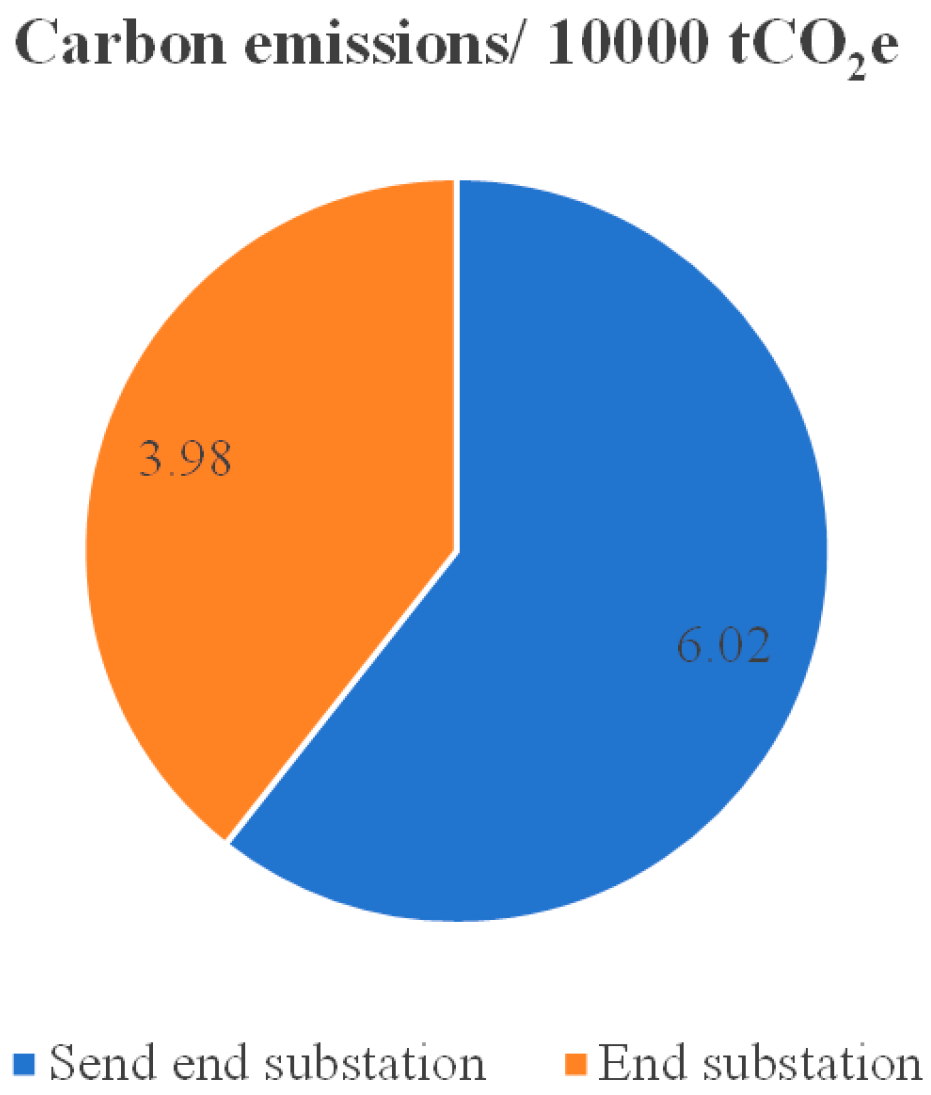
4.2. Carbon Emission Assessment Results of the UHV Project

The carbon emission generated during the construction process is from the following: firstly, material production, including the energy consumption and chemical reactions of raw materials such as steel, aluminum, and copper; secondly, the construction process and fuel and power consumption in equipment transportation, civil construction, and equipment installation; thirdly, the manufacture of equipment, such as transformers, cables, and switches; and finally, power consumption, if construction and equipment manufacturing rely on fossil energy power, which indirectly increases carbon emission. By optimizing material selection, using clean energy, and improving energy efficiency, carbon emissions from UHV projects can be effectively reduced [40]. The carbon emission factors and main sources of various materials are given in Table 3.
According to the calculation method determined above, the carbon emission situation of the carbon traceability group of the sending end substation and the receiving end substation of the project is calculated in this paper, as shown in Figure 3. The model results show that under the current project investment scale and construction content, the carbon emission is 96,600 tCO2e, of which the carbon emission of the building consumption sublist is 93.520 tCO2e, and the power engineering consumption is 2.44 million tCO2e, accounting for 97.356% and 2.613%, respectively.
The carbon emissions of each part of the project were calculated, and the sending terminal substation showed 58,240 tCO2e, accounting for 60.629%. The receiving terminal substation value was 37,820 tCO2e, accounting for 39.371%. Among them, the building consumption was 93,520 tCO2e, and the power engineering consumption was 0.254 tCO2e. The results of the study in [10] were selected for comparison with the results of this paper. Following the analysis in [10], the carbon emission of ±1100 kV UHV AC substation is 712 million tCO2e, which is close to the carbon emission of 655.31 tCO2e and a 8.653% higher result may be caused by the specific difference between DC engineering and AC engineering. The high carbon emission of 8.65% in the exchange project is mainly due to the need for an additional 40% steel for reactive compensation facilities at the converter station and a 25% increase in the amount of insulation materials (±1100 kV DC field strength distribution is more uniform) [41].
Considering that the carbon emissions in the production of raw materials such as steel and aluminum account for more than 60% of China’s UHV projects, the implementation of low-carbon procurement and logistics optimization through the green supply chain, combined with the life cycle carbon management of equipment, can significantly improve the comprehensive performance of enterprises. Industry data show that every 20% increase in the proportion of green procurement can increase the net profit margin by 1.5–2%. The average cost of green financing for enterprises using supply chain carbon management is reduced by 0.8–1.2%. The empirical results show that the green supply chain strategy has a significant synergistic effect in reducing environmental costs, enhancing financing capacity and opening up the international market.

5. Conclusions

Based on the mixed life cycle evaluation model, this paper takes a 1000 kV UHV AC project in a certain area of southwest China as an example, calculates the carbon emission of the site buildings in the construction stage, and verifies the applicability of the carbon emission analysis and calculation model of UHV engineering construction constructed in this paper. The conclusions are as follows. The case study results show that the overall carbon emission of the project is 116,956 tCO2e, and the carbon emission of each part of the project is 23,110 tCO2e at the terminal site, 655,310 tCO2e at the terminal substation, 467,060 tCO2e, and 240,800 tCO2e at the receiving pole site. Based on this, this paper puts forward the following suggestions for the carbon emission management of UHV projects in China:
1. In the project planning stage, the line should be carefully designed. The existing power grid resources (including towers and substations) that meet engineering standards along the route should be fully utilized. Integrating new substations with existing or planned ones must be prioritized to improve site utilization and reduce land acquisition, environmental protection, and safety costs. Additionally, the line length should be kept within technical parameters to efficiently use existing towers and minimize material consumption [42]. Empirical studies show that optimizing power grid resources and route design can reduce total project costs by 30–40%.
2. Innovative construction technology and green materials should be adopted. In the field of material-intensive engineering, such as concrete pouring and pile foundation construction, advanced construction technologies have significantly reduced raw material consumption [43]. Simultaneously, green building materials are being promoted to replace high-pollution materials (such as polyvinyl chloride (PVC)). For example, using recycled HDPE pipes containing 30–50% recycled plastic can effectively reduce the consumption of organic raw materials, cut carbon emissions in production by 40–60%, and achieve a 42% reduction in carbon emissions over the entire life cycle. Additionally, the cost of these materials remains stable or decreases by 5–10%. It is worth noting that the application of recycled HDPE pipes requires an additional certification cost of 80,000 yuan per project, but their compressive strength, tested by the State Grid Laboratory, reaches at least 32 MPa, fully meeting engineering standards.
3. Digital technology should be used to optimize project construction management. The Internet of Things, artificial intelligence, and cloud computing technologies are deeply integrated into construction management to collect power, fuel, and consumable data in real time and automatically generate ISO 14064-compliant carbon footprint reports [44]. Then, the neural network is used to predict the manpower and machinery demand during the peak construction period, optimize the equipment leasing and scheduling plan [45], and finally promote the implementation of modular and intensive green construction mode.

Author Contributions

Conceptualization, H.H. and P.L.; methodology, Y.S.; software, G.D. and S.W.; validation, X.Q., C.X. and T.C. All authors have read and agreed to the published version of the manuscript.

Funding

This study (No: 5200-202356490A-3-2-ZN) was funded by the Science and Technology Project of the State Grid Corporation of China.

Data Availability Statement

The original contributions presented in the study are included in the article; further inquiries can be directed to the corresponding author.

Conflicts of Interest

Authors Huijuan Huo, Peidong Li, Shuo Wang, Cheng Xin, Tianqiong Chen were employed by State Grid Economic and Technological, Research Institute Co., Ltd. Author Gang Dan, Xin Qie were employed by State Grid Corporation of China. The remaining authors declare that the research was conducted in the absence of any commercial or financial relationships that could be construed as a potential conflict of interest.

References

  1. Li, J.; Wang, Z.; Zhou, S.; Lu, B.; Dai, W.; Bao, H. Optimal planning energy storage for promoting renewable power consumption in the urgent situation of UHV systems. Int. J. Electr. Power Energy Syst. 2022, 143, 108453. [Google Scholar] [CrossRef]
  2. Tan, X.; Lin, S.; Liu, Y.; Xie, B. Has the inter-regional transmission expansion promoted the low-carbon transition of China’s power sector. Comput. Ind. Eng. 2022, 168, 108059. [Google Scholar] [CrossRef]
  3. Wang, H.; Zhang, Y.; Lin, W.; Wei, W. Transregional electricity transmission and carbon emissions: Evidence from ultra-high voltage transmission projects in China. Energy Econ. 2023, 123, 106751. [Google Scholar] [CrossRef]
  4. Chang, H.; Ma, S.; Chiang, Y.; Lai, C. The effects of structural design alternatives on the embodied carbon emissions of steel buildings. J. Build. Eng. 2025, 99, 111603. [Google Scholar] [CrossRef]
  5. Greer, F.; Horvath, A. Exploring the significance of transportation emissions in upfront embodied carbon in buildings. Build. Environ. 2025, 269, 112457. [Google Scholar] [CrossRef]
  6. Tan, X.; Lin, S.; Xie, B. The distributional effect of inter-regional transmission grid expansion on China’s power industry. Clim. Change Econ. 2022, 13, 2240005. [Google Scholar] [CrossRef]
  7. Mori, M.; Gramc, J.; Hojkar, D.; Lotrič, A.; Smeacetto, F.; Fiorilli, S.; Fiore, S.; Stropniket, R. New life cycle inventories for end-of-life solid oxide cells based on novel recycling processes for critical solid oxide cell materials. Int. J. Hydrogen Energy 2024, 104, 635–650. [Google Scholar] [CrossRef]
  8. Zhang, Z.; Zhang, Y.; Qin, X. Impact of the ±1100 kV UHVDC Eurasia Interconnection Project on the Security and Stability of the German Power Grid at the Receiving End. Power Grid Technol. 2015, 39, 2094–2099. [Google Scholar]
  9. Zhang, Y.; Zhang, Z.; Zhang, Y. Application of UHVDC transmission technology to realize the idea of inter-subcontinental power transmission. Power Grid Technol. 2015, 39, 2069–2075. [Google Scholar]
  10. Chen, X.; Fu, Y.; Huang, C. Method and application of carbon emission calculation for ultra-high voltage (UHV) project construction. Resour. Sci. 2023, 45, 2291–2310. [Google Scholar] [CrossRef]
  11. Ulanov, V.L. The Need for the Green Economy Factors in Assessing the Development and Growth of Russian Raw Materials Companies. J. Compr. Bus. Adm. Res. 2024, 1, 19–26. [Google Scholar] [CrossRef]
  12. Qi, J.; Wang, Y.; Xu, P.; Hu, M.; Huhe, T.; Ling, X.; Yuan, H.; Li, J.; Chen, Y. Coupling of molten salt heating tire pyrolysis process with carbon black modification process: Technical economic evaluation and life cycle assessment. J. Clean. Prod. 2025, 486, 144454. [Google Scholar] [CrossRef]
  13. Wei, X.; Tan, X.; Lin, M.; Cheng, J.; Xiang, K.; Ding, S. Calculation and prediction of carbon emission factors for the national power grid from 2005 to 2035. Integr. Intell. Energy 2024, 46, 72–78. [Google Scholar]
  14. Feng, R.; Hu, L.; Hu, X.; Fang, X. Knowledge gaps are making it harder to formulate national climate policies. Proc. Natl. Acad. Sci. USA 2023, 120, e2218563120. [Google Scholar] [CrossRef] [PubMed]
  15. Ma, J.; Du, G.; Xie, B. CO2 emission changes of China’s power generation system: Input- output subsystem analysis. Energy Policy 2019, 124, 1–12. [Google Scholar] [CrossRef]
  16. Sun, H.; Chen, Y.; Chen, S.; Zhao, Z. Promoting the “Chinese experience” of carbon neutrality—Evidence of carbon emission pilot governance in Guangdong Province based on the EIO-LCA model. Energy Strategy Rev. 2024, 53, 101393. [Google Scholar] [CrossRef]
  17. Canning, P.; Rehkamp, S.; Yi, J. 9—Environmental Input-Output (EIO) Models for Food Systems Research: Application and Extensions ⁎. Food Syst. Model. 2022, 1, 179–212. [Google Scholar]
  18. Lv, T.; Zhao, Q.; Fu, S.; Jin, G.; Zhang, X.; Hu, H.; Xu, G. Deciphering flows: Spatial correlation characteristics and factors influencing carbon emission intensity in the Yangtze River Delta. J. Clean. Prod. 2024, 483, 144290. [Google Scholar] [CrossRef]
  19. Xu, P.; Zhou, G.; Zhao, Q.; Lu, Y.; Chen, J. Spatial-temporal dynamics and influencing factors of city level carbon emission of mainland China. Ecol. Indic. 2024, 167, 112672. [Google Scholar] [CrossRef]
  20. Fan, F.; Wang, Y.; Liu, Q. China’s carbon emissions from the electricity sector: Spatial characteristics and interregional transfer. Integr. Environ. Assess. Manag. 2022, 18, 258–273. [Google Scholar] [CrossRef]
  21. Zhai, Y.; Zhang, T.; Shen, X.; Ma, X.; Hong, J. Development of life cycle assessment method. Resour. Sci. 2021, 43, 446–455. [Google Scholar] [CrossRef]
  22. Huang, Z.; Wen, X.; Zhu, J.; Feng, Z. Research on fault location of DC line in UHV converter station based on digital twin technology. Meas. Sens. 2024, 33, 101180. [Google Scholar] [CrossRef]
  23. The Construction of China’s First Ultra-High Voltage Project for Integrated Transmission of Wind, Solar, and Thermal Energy Has Been Approved. Available online: https://china.huanqiu.com/article/4C69WUXHfGW (accessed on 3 March 2025).
  24. Cui, P. The Establishment of a Life-Cycle Carbon Emission Factor Database for Buildings and Research. Ph.D. Thesis, Nanjing Southeast University, Nanjing, China, 2015. [Google Scholar]
  25. Zhu, J. Key technical challenges and innovative solutions for the construction of ultra-high voltage transmission lines across complex terrain. Constr. Mach. Technol. Manag. 2025, 38, 142–144. [Google Scholar]
  26. Gao, C.; Niu, J.; Wang, F. Review of carbon emission accounting methods and carbon emission factor in steel production. Contem- Porary Econ. Manag. 2021, 43, 33–38. [Google Scholar]
  27. Chen, J.; Chen, J.; Chen, Q.; Liu, K.; Dai, X. Nonlinear relationship model of factors influencing carbon emissions from road traffic in mountainous cities. Transp. Syst. Eng. Inf. 2024, 24, 237–245. [Google Scholar]
  28. Zhou, P.; Huang, H.; Ang, B.; Su, B. Input-output analysis of CO2 emissions embodied in trade: The effects of sector aggregation. Energy Econ. 2010, 32, 166–175. [Google Scholar]
  29. Zhang, X. Research on the Quantitative Analysis of Building Carbon Emissions and Assessment Methods for Low- Carbon Buildings and Structures. Ph.D. Thesis, Harbin Institute of Technology, Harbin, China, 2018. [Google Scholar]
  30. Huang, Y.; Liu, Y.; Xu, W.; Li, J. Life cycle carbon emissions of water reservoir and hydroelectric projects: A case study of the Quanmutang project. J. Ts-Inghua Univ. (Sci. Technol.) 2022, 62, 1366–1373. [Google Scholar]
  31. 2006 IPCC Guidelines for National Green Gas Inventories. Available online: https://www.ipcc-nggip.iges.or.jp/public/2006gl/ (accessed on 8 June 2025).
  32. Standard for Building Carbon Emission Calculation. Available online: https://ndls.org.cn/standard/detail/14ff7bae82ebf95cdb72bae85a14cdbb (accessed on 8 June 2025).
  33. Zhang, Y.; Ren, H. Remote sensing extraction of paddy rice in Northeast China from GF-6 images by combining feature optimization and random forest. Natl. Remote Sens. Bull. 2023, 27, 2153–2164. [Google Scholar] [CrossRef]
  34. Yu, W.; Zhang, T.; Shen, D. County-level spatial pattern and influencing factors evolution of carbon emission intensity in China: A random forest model analysis. China Environ. Sci. 2022, 42, 2788–2798. [Google Scholar]
  35. Shen, L.; Zhou, Y. Default prediction model based on optimal combination of big data variables: A case study of Chinese small enterprises. Syst. Eng.-Theory Pract. 2024, 44, 912–933. [Google Scholar]
  36. Sun, X. Research on Building Carbon Emission and Cost Based on Sensitivity Analysis of Carbon Reduction Technologies. Ph.D. Thesis, Beijing Jiaotong University, Beijing, China, 2023. [Google Scholar]
  37. Sun, L.; Tang, B.; Xu, P. Study on the Carbon Emission Characteristics and Carbon Reduction Potential of UHV Projects from a Life Cycle Perspective. Coal Econ. Res. 2024, 44, 43–50. [Google Scholar]
  38. Tang, B.; Xu, P.; Yu, F.L. Carbon Emission Accounting and Reduction Potential Assessment of Power Infrastructure—A Case Study of UHV AC Projects. Coal Econ. Res. 2024, 44, 90–99. [Google Scholar]
  39. Lundberg, S.; Lee, S. A unified approach to interpreting model predictions. arXiv 2017, arXiv:1705.07874. [Google Scholar]
  40. Long, X.; Sun, R.; Zheng, T. Liquefaction prediction model and interpretability analysis based on convolutional neural network. Geotech. Mech. 2024, 45, 2741–2753. [Google Scholar]
  41. Pomponi, F.; Hart, J. The greenhouse gas emissions of nuclear energy: Life cycle assessment of a European pressurised reactor. Appl. Energy 2021, 290, 116743. [Google Scholar] [CrossRef]
  42. Nureen, N.; Nuţă, A. Envisioning the invisible: Unleashing the interplay between green supply chain management and green human resource management: An ability-motivation-opportunity theory perspective towards environmental sustainability. J. Compr. Bus. Adm. Res. 2024, 2, 55–64. [Google Scholar] [CrossRef]
  43. Ding, N.; Liu, J.; Yang, J.; Yang, D. Comparative life cycle assessment of regional electricity supplies in China. Resour. Conserv. Recycl. 2017, 119, 47–59. [Google Scholar] [CrossRef]
  44. ISO 14064-1:2018—Greenhouse Gases. Available online: https://www.iso.org/standard/66453.html (accessed on 8 June 2025).
  45. Guo, J.; Kou, J. Acquirer ESG, home country policy enforcement, country distance, and cross-border mergers and acquisitions: Evidence from Chinese firms. J. Compr. Bus. Adm. Res. 2024, 2, 75–86. [Google Scholar] [CrossRef]
Figure 1. Fitting results of the model.
Processes 13 02007 g001
Figure 2. Characteristic importance ranking.
Processes 13 02007 g002
Figure 3. Carbon emissions from sending end and end substations.
Processes 13 02007 g003
Table 1. Carbon emission inventory of UHV projects.
Building Consumption
CementSteelDinas Iron partsRock woolCoating material
Power engineering consumption
Copper products Steel productsAluminum alloyIron partsGlass fiber-reinforced plastics Coke
Equipment input
Electrical power unit Building implements
The construction process
Material transport Construction of construction machineryProduction process installationDevice materialsIndividual work related to the site
Other projects
Land requisition immigrationEngineering managementResearch experimentSurvey and designConservation of water and soil Feasibility study
Table 2. The source of the parameters in the formula.
ParameterData SourcesScope of Application
EFIPCC (2006) Guidelines [31]Energy factors
ωBuilding Carbon Emission Calculation Standard GB/T 51366 [32]Materials loss rate
CPIChina’s annual report by the National Bureau of StatisticsPrice index revised
Table 3. Carbon emission factors and sources of the materials.
MaterialCarbon Emission FactorsCarbon Emission FactorsCarbon Emission Factors
Steel products1.9–2.3 tons of CO2/tIron tower, support and other structural partsIron-making, steelmaking, and rolling
Aluminum products8–12 tons of CO2/tWire and cableHigh power consumption of electrolytic aluminum production
Copper products2–4 tons of CO2/tCable and transformer windingsCopper smelting and refining process
Concrete0.2–0.3 tons of CO2/tFoundation and transformer substation buildingsLimestone decomposition and high-temperature calcination in cement production
Insulation materialDepending on the material, epoxy resin is about 5–7 tons CO2/tInsulators and transformer insulation partsEnergy consumption and chemical reactions in the chemical production process
Table 4. Bill of quantities of the sending terminal substation.
Listing TypeProjectQuantityProjectQuantity
Building consumptionSteel products/t2372.37Stone/m315,902.00
Sand/m314,159.94Stainless steel/t10.86
Galvanized iron/t1112.33Iron/t217.90
Standard brick 240 × 115 × 53/Thousand pieces696.43Portland cement 32.5/t1686.45
Vinyl chloride plastic/m4620.00Rock wool/t1.20
Fiber-reinforced silicate plate/t5.46Alufer/t0.36
Reinforced concrete pipe/t1504.40Each type of concrete/m391,521.15
Power engineering ConsumptionAlufer/t40.17Plated copper/t34.68
Copper product/t61.29Steel products/t24.63
Galvanized iron/t289.48Fire-retardant coating/t11.55
Fire blocking/t6.16Fire separator/m25808.00
Equipment inputElectric power equipment/ten thousand yuan169,373.60Construction equipment/ten thousand yuan1224.00
Construction processConstruction machinery/ten thousand yuan1330.85 Device material/ten thousand yuan1135.02
Installation works/ten thousand yuan12,460.76Transportation/ten thousand yuan1122.00
Other expensesSite requisition/ten thousand yuan17,548.41Project construction technical service/ten thousand yuan3847.72
Production preparation/ten thousand yuan3259.20Project construction management/ten thousand yuan1923.98
Table 5. Bill of quantities of the receiving end substation.
Listing TypeProjectQuantityProjectQuantity
Building consumptionSteel products/t604.00Stone/m318,789.39
Sand/m33550.98Iron/t217.54
Galvanized iron/t289.08Portland cement/t1231.73
Chlorinated polyethylene rubber/m3185.10Quartz vitrified floor tiles/m2926.23
Each type of concrete/m312.36Alufer/t11.41
Power engineering consumptionAlufer/t387.10Plated copper/t104.78
Copper product/t21.04Steel products/t93.73
Galvanized iron/t26.32Fire-retardant coating/t20.37
Fire blocking/t83.37Fire separator/m25414.75
Equipment inputElectric power equipment/ten thousand yuan42,354.40Construction equipment/ten thousand yuan1983.97
Construction processConstruction machinery/ten thousand yuan343.71Device material/ten thousand yuan3618.05
Installation works/ten thousand yuan3126.19Transportation/ten thousand yuan1132.10
Other expensesSite requisition/ten thousand yuan4398.10Project construction technical service/ten thousand yuan4407.28
Production preparation/ten thousand yuan825.80Project construction management/ten thousand yuan2764.94
Disclaimer/Publisher’s Note: The statements, opinions and data contained in all publications are solely those of the individual author(s) and contributor(s) and not of MDPI and/or the editor(s). MDPI and/or the editor(s) disclaim responsibility for any injury to people or property resulting from any ideas, methods, instructions or products referred to in the content.

