Abstract
Integrating the electric motor with a multi-speed transmission is an effective way to improve the efficiency and performance of battery electric vehicles (BEVs). This paper innovatively proposes a design method for matching a single-motor and dual-speed dual-clutch transmission (2-Speed Wet DCT) powertrain system and constructs a variable speed efficiency model (VSEM) and constant speed efficiency model (CSEM) for the inverter, motor, and transmission. Research shows that the design parameters of the motor and transmission significantly affect the optimal powertrain system. This study uses an enhanced NSGA-II multi-objective genetic algorithm to optimize the driving performance of energy efficiency and powertrain cost under two different acceleration times (10 s and 12 s), with the key parameters of the motor and transmission as optimization variables and dynamic indicators as constraints, and compares VSEM and CSEM. The optimization results indicate that VSEM have better energy-saving effects than CSEM, with the energy consumption reduced by 3.7% and 3.3% under the two driving performances, respectively. The Pareto frontier further confirms that, for multi-speed transmission systems in electric vehicles, matching a high-power, high-torque motor with a smaller transmission ratio powertrain can achieve higher energy efficiency and thus longer driving range. Additionally, this study quantifies the correlation between energy efficiency and powertrain cost using grey relational analysis (GRA), with a result of 0.77431.
1. Introduction
In light of the mounting global concern for environmental protection and sustainable development, electric vehicles have garnered attention as a means of clean energy transportation [1,2]. However, the nascent state of battery technology has given rise to the mileage anxiety problem, which has significantly impeded the further advancement of pure electric vehicles. In the absence of significant advancements in battery technology, optimizing the powertrain parameters of electric vehicles is important to fully leverage their performance potential, thereby enhancing the energy efficiency and reliability of the entire vehicle [3]. This is vital for extending the vehicle range and reducing the overall cost of the vehicle. The development of an efficient powertrain system represents a pivotal objective in the field of electric vehicle research and development [4]. Most current electric vehicles employ a transmission configuration comprising electric motors with single-ratio gearboxes [5,6]. This configuration offers the advantages of a simple structural design, eliminating the need for complex gear control logic. However, to achieve high-power performance, high-performance motors must be adapted. Low-performance motors cannot account for the performance indicators of electric vehicles’ maximum speed and maximum gradient [7]. Additionally, the motor operating point cannot be adjusted, resulting in the motor operating in the low-efficiency zone for an extended period, thereby reducing the energy utilization efficiency in the electric vehicle and subsequently affecting the range of the electric vehicle. Multi-speed transmissions feature multiple variable gear ratios, which can enhance the proportion of the motor’s working point within the high-efficiency zone by selecting the optimal speed gear, thereby reducing the vehicle’s energy consumption [6,8]. Furthermore, the multi-speed transmission can modify the output torque and speed of the motor to align with the varying power demands of the motor under diverse operational conditions [9]. This enhances the overall driver performance of the automobile. Integrating electric motors with multi-speed transmissions within the powertrain system offers the potential for further improving electric vehicles’ driver performance and energy efficiency [10]. Optimizing operational efficiency is critical to designing an excellent electric vehicle (EV) powertrain. An electric vehicle’s powertrain comprises three primary components: the battery, the motor, and the transmission. The battery’s efficiency is a fixed value and is not affected by the powertrain design. Motor-related parameters determine the efficiency of the inverter. Therefore, the primary goal of efficient powertrain design is to optimize the motor and transmission. The various research methods used in this field can be broadly categorized into three groups, each with its focus.
The initial research approach entails investigating and comparing the utilization characteristics of distinct motor parameters in BEVs while disregarding the impact of transmission parameters on the powertrain design. Zhu et al. [11] used an electric vehicle powertrain system with a single-speed transmission and compared the influence of disparate motor types on the vehicle’s efficiency. Feng et al. [12] provided a detailed analysis of the power loss of a hybrid synchronous motor (HSM) based on a two-speed electric powertrain system. This analysis yielded an efficiency map of the motor, which was then used to optimize its structural parameters. This optimization resulted in a maximum efficiency of 97.5% for the motor in a bench experiment. Popesco et al. [13] conducted a study to analyze the effects of different winding types (flat and round wire), winding materials (copper and aluminum), and cooling systems on the power consumption of various types of motors. In light of the rapid development of intelligent optimization algorithms, multi-objective optimization algorithms have become a prevalent tool in electric vehicle powertrain design.
The second research method is concerned with optimizing the transmission design of the powertrain, with the parameters related to the drive motor set to fixed values. Ruan et al. [14] used a fixed motor to analyze and compare the effects of three types of transmission topologies—namely, fixed-speed ratio, two-speed DCT, and CVT—on the battery energy consumption and production cost of electric vehicles. However, it should be noted that the studies above utilized constant transmission efficiency values for modeling purposes. Nevertheless, the transmission efficiency is not a constant value and is closely related to the motor output torque, rotational speed, and drive gear parameters [15]. It is, therefore, necessary to tabulate the transmission drive efficiency to improve the effectiveness of vehicle modeling. Kwon et al. [16] established a loss model for a two-speed DCT transmission and used the loss model to generate efficiency contour plots under different gear ratios. The transmission’s gear ratio and shift pattern were optimized based on the variable transmission efficiency. A comparison of the optimization results of constant transmission efficiency and variable transmission efficiency demonstrated the superiority of modeling using variable transmission efficiency.
The above research methods fail to account for the coupling effect between the motor and transmission. The discrepancy between the efficiency distribution map of the motor and the efficiency distribution map of the transmission is evident; thus, optimal motor efficiency does not necessarily guarantee optimal vehicle driving efficiency. Therefore, it is essential to synthesize the trade-offs between motor and transmission efficiency to achieve optimal vehicle driving performance and efficiency. The third research method integrates the coupling effect between the motor and transmission and co-optimizes the motor and transmission. Krüger et al. [17] proposed a design methodology for BEV powertrain systems using an open-source motor design tool in conjunction with a customized transmission design methodology. The transmission efficiency was tabulated by linear fitting, the impact of different transmission topologies on the comprehensive performance of the BEV was analyzed and compared, and the parameters related to the motor and transmission were optimized using a multi-objective genetic optimization algorithm. This fully proved the effectiveness of comprehensive co-optimization in obtaining the best powertrain design solution. Kwon et al.’s [18] analysis of losses was conducted based on the characteristics of each working component in the BEV powertrain. Loss models were developed for the inverter, motor, and transmission. A multi-objective optimization method based on artificial neural networks was proposed to optimize the transmission gear ratios and shift patterns. The superiority of optimizing the BEV powertrain system based on a real-time loss model was demonstrated.
The above three research methods all optimize the powertrain system of BEVs. However, the above research optimizes the design of the electric vehicle powertrain by simplifying the efficiency change model of the electric motor or transmission, and there is a specific error between the simulation model and the actual electric vehicle. This paper proposes a design method for the single motor matched with a 2-Speed Wet DCT powertrain system to reduce this simulation error. A real-time efficiency model of the inverter, motor, and transmission is established by tabulating the losses generated by each working part of the motor, inverter, and transmission. Then, the real-time efficiency model is merged into the powertrain system model of the whole vehicle. Finally, the model is solved to obtain the relevant performance indexes. Thus, the appropriate parameters of the motor and transmission are jointly optimized and designed. The enhanced NSGA-II multi-objective optimization algorithm is applied to find the best BEV powertrain configuration in the design space.
2. Electric Vehicle Models
This study aimed to optimize electric vehicles’ driving performance and energy utilization efficiency. The MATLAB R2022a simulation platform constructed a dynamic model of a single-motor electric vehicle coupled with a 2-Speed Wet DCT. The model incorporated a battery, inverter, motor, transmission, and longitudinal dynamics simulation. As illustrated in Figure 1, the modeling process of each sub-model is elucidated in detail in the subsequent sections.

Figure 1.
Simulation flowchart.
2.1. Battery
Battery modeling methods can be classified into four main categories: mathematical, electrochemical, equivalent circuit models, and composite models that combine the above methods [19]. Electric vehicles are commonly used in the second and third categories. This study selected the Rint model, which belongs to one kind of electrical equivalent circuit network model. The model defines the battery as an equivalent circuit structure consisting of an equivalence resistance () and an ideal voltage source (), which are defined as follows:
The battery pack utilized in electric vehicles comprises multiple battery cells interconnected in a series and parallel configuration. The characteristic parameters of the battery cells include open-circuit voltage , internal resistance , and battery capacity . The relevant parameters of the battery pack can be calculated based on the number of cells connected in series and the number of cells connected in parallel to the battery cells, as illustrated by the following equations:
2.2. Inverter
The core function of inverter is to convert the direct current (DC) output from the battery into the alternating current (AC) required by the electric motor. In terms of structure, the inverter is mainly composed of several Insulated Gate Bipolar Transistors (IGBTs) and a number of diodes. IGBTs can efficiently achieve the DC-to-AC conversion between the battery and the motor, as shown in Figure 2. During the switching process of the IGBTs and the reverse recovery of the freewheeling diode, a certain amount of power will be lost, primarily comprising the conduction loss (Pon-state) and switching loss (Pswitch) of the IGBTs, as well as the reverse recovery loss (Precovery) of the freewheeling diode, which are calculated using Equation (3) [20].
where is the power factor of the motor and is the modulation index of the inverter defined as the ratio of the line-to-line voltage () of the AC to the output voltage of the battery, as follows:
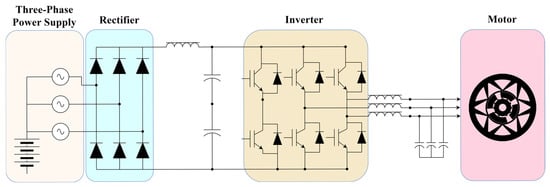
Figure 2.
AC-DC-AC system.
This study referred to the specification parameters from FF450R08A03P2 (INFINEON product). Six IGBTs modules are required to achieve the DC/AC conversion between the battery and the motor. Each IGBT module corresponds to a switch and a freewheeling diode, and the relevant parameters of the inverter are shown in Table 1. According to the motor’s input power () and the power loss values of each part of the inverter, the efficiency () of the inverter can be calculated using the following equation.

Table 1.
The impact of different permeability rates on the grid load.
2.3. Motor
The motor model generates the demand torque when the vehicle is in motion and transfers the demand torque to the transmission mechanism [21]. The output torque of the motor is determined by the maximum load characteristic curve of the motor () and the motor efficiency (), expressed as follows:
The primary task in constructing an electric motor model is to achieve the real-time calculation of motor efficiency and the generation of motor efficiency maps [22]. To this end, this paper introduced the open-source electric motor design tool proposed by Kalt [23]. This tool can efficiently calculate and generate corresponding motor efficiency maps based on various motor characteristic parameters. The following section provides a brief description of the calculation method of this design tool.
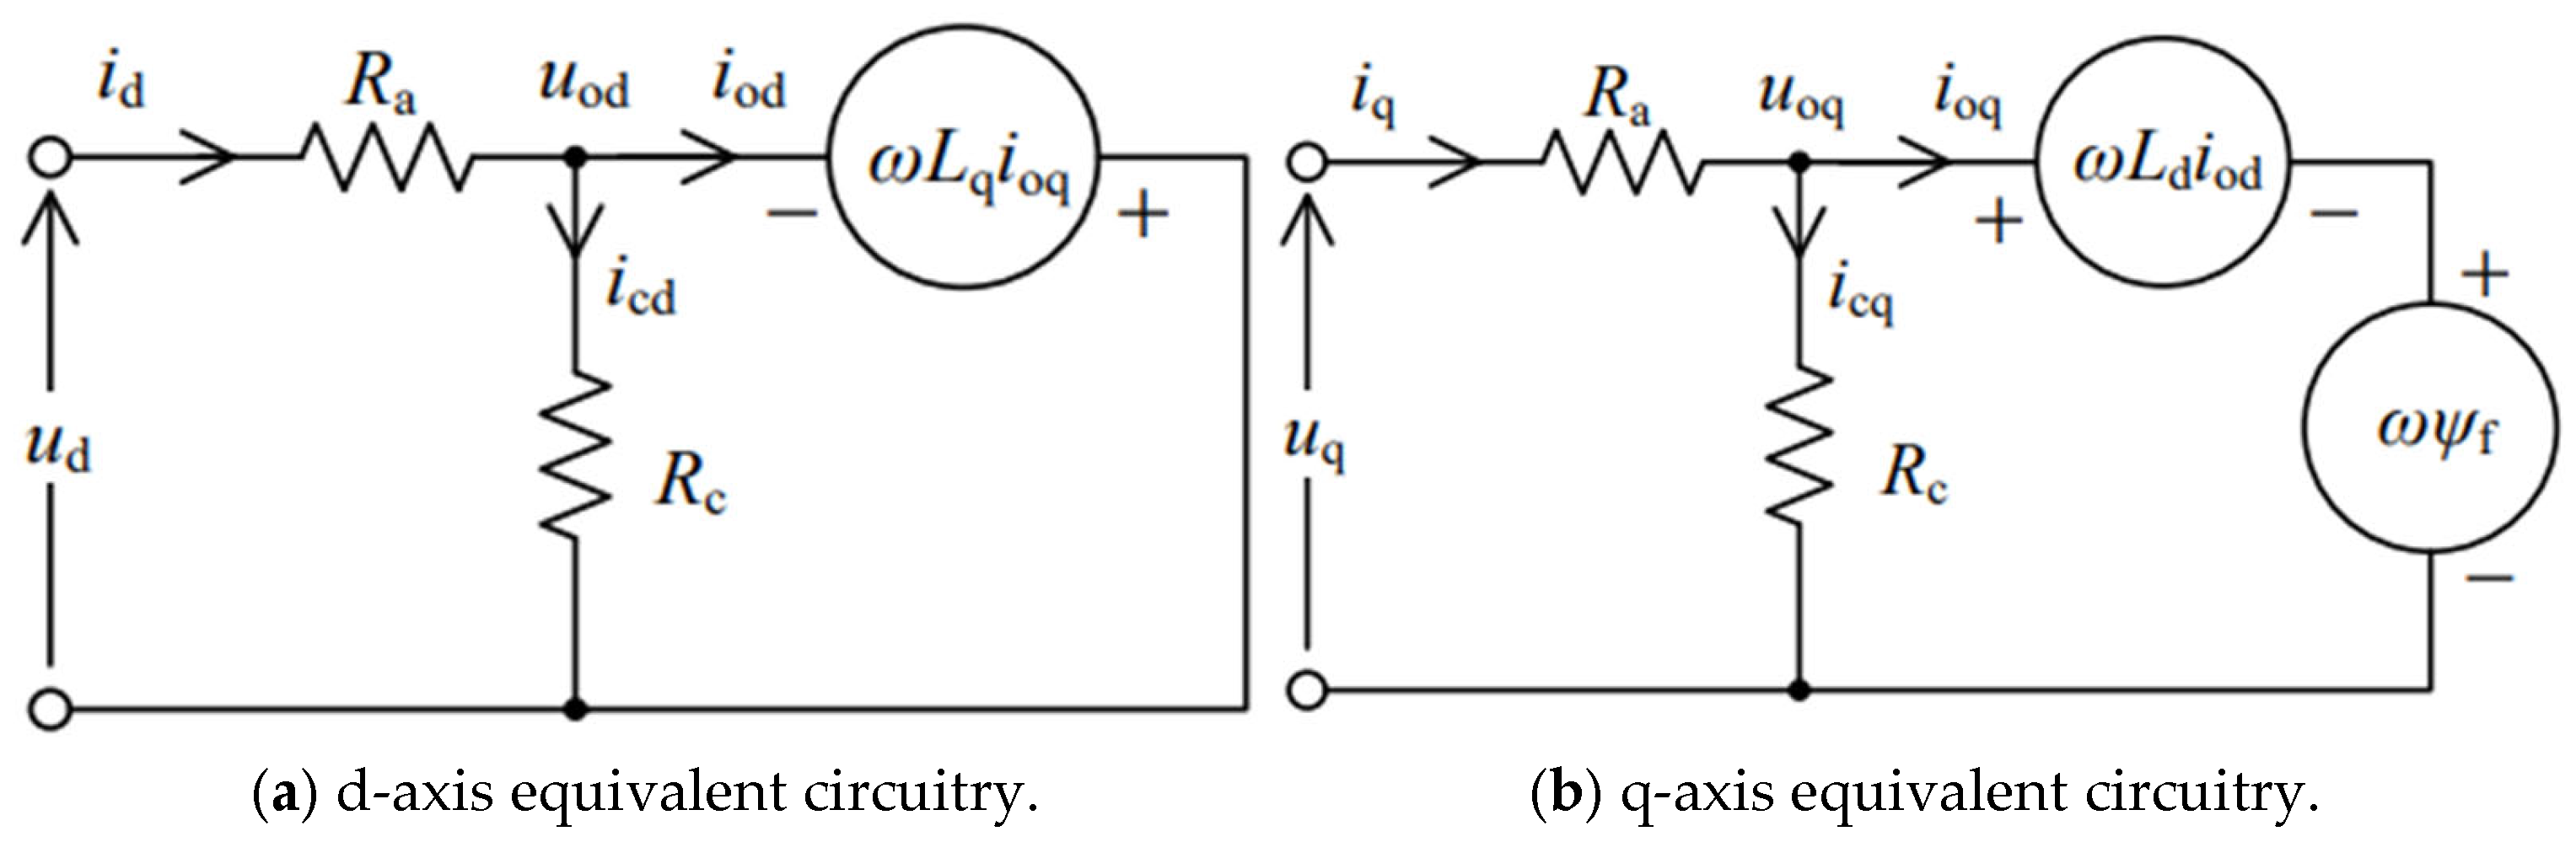
The tool consists of three main parts: the electromagnetic circuit design, the calculation of the motor’s full load characteristics, and the efficiency map. First, the tool evaluates the geometrical parameters of the motor using its rated power, rated speed, and rated voltage. Secondly, the evaluated geometrical parameters are used to calculate the relevant parameters of the equivalent circuit model of the motor. These parameters include the synchronous inductance of the q-axis and d-axis in the d-q transformed coordinate system ( and ) and the equivalent resistance of the copper and iron losses (Ra and Rc). The equivalent circuit model is shown in Figure 3. Finally, the voltage and current values at each grid point are calculated from the parameterized equivalent circuit model. The output torque () of the motor can be calculated using the following equation [11]:
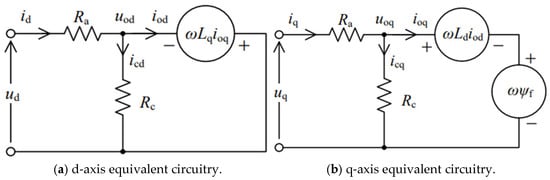
Figure 3.
PMSM equivalent circuit model.
The motor efficiency can be defined as the ratio of the useful power output of the motor to the total power, which is the sum of the useful power and various losses. The latter mainly includes the copper loss (), iron loss (), and mechanical loss () of the motor, expressed as follows:
The calculation of and is dependent upon the equivalent current and equivalent resistance of the d-q axis in the equivalent circuit model, as demonstrated by the following formulae:
Power losses due to bearing and air friction are the primary source of . These losses are proportional to the motor rotor’s circumferential speed (), expressed as follows:
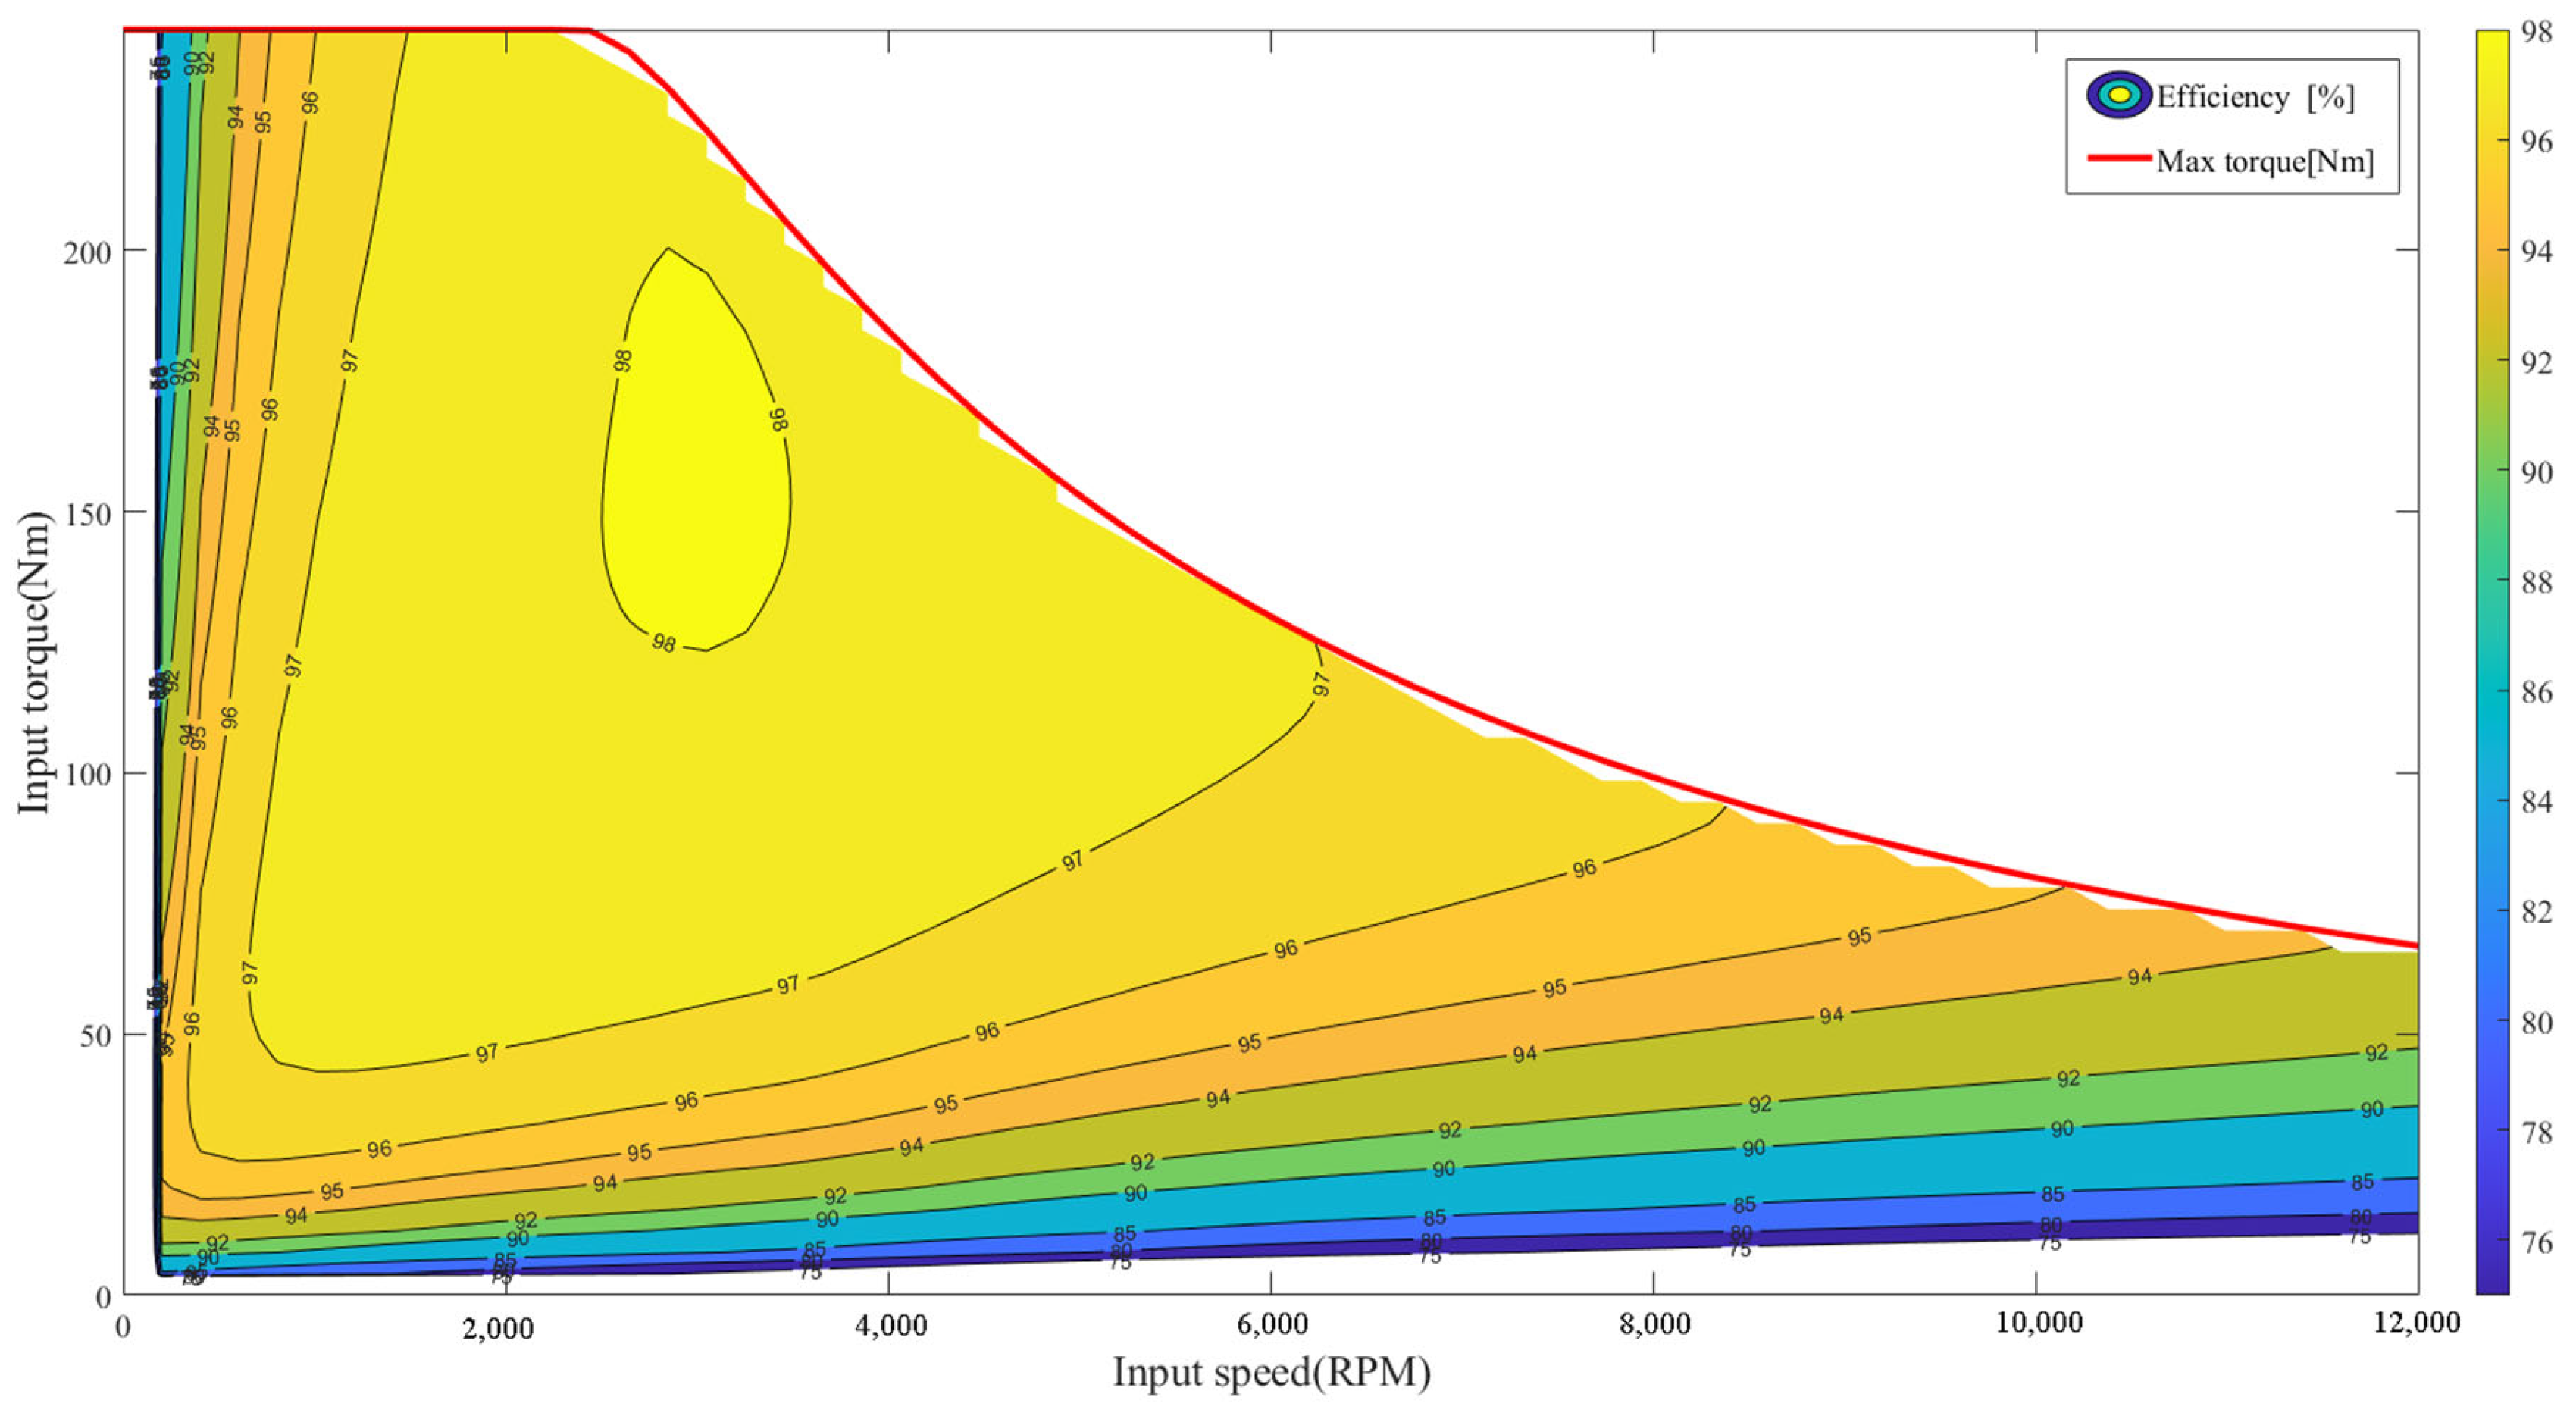
It should be noted that the calculated motor parameters represent peak values. This is because detailed thermal simulations are required to evaluate the motor ratings, and the tool does not include the relevant processes. The full load characteristics and efficiency map of the motor, obtained using the tool above, are illustrated in Figure 4.
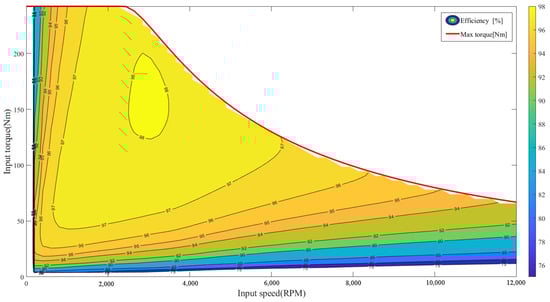
Figure 4.
Full load characteristics and efficiency map of the motor.
2.4. Transmission
The transmission model is employed to receive the output torque generated by the motor and subsequently modify it through the gear set before finally transferring the resulting power to the wheels, which is expressed as follows:
where is the transmission drive efficiency; and are the current gear ratio of the transmission and the main reduction gear ratio, respectively. In this paper, was controlled by the shifting mode of transmission. As this is not the focus of the study, a one-factor shifting mode was adopted, which considered only the speed. The upshift point was designed to be 50 km/h. It is necessary to separate the downshift point from the upshift point to prevent frequent shifting. In this case, the downshift point was set to be 42 km/h. The calculation procedure for the transmission efficiency of the gearbox () presented in this paper was based on the research findings of Zhou et al. [24]. This procedure is specifically designed for 2-Speed Wet DCT, as shown in the following equation:
where is the motor output power; Ploss is the sum of transmission loss power; Ploss can be divided into the following four parts: clutch loss (), gear loss (), bearing loss (), and concentric shaft loss (), expressed as follows:
A comprehensive theoretical analysis of the loss of power of each component in the DCT is presented below:
During the operation of the DCT, the unbonded clutch plates will idle due to the conduction of the gears, resulting in a loss of the clutch (). This loss is determined by the clutch resisting torque () and the ratio () of the currently engaged gear, as well as the motor speed (), which can be expressed as follows:
The process of gear meshing results in a certain degree of power loss due to the rolling and friction between the two tooth surfaces, denoted as [25]. In addition, wind resistance and churning lubricants will also result in a power loss, denoted as . Consequently, can be expressed as the sum of and , described as follows:
is calculated from the equation of the state of the gear teeth in contact and the torque and speed of the pinion gear. is related to the roughness of the gear flanks, tooth surfaces, and the surface of the drive shaft and is expressed by calculating the power losses of the above three parts separately and summing them up, as shown in the detailed calculation formulas below:
The power loss generated by the rotation of bearings can be classified into three distinct categories: load-related power loss (), speed-related power loss (), and oil seal-related power loss (), expressed as follows:
This study utilized the equation for calculating bearing loss, as proposed in the existing literature [26]. The values of are computed using the values of load applied to the bearing, expressed as follows:
utilizes the rotational speed of the bearing to perform the calculation, expressed as follows:
is calculated from the oil seal speed and bearing diameter values, expressed as follows:
Given the disparate speeds of the two concentric axes of the DCT, the lubricating oil filling between the concentric axes will generate viscous shear resistance, thereby causing the DCT to generate a concentric axial loss (). The calculations are conducted using the geometrical parameters of the two rotating axes and the relative velocities, expressed as follows:
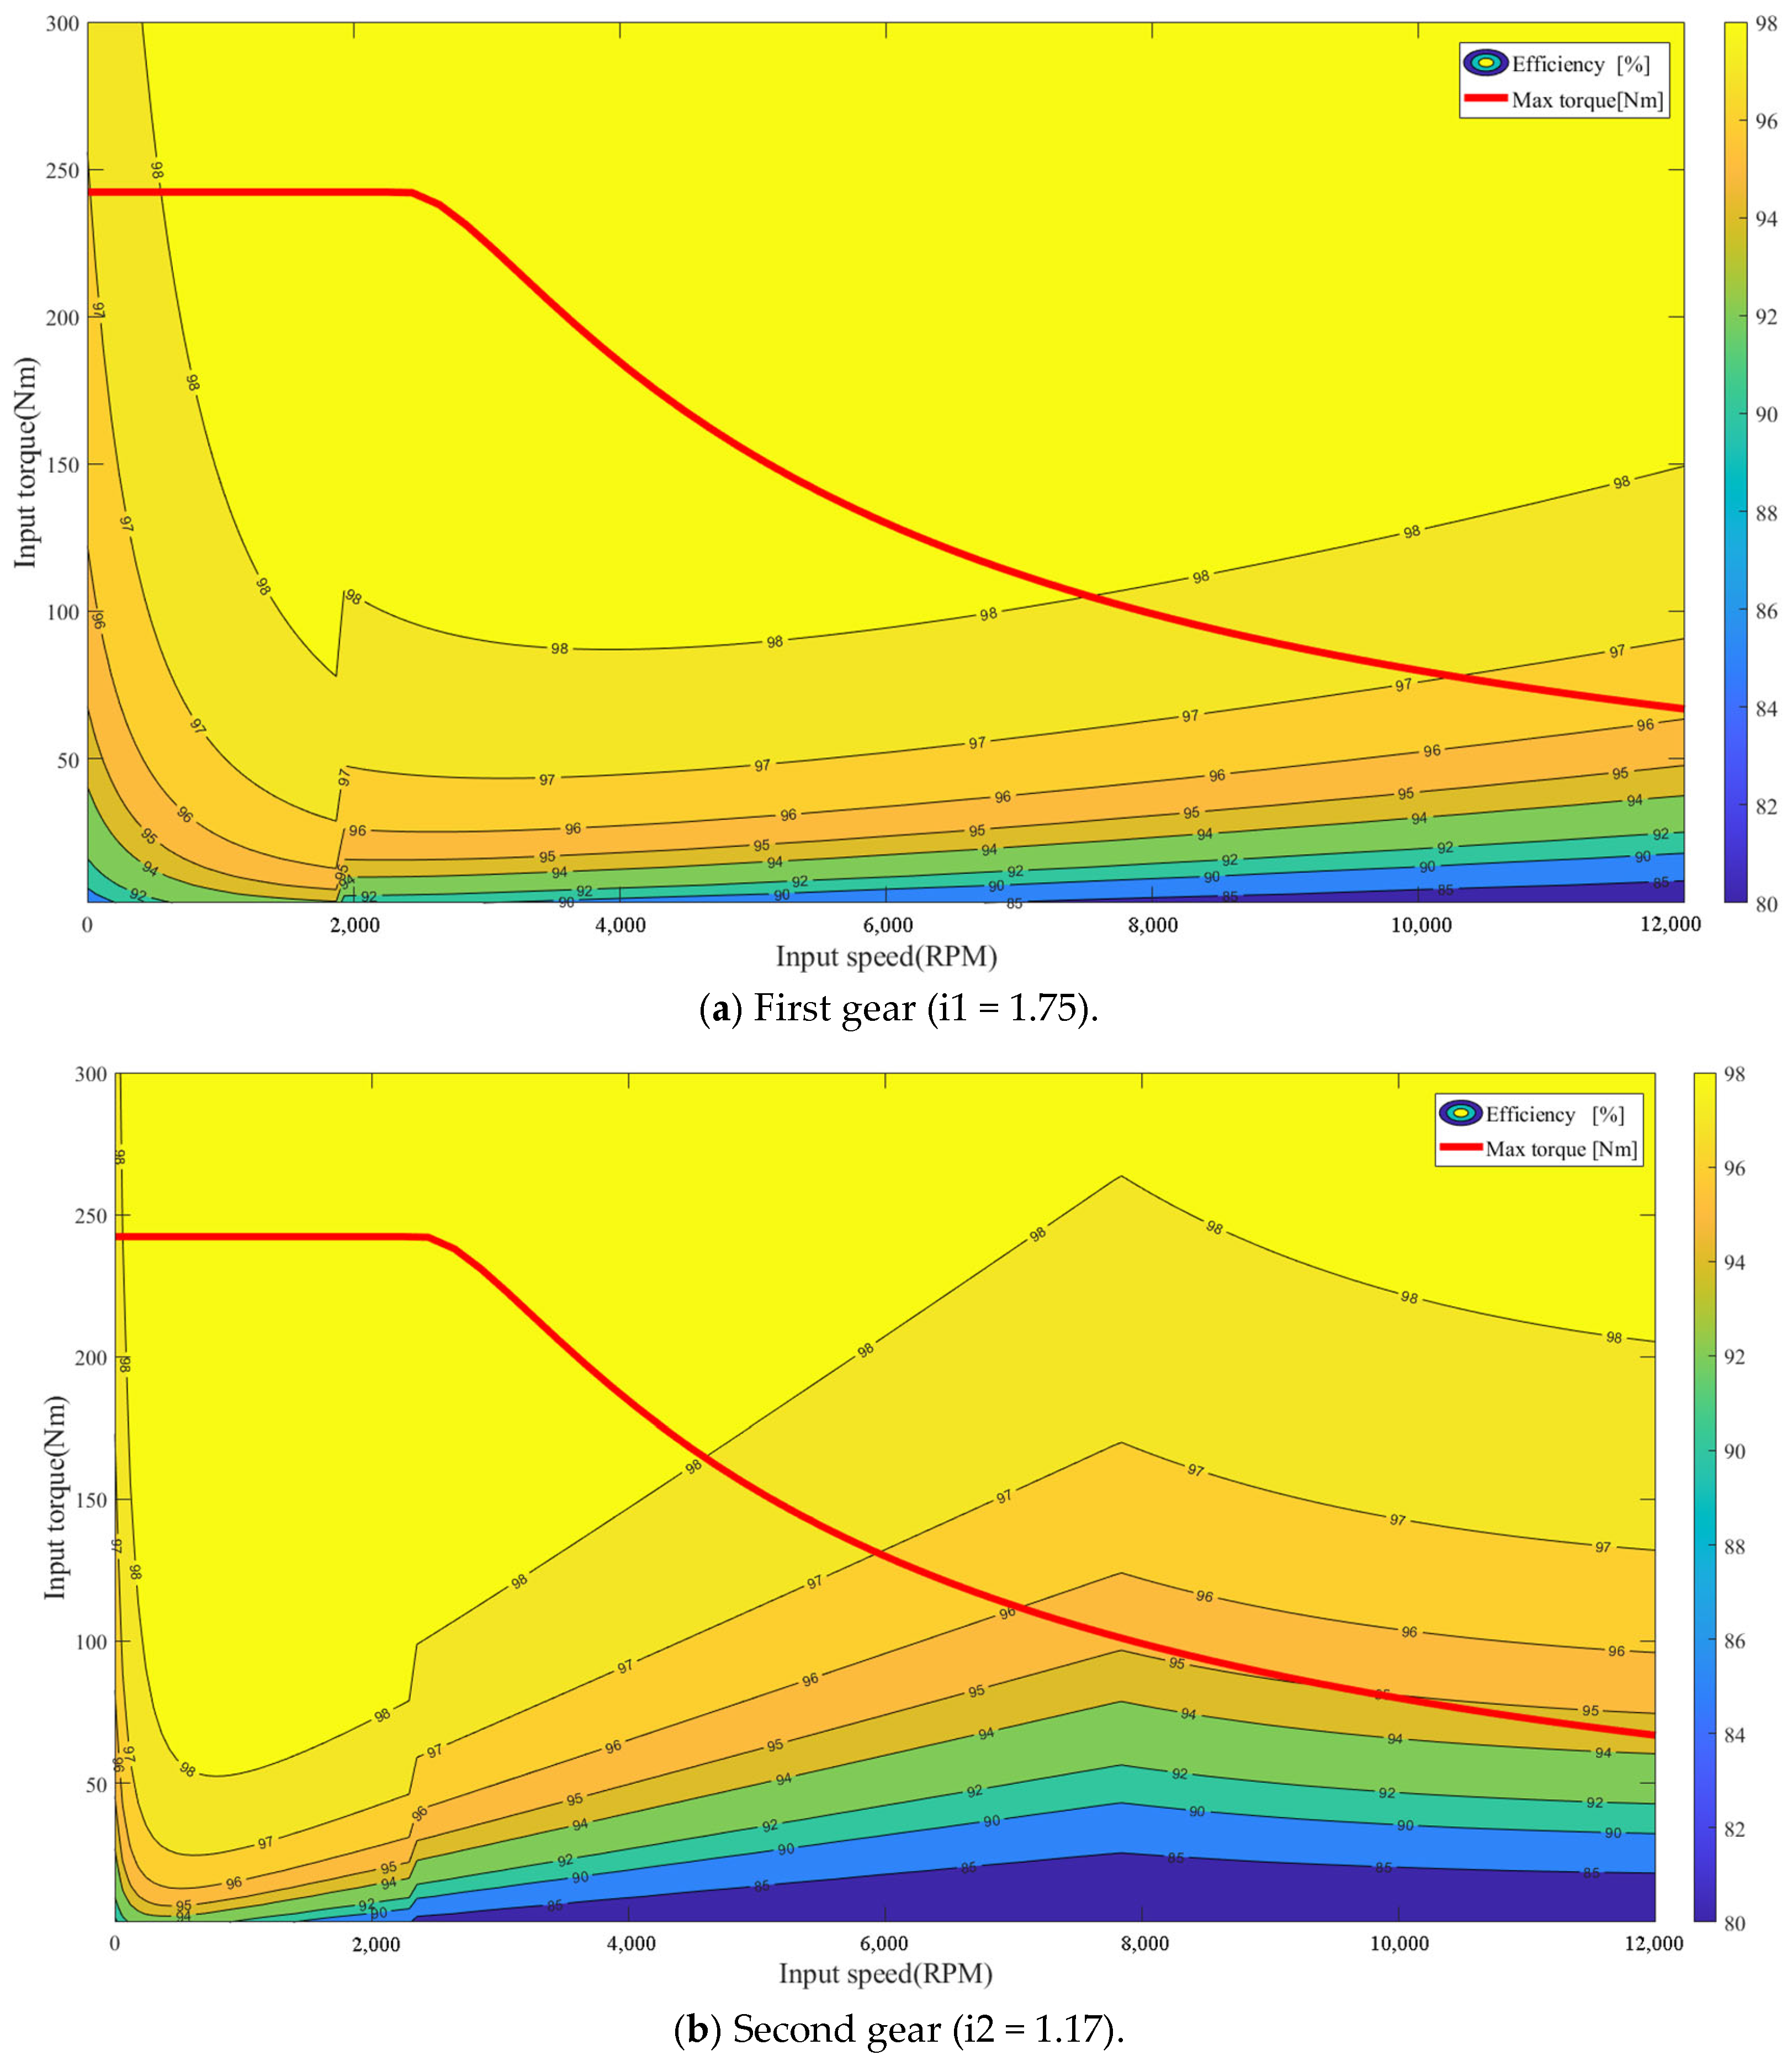
Accordingly, the real-time transmission efficiency can be tabulated using the equations provided (Equations (11)–(20)). The resulting transmission efficiency diagram for the DCT is illustrated in Figure 5. The accuracy of the computational model has been verified in the literature [24].
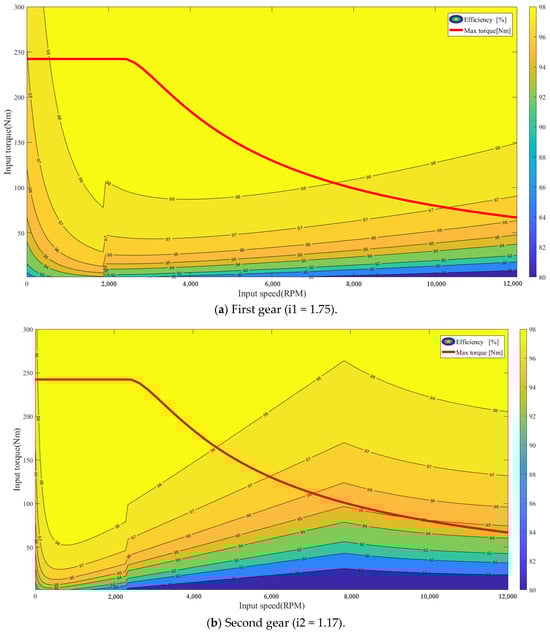
Figure 5.
Efficiency of each drive gear of the DCT.
2.5. Longitudinal Dynamics Simulation
To facilitate the modeling process, the vehicle was defined as a prime. When the electric vehicle is in motion, it is subjected to a driving force () and traveling resistance, which includes rolling drag (), air resistance (), slope drag (), and acceleration resistance () [27]. These forces are expressed as follows:
The equation for electric vehicle driving can be derived from the equations for drive force and various types of driving resistance, expressed as follows:
where is the motor output torque; and are the transmission gear ratios and the main reduction gear ratios, respectively; is the rolling radius of the wheels; is the coefficient of air resistance; represents the density of air at a temperature of 20 °C and an air pressure of standard atmospheric pressure, whose value was set to 1.204 kg/m3; is the windward area of the vehicle; is the coefficient of rolling resistance; is the speed of the car; is the slope angle; is the overall mass; and is the rotating mass conversion factor, whose value was set to 1.07.
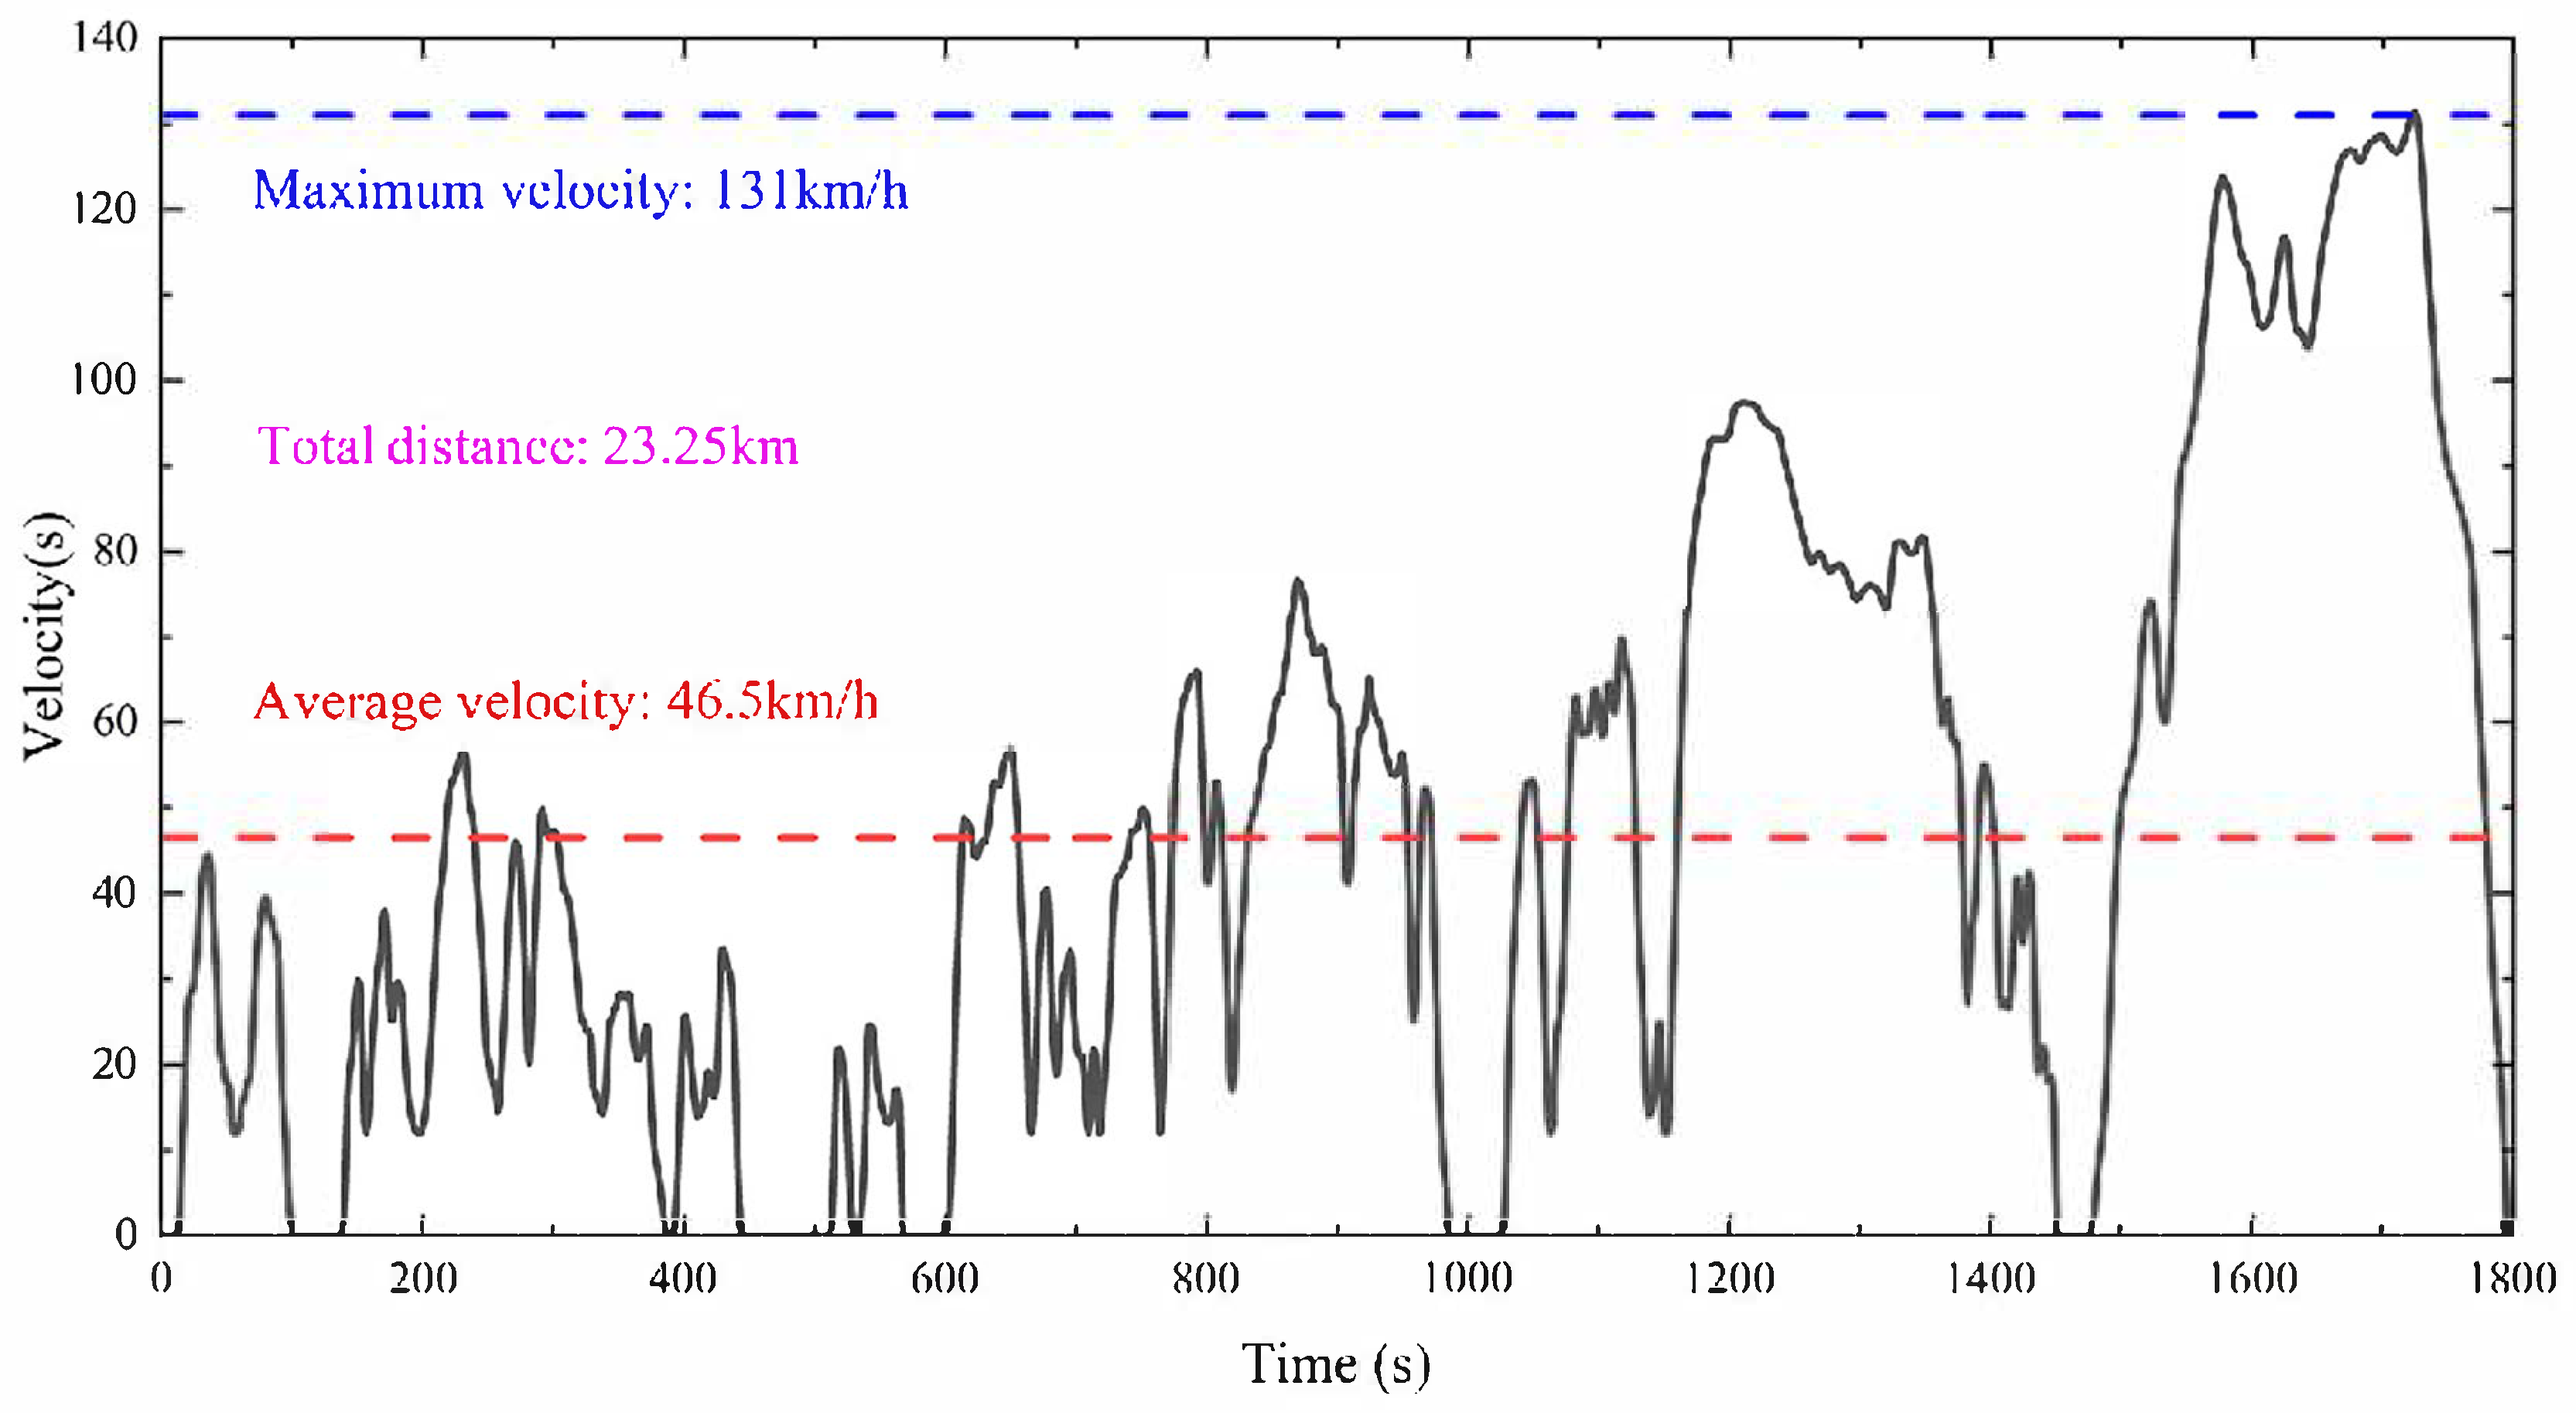
The key performance indicators of BEVs include driving performance and energy efficiency, where energy efficiency is primarily reflected in the electrical energy consumption during vehicle operation. Currently, the Worldwide Harmonized Light Vehicle Test Procedure (WLTP) has been widely applied to the testing of vehicle energy consumption performance, as shown in Figure 6. The following section describes the calculation process of the acceleration time and energy consumption.
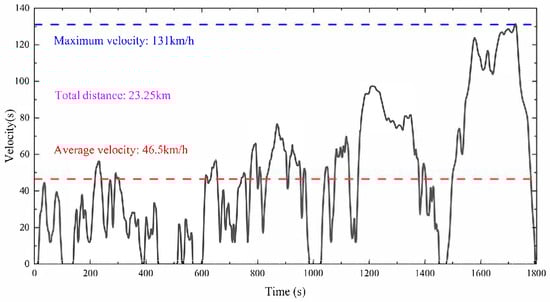
Figure 6.
Speed–time curve of WLTP.
The vehicle is accelerated on a road surface of satisfactory quality, with no consideration paid to the effect of gradient resistance. The time required for an electric vehicle to accelerate from 0 to 100 km/h can be divided into two components: first-gear acceleration and second-gear acceleration times.
where is the acceleration time; and are the maximum actuation force on the wheels in the first and second gears, respectively; is the vehicle speed at the start of shift; is the peak power of the actuation motor; is the nominal rotational speed of the actuation motor; and is the real-time revolution speed of the actuation motor.
The following formula is used to calculate the energy consumption of a vehicle traveling 100 km by the WLTP standard:
where is the efficiency of the motor at the moment, is the efficiency of the transmission at the moment, is the vehicle speed of the car at the moment, and is the total mileage of the WLTP condition.
A review of LDS models for electric vehicles has revealed that the efficiency of the motor and transmission significantly impacts the performance of an electric vehicle. In the context of transmissions, it is paramount to design proper ratios, as they enhance the motor efficiency by adjusting the motor’s operating point and maximizing the percentage of the motor’s effective operating point.
3. Case Studies
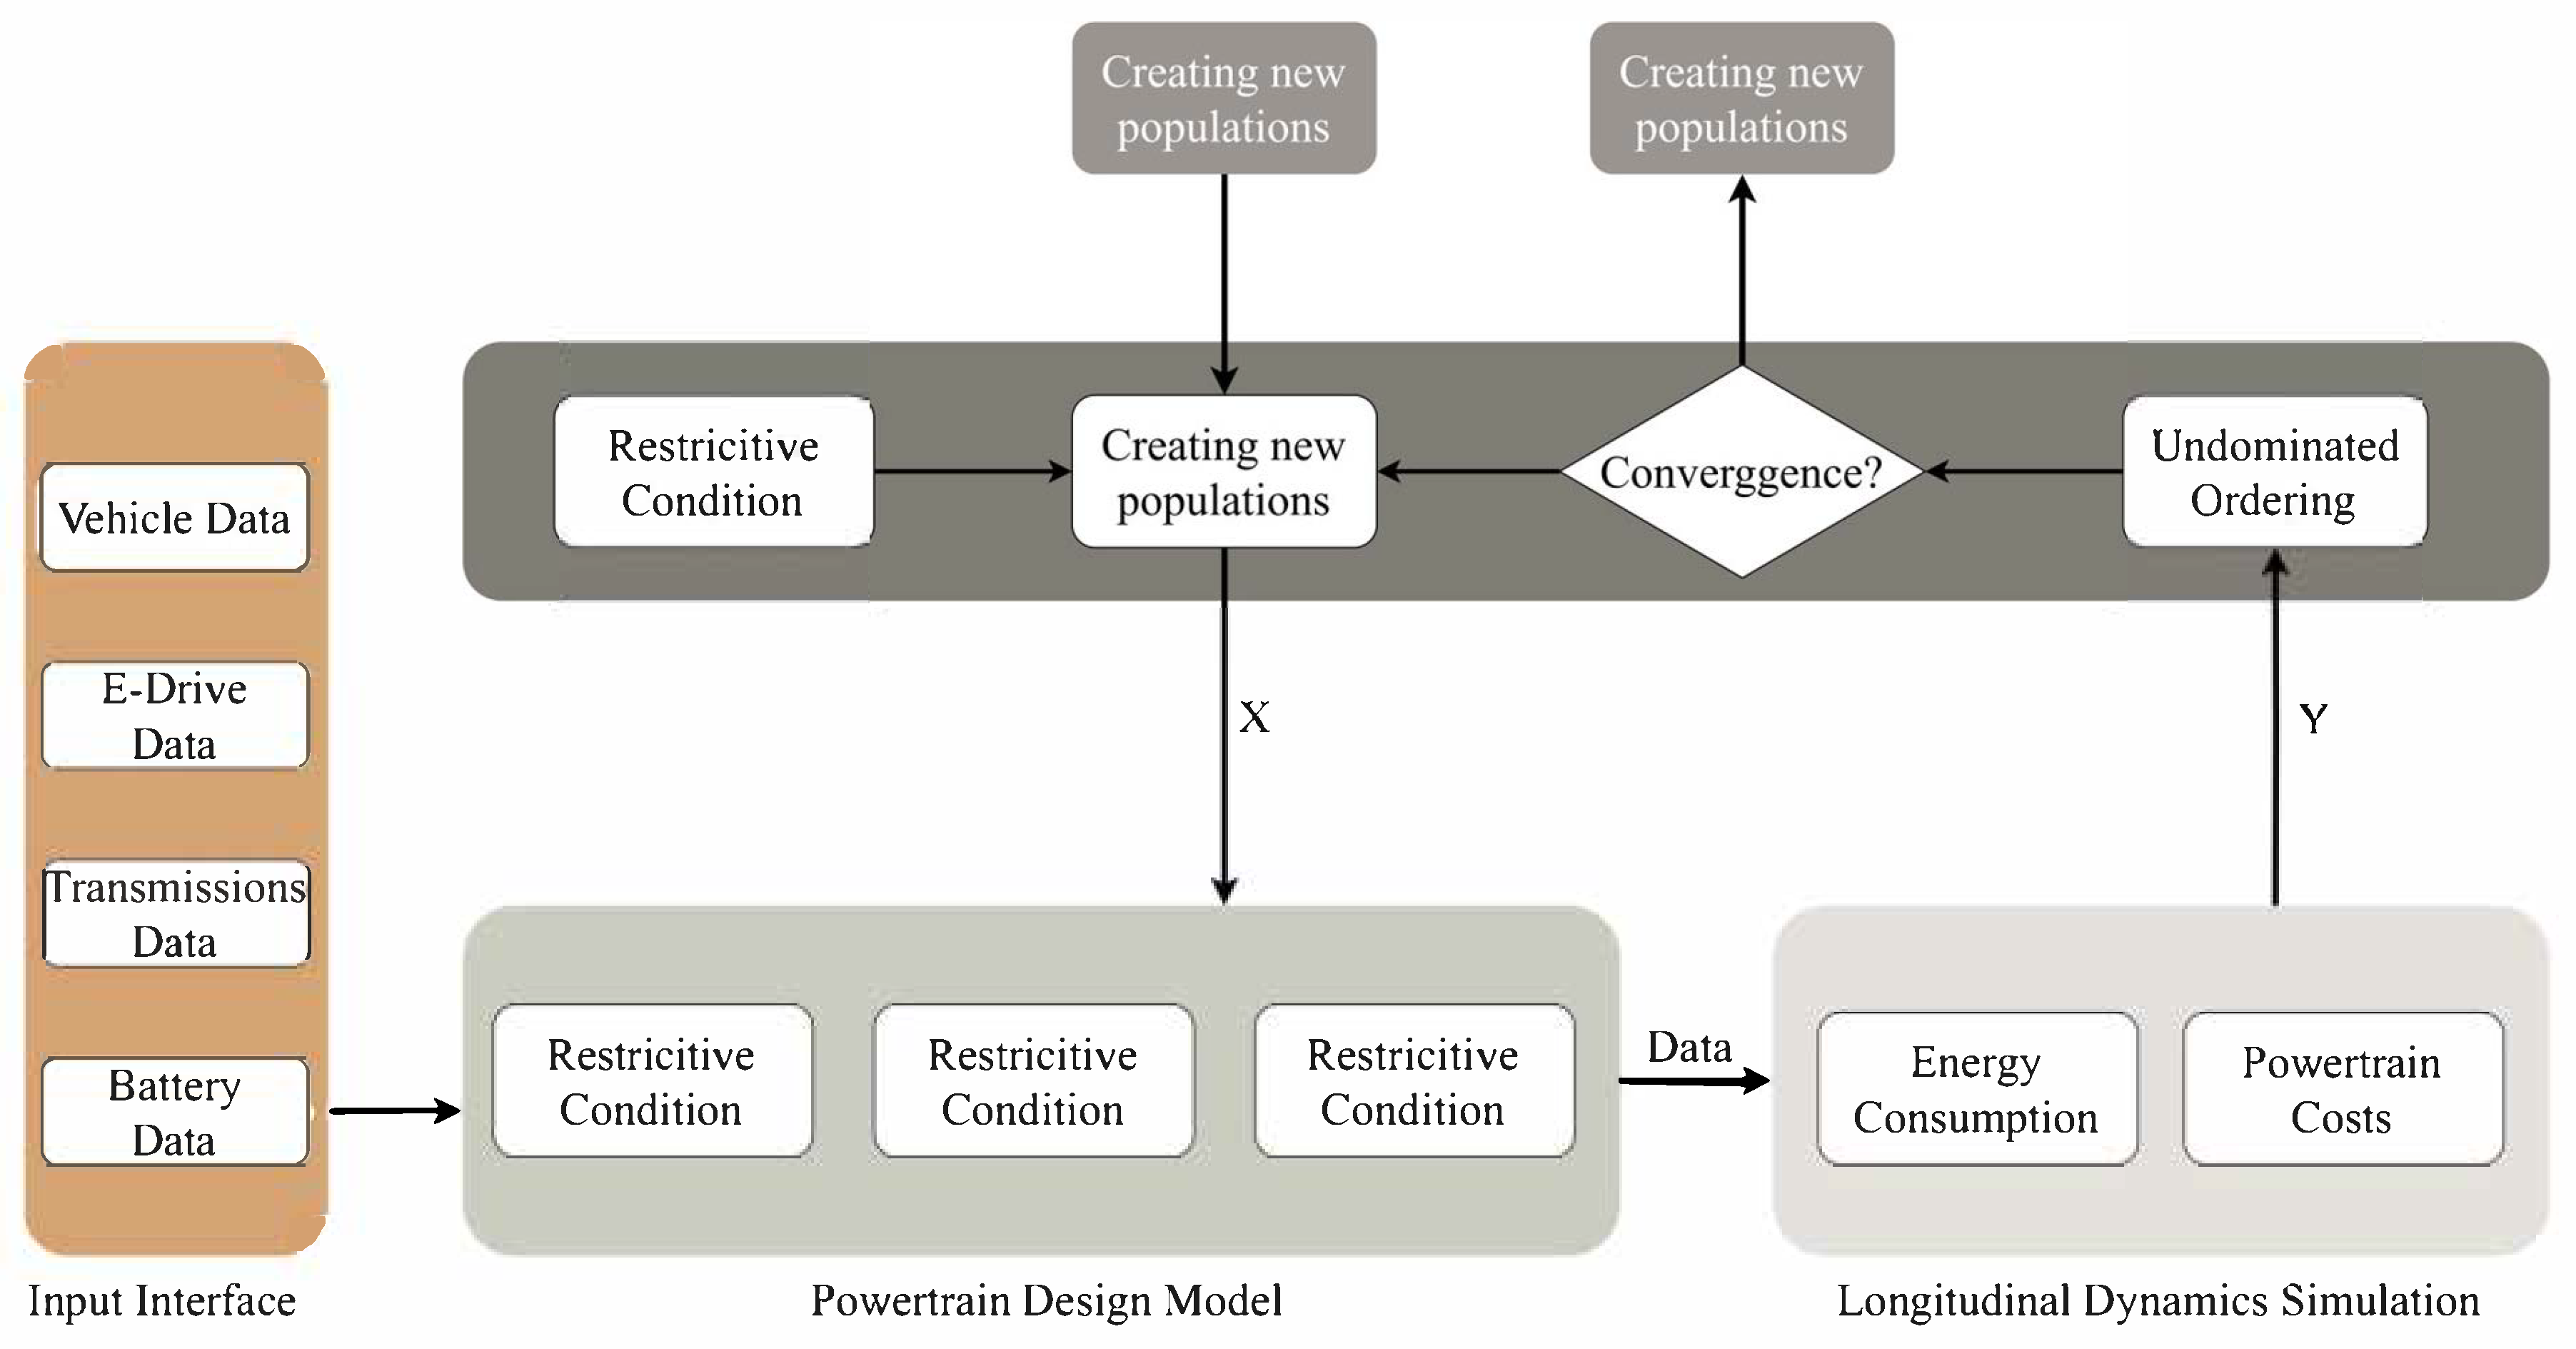
The integration of electric motor (EM) design tools and DCT design methodologies, combined with the multi-objective intelligent optimization algorithm (NSGA-II), enables the optimization design of electric vehicle powertrains. The overall simulation process is illustrated in Figure 7. During each optimization iteration, the algorithm generates new populations based on the variable ranges. Each optimization variable is included in its optimization vector (X). The initialized parameters are combined with (X) and input into the EM design tool and 2-Speed Wet DCT design model. Subsequently, the longitudinal dynamics simulation (LDS) model calculates the objective function values for each candidate design and generates a set of objective function vectors. This set is fed back into the optimization algorithm, which iteratively adjusts the optimization vector (X) until the specified convergence criteria are met.
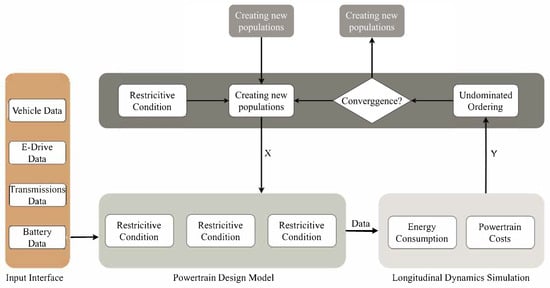
Figure 7.
Holistic powertrain simulation flowchart.
This paper examined a rear-wheel-drive compact passenger car, with its specific parameters and performance indicators shown in Table 2. Table 3 lists the relevant characteristic parameters of the battery cell, assuming these parameters remain constant. The number of series-connected battery cells in the battery pack () was defined by the rated voltage of the motor. Then, the number of parallel-connected battery cells in the battery pack () was determined based on the rated capacity of a 50 kWh battery pack. The selected motor was an interior permanent magnet synchronous motor (IPMSM), with the ratio of its maximum speed () to rated speed () set at 2, and the remaining parameters are shown in Table 4. Due to the lack of structural parameters for the dual-speed DCT gearbox in practical applications, this paper used the data provided in reference [24] to initialize the constant parameters related to transmission.
Table 2.
Vehicle data and the performance metrics.
Table 3.
Characteristic parameters related to battery cells.
Table 4.
Constant parameters used in motor design tools.
4. Multi-Objective Optimization Process
In light of the apparent contradiction between the manufacturing costs of electric vehicles and their energy efficiency, it is imperative to strike a balance between these two factors [28]. The Pareto-optimal solution computed by the multi-objective optimization method can effectively characterize the optimal state of the multi-objective problem. In this paper, we utilized the multi-objective genetic algorithm, an enhanced iteration of NSGA-II, provided in the OPTIMTOOL toolbox of MATLAB® to solve the optimization problem. The population size was 200, the maximum number of evolutions was 40, the replacement probability was 0.8, and the mutation probability was 0.2.
4.1. Design Optimization Variables
The reasonable matching of the motor parameters and the relevant parameters of the transmission system can effectively improve the proportion of the motor’s efficient working time. Therefore, in this paper, the motor-rated power (), rated speed (), motor voltage (), first-gear ratio of DCT (), and second-gear ratio of DCT () were identified as the optimization variables, represented by X = [X1, X2, X3, X4, X5] = [Pem, Uem, nem, i1, i2].
4.2. Optimization Objective Function
In this study, the energy efficiency and economic objectives of electric vehicles were optimized. The energy efficiency optimization target was the energy consumption of BEVs per 100 km in the WLTP test cycle. The economic objective focused on the powertrain cost, with the 2-Speed Wet DCT cost set at EUR 200. The total battery pack cost was calculated based on the number of battery cells, unit price, and additional costs. The price of a single battery cell was EUR 1, and additional structural costs, such as those for the battery cooling system and battery management system (BMS), were EUR 80. The total number of battery cells was determined using Equation (21) [17], and the motor cost was determined at a standard of 8 EUR per kilowatt of rated power.
4.3. Optimization Constraints
In this study, the driving performance indicators of electric vehicles were used as constraints. The alternative design should meet the constraints of a maximum gradient climb of more than 20%, a maximum speed of more than 150 km/h, and an acceleration time from 0 to 100 km of less than 12 s. To ensure the safe operation of BEVs, the discussed vehicles must meet the necessary wheel slip constraints. To prevent wheel slip, the peak torque output by the motor should not exceed the maximum torque of the wheels when the wheel slip coefficient is at its maximum. Its representation is as follows.
where is the wheel slip coefficient with a maximum value of 1.02; is the wheelbase of the vehicle; is the distance between the barycenter of the vehicle and the rear axle; and is the vehicle barycenter height. It is worth noting that alternative designs that do not satisfy these constraints set the optimization.
In summary, the multi-objective optimization model for the powertrain parameters of an electric vehicle matched with a 2-Speed Wet DCT system is as follows.
A review of the inequality constraints reveals that multiple constraint variables are interrelated and influence each other. Consequently, it is impossible to determine the explicit value range of optimization variables from the above inequality constraints. Accordingly, concerning the literature [17], and in consideration of the design requirements of the target vehicle model, the domains of the optimization variables of , , and were defined as follows: ∈ [70 kW, 120 kW], ∈ [4000 rpm, 6000 rpm], and ∈ [300 V, 600 V]. The values of the set parameters were substituted into the above four inequalities, thereby calculating the definition domains of the transmission ratios, and . The domains of and were as follows: ∈ [1.36, 3.64] and ∈ [1, 2].
5. Case Design Results
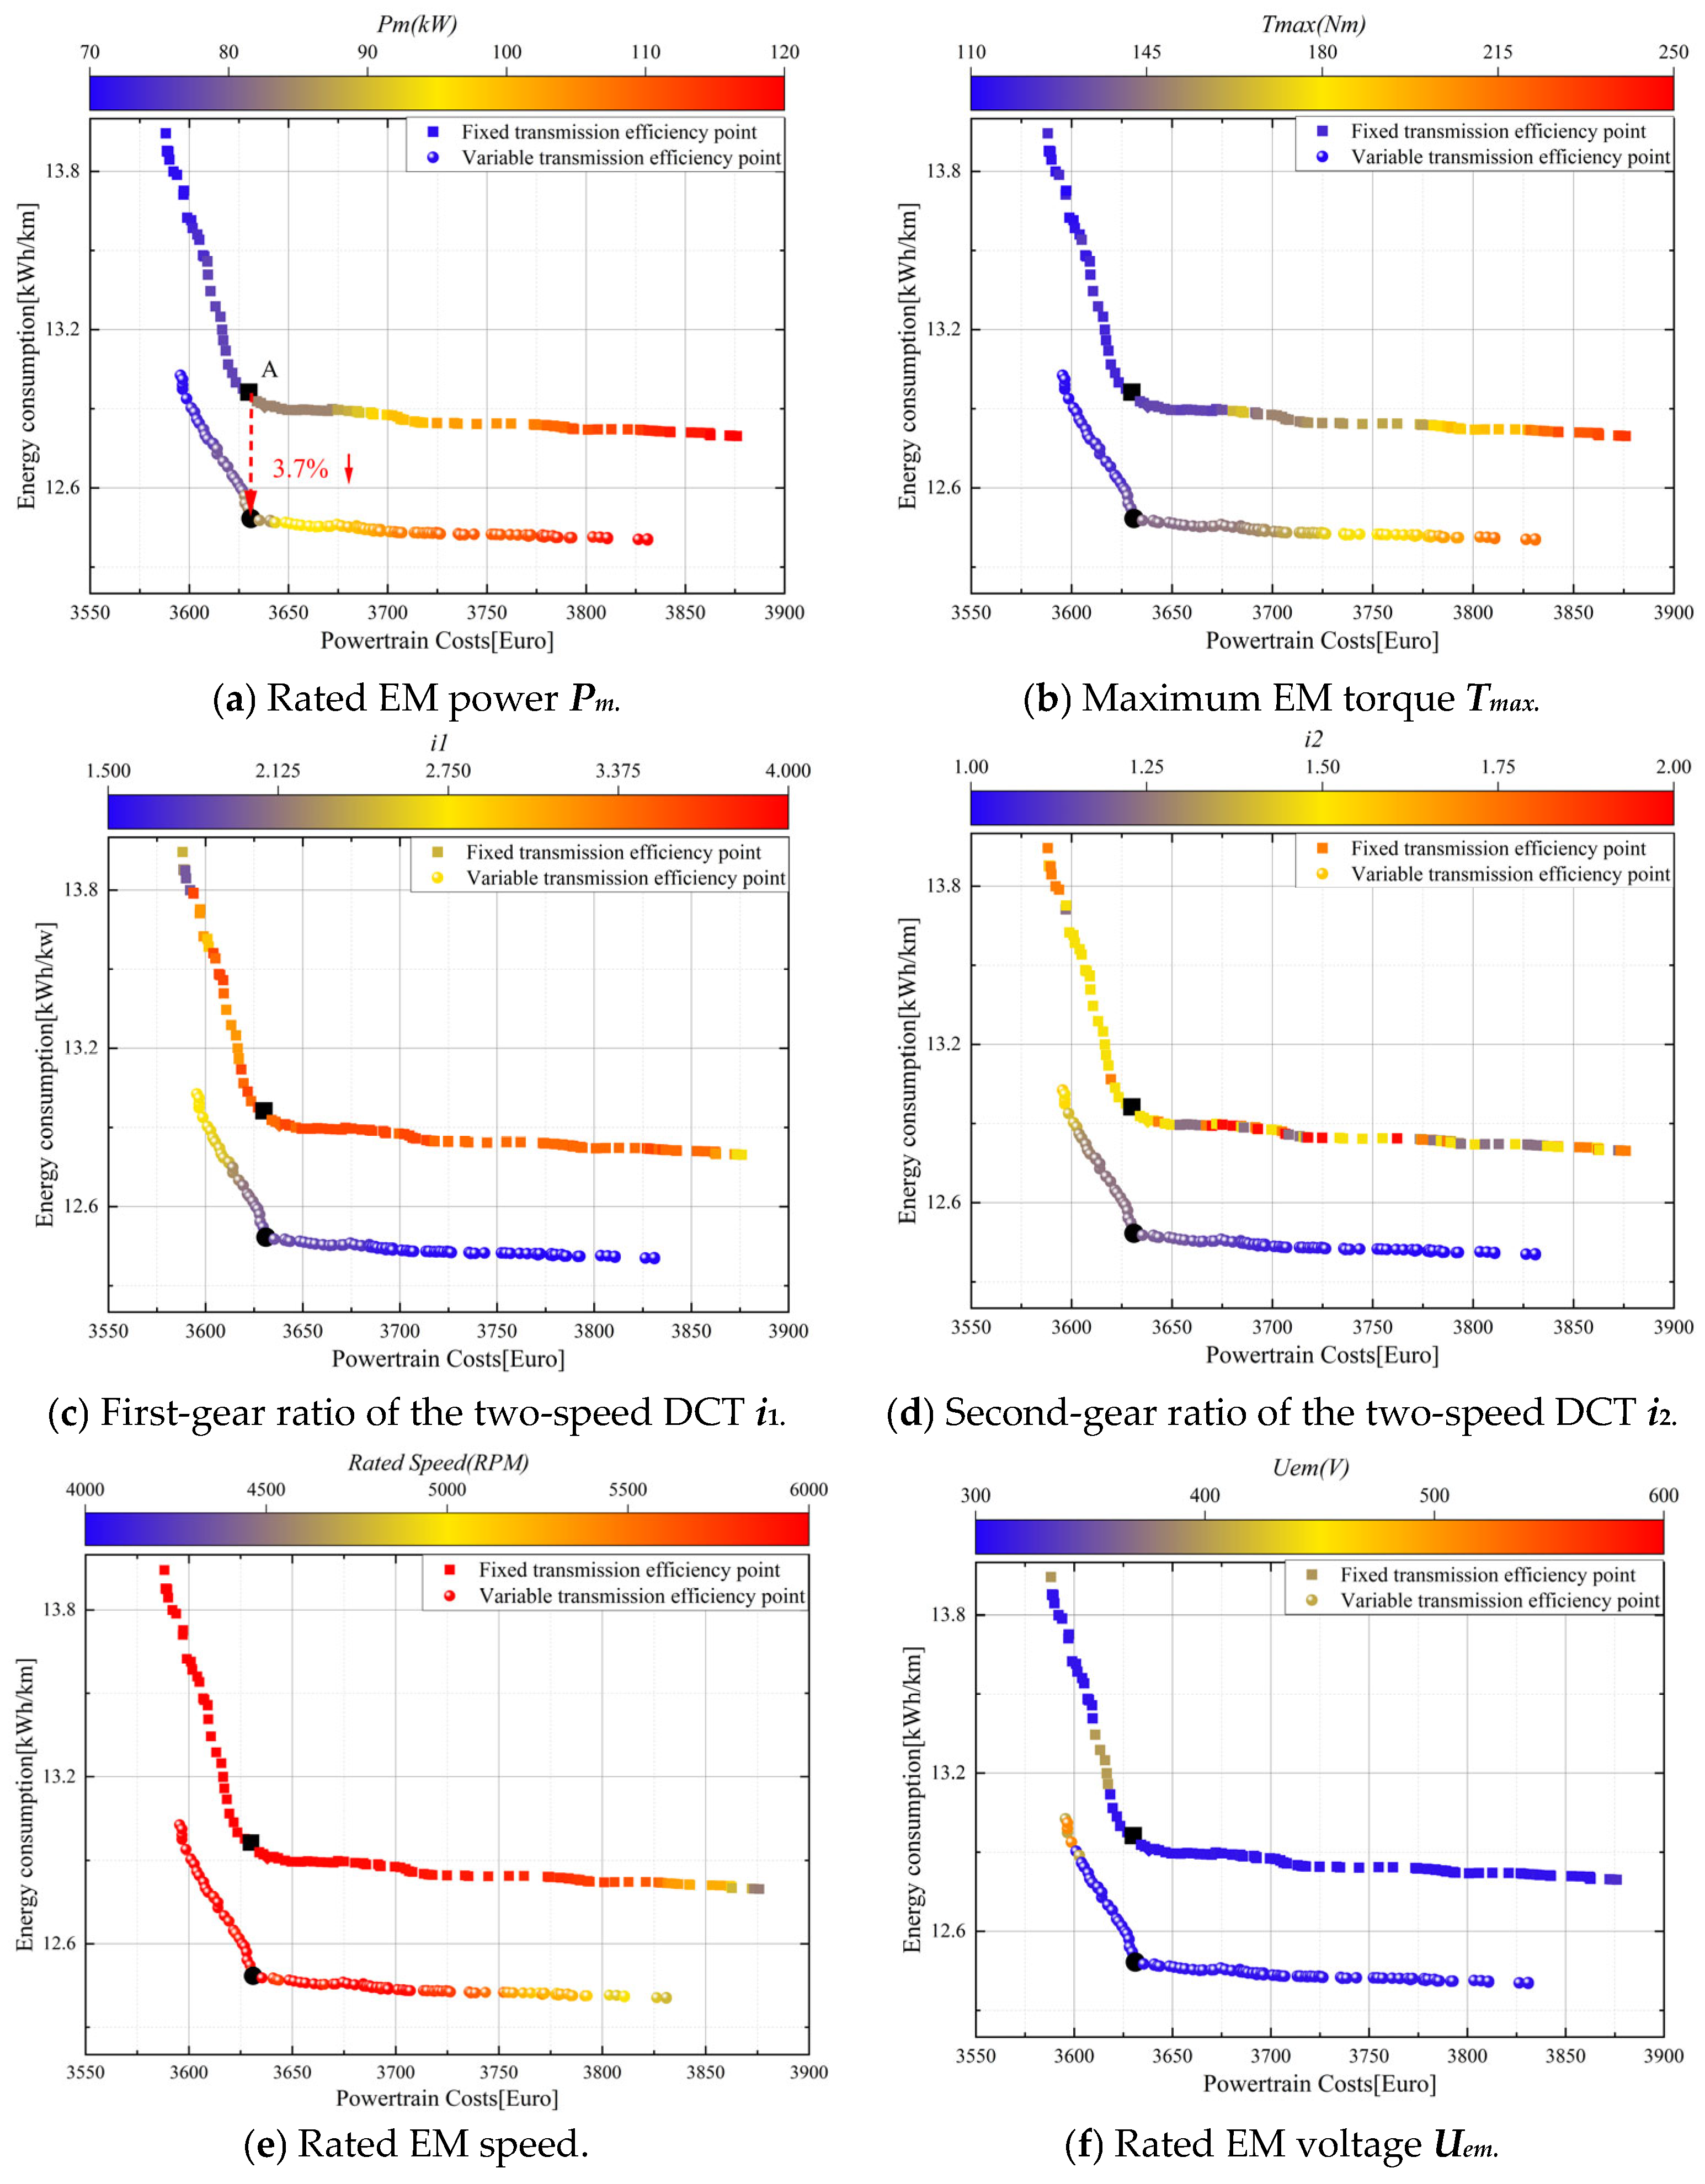
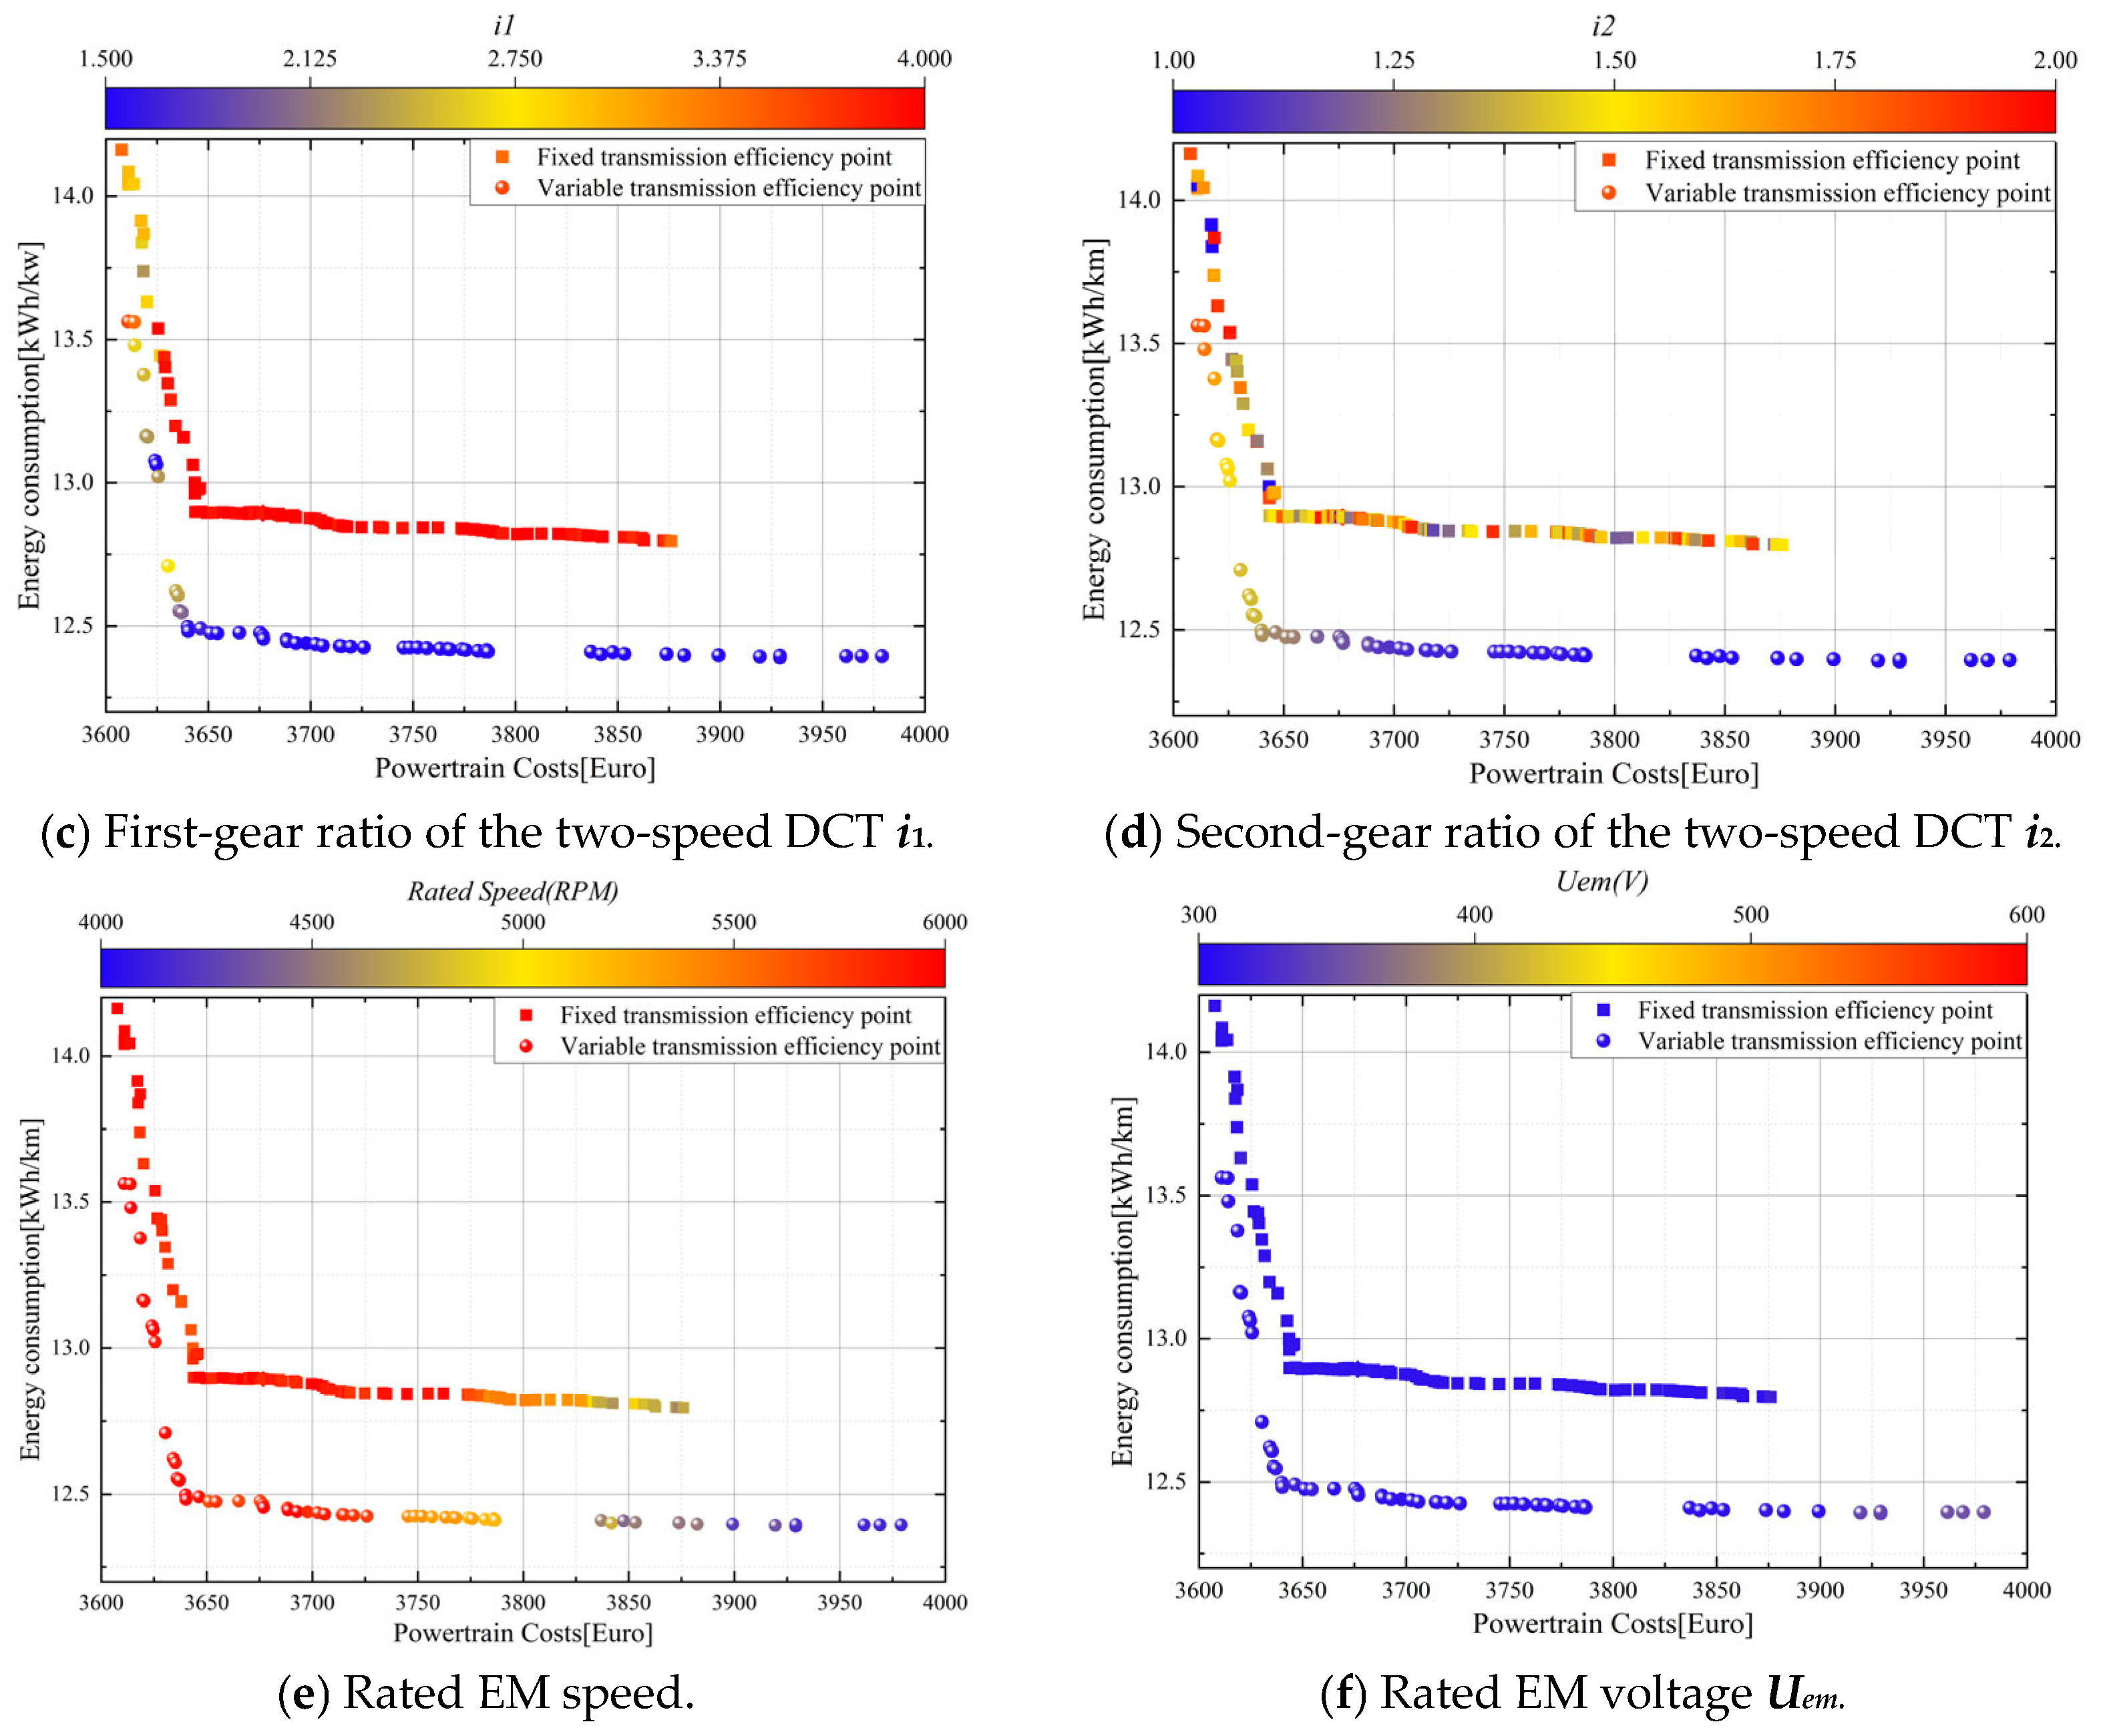
In order to achieve the optimal design of the electric vehicle (EV) powertrain, the efficiency variations of the motor and transmission were fully considered. A joint optimization was performed for the power, speed, voltage of the motor, and the ratio of the multi-speed transmission based on two different acceleration time objectives (10 s and 12 s), as well as all the Pareto-optimal solutions. The results of the multi-objective optimization are presented in Figure 8 and Figure 9. In each subfigure, the horizontal axis represents the cost of the powertrain design for each alternative, and the vertical axis represents the electrical energy consumption for each alternative over 100 km of driving in the WLTP test program. The color scale represents the change in the value of each optimization variable. The computational model based on variable transmission efficiency is spherical, while the computational model with fixed transmission efficiency is square.
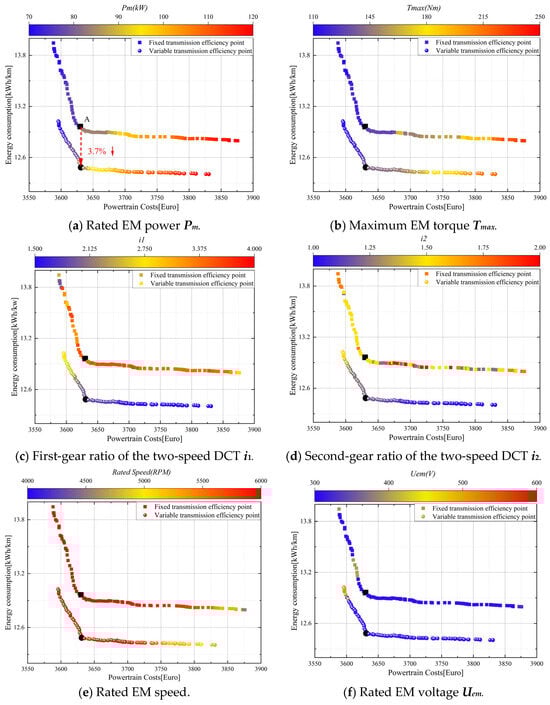
Figure 8.
Pareto optimization results corresponding to the main design parameters (ta < 12 s).

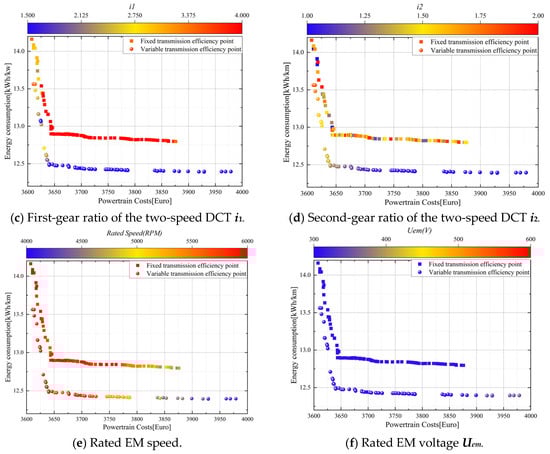
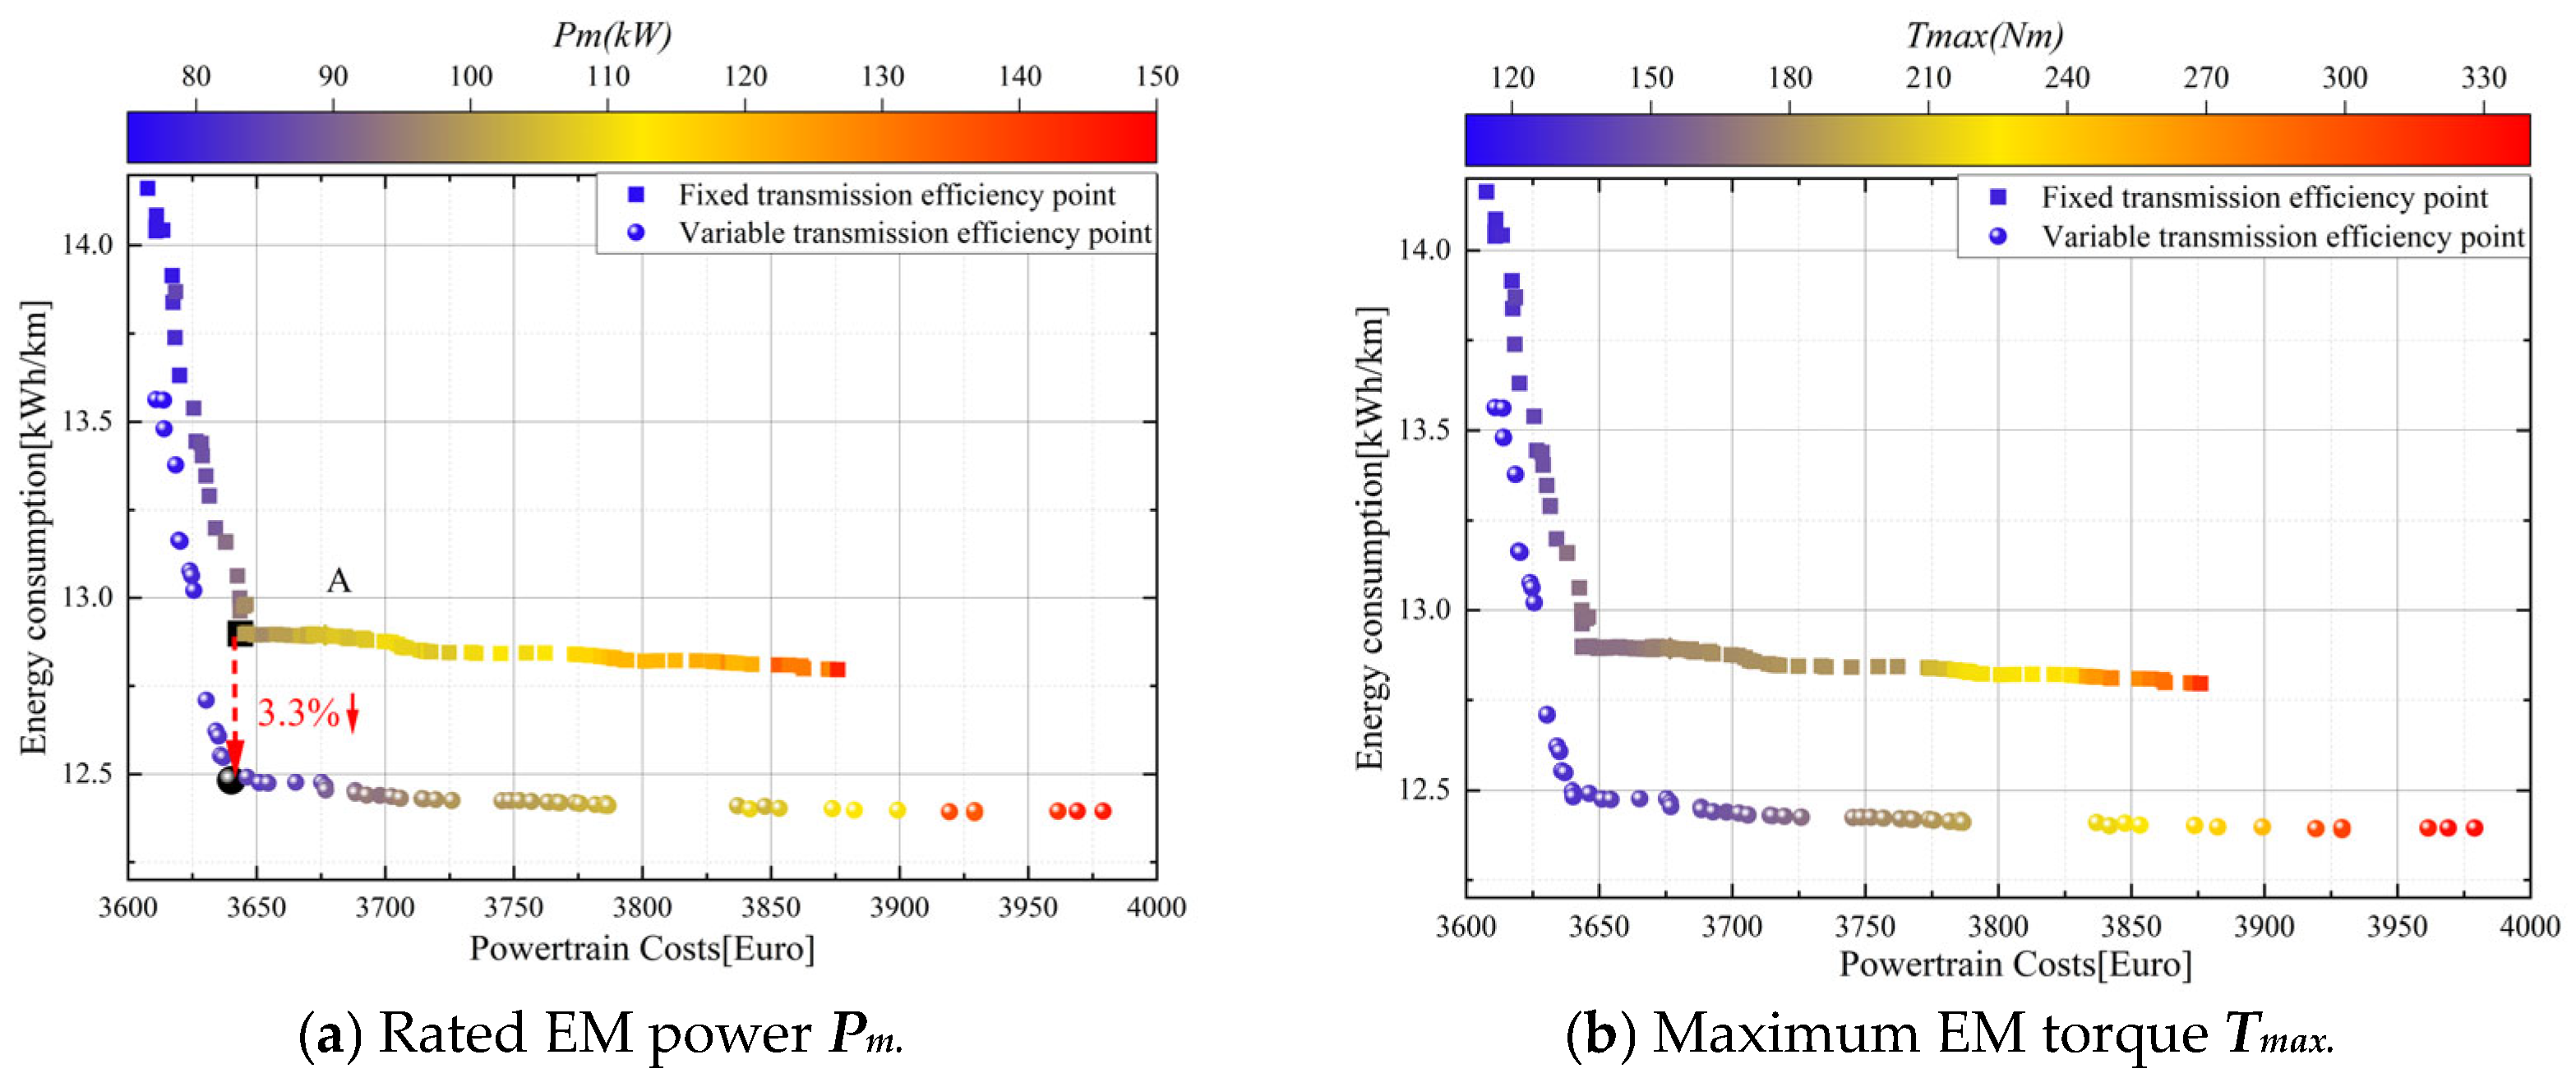
Figure 9.
Pareto-optimal results corresponding to the main design parameters (ta < 10 s).
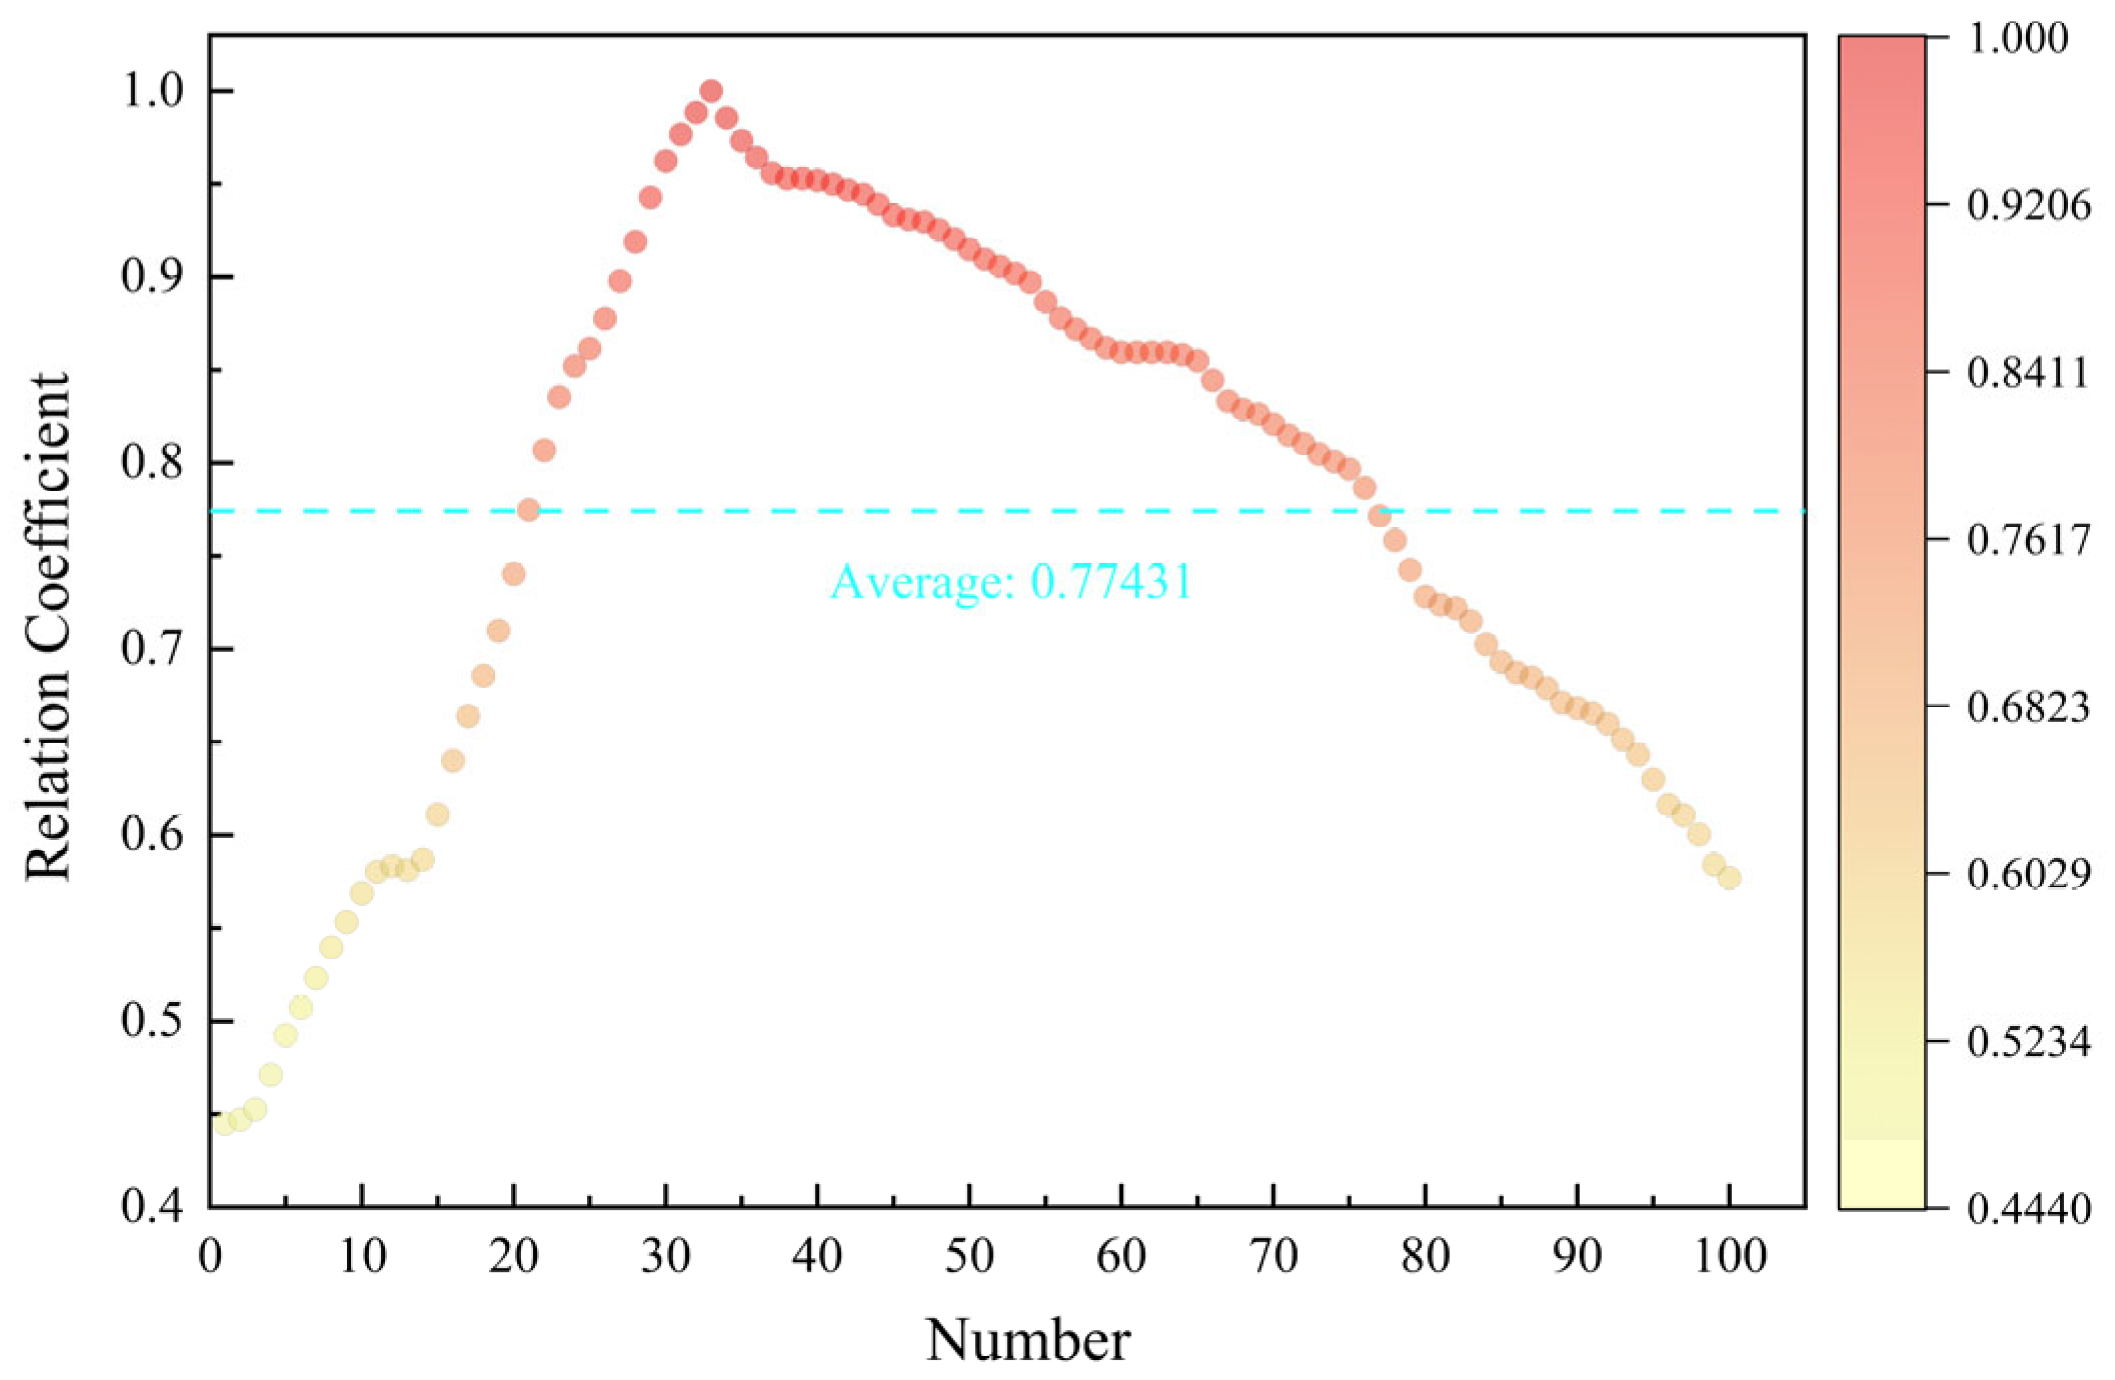
The Pareto-optimal results indicate the existence of a turning point, designated as A, between the two optimization objectives of cost and EC. Furthermore, it can be observed that a minor alteration in cost will result in a significant variation in EC to the left of point A. To the right of point A, a minor alteration in EC will result in a substantial alteration in cost. The Pareto-optimal results provide optimal choices for different BEV powertrain configurations. The designer must consider the powertrain’s cost and the BEV’s electric energy consumption to select the most appropriate optimization solution. The alternative represented by point A can achieve the optimal state of the current optimization objective without significantly changing the other optimization objective. Accordingly, this paper considered the alternative at point A as the optimal solution to the multi-objective optimization problem, with the optimization results presented in Table 5. A comparison of the distributions of the two optimal gear ratios of the transmissions in Figure 8c,d reveals that lower gear ratio combinations can result in a notable reduction in energy consumption when calculated using the variable transmission efficiency model. Conversely, an analysis of the optimal distributions of rated power and maximum torque in Figure 8a,b indicates that the higher the power and torque output from the motor, the lower the energy consumption. This phenomenon can be attributed to the fact that the relationship between motor power and efficiency is not readily apparent in the efficiency diagram of a motor. Consequently, a comparable efficiency level can be attained irrespective of the motor power configuration. This indicates that the power system comprising a high-power motor and a low-gear-ratio transmission will not undergo a notable alteration in motor efficiency while fulfilling the requirements of electric vehicles in terms of drive performance. The relationship between transmission efficiency and gear ratio shows a low gear ratio can improve transmission efficiency. Therefore, it can be concluded that a transmission system with a high-power motor matched with a low-gear-ratio transmission can achieve the best energy-saving effect. However, it should be noted that an increase in motor power will significantly increase the consumer’s purchase cost, which needs to be considered. Considering the correlation between energy consumption and power costs, this paper employed grey relational analysis to quantify the degree of correlation between the two, with an average correlation degree of 0.77431, as shown in Figure 10.
Table 5.
Optimal design candidate for multi-objective optimization problems.
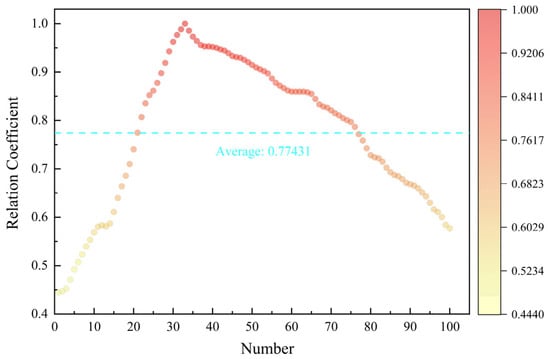
Figure 10.
Results of the grey relational analysis.
To further validate the superiority of the transmission structural design using variable transmission efficiency, the transmission efficiency of the DCT transmission in both gears was set to the average of the variable efficiencies, = 0.96, and the remaining structural parameters were maintained at their original values. The multi-objective optimization was then conducted, and the resulting Pareto front was compared with the optimization results, as illustrated in Figure 8 and Figure 9. The findings indicate that the two approaches to modeling transmission efficiency yield markedly disparate Pareto frontiers. The transmission model that accounts for variable transmission efficiency demonstrates superior energy savings. The values of Ec are reduced by 3.7% and 3.3%. This indicates that a constant transmission efficiency may underestimate the potential for the optimization of the BEV transmission efficiency. A variable efficiency analysis based on crucial powertrain components is essential to achieve the optimal design of BEV powertrains.
The effect of drive performance on the optimal powertrain design results was verified by increasing the acceleration time from 10 s to 12 s. The results show that the cost of the EV powertrain is susceptible to the change in the drive performance. In contrast, the effect of the drive performance on the energy efficiency of the powertrain is low due to the following reasons: the reduction in the acceleration time requires higher power and torque motors to be achieved, and the cost of the motors is positively correlated with the power index, which in turn increases the cost of the powertrain significantly.
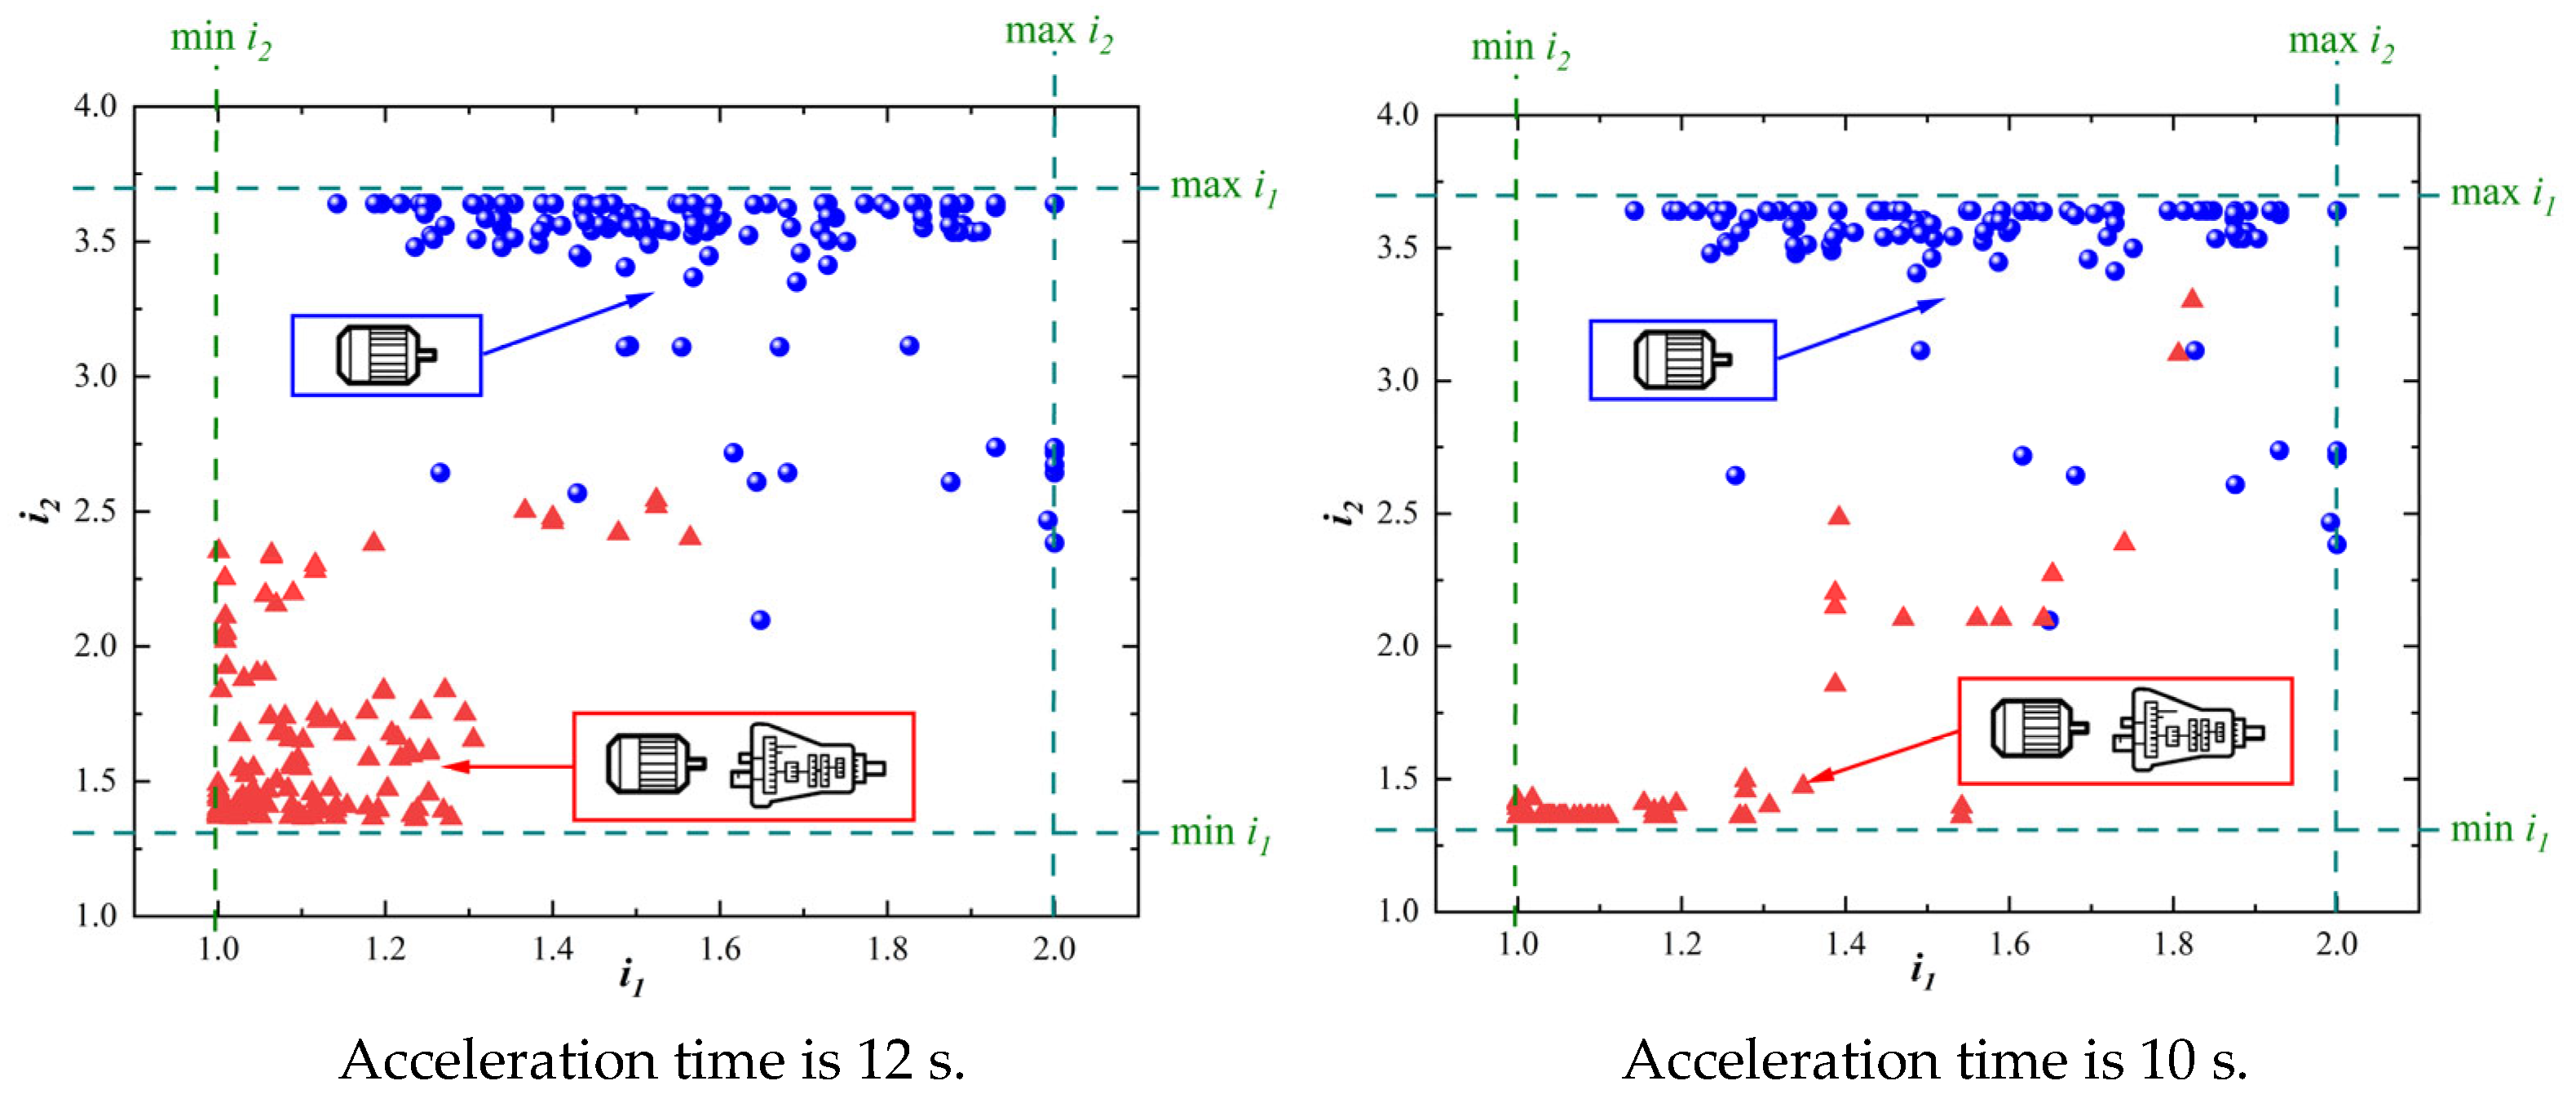
Figure 11 illustrates the distribution of the optimal ratios for the two drive performance requirements, with the blue spherical dots indicating the Pareto points obtained from modeling and optimization using fixed drive efficiencies and the red triangular dots indicating the Pareto points obtained from modeling and optimization based on variable drive efficiencies. The results of the distribution of the optimal ratios show that the results obtained using different modeling schemes are significantly different. In the case of fully considering the efficiency distribution of the motor and the DCT, the distribution of the values of and is smaller than that of evaluating the motor’s efficiency only. The reason is that, in the efficiency calculation model of the DCT, a lower transmission gear ratio can obtain higher transmission efficiency in the low and medium speed range. At the same time, the test of WLTP points is mostly concentrated in the low and middle speeds of the vehicle; so, in the joint optimization process of the powertrain of BEVs, a lower transmission gear ratio will obtain a higher energy efficiency.

Figure 11.
Optimal gear ratios of each Pareto front.
6. Conclusions
This paper aims to present a system design methodology for the critical components of an electric vehicle powertrain that facilitates the optimal design with a single electric motor matched to a DCT. A real-time efficiency calculation model for the motor, the inverter, and the transmission was constructed by examining the electromechanical characteristics of the principal components within the powertrain system. The computational results demonstrate that their efficiency distributions show a notable discrepancy when the motor and transmission operate simultaneously. Therefore, the optimal design of a single component does not necessarily guarantee the optimal design of the entire electric vehicle powertrain system. It is thus necessary to consider the interdependence between the critical parameters of two components and construct a unified optimization model that optimizes the overall structure. This approach will help to achieve the optimal electromechanical efficiency at each working point.
A multi-objective optimization was carried out based on the above two objectives to solve the trade-off between the efficiency and cost of electric vehicle power systems. Using the dynamics index as a constraint, the critical parameters of the motor and transmission were taken as design variables, and the optimization calculation was completed using the enhanced NSGA II algorithm. The Pareto front obtained from the optimization results indicates that there is a turning point between the cost and efficiency of the powertrain, at which the optimal state of the current optimization objective can be achieved without significantly changing the other optimization objective, thus achieving an effective trade-off between the optimization objectives. In addition, in the optimization cases of variable transmission efficiency and constant transmission efficiency, the Pareto frontier shows that the energy-saving effect of EVs calculated using the variable transmission efficiency model is better than that of the constant efficiency model. The variable transmission efficiency model improves the energy consumption by 3.7% and 3.3%, under the two drive performance requirements. The optimization results fully demonstrate the importance of comprehensively considering the real-time efficiency distributions of individual power components during the design process of the EV powertrain. Finally, the optimization results further indicate that, for the multi-speed drivetrain of EVs, a powertrain using a high-power and high-torque motor matched with a smaller gear ratio can achieve higher energy efficiency and, thus, a longer driving range. Additionally, GRA was employed to quantify the correlation between energy efficiency and powertrain system cost, with a correlation coefficient of 0.77431.
In this study, optimization of crucial parameter matching for electric vehicle powertrains was achieved by constructing a comprehensive real-time efficiency model. However, the modeling process did not consider the effect of temperature fluctuations on the efficiency of electric vehicle powertrains. As a result, the operating results of electric vehicles in natural environments deviate to a certain extent from the results of this study. In a follow-up study, a comprehensive efficiency model of the electric vehicle powertrain will be developed to fully consider the effect of temperature fluctuations on the operating efficiency of each power component. Furthermore, this study emphasizes that the energy consumption reduction in the variable transmission efficiency model hinges on the motor’s power, speed, voltage in the research and the multi-speed transmission ratio. The combination of a higher motor output power and torque, along with lower transmission ratios, contributes to a lower energy consumption.
Author Contributions
Conceptualization, B.Z.; software, B.Z., Z.L. and H.W.; formal analysis, B.Z., H.W. and Z.L.; investigation, B.Z., Z.L., H.W., Y.C., J.H. and F.J.; resources, B.Z.; writing—original draft preparation, B.Z., Z.L. and H.W.; writing—review and editing, B.Z., Z.L., H.W., Y.C., J.H. and F.J.; supervision, B.Z.; funding acquisition, B.Z., H.W., Y.C. and J.H. All authors have read and agreed to the published version of the manuscript.
Funding
This work is supported by the Guangxi Vocational Education Teaching Reform Research Project in 2021, with project number GXZZJG2021B108; Guangxi Key Research and Development Program Project, with project numbers GuiKeAB24010298, GuiKeAB24010293, and GuiKeAB25069449; and Guangxi National Science and Technology Major Project, with project number GuiKeAA24206064.
Data Availability Statement
All data used to support the findings of this study are included within the article.
Conflicts of Interest
The authors declare that there are no conflicts of interest regarding the publication of this paper.
Nomenclature
| The expected average daily driving range of pure electric vehicles | |
| The variance | |
| X | The specific kilometers driven (km) |
| t0 | The starting charging time for pure electric vehicles (h) |
| The battery status value at the start of charging (kW·h) | |
| t | The charging time (h) |
| Ed | The 100 km power consumption of pure electric vehicles (kW·h) |
| Dn | The amount of EV to be charged (kW·h) |
| B | The battery capacity (kW·h) |
| Pc | The charging power for pure electric vehicles (kW/h) |
| K | The charging constant |
| The Grid Peak–Valley Difference Ratio | |
| The grid load factor | |
| The peak load during a defined time period (kW) | |
| The average load over a defined period of time (kW) | |
| A | The cross-sectional area of graphite material |
| aa | The anode electrochemical transfer reaction coefficient |
| ac | The cathode chemical transfer reaction coefficient |
| assa | The specific surface area of active particulate material |
| Ds | The solid-phase diffusion coefficient |
| Dl | The liquid-phase diffusion coefficient |
| FEV | The charging costs |
| fele | The optimal time-sharing tariff |
| i0,SEI | The SEI membrane side reaction exchange current density |
| jSEI(x,t) | The side-reaction current density |
| N | The number of pure electric vehicles |
| PEV(t,n) | The charging power curve |
| PEV.sum | The sum of charging power curves |
| Pvalley | The valley load |
| Pv-f | The height of valley filling load |
| R | The ideal gas constant |
| T | The temperature |
| tev,s | The starting time of charging for pure electric vehicles |
| tev,e | The end-of-charge time for pure electric vehicles |
References
- Kwon, K.; Lim, S.; Kim, D.; Park, K. Automation program for optimum design of electric vehicle powertrain systems based on artificial neural network. Etransportation 2023, 18, 100267. [Google Scholar] [CrossRef]
- Niri, A.J.; Poelzer, G.A.; Zhang, S.E.; Rosenkranz, J.; Pettersson, M.; Ghorbani, Y. Sustainability challenges throughout the electric vehicle battery value chain. Renew. Sustain. Energy Rev. 2024, 191, 114176. [Google Scholar] [CrossRef]
- Forsythe, C.R.; Gillingham, K.T.; Michalek, J.J.; Whitefoot, K.S. Technology advancement is driving electric vehicle adoption. Proc. Natl. Acad. Sci. USA 2023, 120, e2219396120. [Google Scholar] [CrossRef]
- Gobbi, M.; Sattar, A.; Palazzetti, R.; Mastinu, G. Traction motors for electric vehicles: Maximization of mechanical efficiency—A review. Appl. Energy 2024, 357, 122496. [Google Scholar] [CrossRef]
- Beaudoin, M.-A.; Boulet, B. Fundamental limitations to no-jerk gearshifts of multi-speed transmission architectures in electric vehicles. Mech. Mach. Theory 2021, 160, 104290. [Google Scholar] [CrossRef]
- Gao, B.; Meng, D.; Shi, W.; Cai, W.; Dong, S.; Zhang, Y.; Chen, H. Topology optimization and the evolution trends of two-speed transmission of EVs. Renew. Sustain. Energy Rev. 2022, 161, 112390. [Google Scholar] [CrossRef]
- Du, W.; Zhao, S.; Jin, L.; Gao, J.; Zheng, Z. Optimization design and performance comparison of different powertrains of electric vehicles. Mech. Mach. Theory 2021, 156, 104143. [Google Scholar] [CrossRef]
- Ruan, J.; Song, Q.; Yang, W. The application of hybrid energy storage system with electrified continuously variable transmission in battery electric vehicle. Energy 2019, 183, 315–330. [Google Scholar] [CrossRef]
- Tian, Y.; Zhang, N.; Zhou, S.; Walker, P.D. Model and gear shifting control of a novel two-speed transmission for battery electric vehicles. Mech. Mach. Theory 2020, 152, 103902. [Google Scholar] [CrossRef]
- Jeong, W.; Han, J.; Kim, T.; Lee, J.; Oh, S. Two-speed transmission structure and optimization design for electric vehicles. Machines 2023, 12, 9. [Google Scholar] [CrossRef]
- Zhu, Z.Q.; Chu, W.Q.; Guan, Y. Quantitative comparison of electromagnetic performance of electrical machines for HEVs/EVs. CES Trans. Electr. Mach. Syst. 2017, 1, 37–47. [Google Scholar] [CrossRef]
- Feng, S.; Qu, R. High Efficiency Hybrid Synchronous Motor Design with Loss Analysis for a Two-Speed e-Powertrain System in Electric Vehicle. In Proceedings of the 2023 IEEE International Electric Machines & Drives Conference (IEMDC), San Francisco, CA, USA, 15–18 May 2023; pp. 1–6. [Google Scholar]
- Popescu, M.; Goss, J.; Staton, D.A.; Hawkins, D.; Chong, Y.C.; Boglietti, A. Electrical Vehicles—Practical Solutions for Power Traction Motor Systems. IEEE Trans. Ind. Appl. 2018, 54, 2751–2762. [Google Scholar] [CrossRef]
- Ruan, J.; Walker, P.; Zhang, N. A comparative study energy consumption and costs of battery electric vehicle transmissions. Appl. Energy 2016, 165, 119–134. [Google Scholar] [CrossRef]
- Mo, S.; Chen, K.; Zhang, Y.; Zhang, W. Vertical dynamics analysis and multi-objective optimization of electric vehicle considering the integrated powertrain system. Appl. Math. Model. 2024, 131, 33–48. [Google Scholar] [CrossRef]
- Kwon, K.; Jo, J.; Min, S. Multi-objective gear ratio and shifting pattern optimization of multi-speed transmissions for electric vehicles considering variable transmission efficiency. Energy 2021, 236, 121419. [Google Scholar] [CrossRef]
- Krüger, B.; Keinprecht, G.; Filomeno, G.; Dennin, D.; Tenberge, P. Design and optimisation of single motor electric powertrains considering different transmission topologies. Mech. Mach. Theory 2022, 168, 104578. [Google Scholar] [CrossRef]
- Kwon, K.; Lee, J.-H.; Lim, S.-K. Optimization of multi-speed transmission for electric vehicles based on electrical and mechanical efficiency analysis. Appl. Energy 2023, 342, 121203. [Google Scholar] [CrossRef]
- Jiang, F.; Yuan, X.; Hu, L.; Xie, G.; Zhang, Z.; Li, X.; Hu, J.; Wang, C.; Wang, H. A comprehensive review of energy storage technology development and application for pure electric vehicles. J. Energy Storage 2024, 86, 111159. [Google Scholar] [CrossRef]
- Yang, Y.; He, Q.; Fu, C.; Liao, S.; Tan, P. Efficiency improvement of permanent magnet synchronous motor for electric vehicles. Energy 2020, 213, 118859. [Google Scholar] [CrossRef]
- Bajrami, A.; Palpacelli, M.C. A Proposal for a Simplified Systematic Procedure for the Selection of Electric Motors for Land Vehicles with an Emphasis on Fuel Economy. Machines 2023, 11, 420. [Google Scholar] [CrossRef]
- Vignesh, S.; Bhateshvar, Y.K.; Agrewale, M.R.B.; Vora, K.C. Comparative analysis of powertrain optimization for Small electric vehicle based on range and weight for Retro-fitment. Mater. Today Proc. 2022, 63, 579–586. [Google Scholar] [CrossRef]
- Kalt, S.; Erhard, J.; Lienkamp, M. Electric Machine Design Tool for Permanent Magnet Synchronous Machines and Induction Machines. Machines 2020, 8, 15. [Google Scholar] [CrossRef]
- Zhou, X.; Walker, P.; Zhang, N.; Zhu, B.; Ruan, J. Numerical and experimental investigation of drag torque in a two-speed dual clutch transmission. Mech. Mach. Theory 2014, 79, 46–63. [Google Scholar] [CrossRef]
- Mughal, H.; Dolatabadi, N.; Rahmani, R. An integrated tribodynamic model for investigation of efficiency, durability and NVH attributes of gear mesh in electric vehicle powertrains. Tribol. Int. 2023, 189, 108977. [Google Scholar] [CrossRef]
- König, A.; Nicoletti, L.; Kalt, S.; Müller, K.; Koch, A.; Lienkamp, M. An open-source modular quasi-static longitudinal simulation for full electric vehicles. In Proceedings of the 2020 Fifteenth International Conference on Ecological Vehicles and Renewable Energies (EVER), Monte-Carlo, Monaco, 10–12 September 2020; pp. 1–9. [Google Scholar]
- Koch, A.; Nicoletti, L.; Herrmann, T.; Lienkamp, M. Implementation and Analyses of an Eco-Driving Algorithm for Different Battery Electric Powertrain Topologies Based on a Split Loss Integration Approach. Energies 2022, 15, 5396. [Google Scholar] [CrossRef]
- Lu, M.; Domingues-Olavarría, G.; Márquez-Fernández, F.J.; Bydén, H.; Alaküla, M. Optimization of Induction Machine Design for Electric Vehicle Powertrain. In Proceedings of the 2023 IEEE International Electric Machines & Drives Conference (IEMDC), San Francisco, CA, USA, 15–18 May 2023; pp. 1–6. [Google Scholar]


Disclaimer/Publisher’s Note: The statements, opinions and data contained in all publications are solely those of the individual author(s) and contributor(s) and not of MDPI and/or the editor(s). MDPI and/or the editor(s) disclaim responsibility for any injury to people or property resulting from any ideas, methods, instructions or products referred to in the content. |
© 2025 by the authors. Licensee MDPI, Basel, Switzerland. This article is an open access article distributed under the terms and conditions of the Creative Commons Attribution (CC BY) license (https://creativecommons.org/licenses/by/4.0/).