Abstract
In the tire manufacturing process, rubber compounds are vulcanized in volcanic presses. The vulcanization technology is carried out at temperatures above 150 °C, i.e., at a temperature potential that causes heat losses if the containers are not sufficiently insulated. The paper describes the mathematical model developed to detect the heat fluxes from the container walls to the surroundings. The calculation is carried out strictly in the SI system. With the help of the developed model, the back-relations of heat losses through the vertical and horizontal walls of the container enclosure were obtained as a function of the thickness of the insulation without and with a radiation shield on the inside of the enclosure. Numerical modeling using the finite volume method was used to verify the results obtained. In the numerical simulation, a 2D and a 3D model were created, and the same input conditions as in the mathematical model were simulated. Using the obtained results, an energy-energy balance of the tire vulcanization technology was performed by comparing the heat loss fraction as a function of the external temperature of the container cover and as a function of the insulation thickness.
1. Introduction
European Commission stated that energy efficiency is a key area of action, without which the full decarbonization of the Union’s economy cannot be achieved. The goal is to reduce EU final energy consumption by 11.7% by 2030 [1].
In 2019, the global tire production was estimated to be 2.2 billion tons. These tires were mostly used in passenger vehicles but can also be found in trucks, buses, and heavy machinery, among others [2].
The tire manufacturing process can be divided into several steps, such as production, processing of raw materials and timing components, curing or vulcanization of the tire, and final inspection of the tire. Energy is required for all steps of the production cycle and represents one of the largest costs [3], not only because of direct energy expenditure but also because of the carbon footprint [4,5].
In the whole tire manufacturing process, the curing cycle has the highest energy losses [6,7]. This is mainly due to the extensive use of steam as a heat and pressure source in the curing process [8].
In the tire manufacturing process, rubber compounds are vulcanized in volcanic presses. The vulcanization process, which involves high temperatures and pressures, is energy-intensive. The vulcanization technology is carried out at temperatures above 150 °C, i.e., at a temperature potential that causes heat losses if the containers are insufficiently insulated. These increase the energy intensity of tire production and put a strain on the working environment in which the vulcanizing press operators are located. The use of advanced hydraulic presses with insulated systems and improved hydraulic power units can significantly reduce energy consumption. An example is the use of “floating column” technology, which simplifies maintenance and reduces energy requirements for mold set-up [9,10].
Improvements in insulation materials and the use of advanced rubber compounds with lower energy requirements for vulcanization can contribute to further savings. Advanced materials can also improve tire performance, promoting tire efficiency and quality [10,11].
Automation and reduction of dead time are possible ways to make vulcanization cycles more efficient, as automatic loading or unloading and faster mold changes can reduce non-productive time and, thus, the overall energy burden. These steps also lead to fewer machines required for the same production capacity [10,12].
There are many reasons why energy is lost in the vulcanization process: the presence of poorly insulated piping and complex equipment, excessive discharge capacity, poor insulation of valves, pressure-reducing valves and curing vessel covers, steam leakage, etc. Improving the energy efficiency of the curing process would represent a significant improvement for the entire rubber industry. Energy efficiency could be improved through several corrective measures and actions, e.g., reducing the outgoing heat, preheating, curing molds, reducing the time to change dies and parts in the press, and changing the heating system to more efficient techniques [13].
2. Heat Transfer
In the process of vulcanization of the tire material, the tire is heated to the vulcanization temperature, after which the temperature is maintained at a constant temperature for the necessary time. During the heating of the material and holding it at the vulcanization temperature, heat is transferred from the container through its thermally insulated cover to the surroundings of the press. When considering the transport of heat from the container, we consider the container a body with a constant wall temperature due to its weight and, therefore, the heat-full capacity in the tire pressing process. The heat transfer from the outer wall of the container is a heat transfer consisting of a radiative heat component, natural convection in the gap between the container wall and the thermal insulation layer with or without a reflective layer (Alu-film), heat conduction through the insulation and the steel plate and natural convection to the surrounding environment.
2.1. Analytical Heat Loss Solution
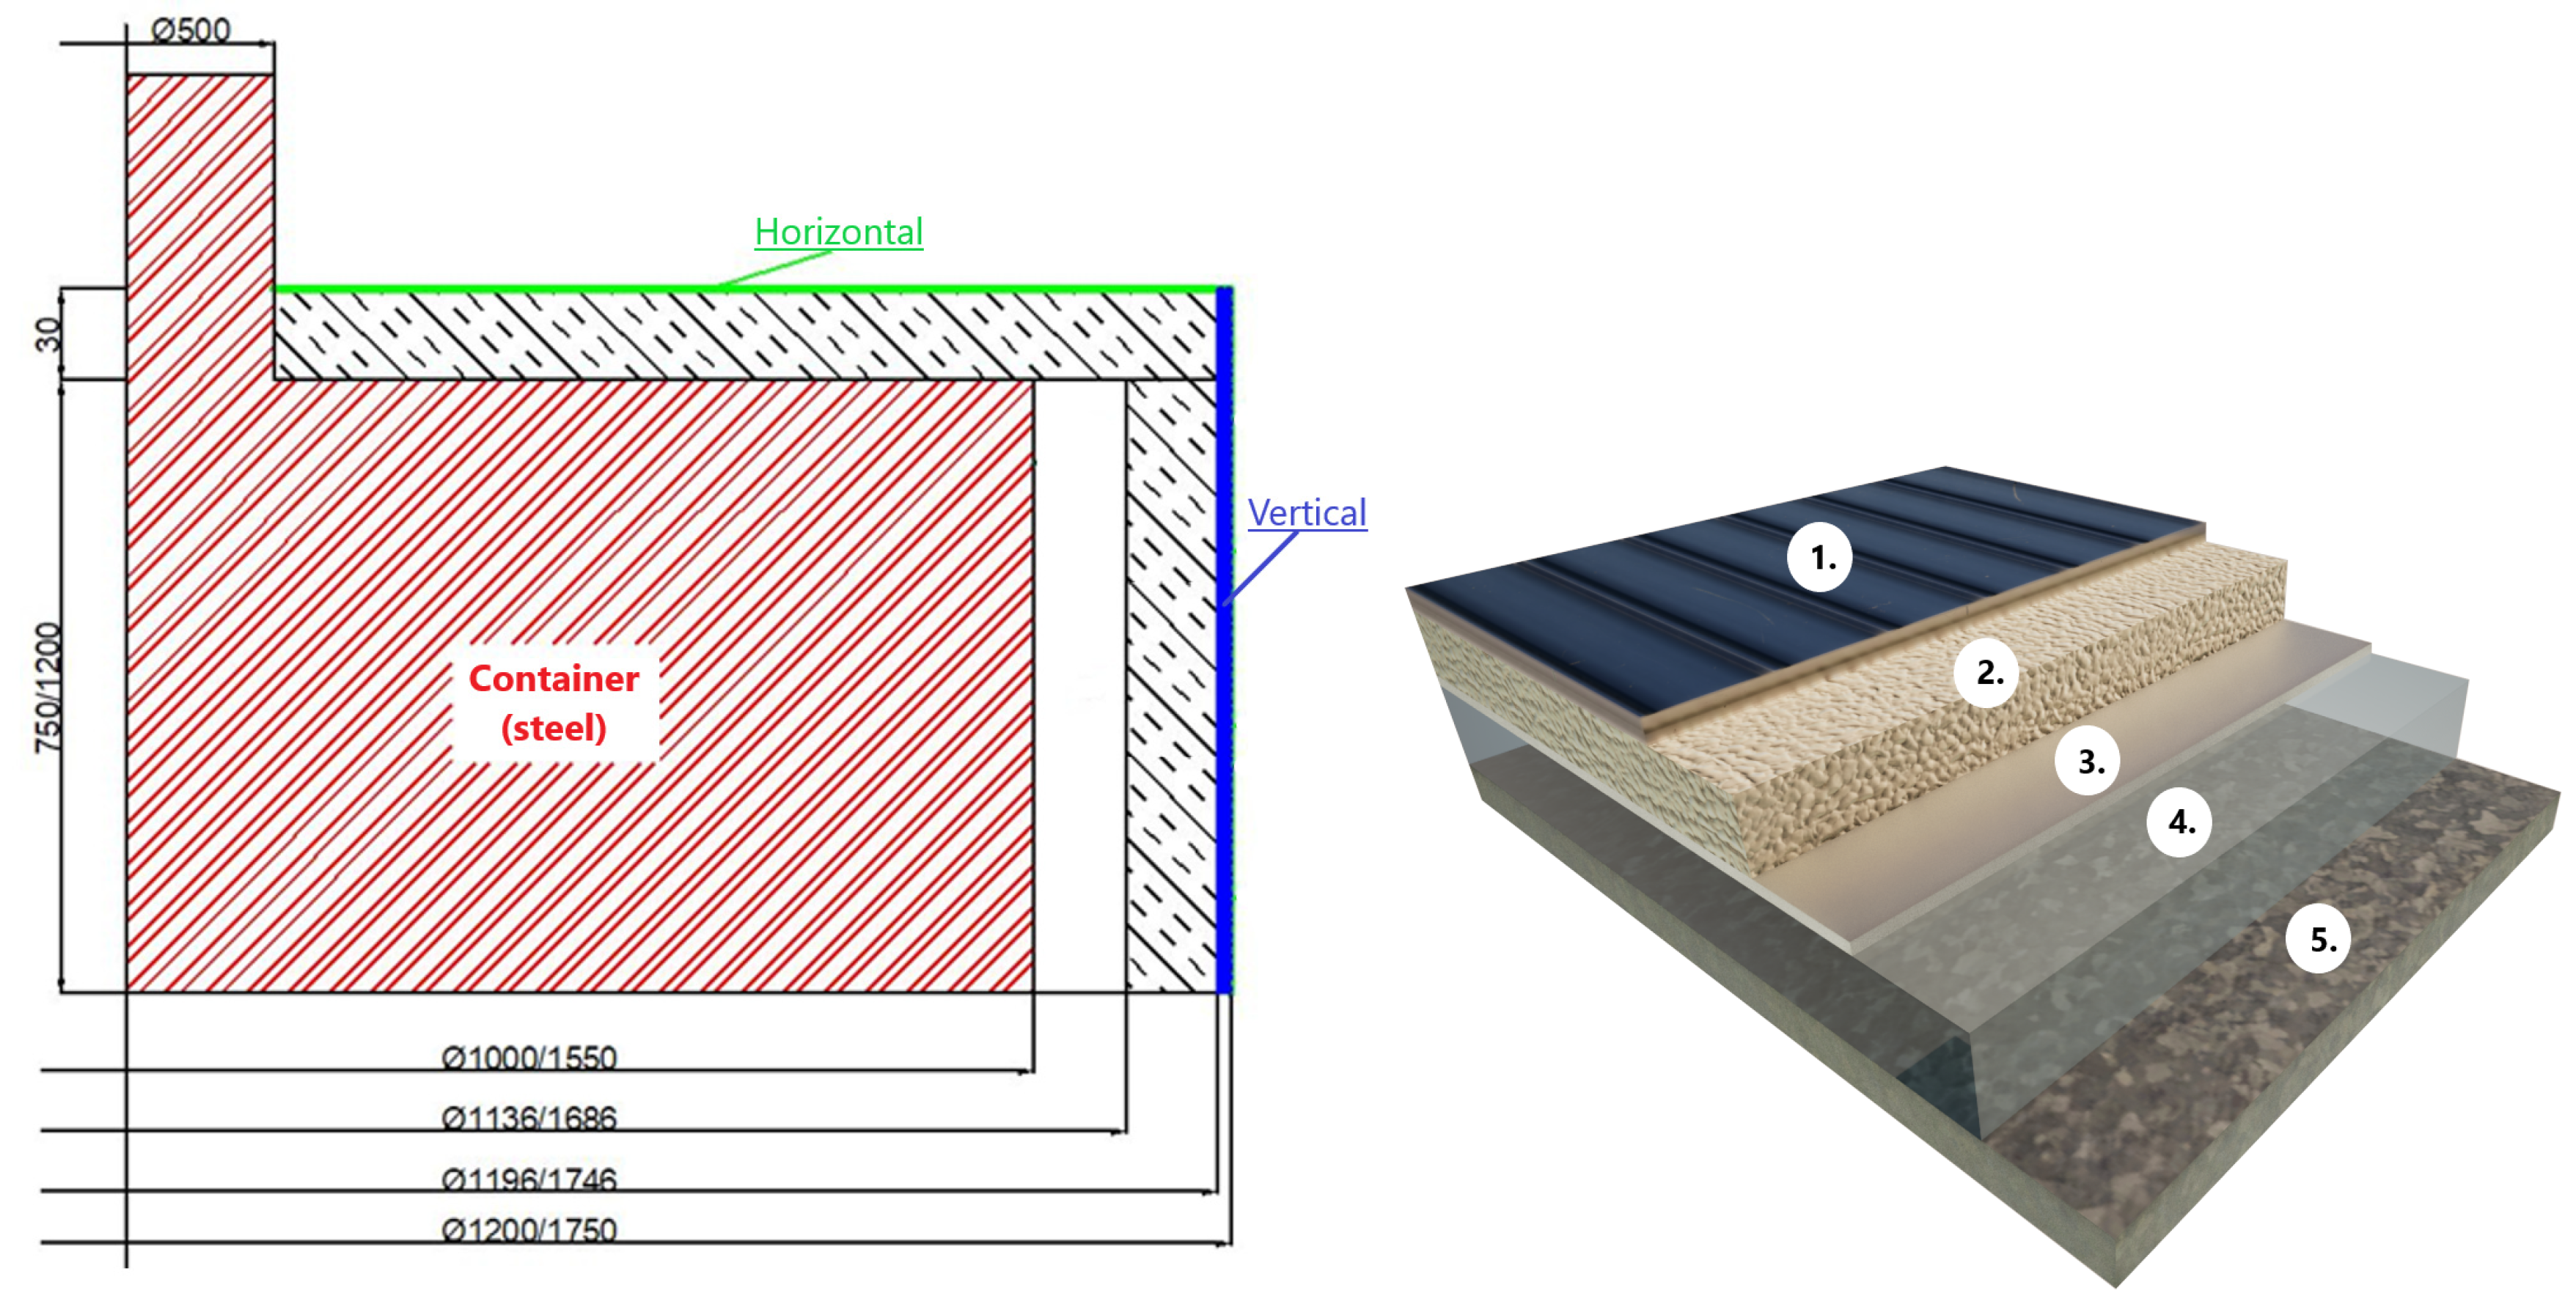
For the analytical solution of the heat flows from the container wall to the surroundings of the press, we use a simplified geometric model of the container cover made of horizontal and vertical surfaces and layers of Spaceloft insulation, according to Figure 1.
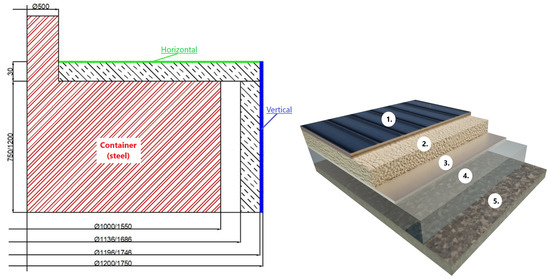
Figure 1.
Two-dimensional simplified sketch of the container of the tire vulcanization press cover and material composition. Material composition of the container wall: (1) Sheet metal cover, steel; (2) Insulation, spaceloft; (3) Aluminum foil; (4) Air gap; (5) Container, steel.
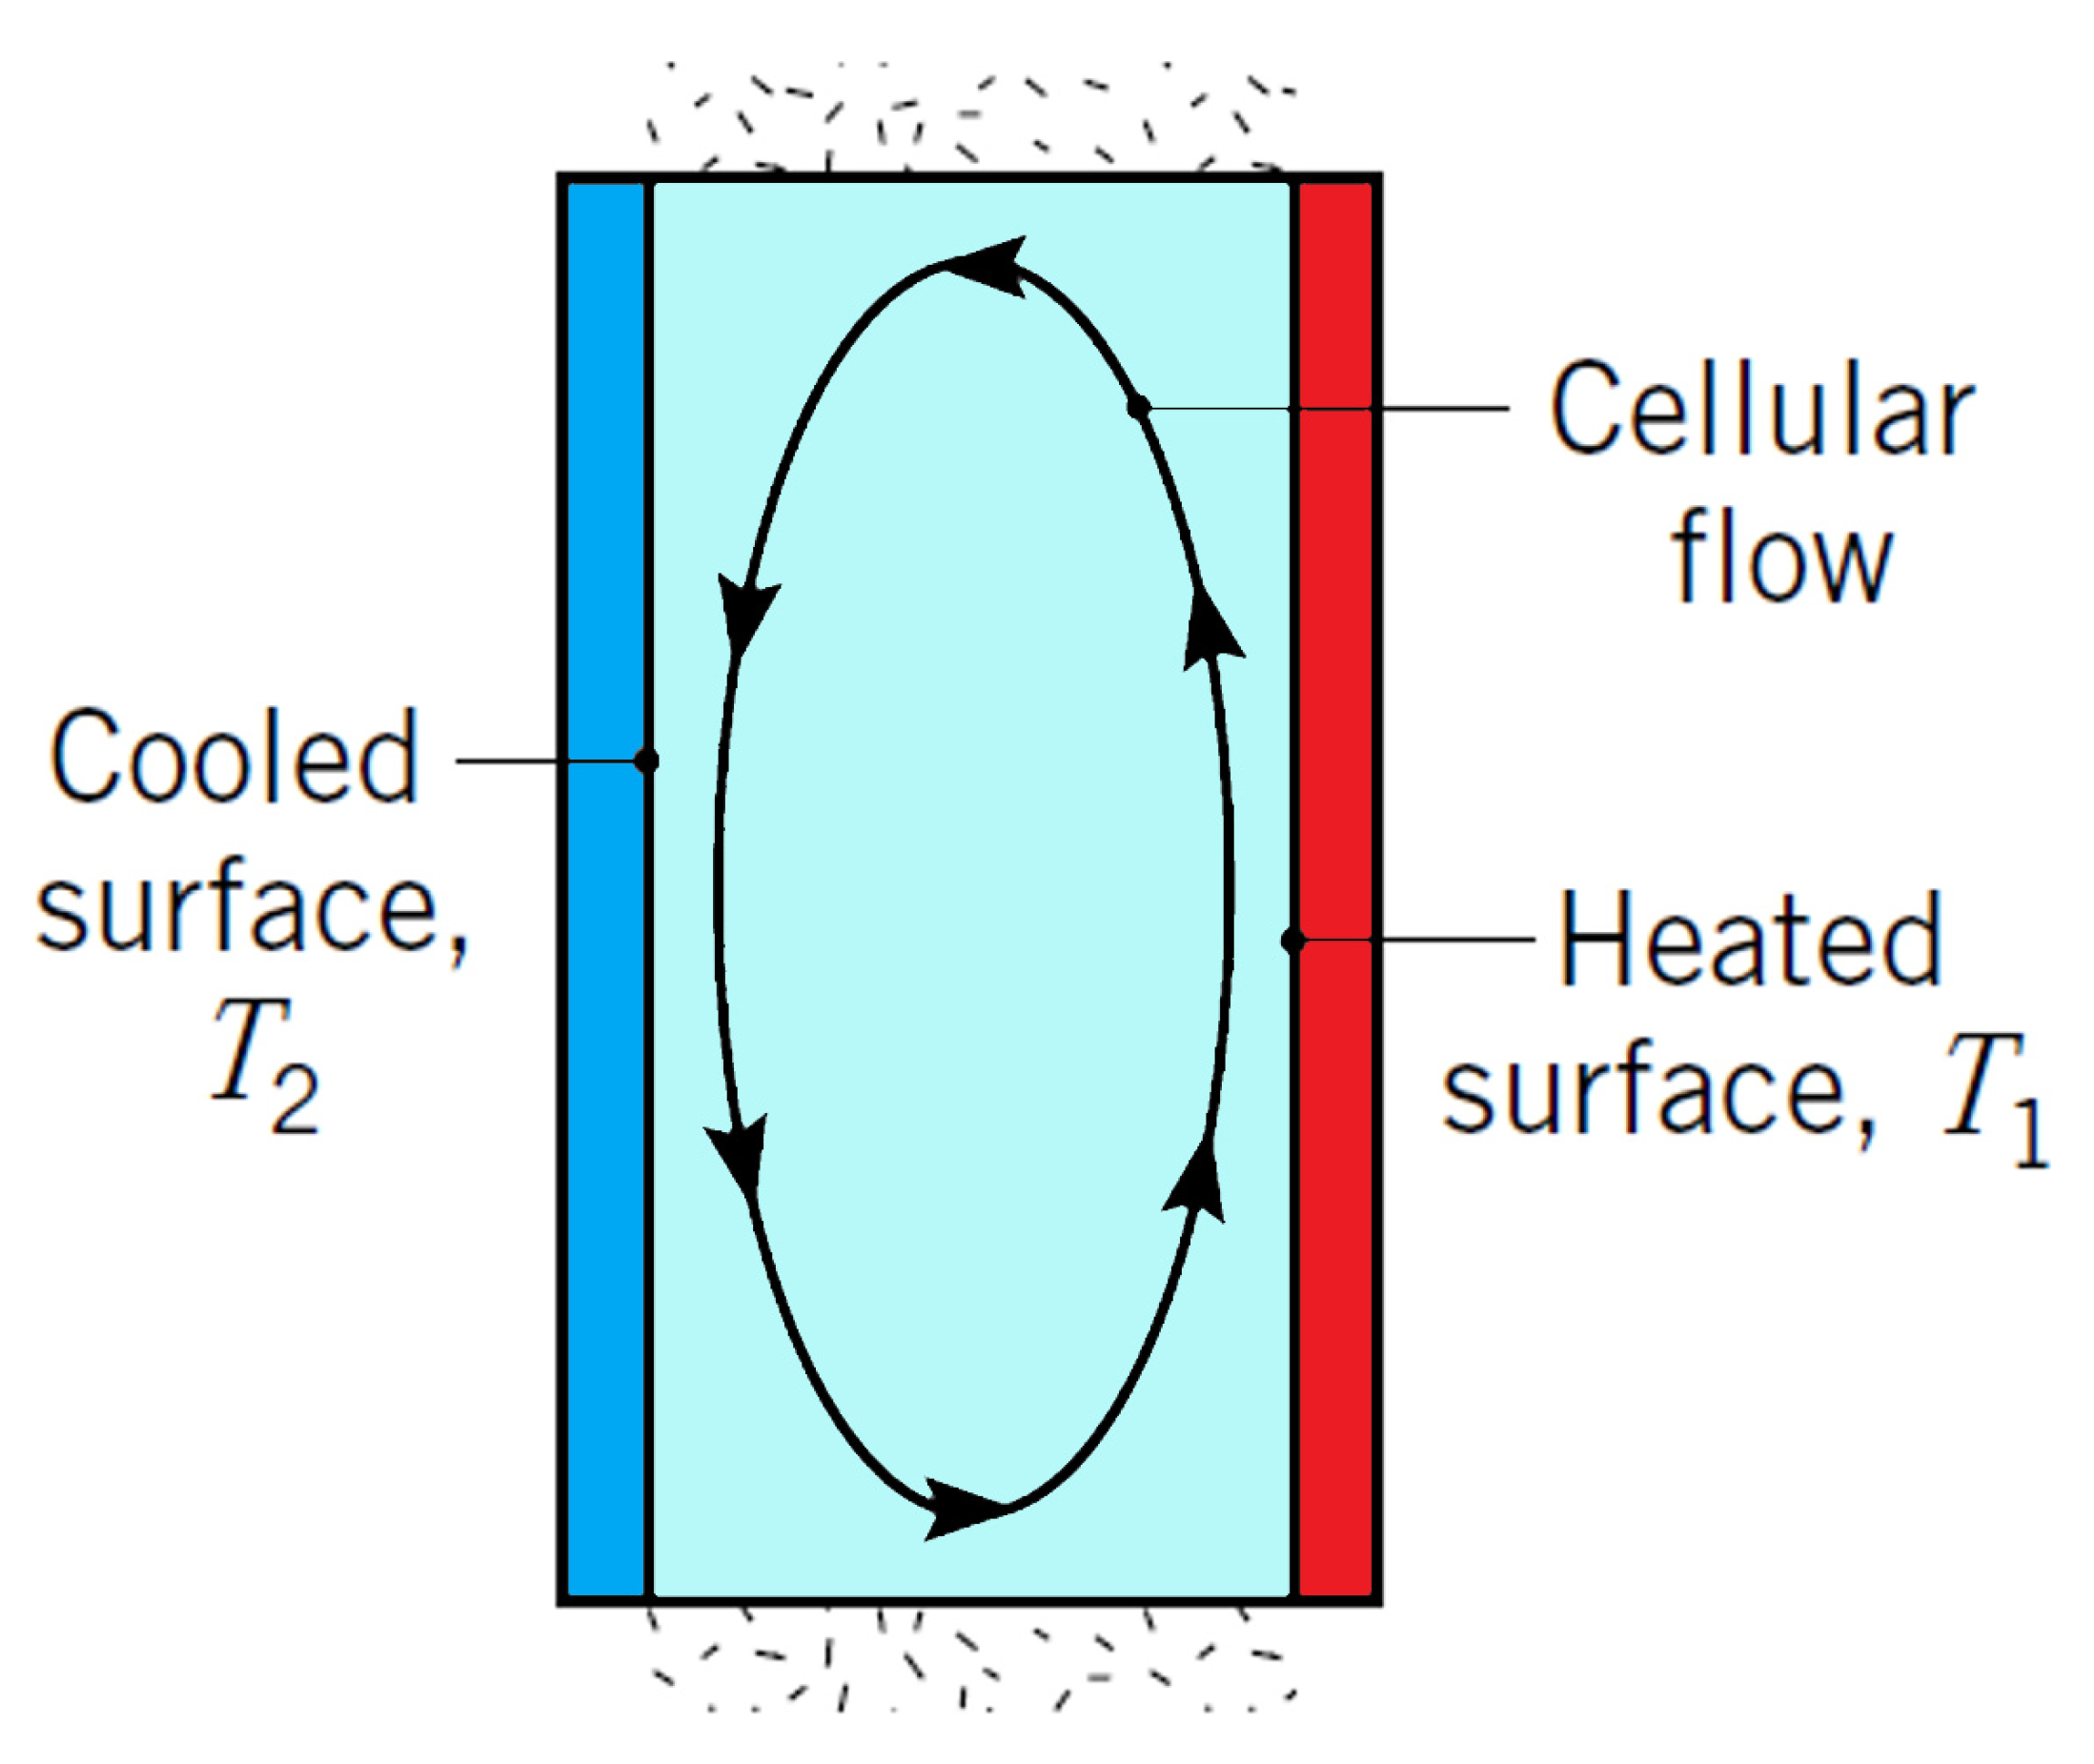
The heat transfer through the air cavity (closed volume) is solved on the basis of the Criteria equations from [14,15]. For heat transfer by natural convection in a vertical cavity, according to Figure 2.

Figure 2.
Natural convection in a vertical cavity.
For small Rayleigh numbers, RaL < 103, buoyancy-driven flow is weak, and heat rejection is primarily by conduction through the fluid. Thus, from Fourier’s law, the Nusselt number is NuL = 1. As the Rayleigh number increases, the flow in the cavity intensifies, and the heat transfer is determined by the boundary layer on the side walls. The flow in the core becomes almost stagnant. For aspect ratios (wall height/gap width) in the range 1 <= (H/L) <= 10, the following correlations have been proposed [14]:
where RaL is the Rayleigh number:
where
- g (m·s−2) is the gravitational constant,
- β (1/K) is the coefficient of volumetric expansion of air,
- T1 (K), T2 (K) are the wall temperatures,
- L (m) is the width of the gap,
- ν (m2·s−1) is the coefficient of kinematic viscosity,
- α or a (m2·s−1) is the coefficient of thermal conductivity.
Mean heat transfer coefficient:
where
- k (W/m·K) is the coefficient of thermal conductivity of air,
- (-) is the mean value of the Nusselt number from the Equation (2),
- L (m) is the width of the gap.
In solving the heat fluxes, we will use approximation equations for air properties in the range 200 K to 2000 K in Table 1.

Table 1.
Approximation equations for air properties.
Coefficient of volumetric expansion of air:
2.2. Mathematical Model and Heat Flow Solution Procedure in MATLAB 2023b
The calculation is performed in MATLAB 2023b (Natick, MA, USA) and strictly in the SI system. The geometric parameters of the container are shown in Table 2. The iterative calculation starts from an initial iteration temperature of 421.65 K and the iterative calculation ends at a correction temperature of 0.00 K. There is one more iteration in this iteration loop to calculate the heat transfer coefficient on the outer sheet metal wall 4.46 W/m2·K. After satisfying the condition of equal heat flux density through the cavity, insulation and outer boundary layer of 58.821 W, the heat fluxes through the vertical 166.3 W and horizontal wall of 68.2 W and the total heat flux of 234.5 W are calculated. Thus, using classical theory, the heat loss rates through the vertical and horizontal walls of the enclosure were obtained as a function of the thickness of the Spaceloft insulation without a radiant wall on the inside and with an Alu-film radiant shield on the inside.
Table 2.
Geometric parameters of the container.
Heat Flow Solution Procedure
Determination of the radiation flux to the sides:
Calculation of dimensions and areas
Transfer of units
The radiation component of an insulated container:
Initial iteration temperature Tsi(K) = corrected temperature Tsi(K)
Radiative heat flux density
Free convection in the air gap:
Determination of the mean temperature
Determination of calculation constants
Necessity check for Nusselt according to (Equation (4))
Determination of the heat transfer coefficient
Density of heat flux by convection through the cavity
Total heat flux through the cavity
Conduction through insulation and sheet metal:
The initial design value of the heat transfer coefficient on the external wall
Determination of thermal resistance of insulation and sheet metal
Heat flux density by conduction in the insulation and in the sheet
Determination of calculation constants
Heat transfer coefficient of the external sheet metal wall
Difference of heat flux densities in the cavity and in the insulation
Determination of the correction temperature
Corrected temperature
Heat flux through the vertical wall
Conduction through a horizontal wall:
Determination of horizontal wall area
Heat flux through the horizontal wall
Total heat flux from the container:
2.3. Calculations of Container Heat Loss Dependencies by Analytical Method at Different Parameters
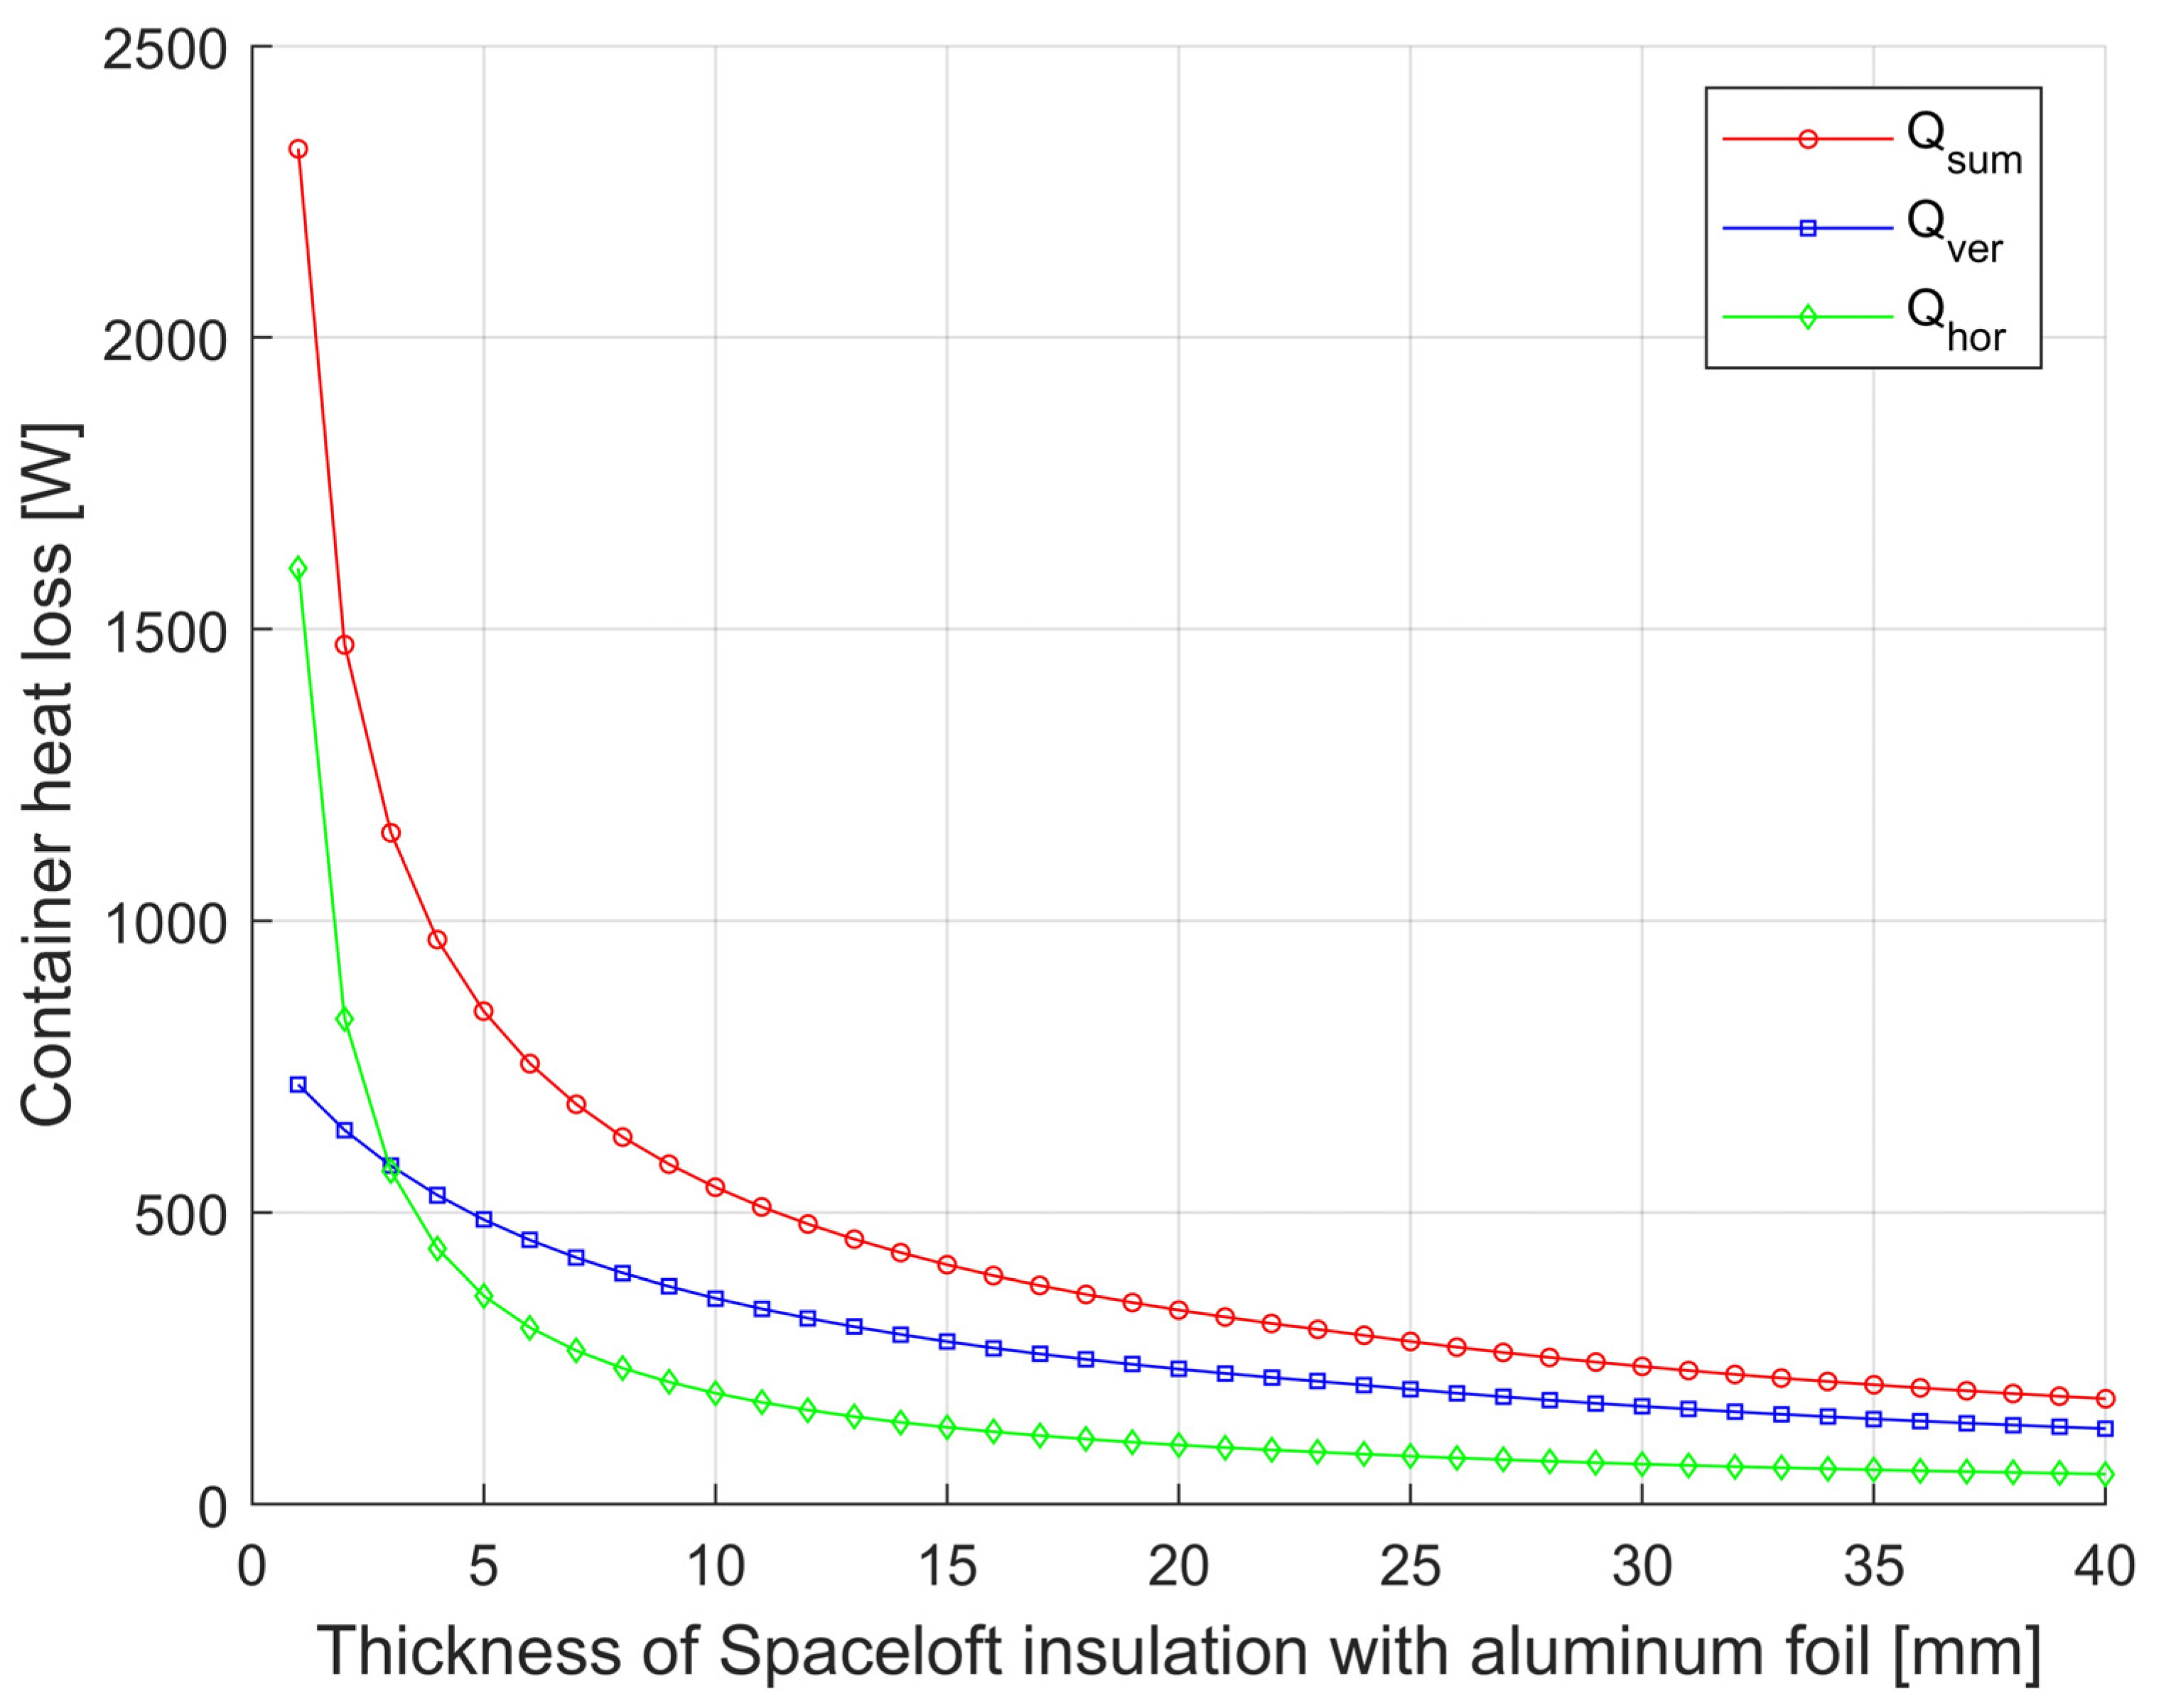
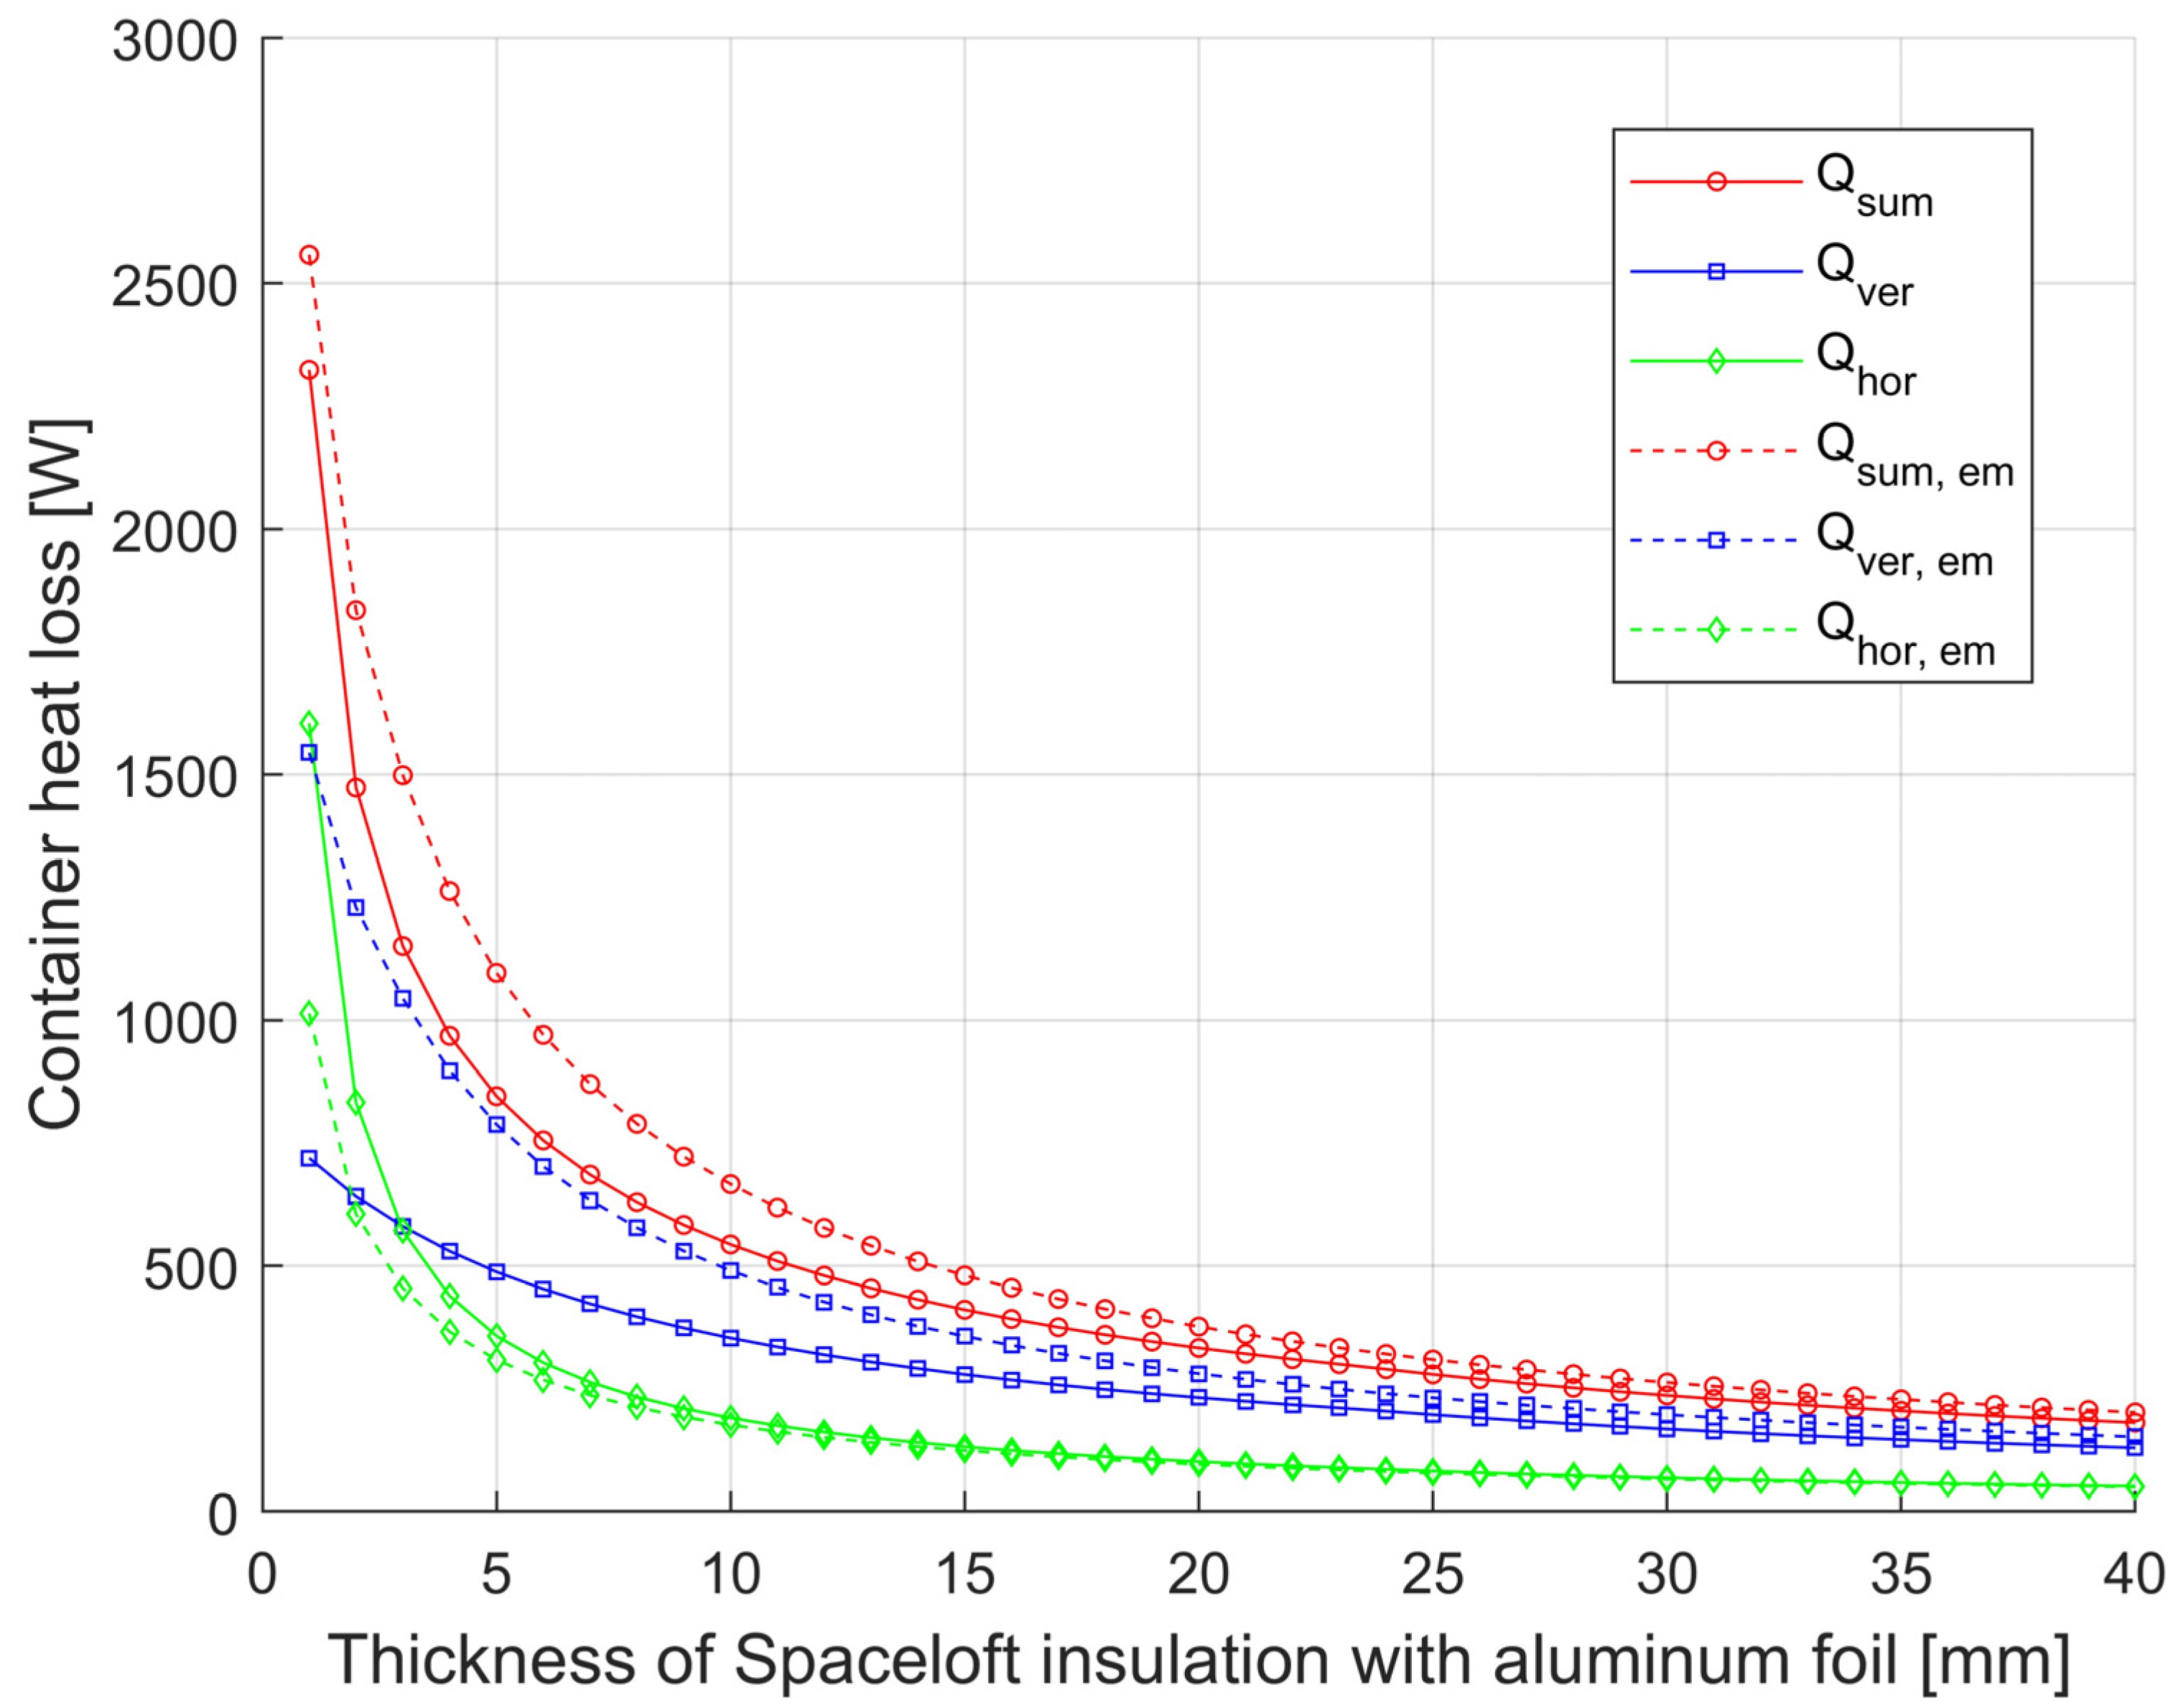
Model calculations of the influence of thermal insulation properties on heat loss were carried out on the example of a steel container with wall temperature tw = 175 °C, of 1000 mm diameter, covered by a cylinder of steel plate of 1200 mm internal diameter. The external environment is air at a temperature of 25 °C. The gap between the sheet steel cylinder and the vertical wall of the container is filled with Spaceloft insulation (k = 0.016 W·m−1·K−1), which is covered by Alu-film of emissivity εiz = 0.06 on the container wall side. In the calculations, the bottom part of the container and part of the upper horizontal area of the diameter are considered as adiabatic (without heat dissipation). Dw adiab horizontal (m) = 0.5. The resulting dependence of the container heat losses for the selected geometries can be seen in Figure 3 and Figure 4. A comparison of the effect of the emissivity of the insulation surface on the container side on the magnitude of the heat loss of the container and the effect on the total heat loss with and without Spaceloft the comparison is shown in Figure 5 and Figure 6.
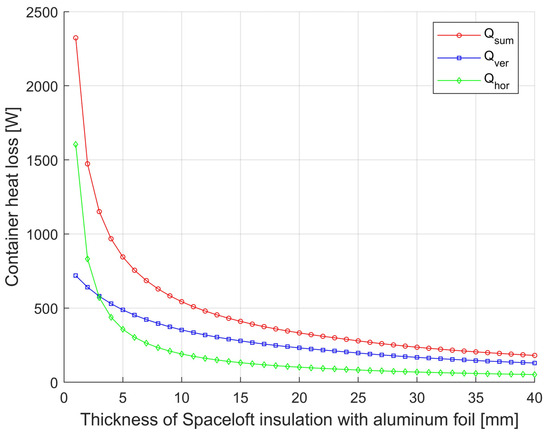
Figure 3.
Dependence of container heat loss from horizontal and vertical surfaces and total heat loss of Spaceloft insulated with Alu-film on insulation thickness.
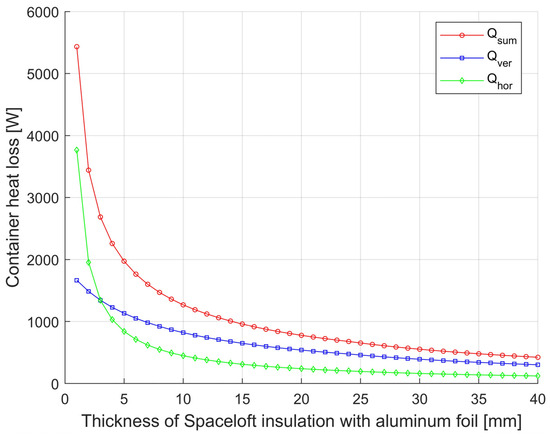
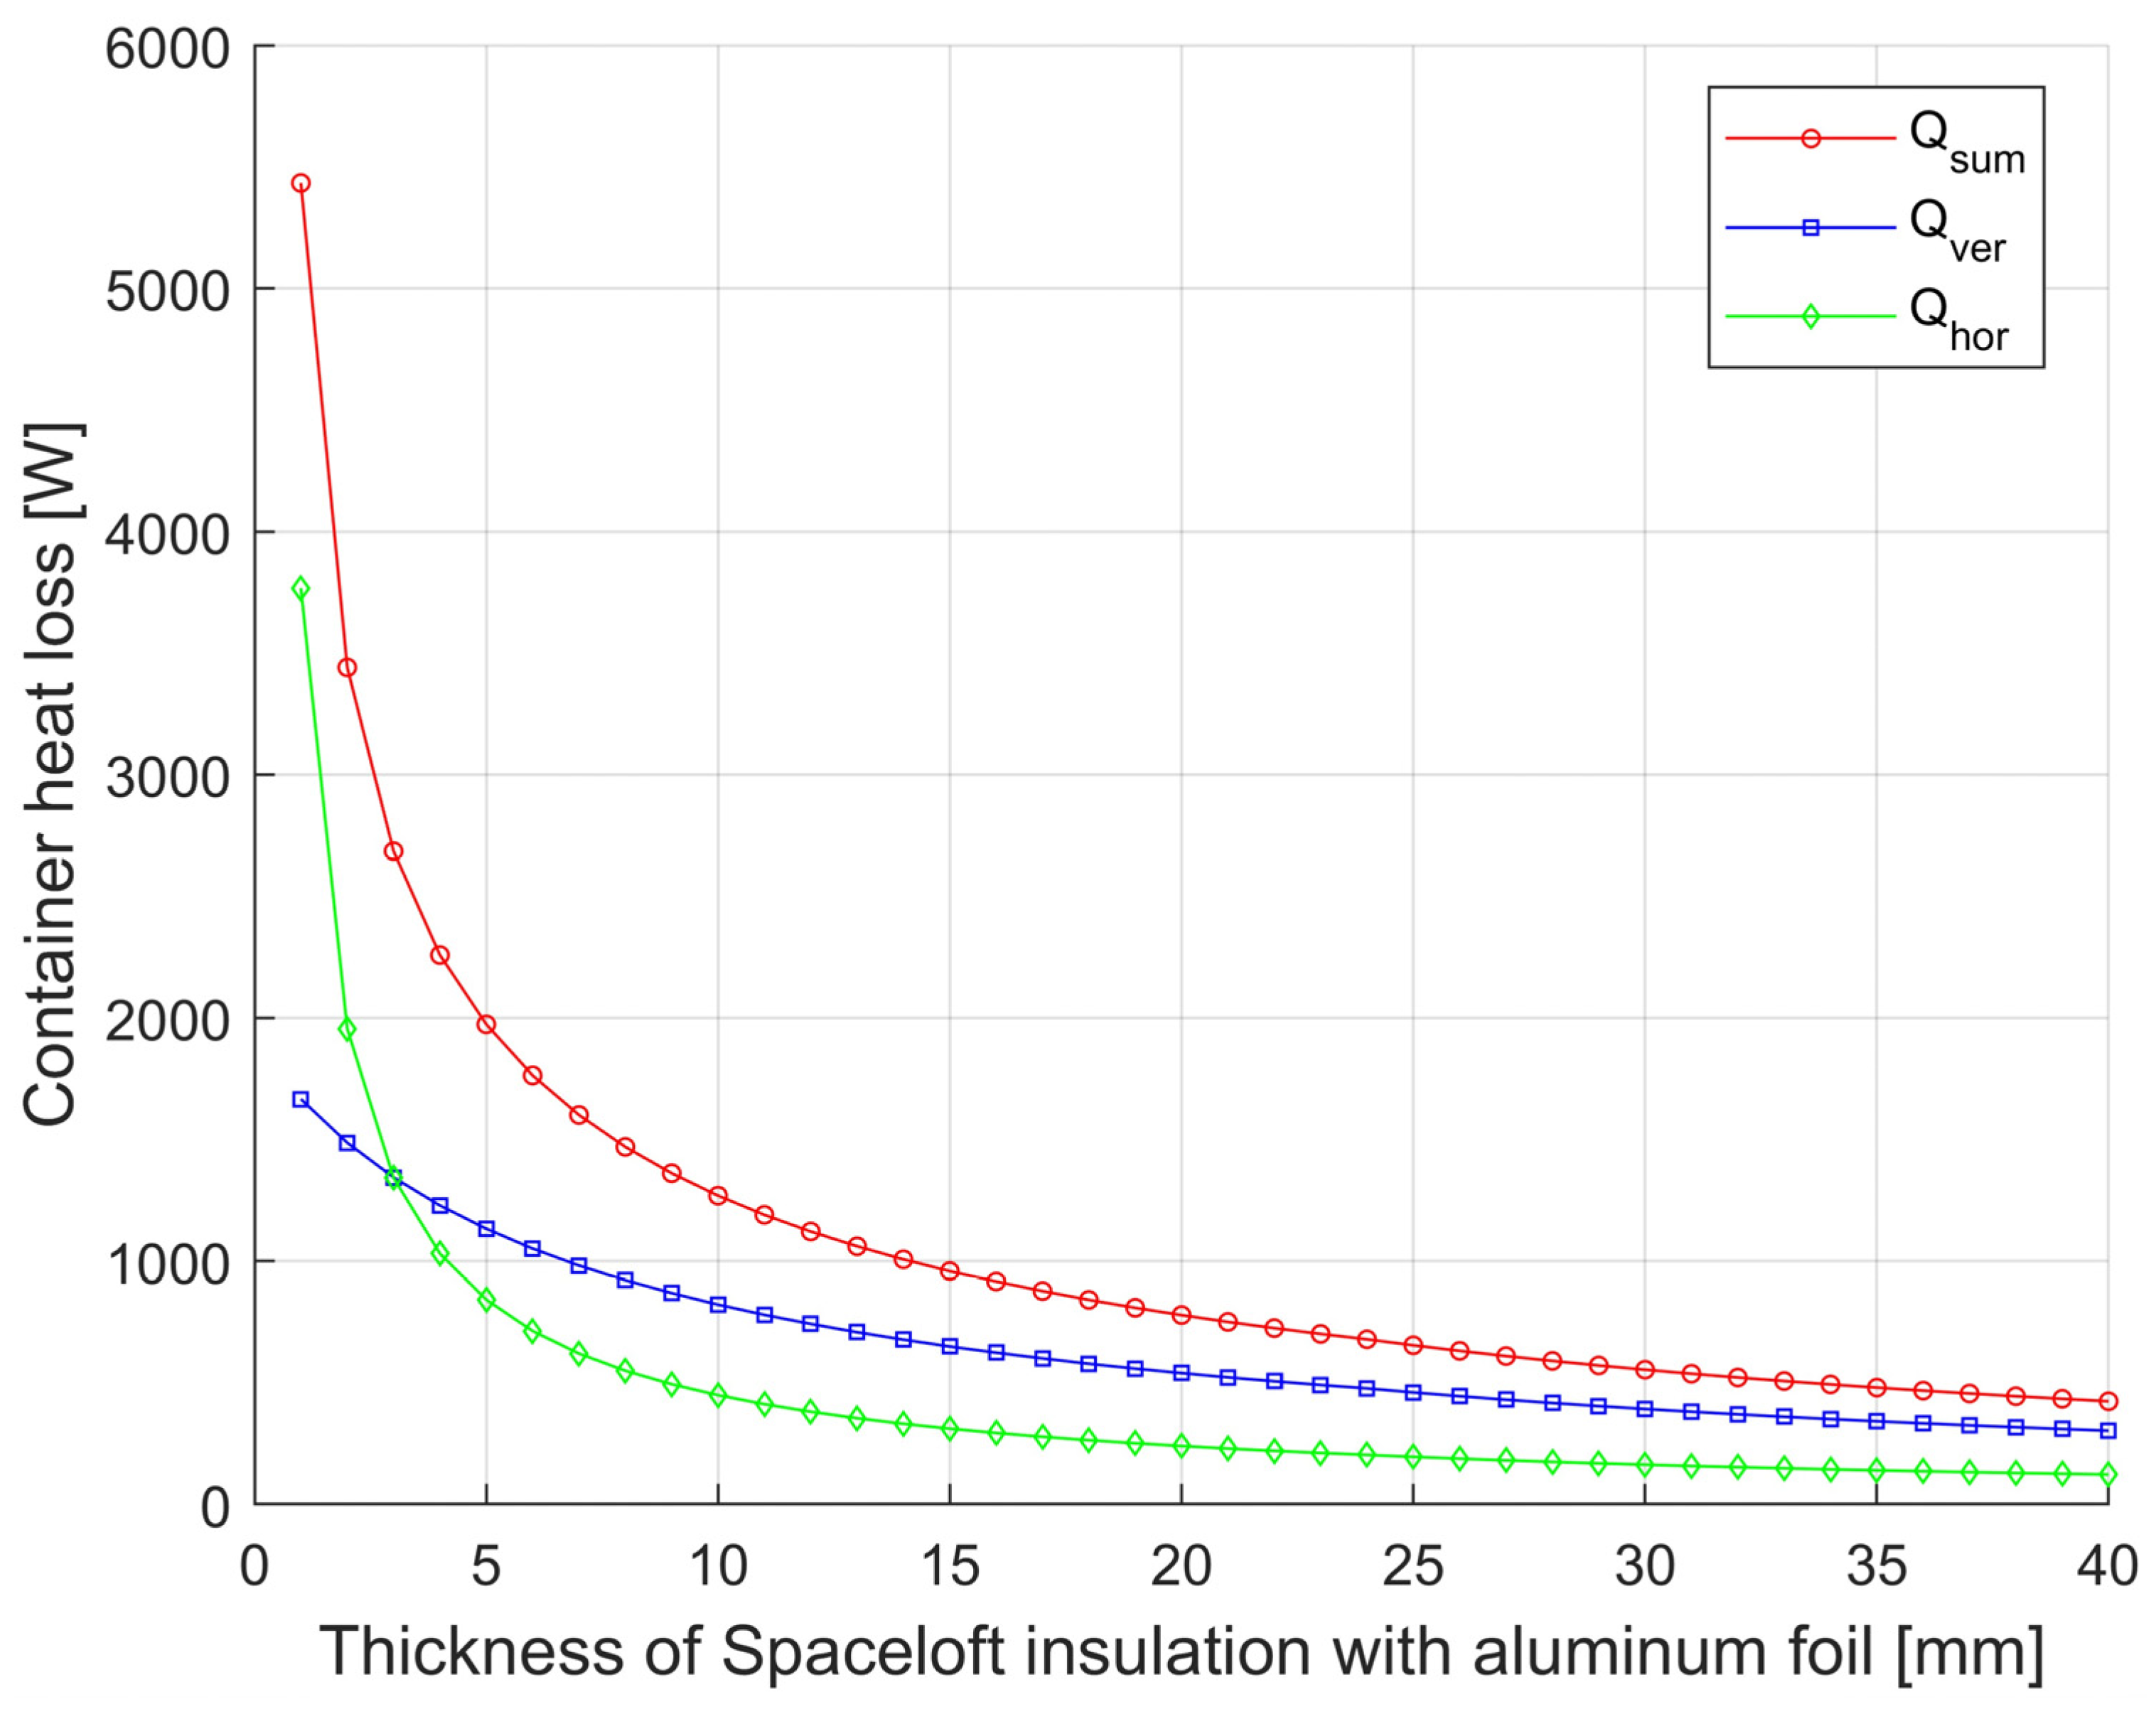
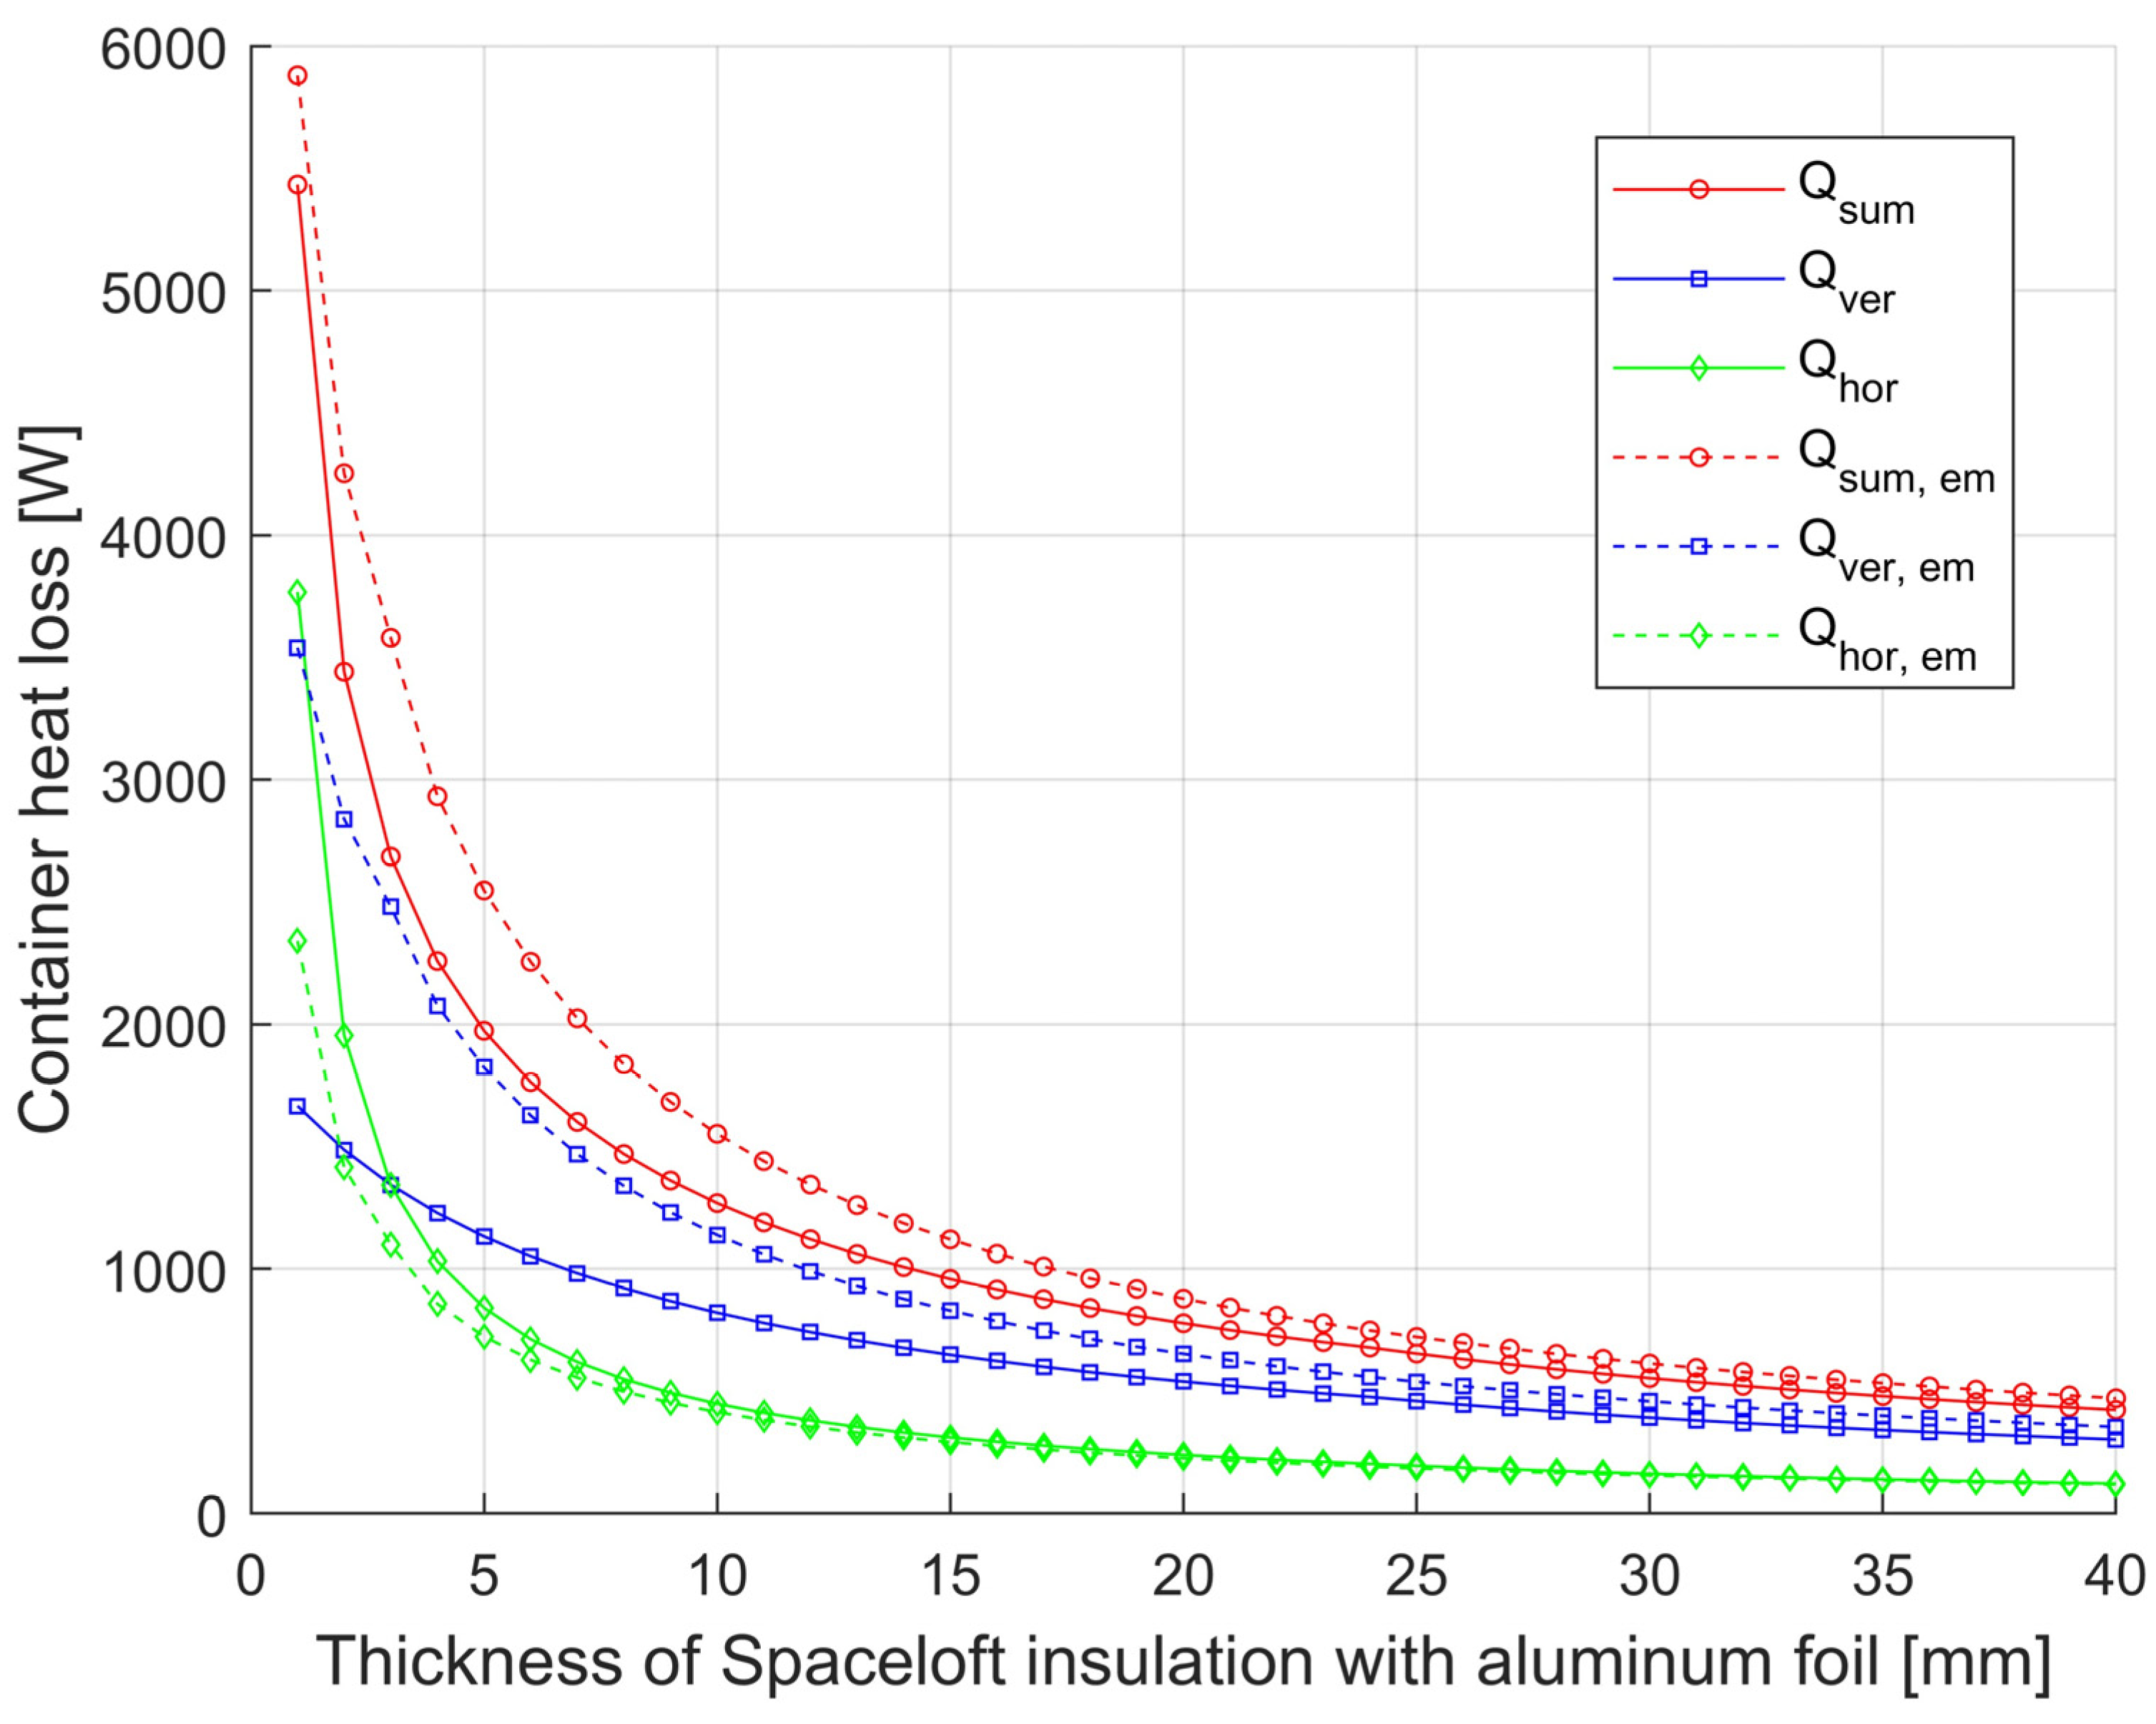
Figure 4.
Dependence of heat loss of container D = 1750 from horizontal, vertical surface, and total heat loss of Spaceloft insulated with Alu-film on insulation thickness.
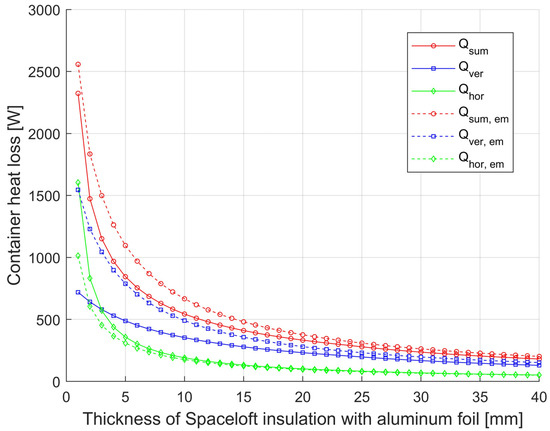
Figure 5.
Comparison of the effect of the emissivity of the insulation surface on the container side on the magnitude of the heat loss of the container D = 1200 from the vertical surface and the effect on the total heat loss with and without Spaceloft insulation with Alu-film.
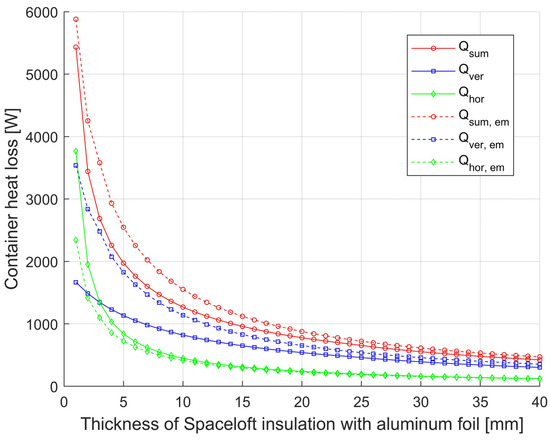
Figure 6.
Comparison of the effect of the emissivity of the insulation surface on the container side on the magnitude of the heat loss of the container D = 1750 from the vertical surface and the effect on the total heat loss with and without Spaceloft insulation with Alu-film.
Dependence of heat loss of container D = 1200 m insulated with Spaceloft with Alu-film on insulation thickness.
Dependence of heat loss of container D = 1750 mm insulated with Spaceloft insulation with Alu-film on insulation thickness.
Calculations of heat losses of container D = 1750 mm insulated with Spaceloft insulation with Alu-film with εiz = 0.05 and without foil with εiz = 0.9 on the insulation thickness and comparison of the influence of the emissivity of the foil on the insulation.
3. Calculation of Heat Losses from the Container of the Vulcanizing Press to the Surroundings Based on the CFD-Method
The calculations were carried out using the CFD finite volume method [16,17,18] in the Ansys-Fluent code based on the specified geometric and temperature parameters (container wall temperature 175 °C, ambient temperature 25 °C). The computational model was numerically solved in ANSYS Fluent 2023 R2 (Canonsburg, PA, USA) software. The model of Figure 1. was discretized using a grid with approximately 5.3 million cells, which formed a conformal mesh. The mesh was then converted to a polyhedral mesh, which improved the quality of the mesh and reduced the number of computational cells. The prismatic cells were left on the walls to form the boundary layer (Figure 15). To start natural convection properly, it is necessary to adjust the material properties of the air, especially the density, where we have chosen the Boussinesq approximation (which is used to solve buoyancy-driven flows and assumes a linear change in density that is dependent on temperature). No-slip boundary conditions were imposed on the fixed domain walls, and the temperatures for the specific walls were set as described in Section 3.1; for all wall surfaces, the radiation was assumed with an emissivity setting of 0.9. The standard Discrete Ordinates model was chosen for the radiation solution. The inlet was modeled as natural convection with atmospheric pressure and gravitational acceleration. A second-order upwind scheme was adopted to discretize the divergence variables, except for the gas volume fraction, for which the Coupled scheme was used; the diffusion terms were discretized using a central difference scheme, and the gradients were discretized using a cell-based least-squares scheme. A pressure-based solver was used, pressure interpolation was achieved using the Second-order scheme, and a pseudo-transient approach was adopted. Convergence was evaluated when the scaled residuals reached a constant value, which was of the order of 10−6 in each case. In addition, velocity profiles were monitored at several points in the domain. It was verified that the total energy flux entering the system was equal to the energy at the output to rule out energy imbalance. Hybrid initialization was used to start the simulation. The simulation was run as a time-independent task when there was no need to track changes in time.
3.1. Heat Transfer from the Container of a Cylindrical Vulcanising Press to the Surroundings Based on the External Surface Temperature
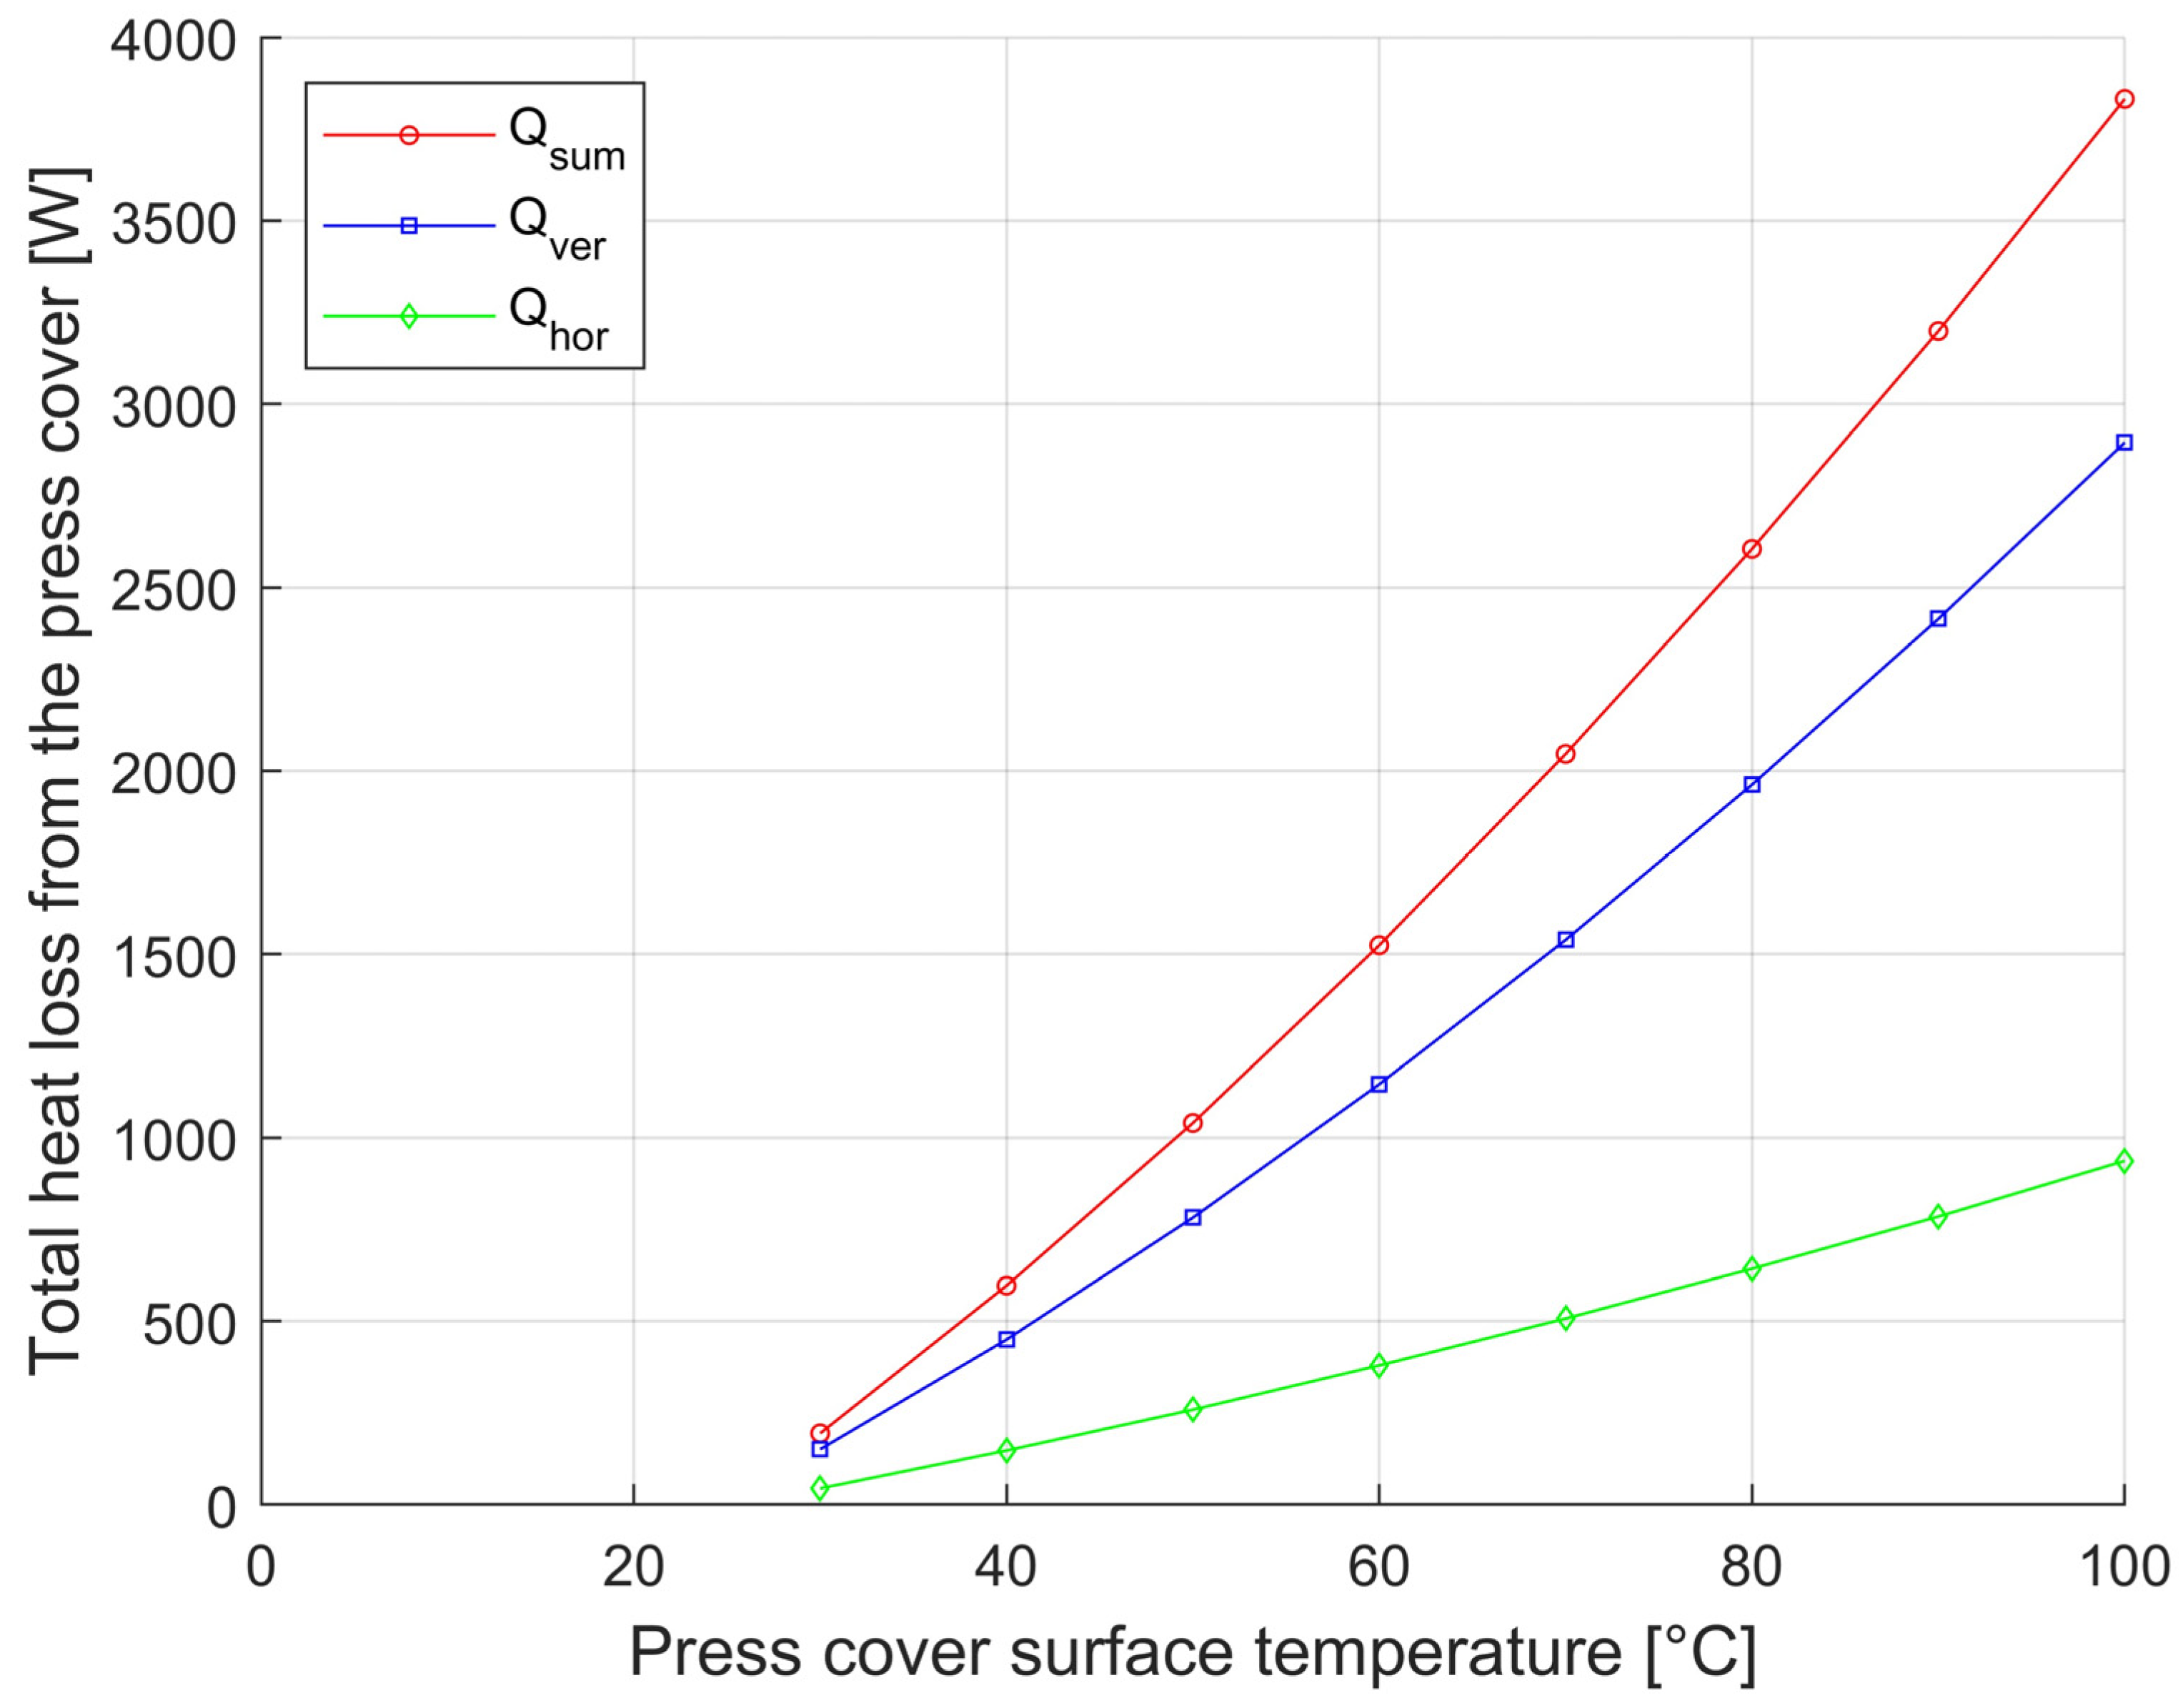
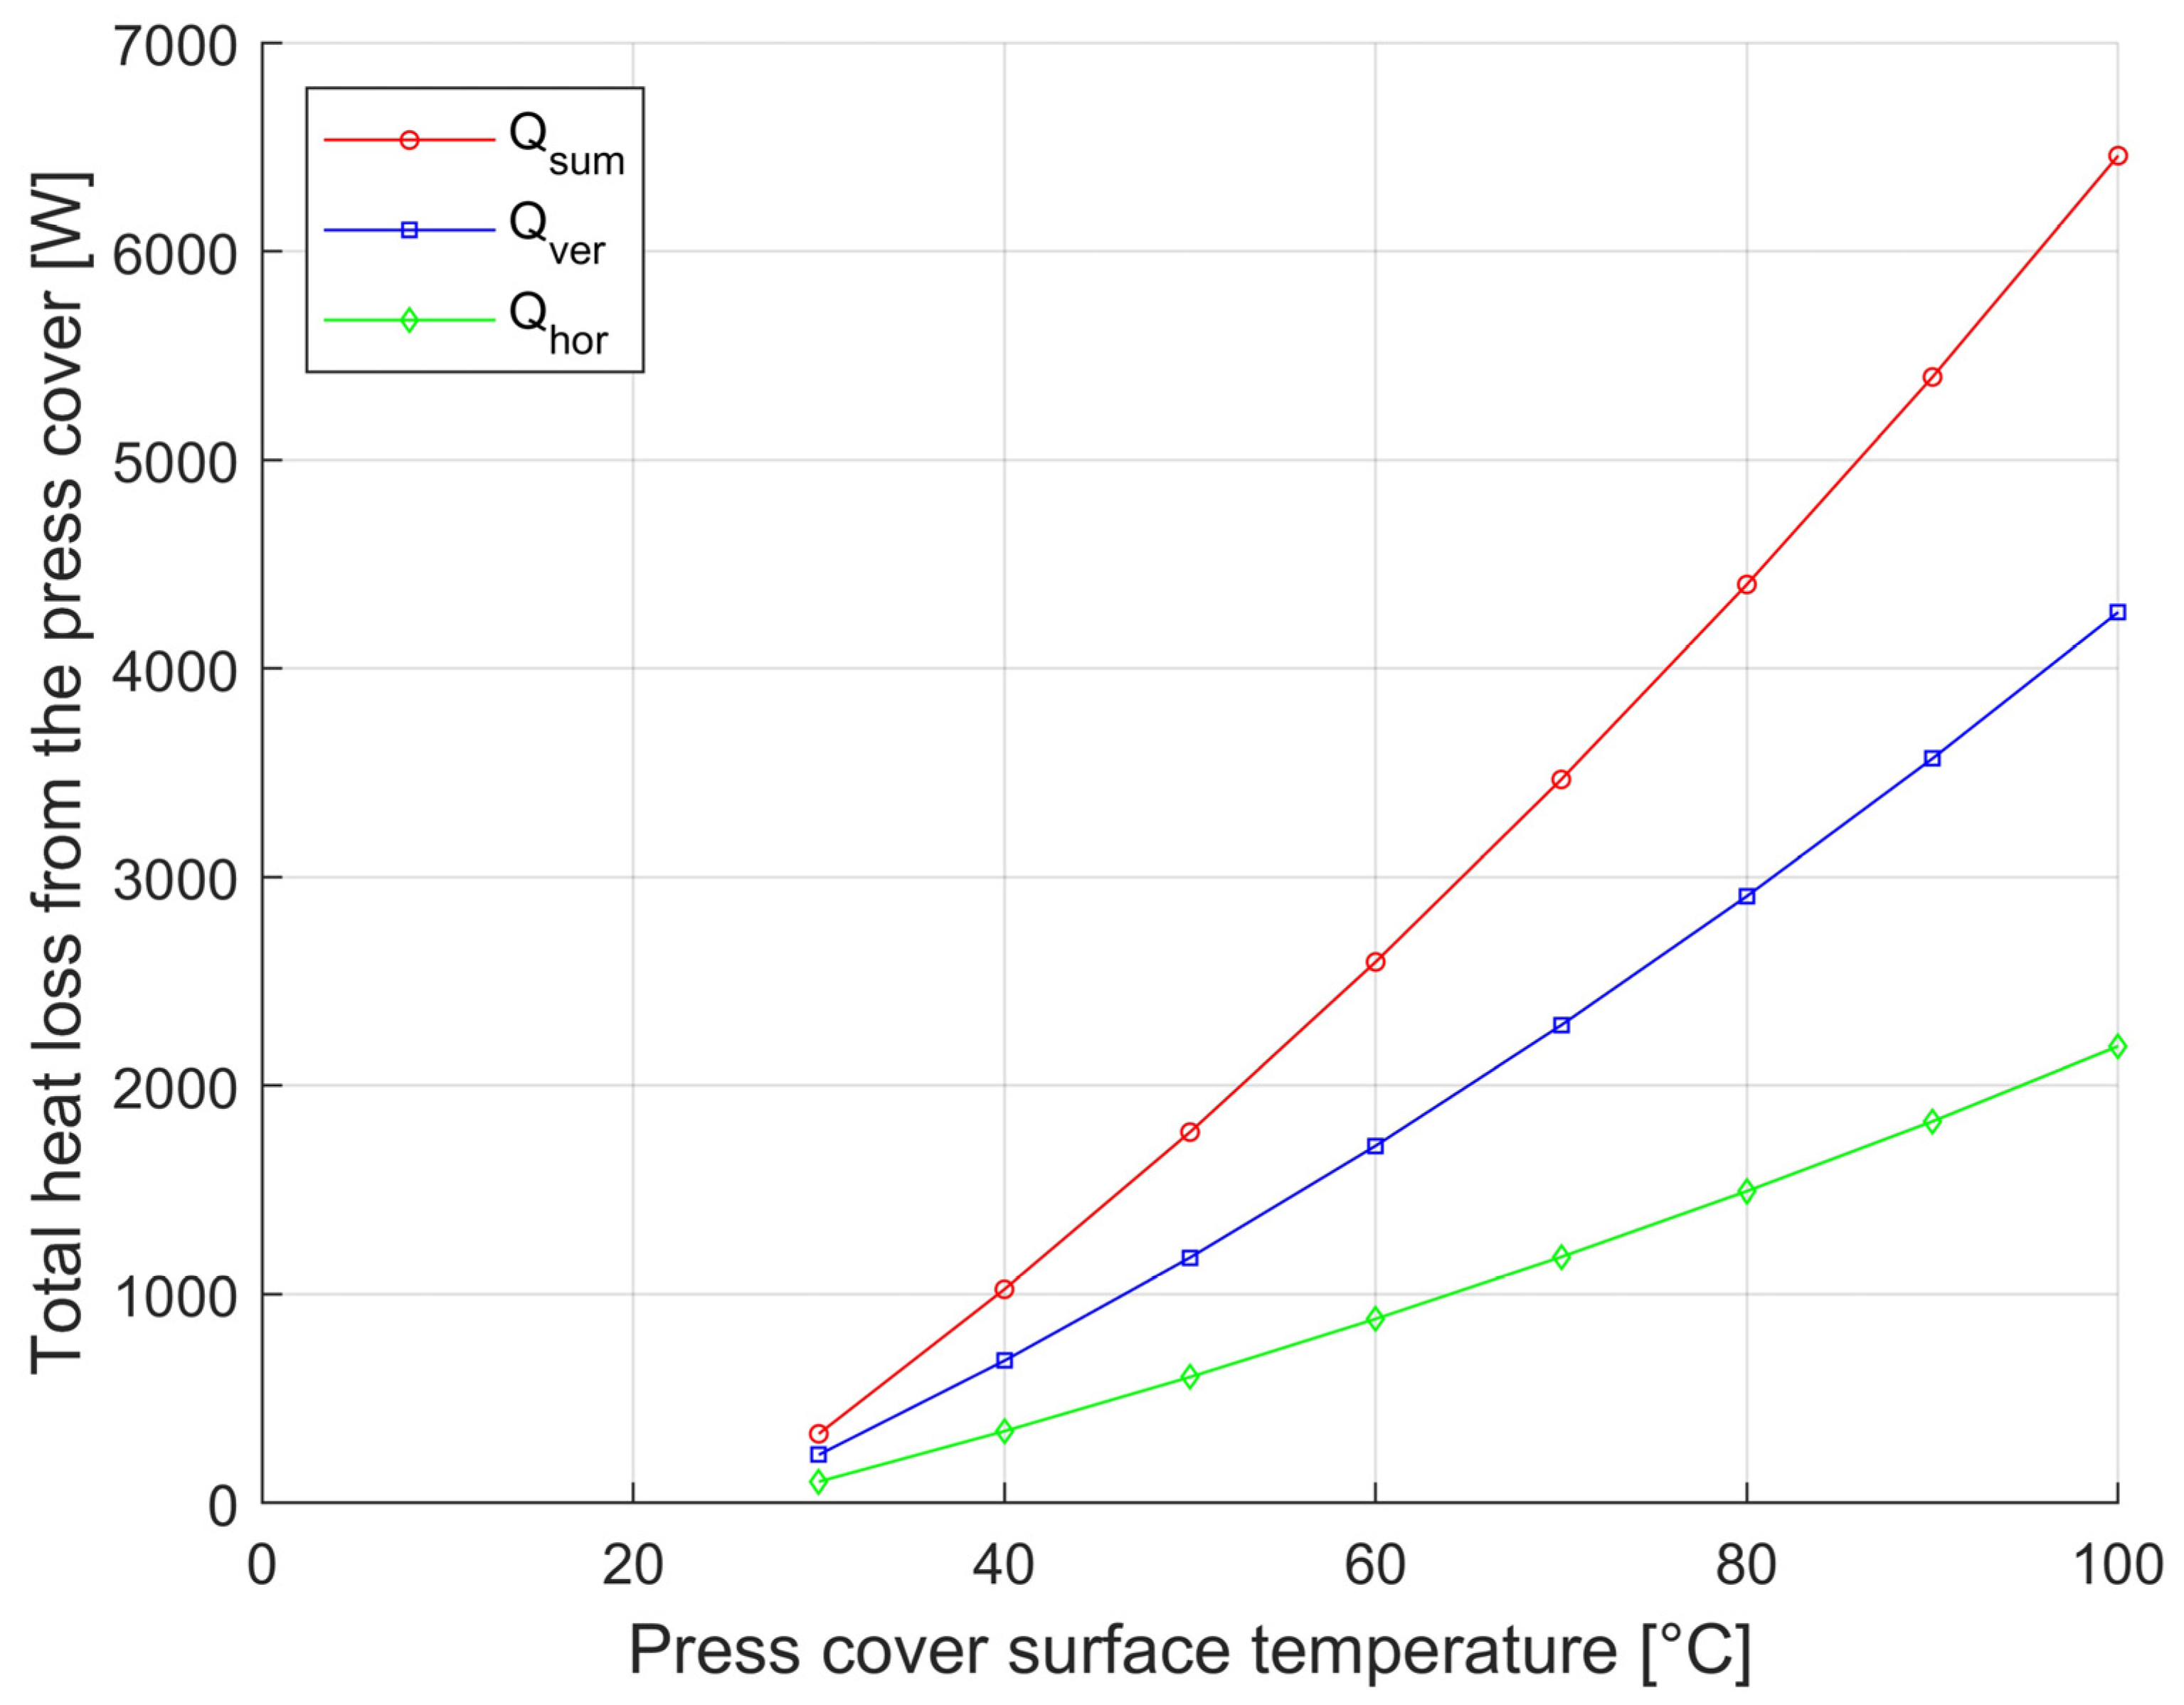
To quickly assess the heat loss from the horizontal and vertical container walls based on a well-measurable parameter, the surface temperature, states with an outside-to-outside surface temperature of 30 °C to 100 °C were modeled. Based on the results (data shown in Table 3 and Table 4) obtained from the mathematical model presented in Section 2.2, the graphs shown in Figure 7 and Figure 8 were created. The graphs show the effect of heat loss on the surface temperature.
Table 3.
Calculations of the heat loss of a container D = 1200 mm/H = 750 mm insulated with unknown insulation based on the surface temperature of the container cover.
Table 4.
Calculations of the heat loss of a container D = 1750 mm/H = 1200 mm insulated with unknown insulation based on the surface temperature of the container cover.
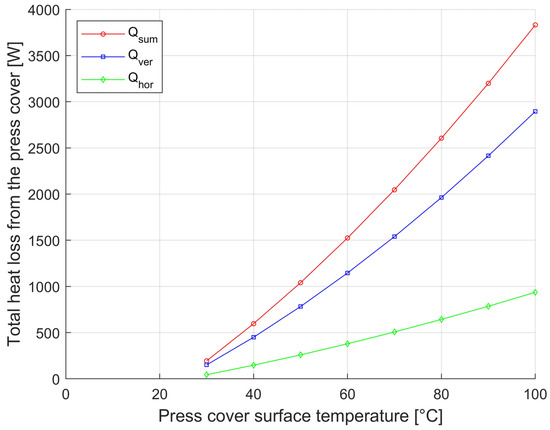
Figure 7.
Dependence of container (D = 1200 mm) heat loss from horizontal and vertical surfaces and total heat loss on the surface temperature of the outer enclosure.
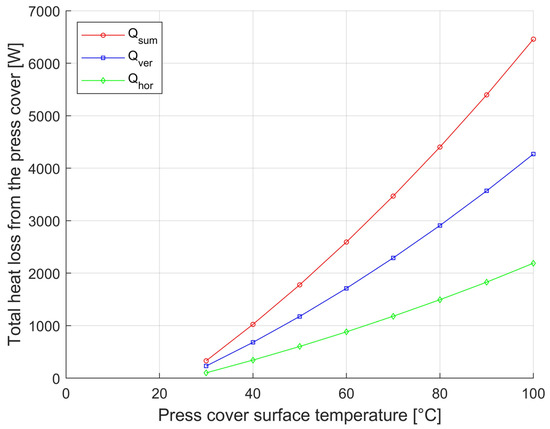
Figure 8.
Dependence of container (D = 1750 mm) heat loss from horizontal and vertical surfaces and total heat loss on the surface temperature of the outer enclosure.
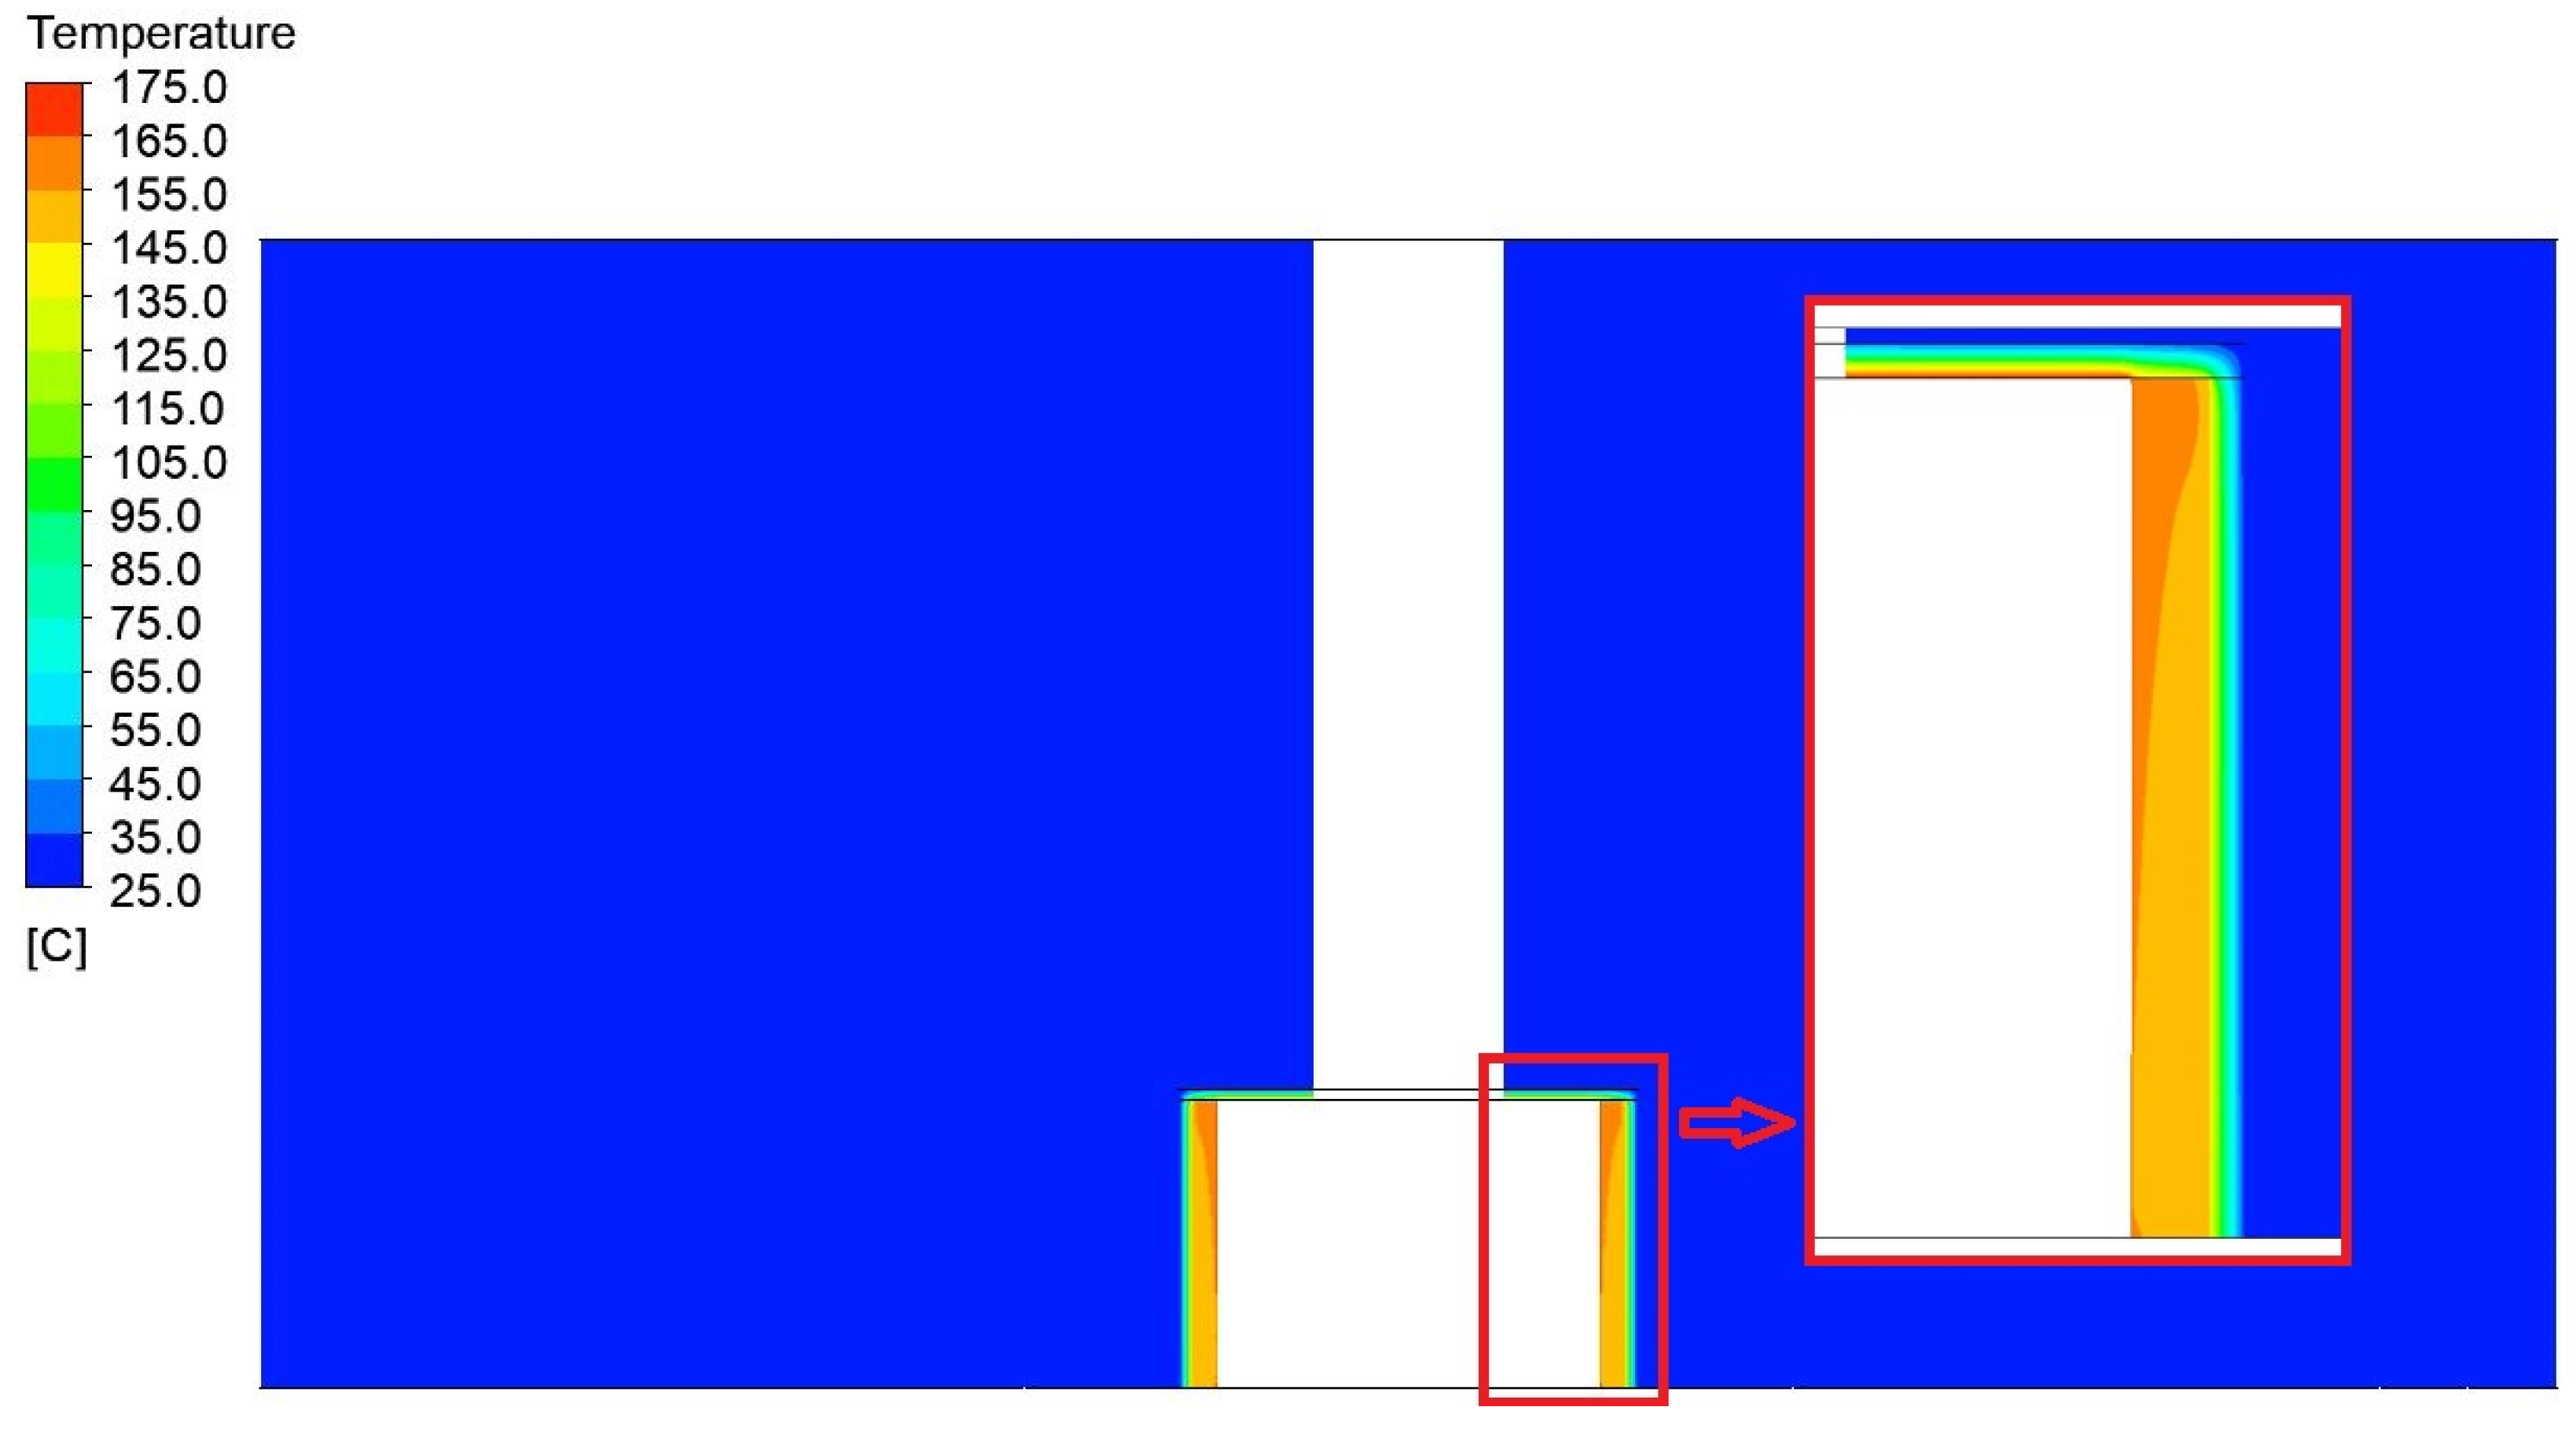
3.2. Model Detailed Numerical Solution of Thermal Insulation of a Tire Pressing Container Variant 1
The model calculations were carried out using the example of a steel container with wall temperature tw = 175 °C, diameter 1000 mm, covered by a cylinder of steel plate of internal diameter 1200 mm. The external environment is air at a temperature of 25 °C. The gap between the sheet steel cylinder and the vertical wall of the container is filled with Spaceloft insulation (k = 0.016 W·m−1·K−1), which is covered on the container wall side with Alu-film of emissivity εs = 0.06.
CFD numerical simulation results for the tire vulcanization press for Variant 1 with a width of 1200 mm and a height of 750 mm.
Figure 9, Figure 10, Figure 11, Figure 12, Figure 13 and Figure 14 show the contours of the temperature profiles in the cross-section of the container for variant 1, together with a view of the detailed parts of the container and the surrounding area. In the contours shown, it is possible to observe the heat leakage and its resulting effect on the distribution and magnitude of the temperature field around the container. Figure 15 shows the generated sections used to analyze the temperature distribution along the height of the press.
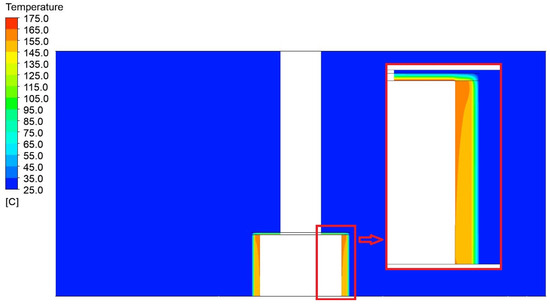
Figure 9.
Display the temperature field distribution with detail in a vertical section through a model of a press with a width of 1200 mm and a height of 750 mm.
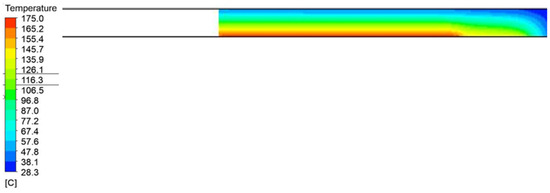
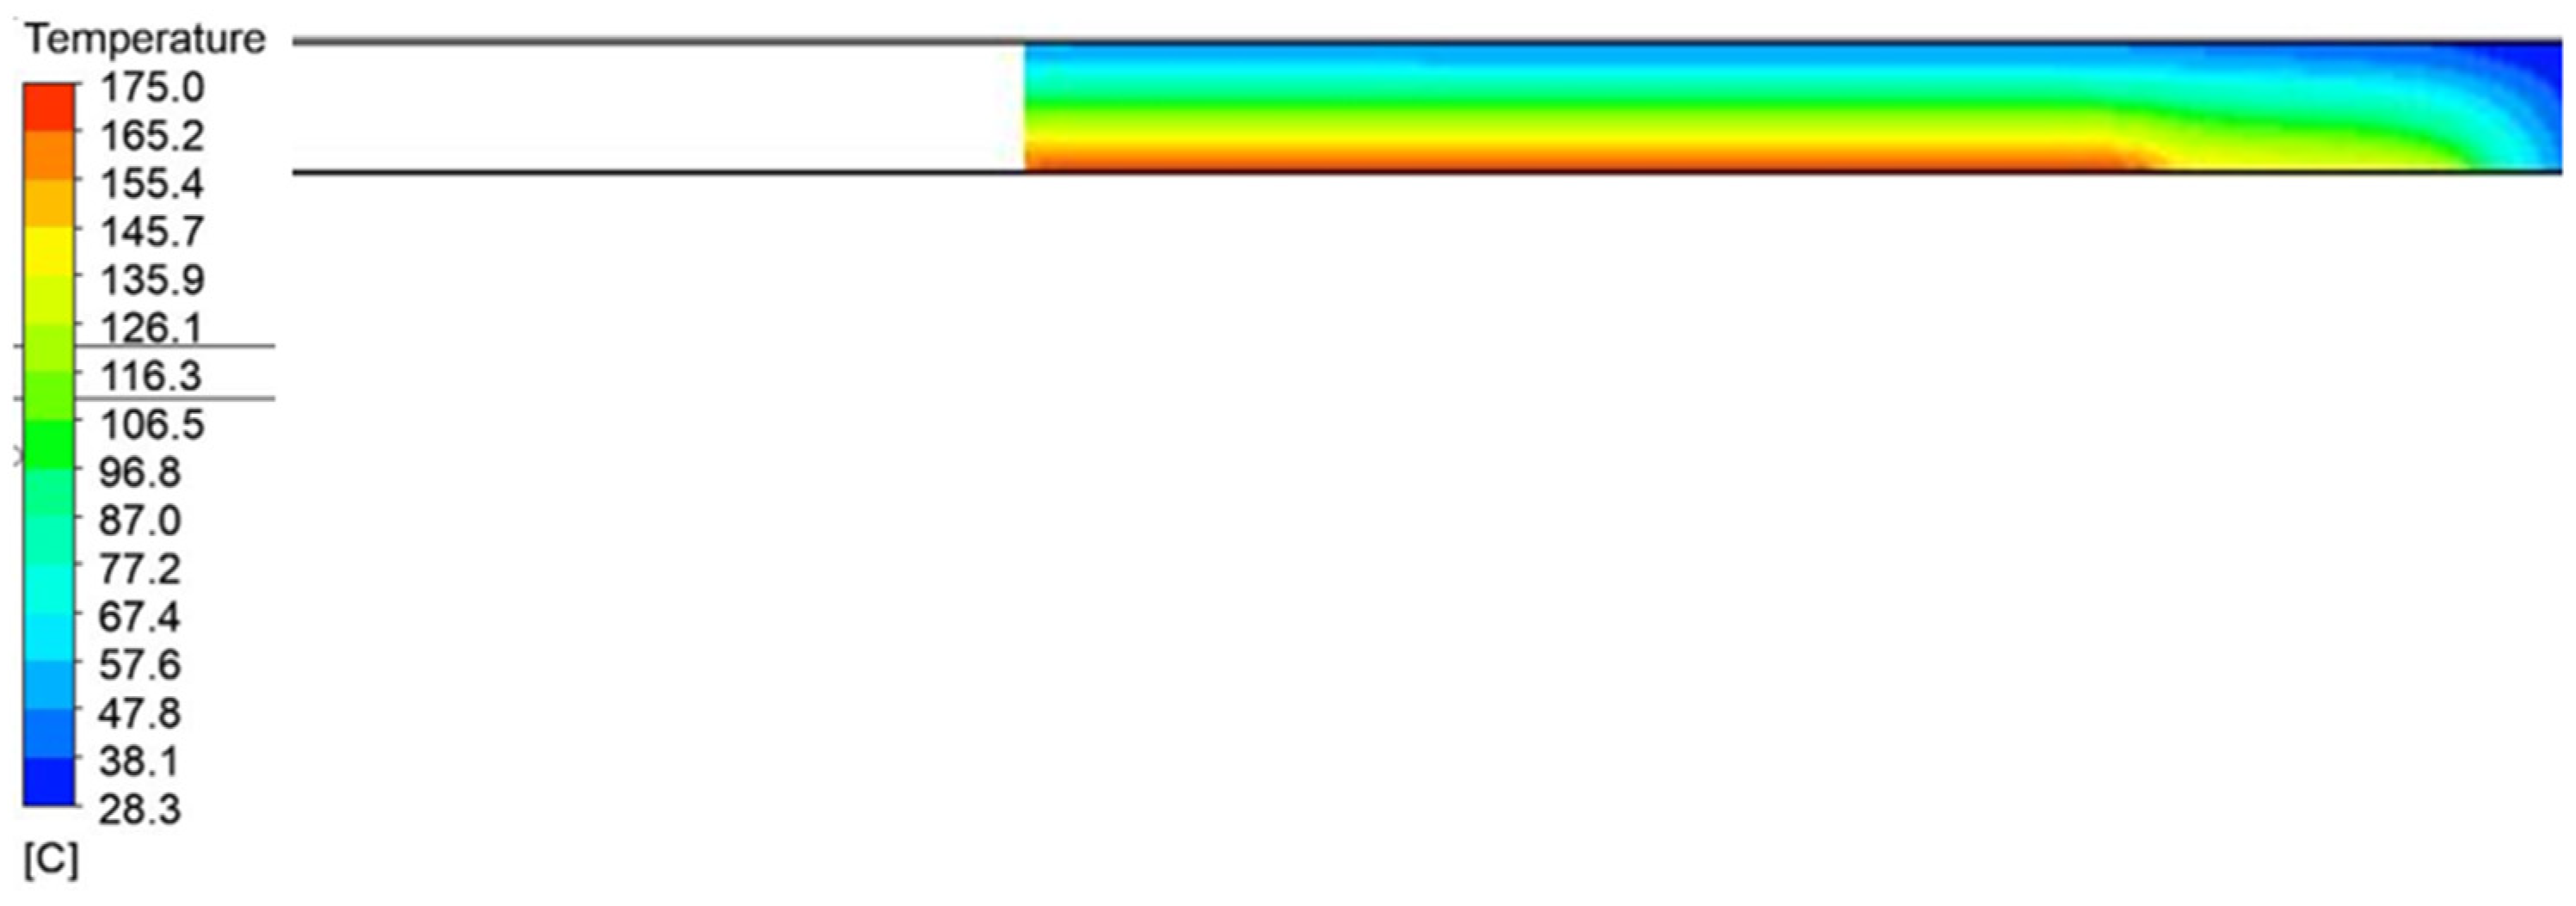
Figure 10.
Temperature field distribution in the insulation on the top of the press with a width of 1200 mm and a height of 750 mm.
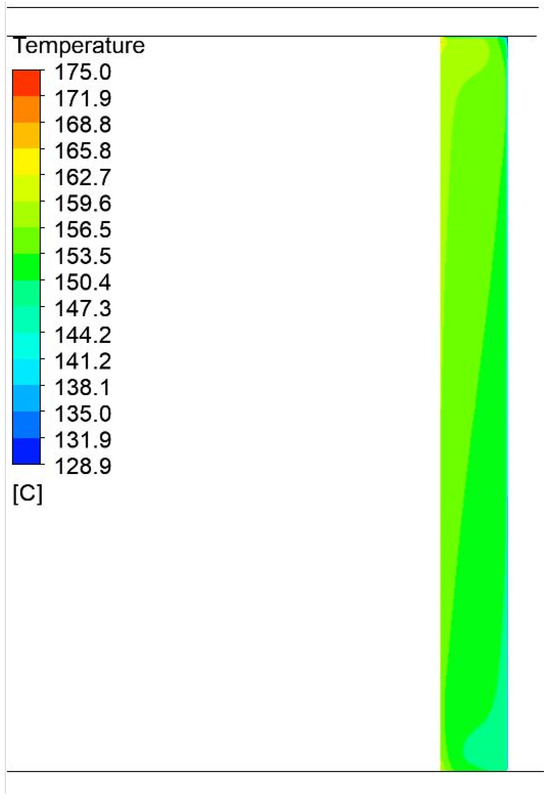
Figure 11.
Temperature field distributions in the air gap between the container and the aluminum foil in a press with a width of 1200 mm and a height of 750 mm.

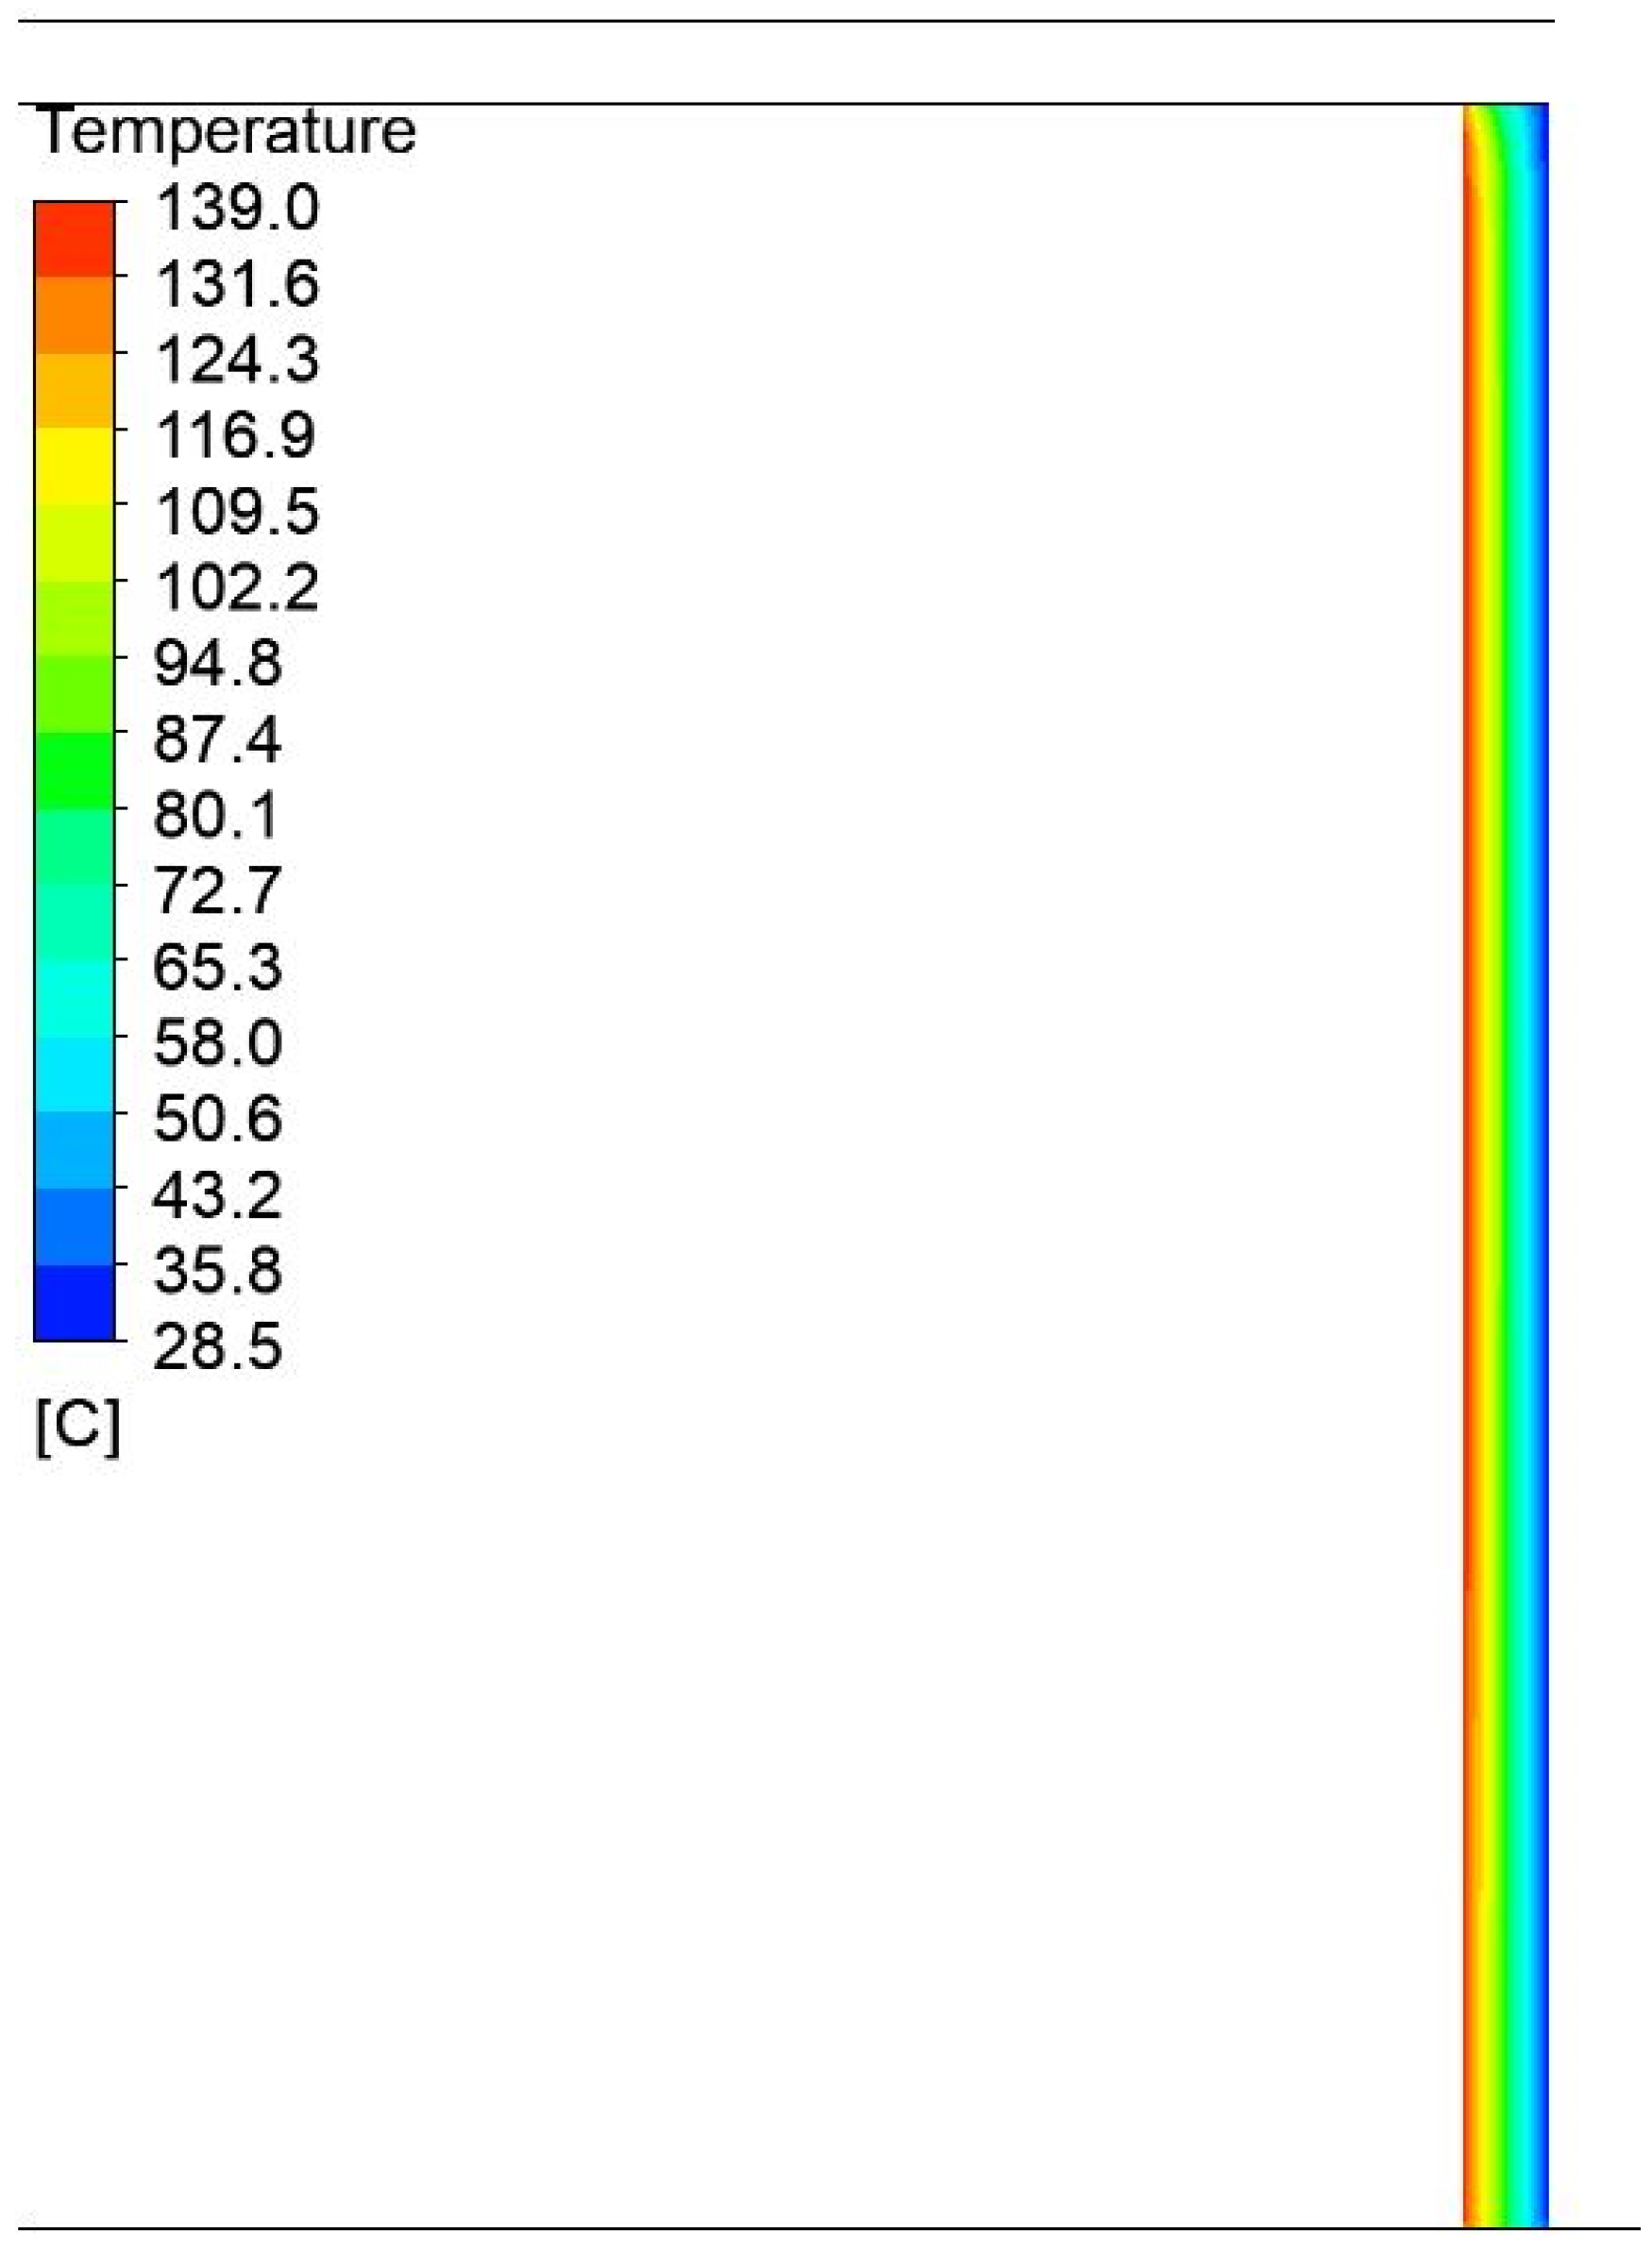
Figure 12.
Temperature field distribution in the insulation on the side of the press with a width of 1200 mm and a height of 750 mm.
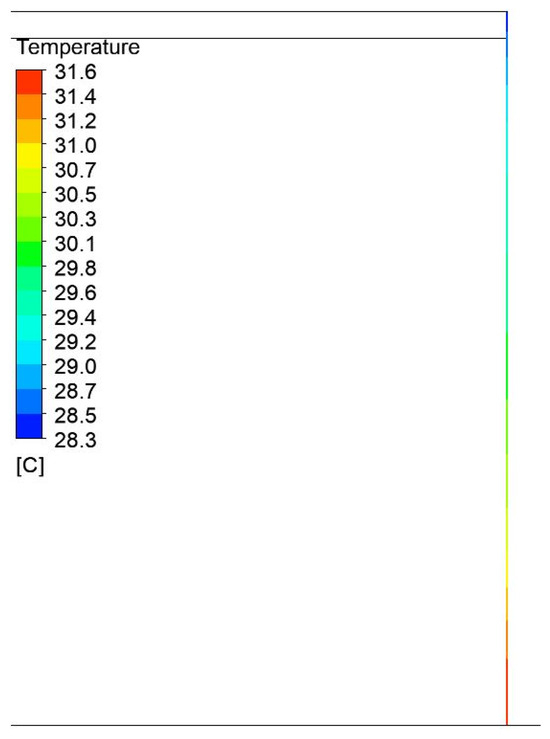
Figure 13.
Temperature field distribution in the steel plate on the side of the press with a width of 1200 mm and a height of 750 mm.
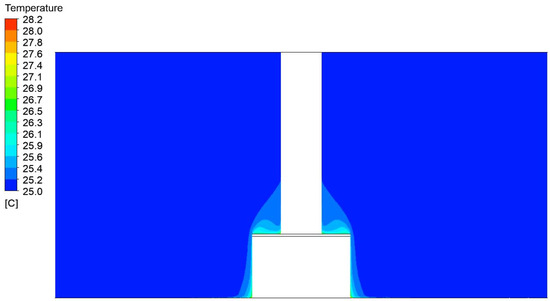
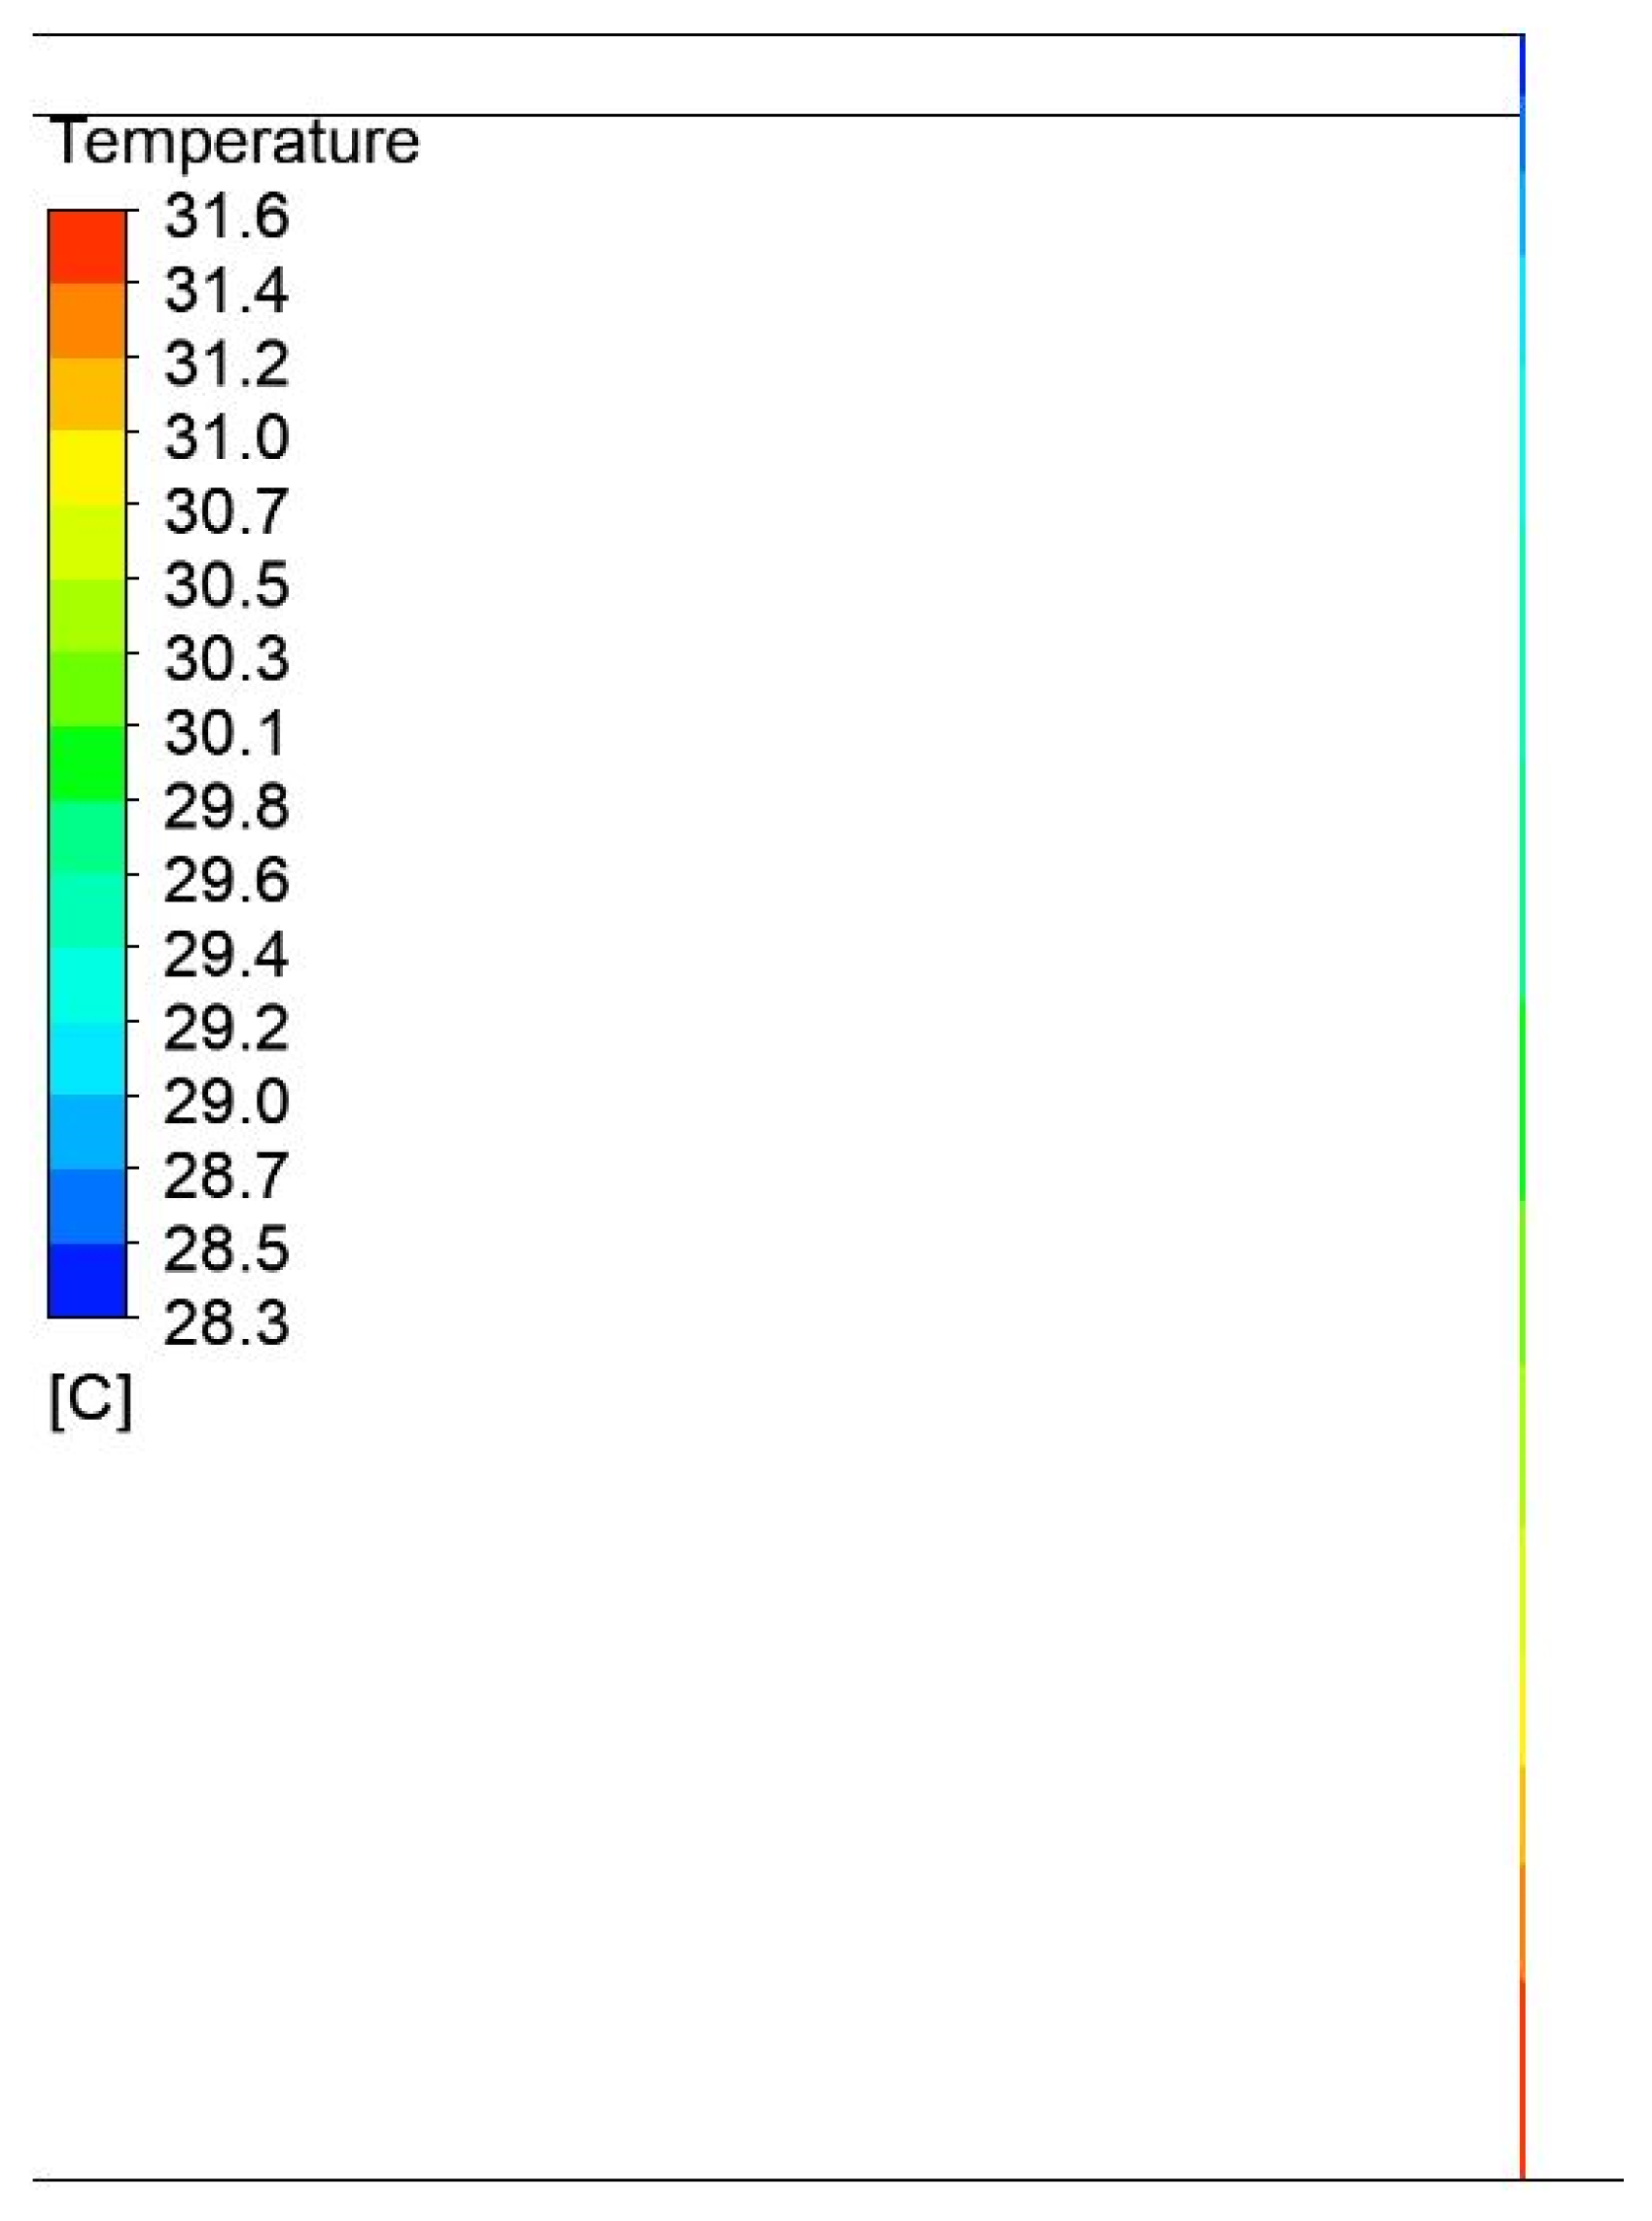
Figure 14.
Temperature field distributions in the air around a press with a width of 1200 mm and a height of 750 mm.
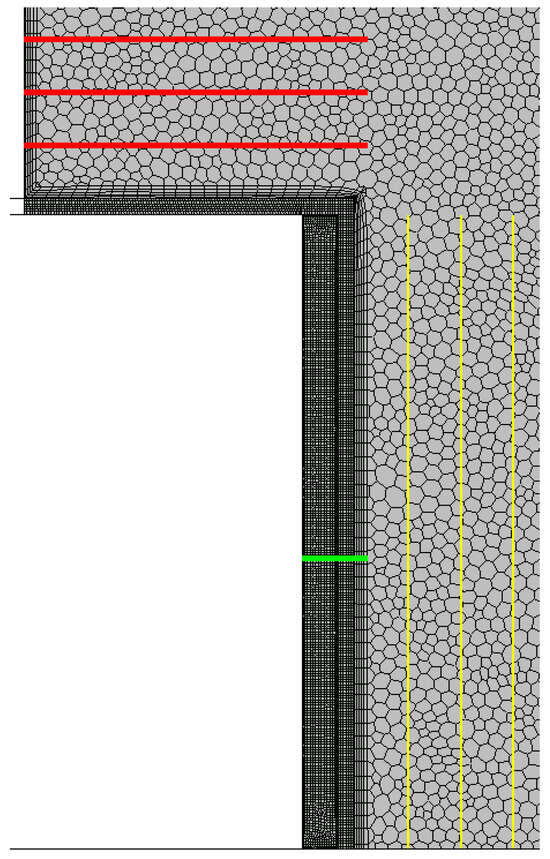
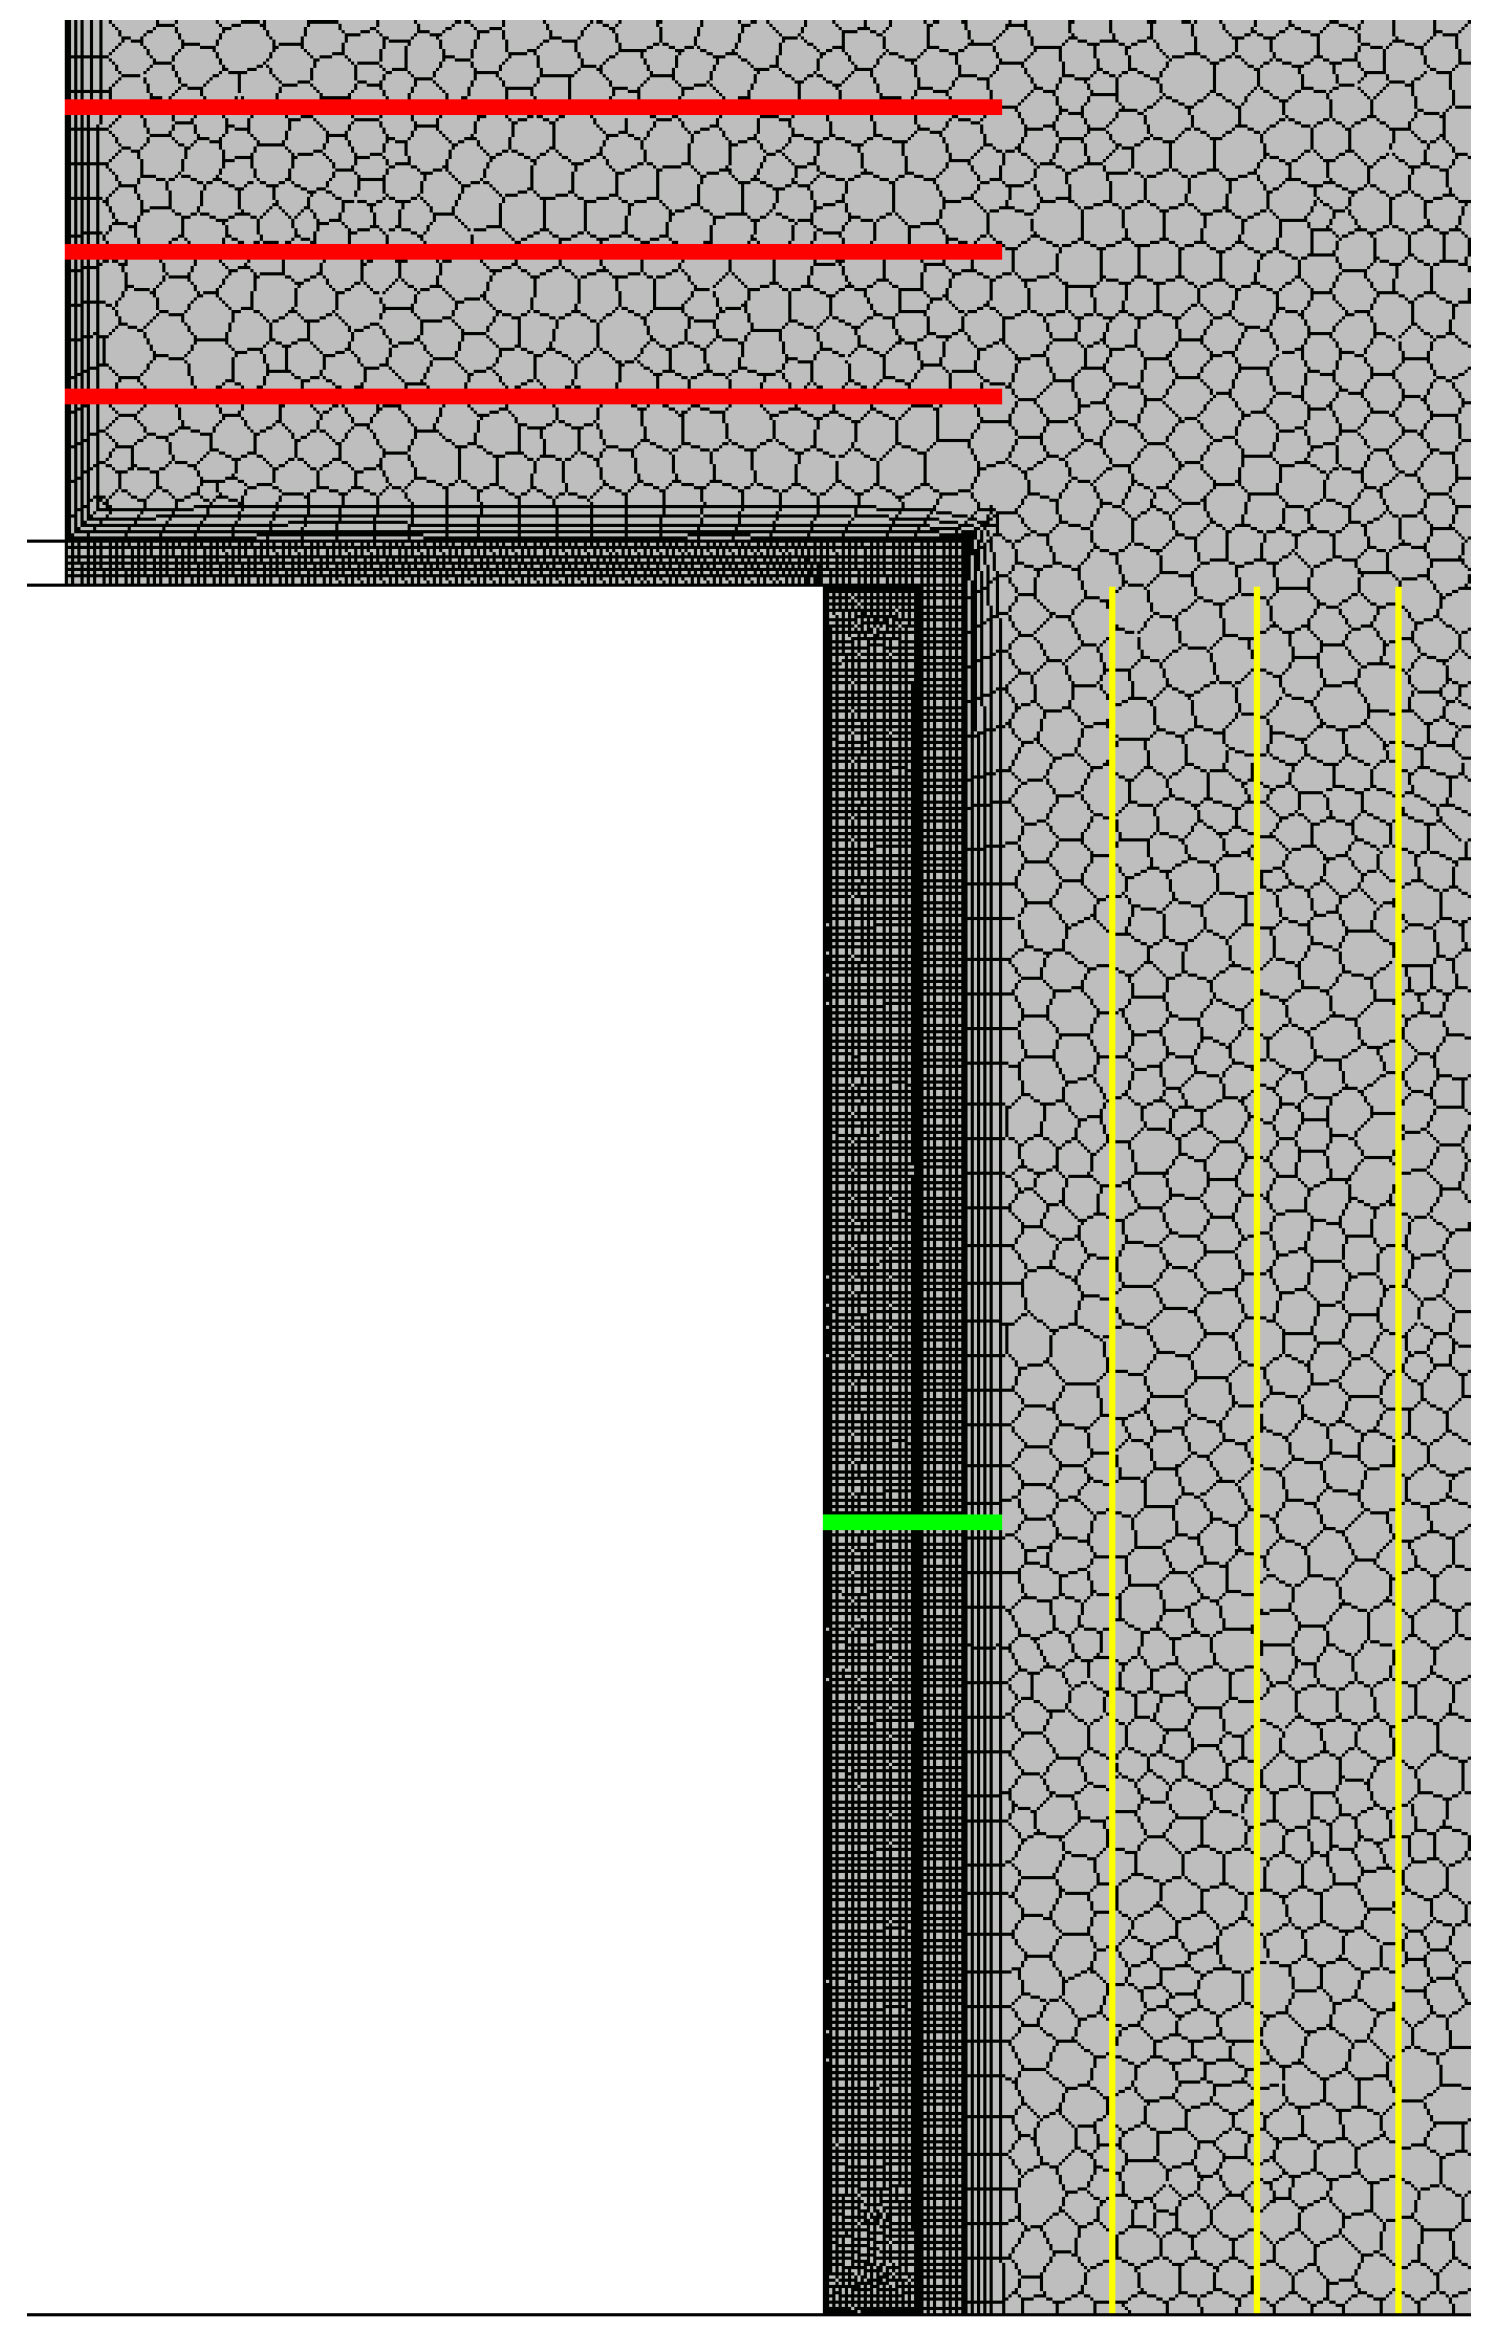
Figure 15.
View of the mesh in a cross-section with a view of the positions of the sections for the values of the temperature profiles.
Detailed representations of the temperature profiles for variant 1. have been plotted on the graphs of the temperature profiles in the construction and are shown in Figure 16, Figure 17 and Figure 18.
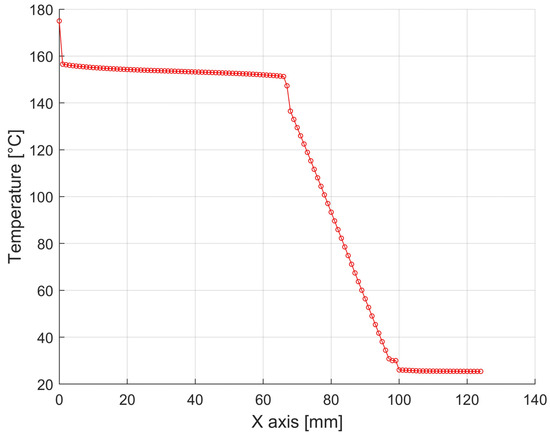
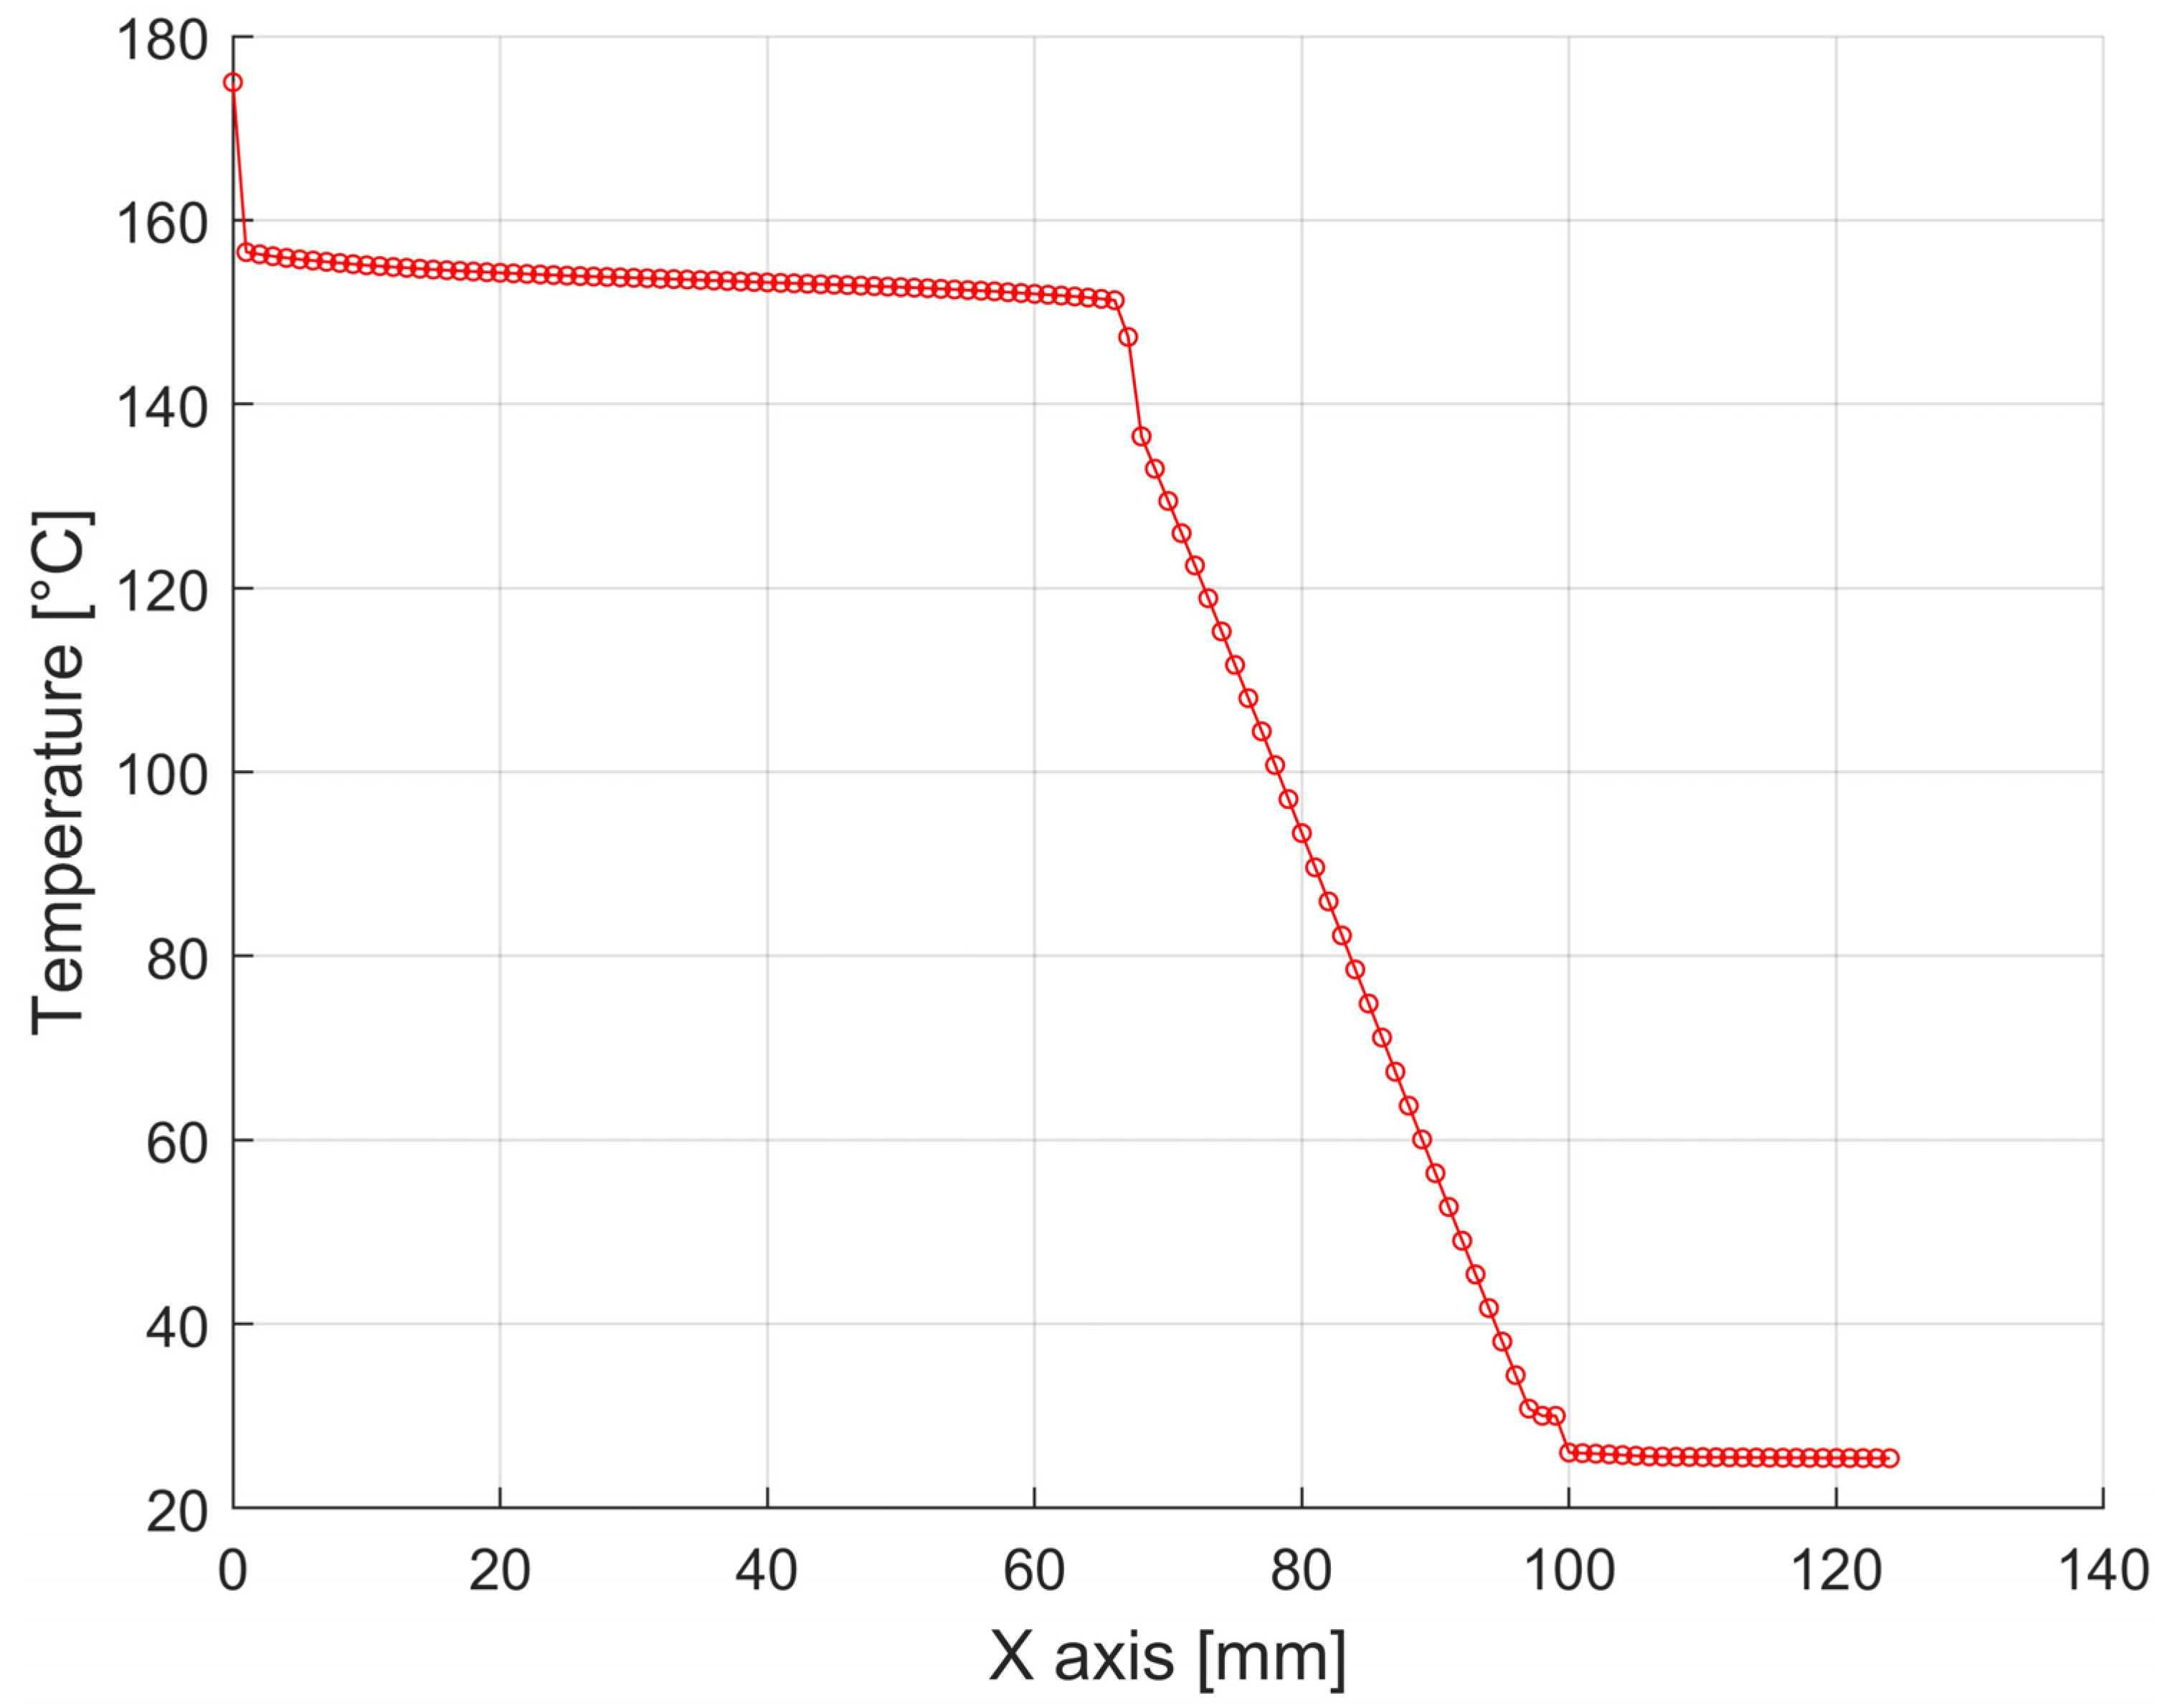
Figure 16.
Temperature distributions through the individual press structures with a width of 1200 mm and a height of 750 mm from the container wall to the ambient air in the horizontal direction. (In Figure 15, the position is shown in green).
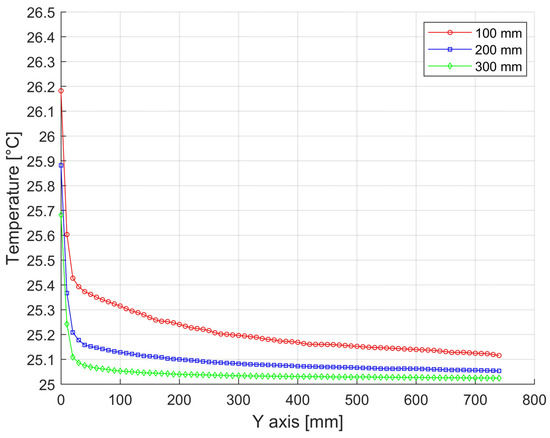
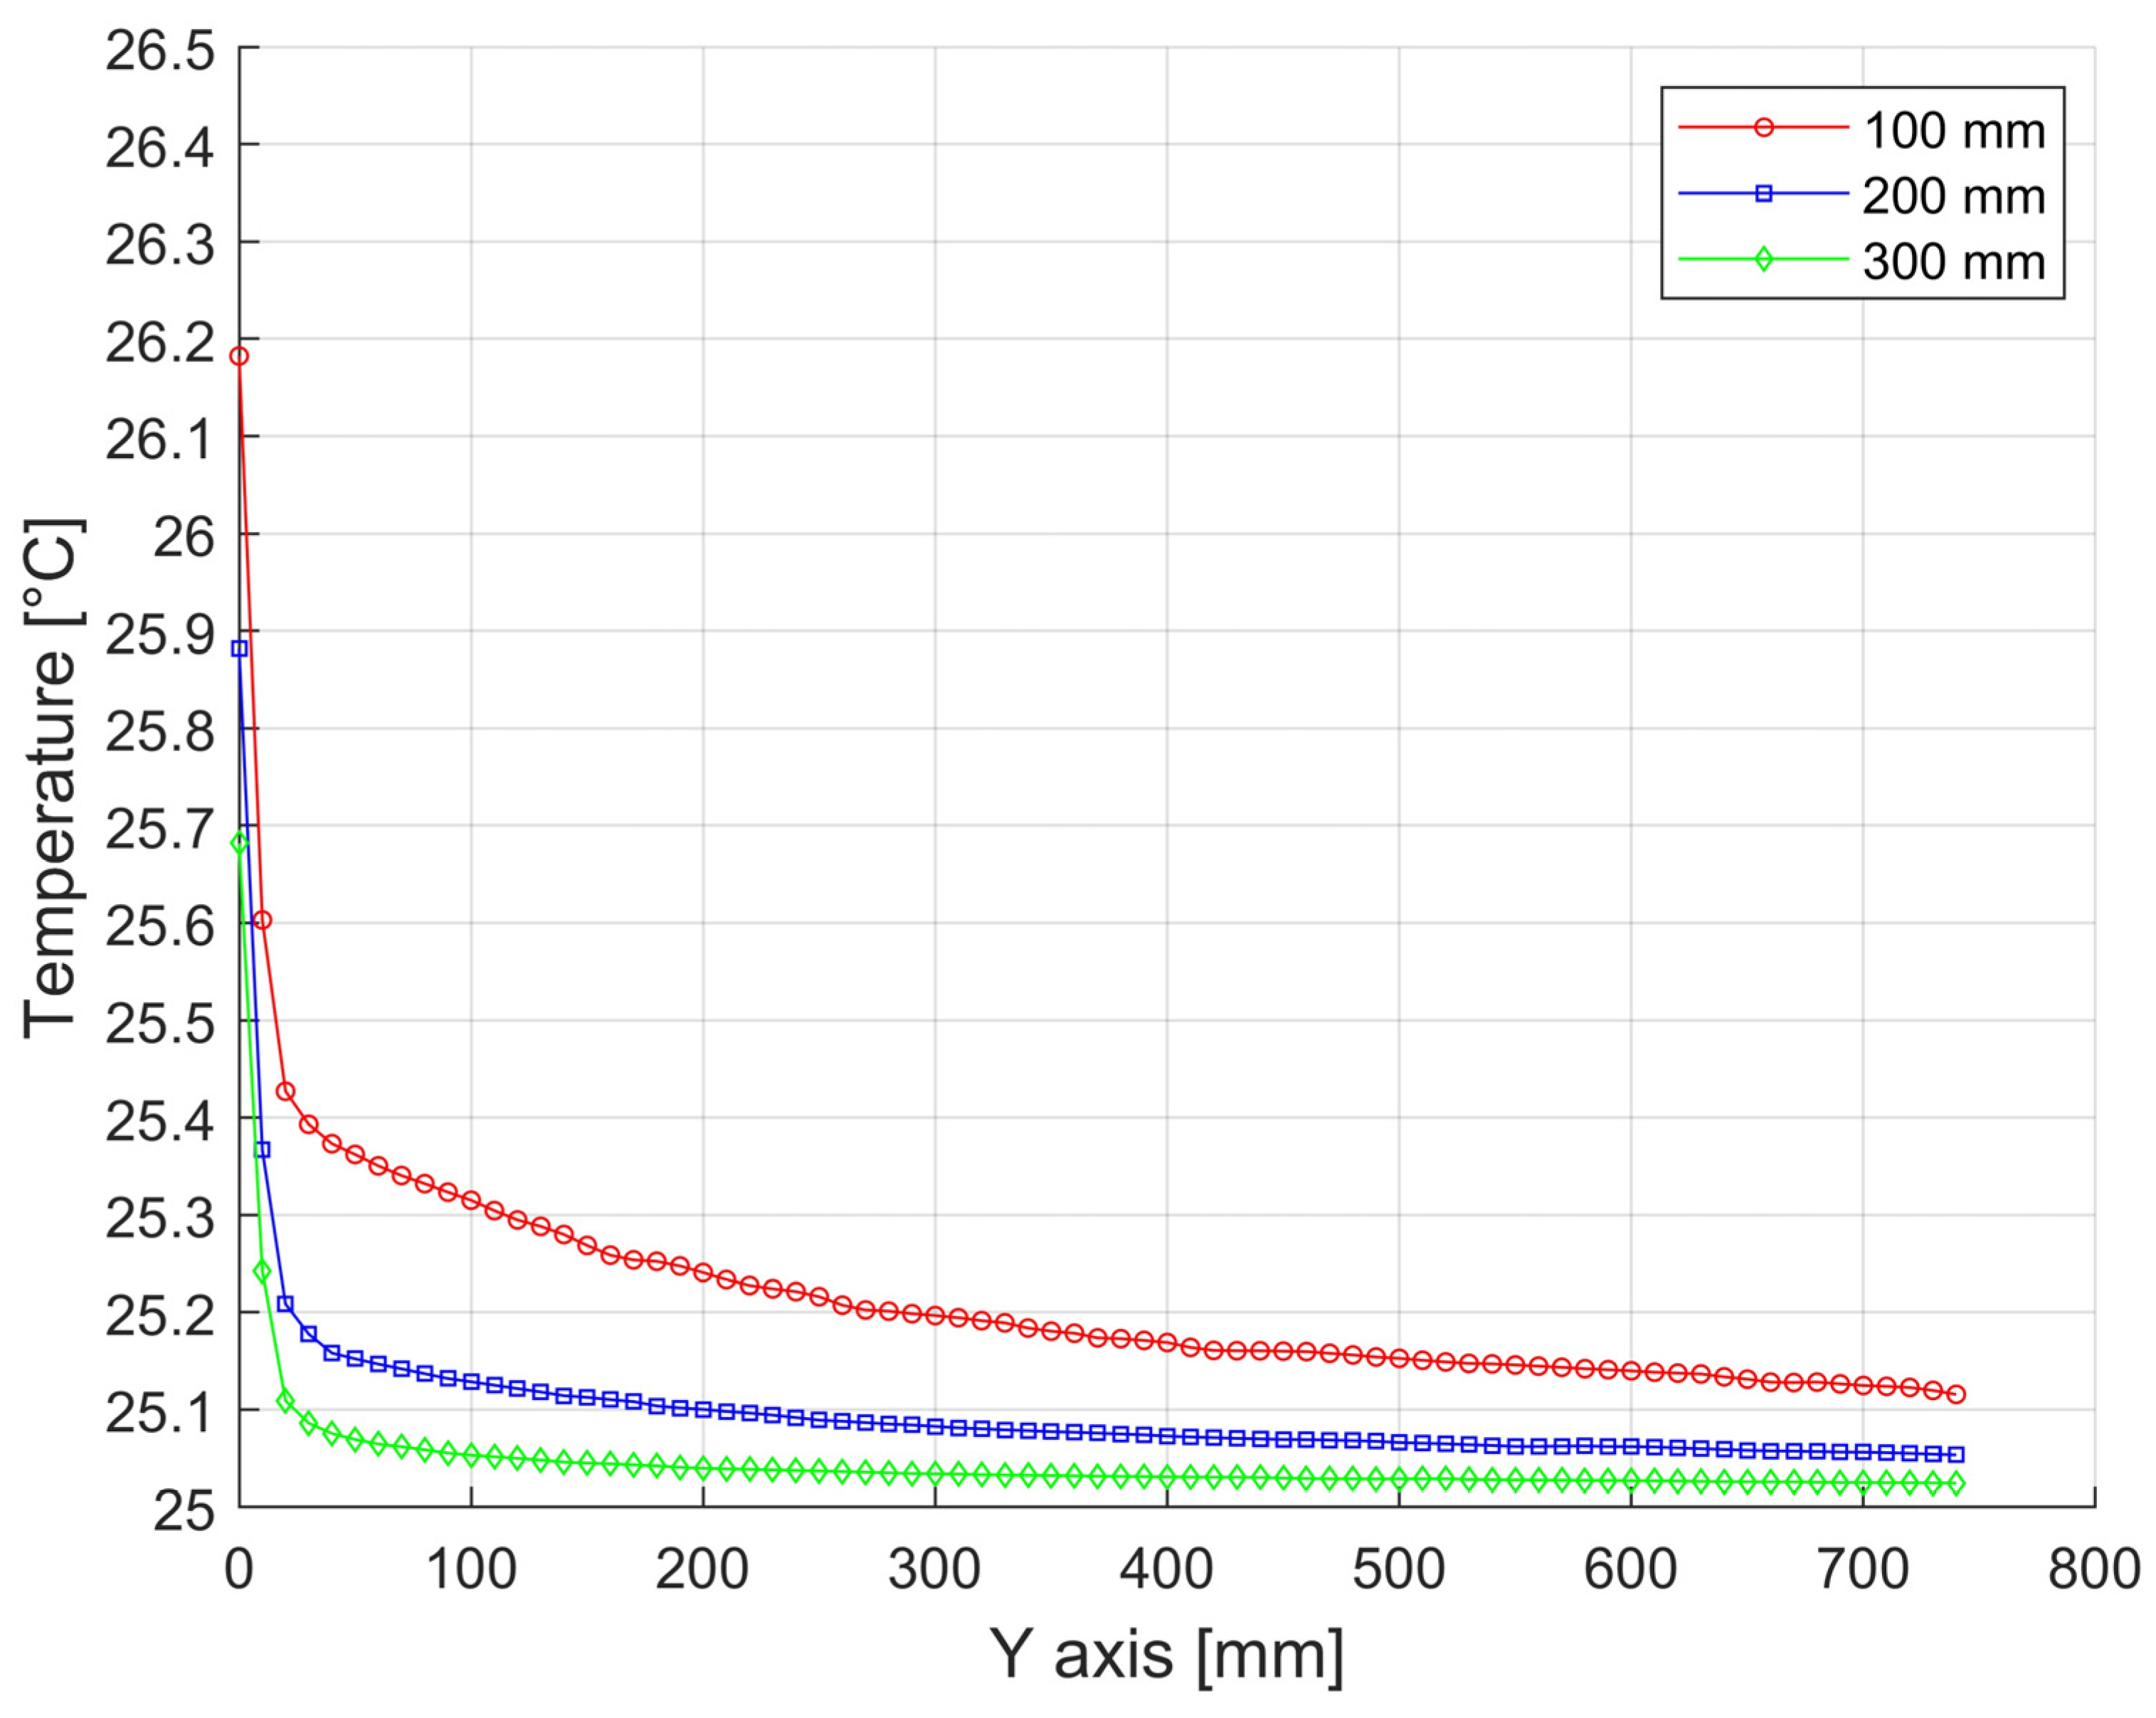
Figure 17.
Temperature distributions along the height of the press with a width of 1200 mm and a height of 750 mm from bottom to top at 100 mm spacing near the vertical wall. (In Figure 15, the position is shown in yellow).
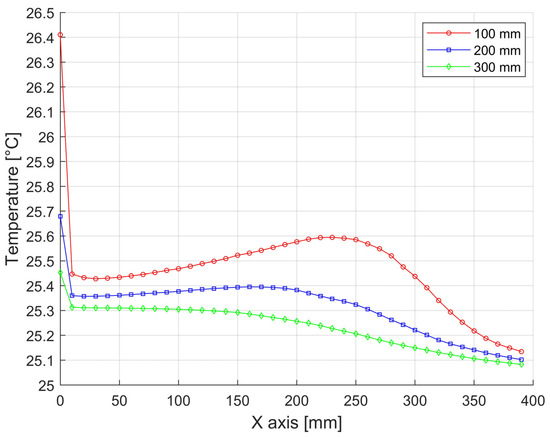
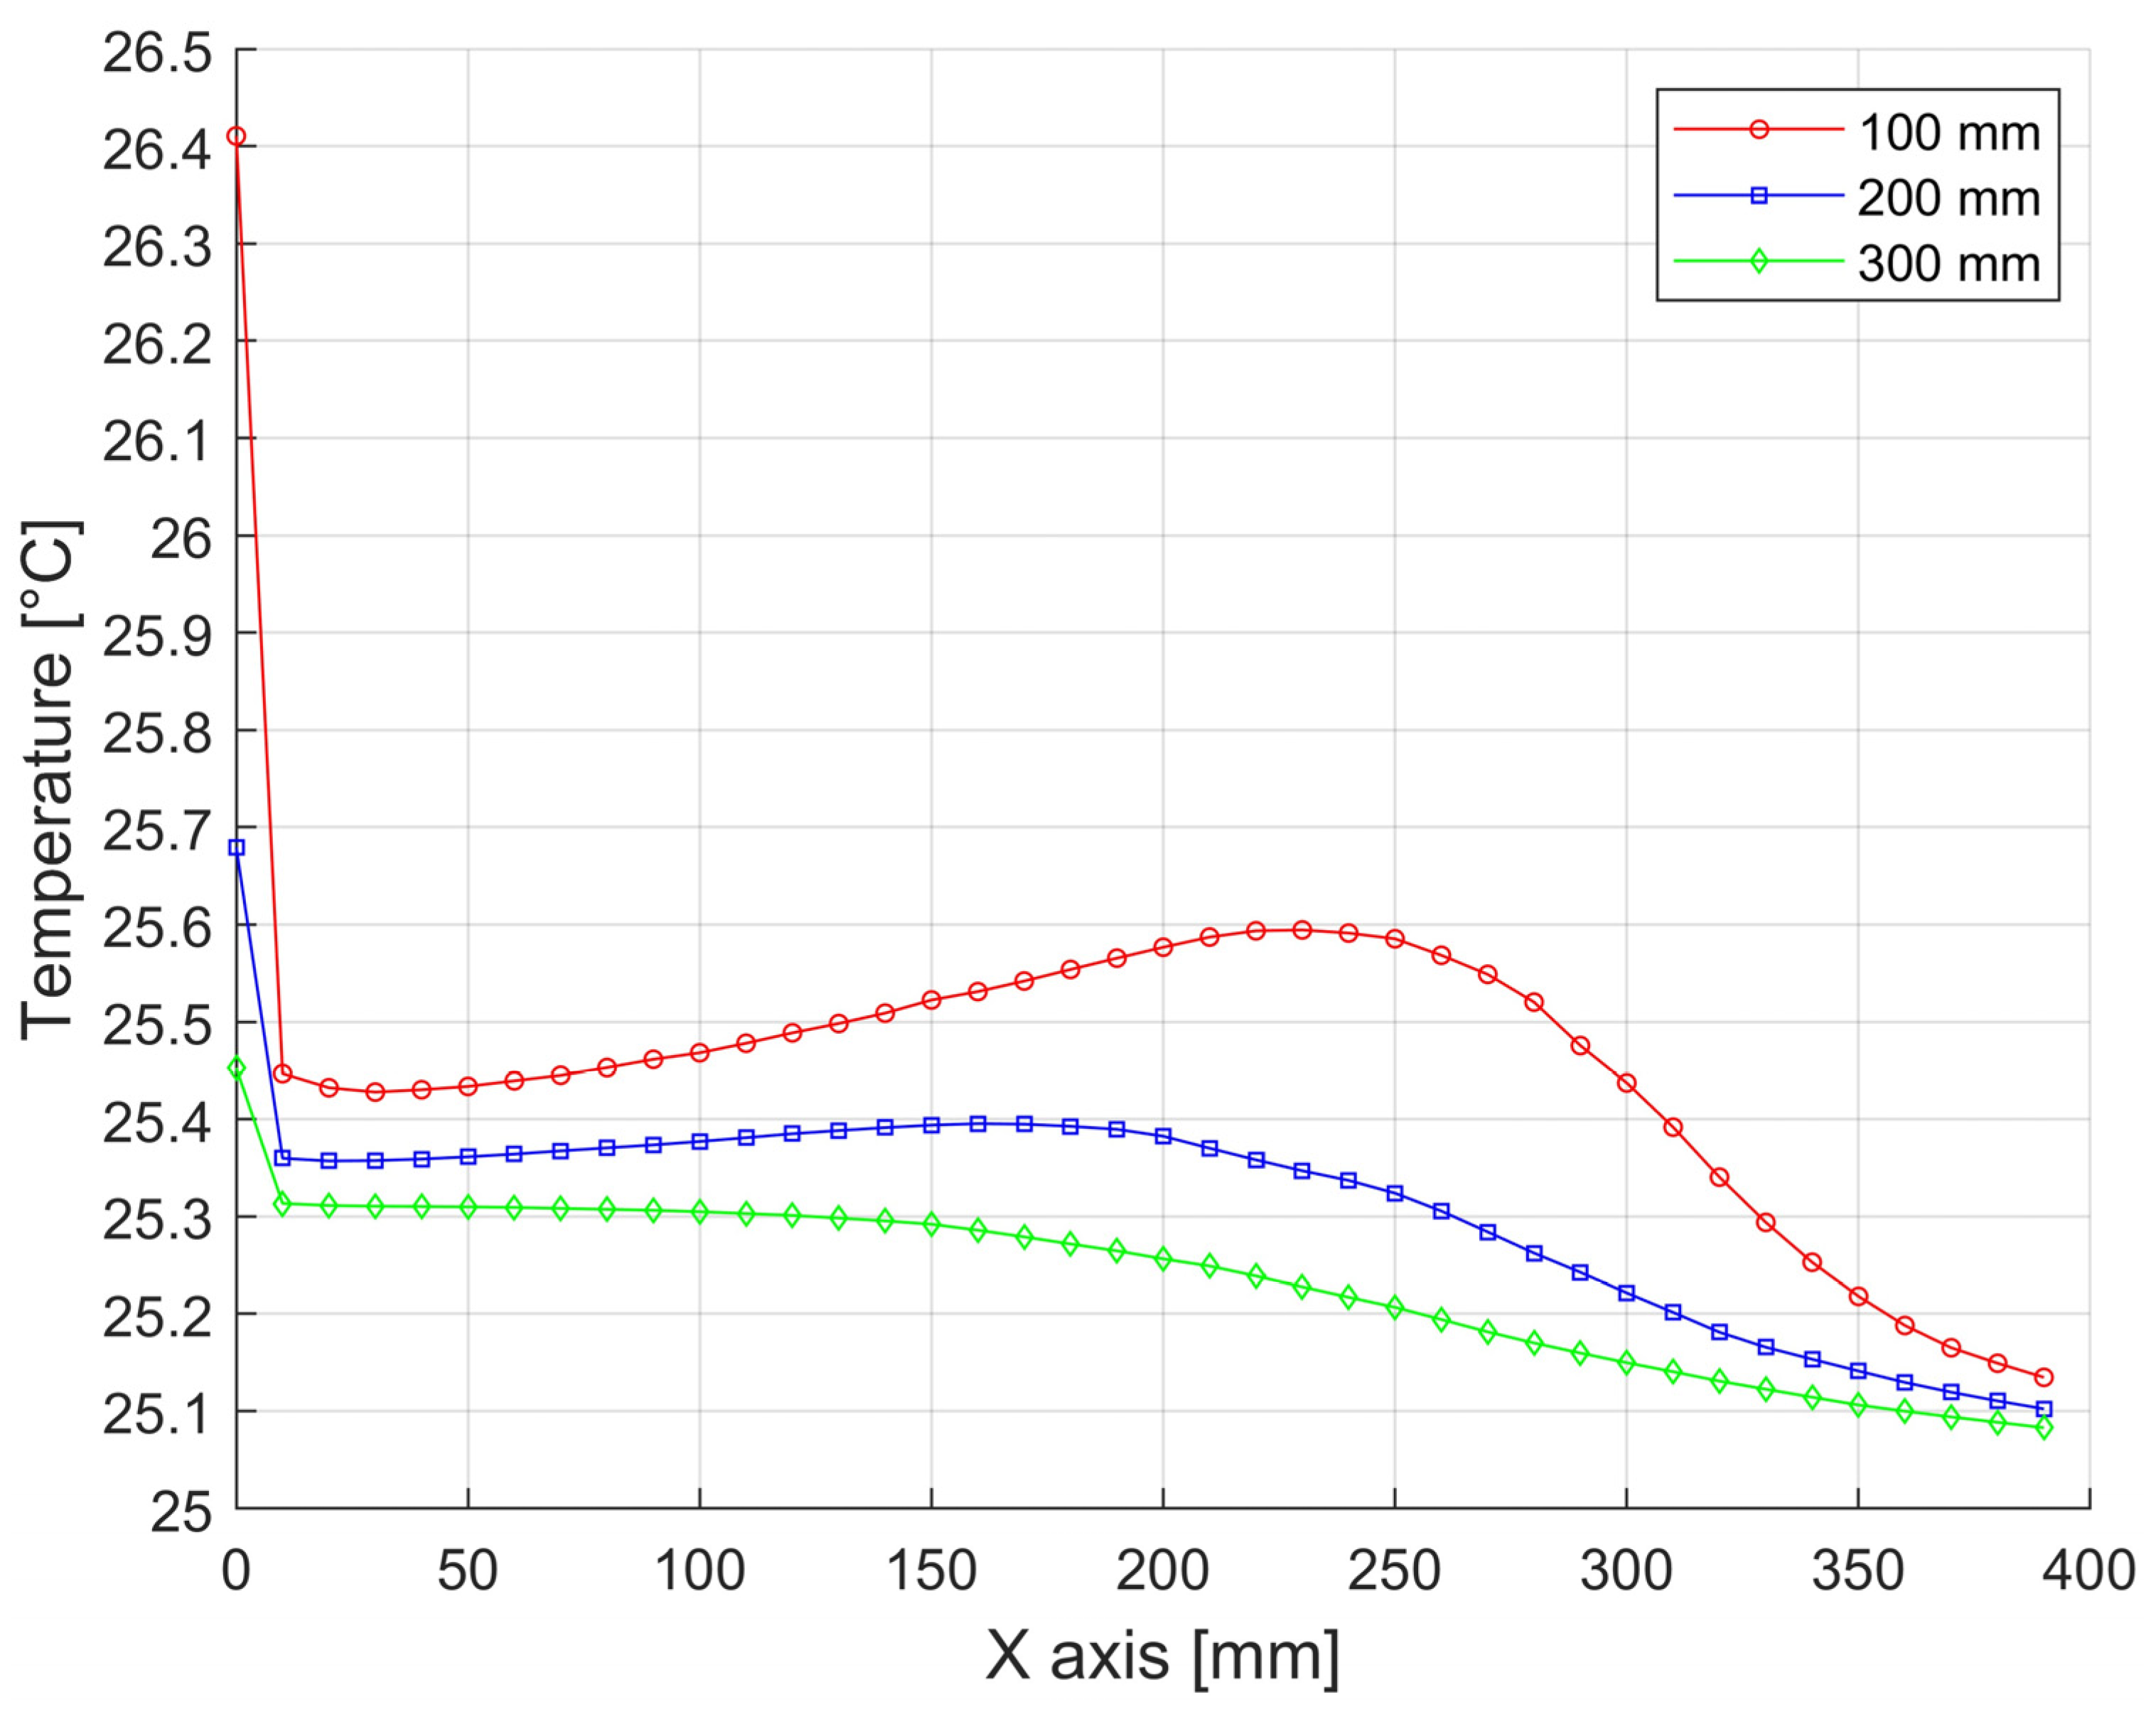
Figure 18.
Temperature distributions over a press with a width of 1200 mm and a height of 750 mm at 100 mm levels (in Figure 15, position shown in red).
3.3. Model Detailed Numerical Solution of Thermal Insulation of a Tire Pressing Container Variant 2
The model calculations were carried out using the example of a steel container with wall temperature tw = 175 °C, diameter 1550 mm, covered by a cylinder of steel plate of internal diameter 1750 mm. The external environment is air at a temperature of 25 °C. The gap between the sheet steel cylinder and the vertical wall of the container is filled with Spaceloft insulation (k = 0.016 W·m−1·K−1), which is covered on the container wall side with Alu-film of emissivity εs = 0.06.
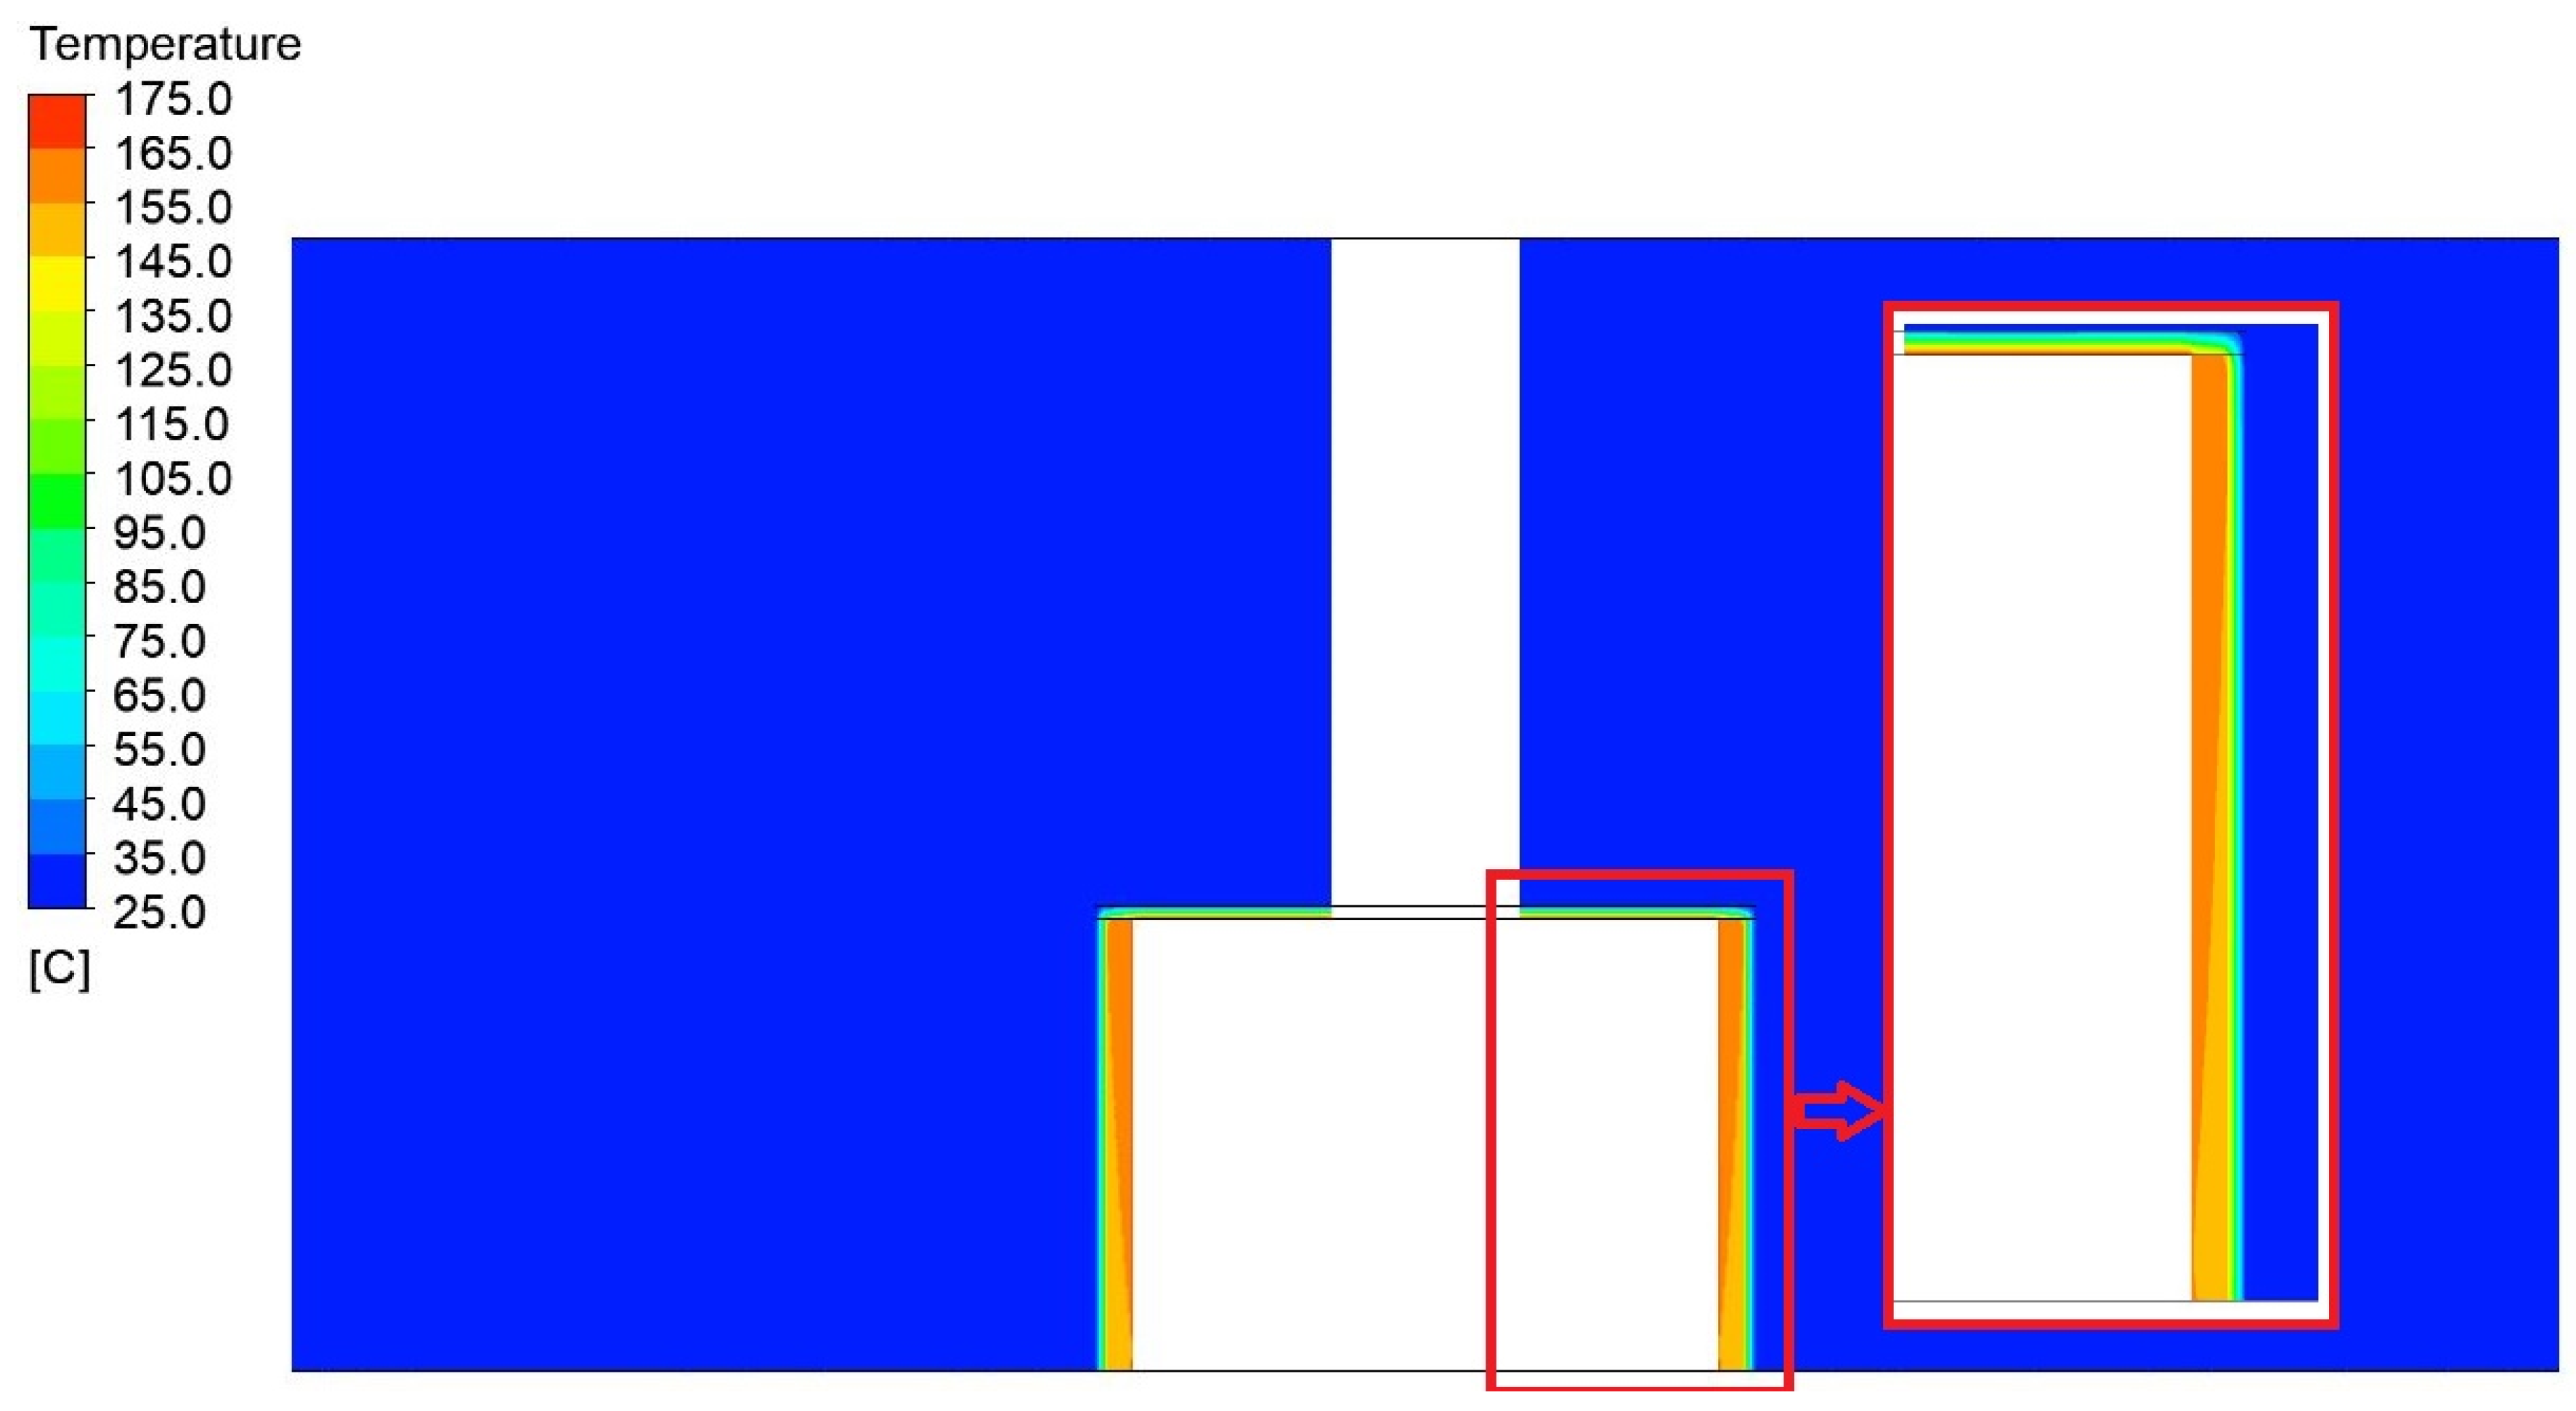
Figure 19, Figure 20, Figure 21, Figure 22, Figure 23 and Figure 24 show the contours of the temperature profiles in the cross-section of the container for variant 2, together with a view of the detailed parts of the container and the surrounding area. In the contours shown, it is possible to observe the heat leakage and its resulting effect on the distribution and magnitude of the temperature field around the container.
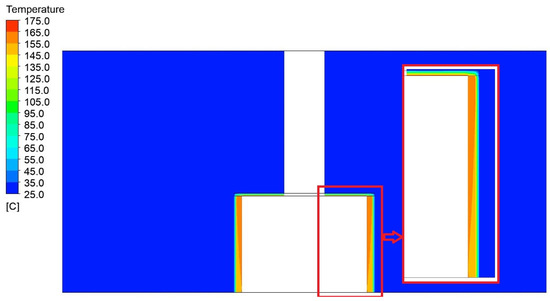
Figure 19.
Display of the temperature field distribution with detail in a vertical section through a 1750 mm wide and 1200 mm high press model.
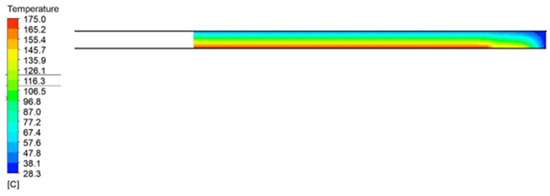
Figure 20.
Temperature field distribution in the insulation on the top of the press with a width of 1750 mm and a height of 1200 mm.
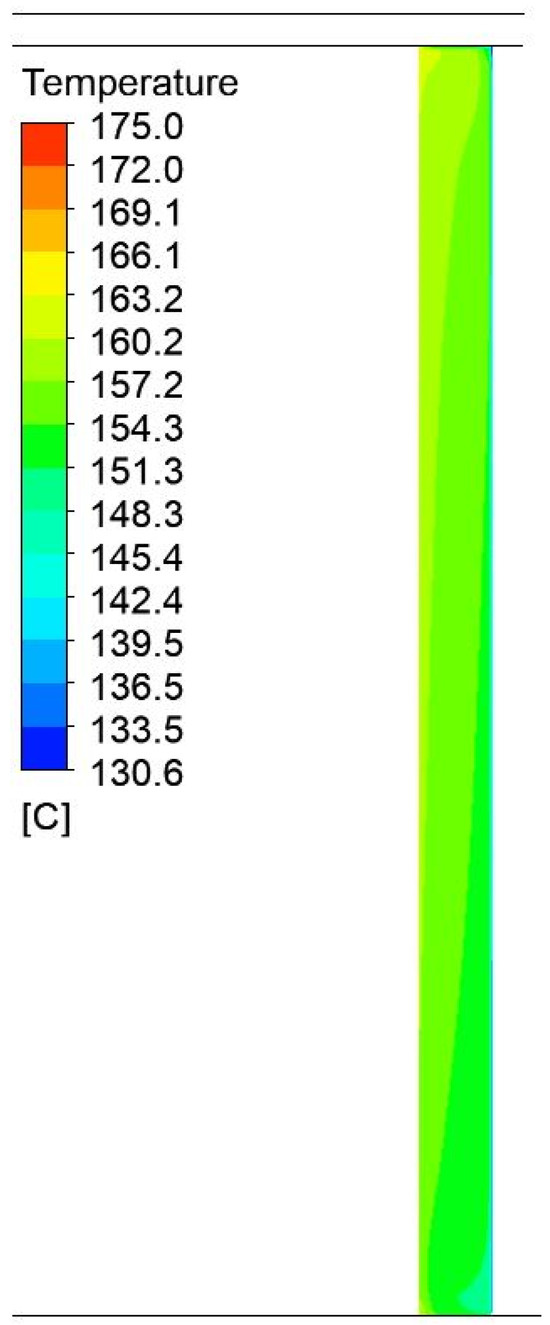
Figure 21.
Temperature field distributions in the air gap between the container and the aluminum foil wall in a 1750 mm wide by 1200 mm high press.
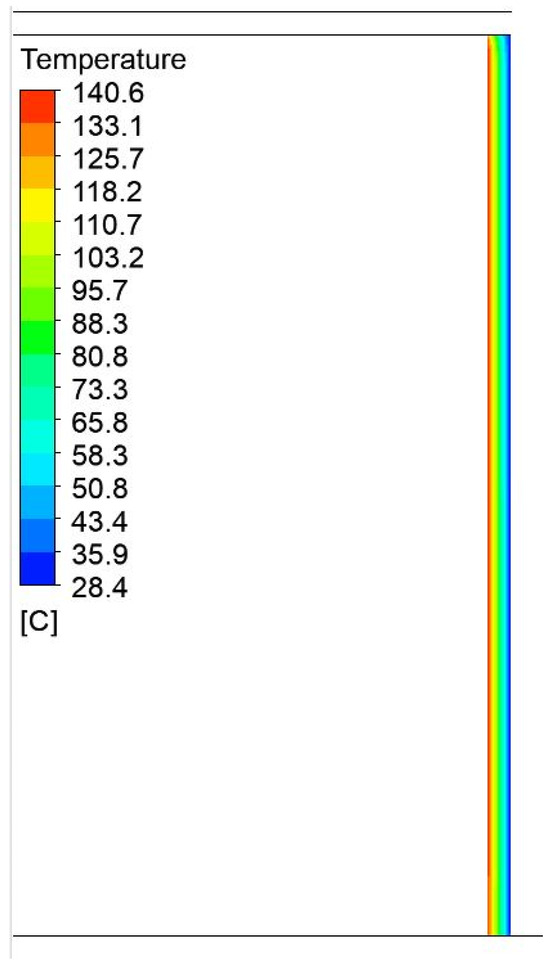
Figure 22.
Temperature field distribution in the insulation on the side of the press with a width of 1750 mm and a height of 1200 mm.

Figure 23.
Temperature field distribution in the steel plate on the side of the press with a width of 1750 mm and a height of 1200 mm.
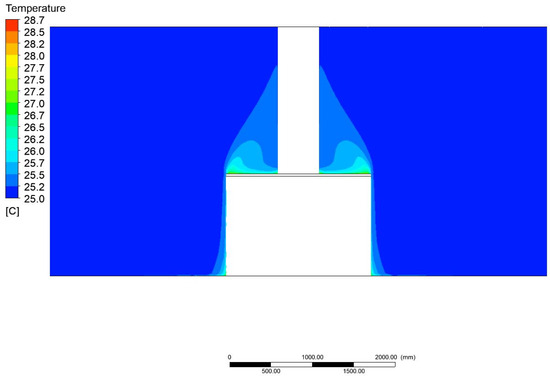
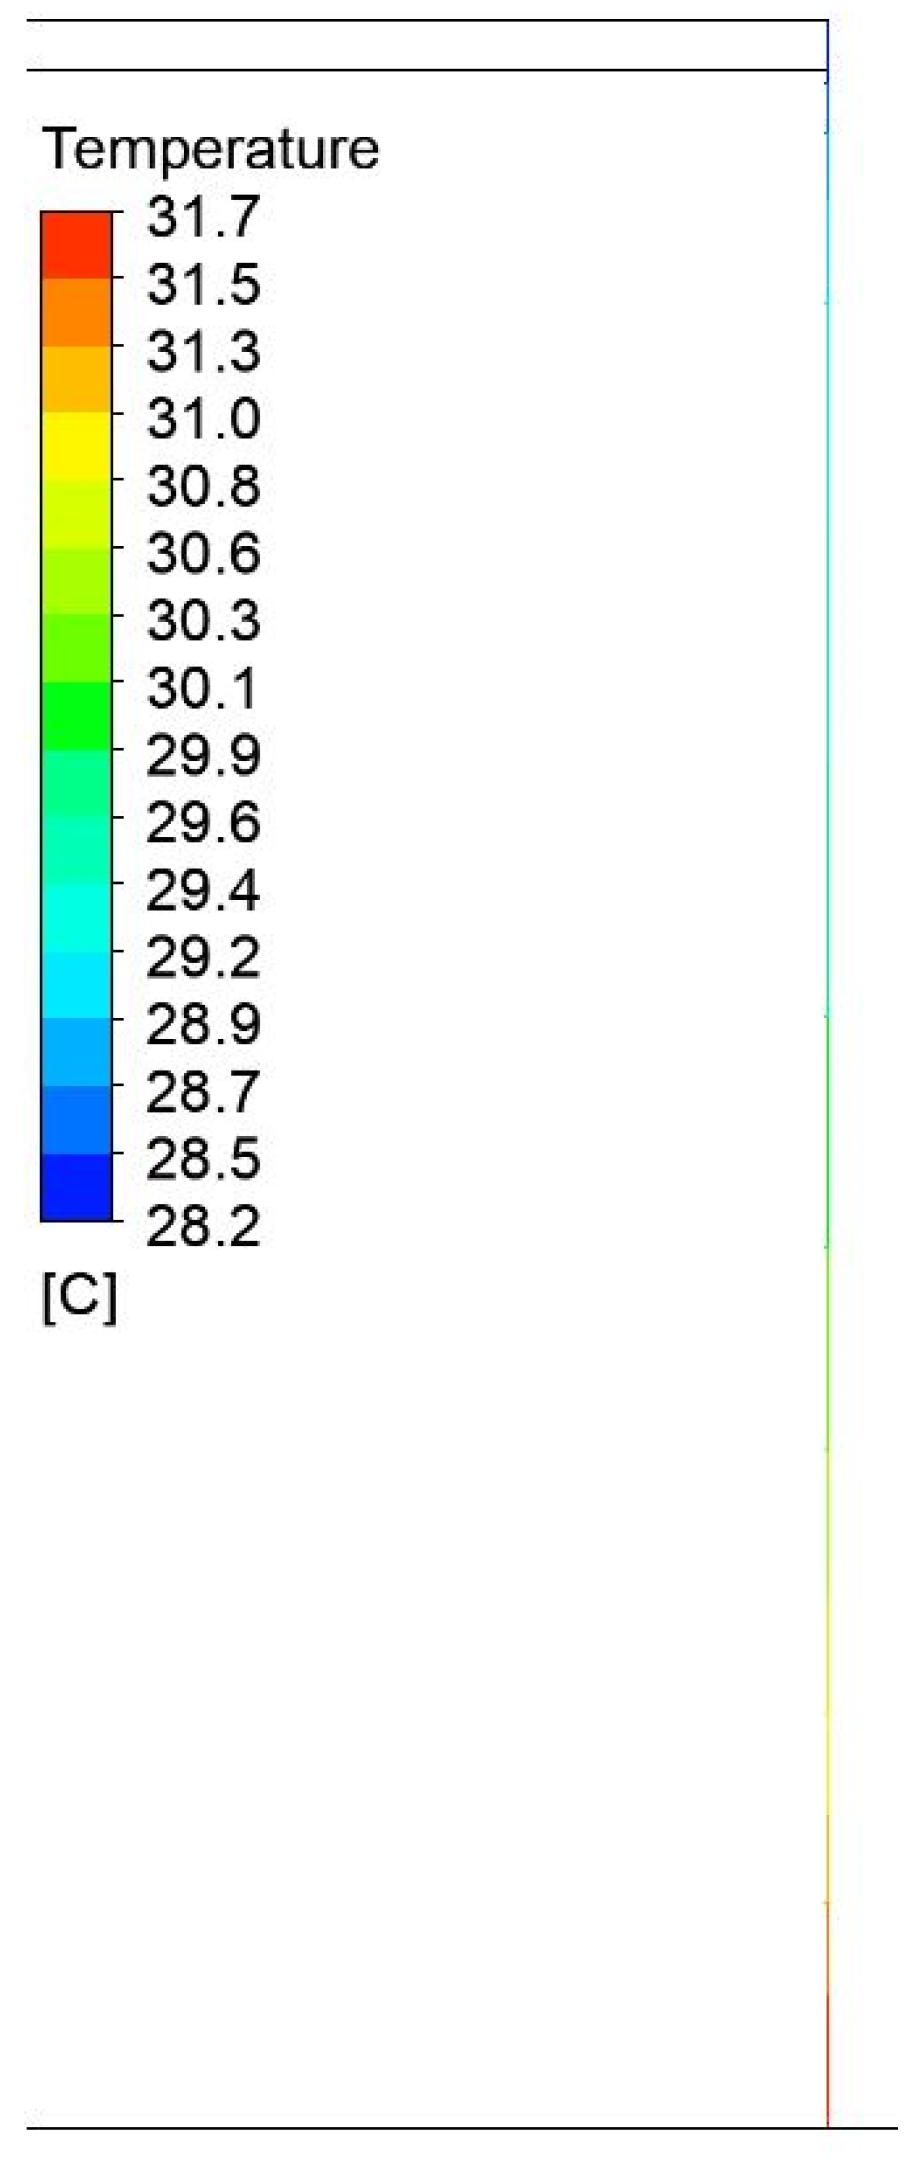
Figure 24.
Temperature field distribution to ambient with a width of 1750 mm and a height of 1200 mm.
Detailed representations of the temperature profiles for variant 2. have been plotted on the graphs of the temperature profiles in the construction and are shown in Figure 25, Figure 26 and Figure 27.
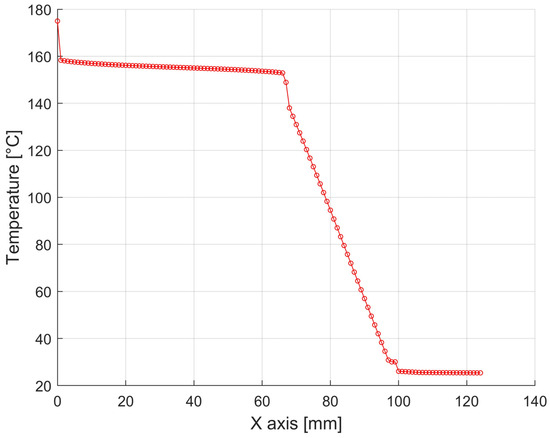
Figure 25.
Temperature distributions through the different wall structures of the press housing with a width of 1750 mm and a height of 1200 mm in the direction from the container wall to the ambient air in the horizontal direction. (In Figure 15, the position in green).
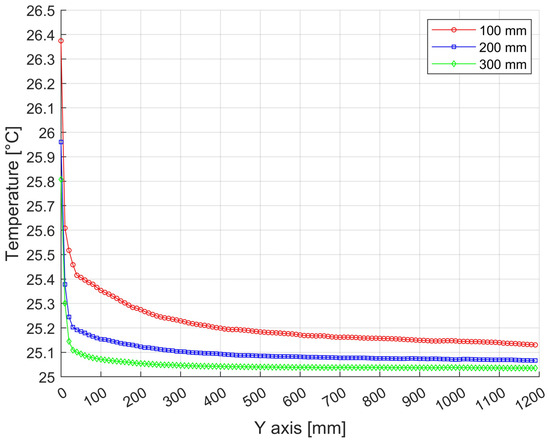
Figure 26.
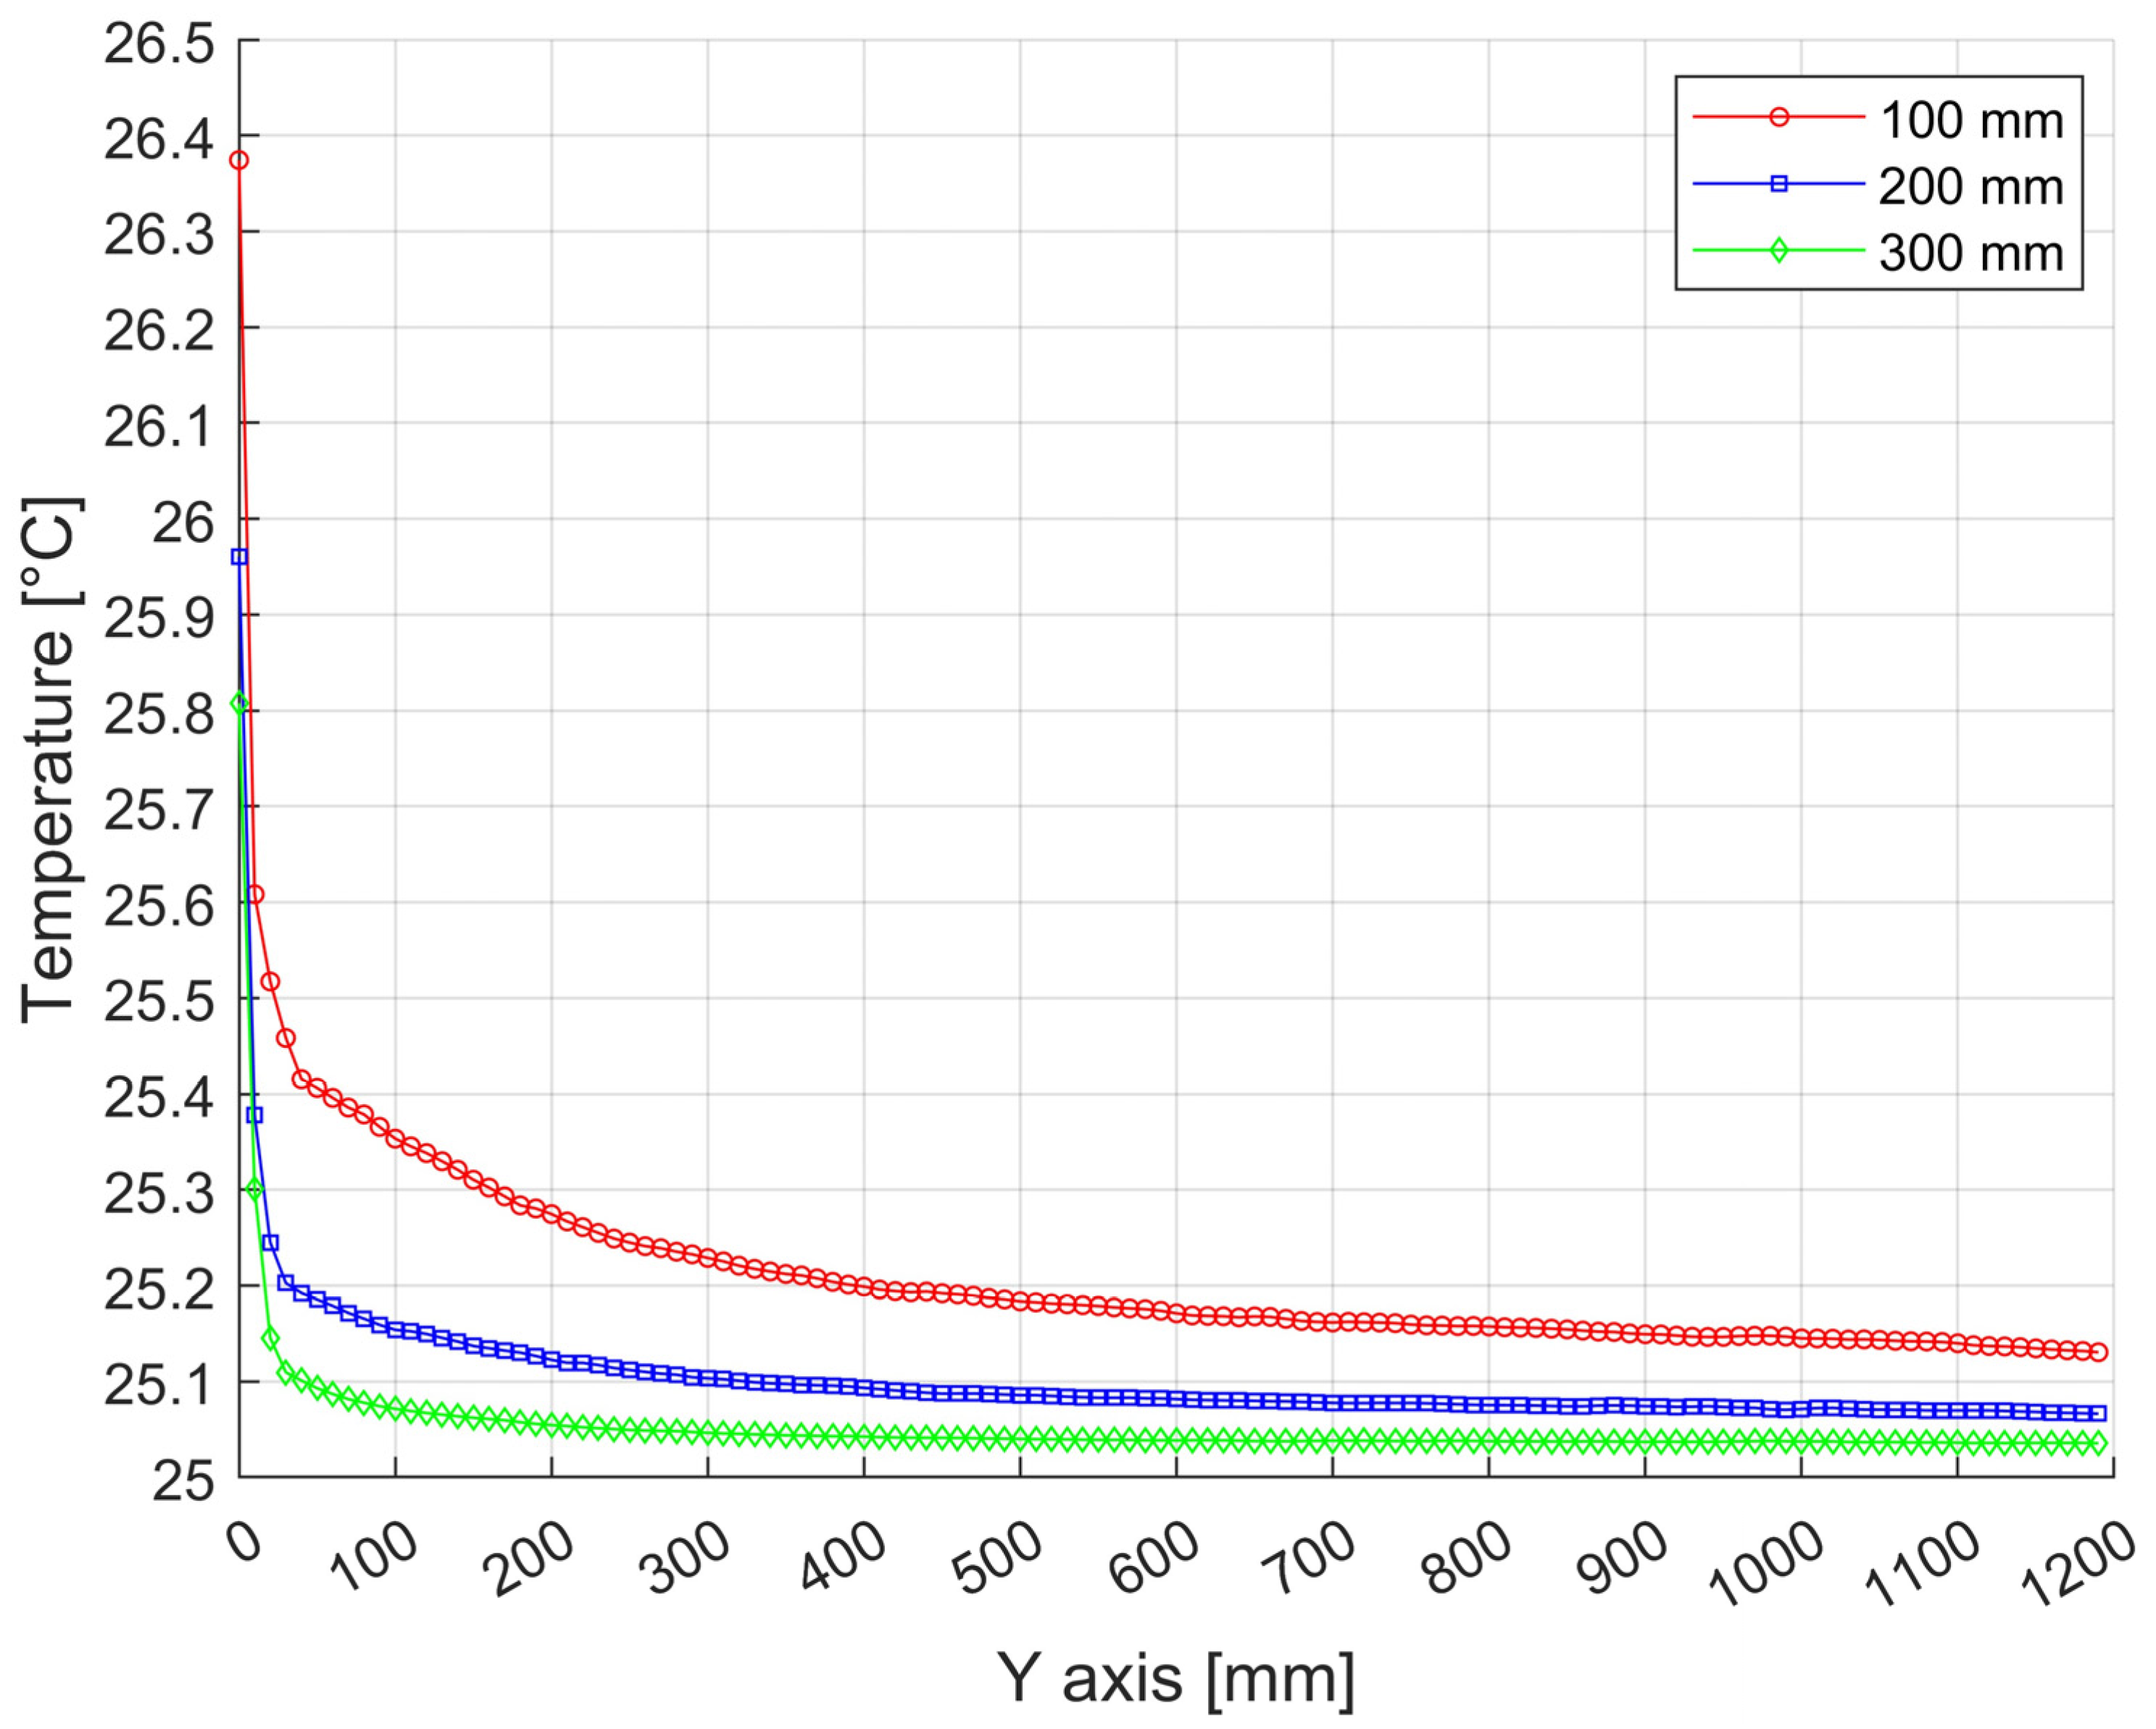
Temperature distributions along the height of the press with a width of 1750 mm and a height of 1200 mm from bottom to top at 100 mm spacing near the vertical wall. (In Figure 15, the position is shown in yellow).
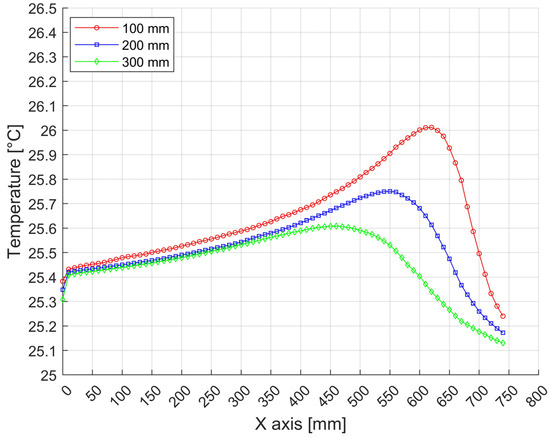
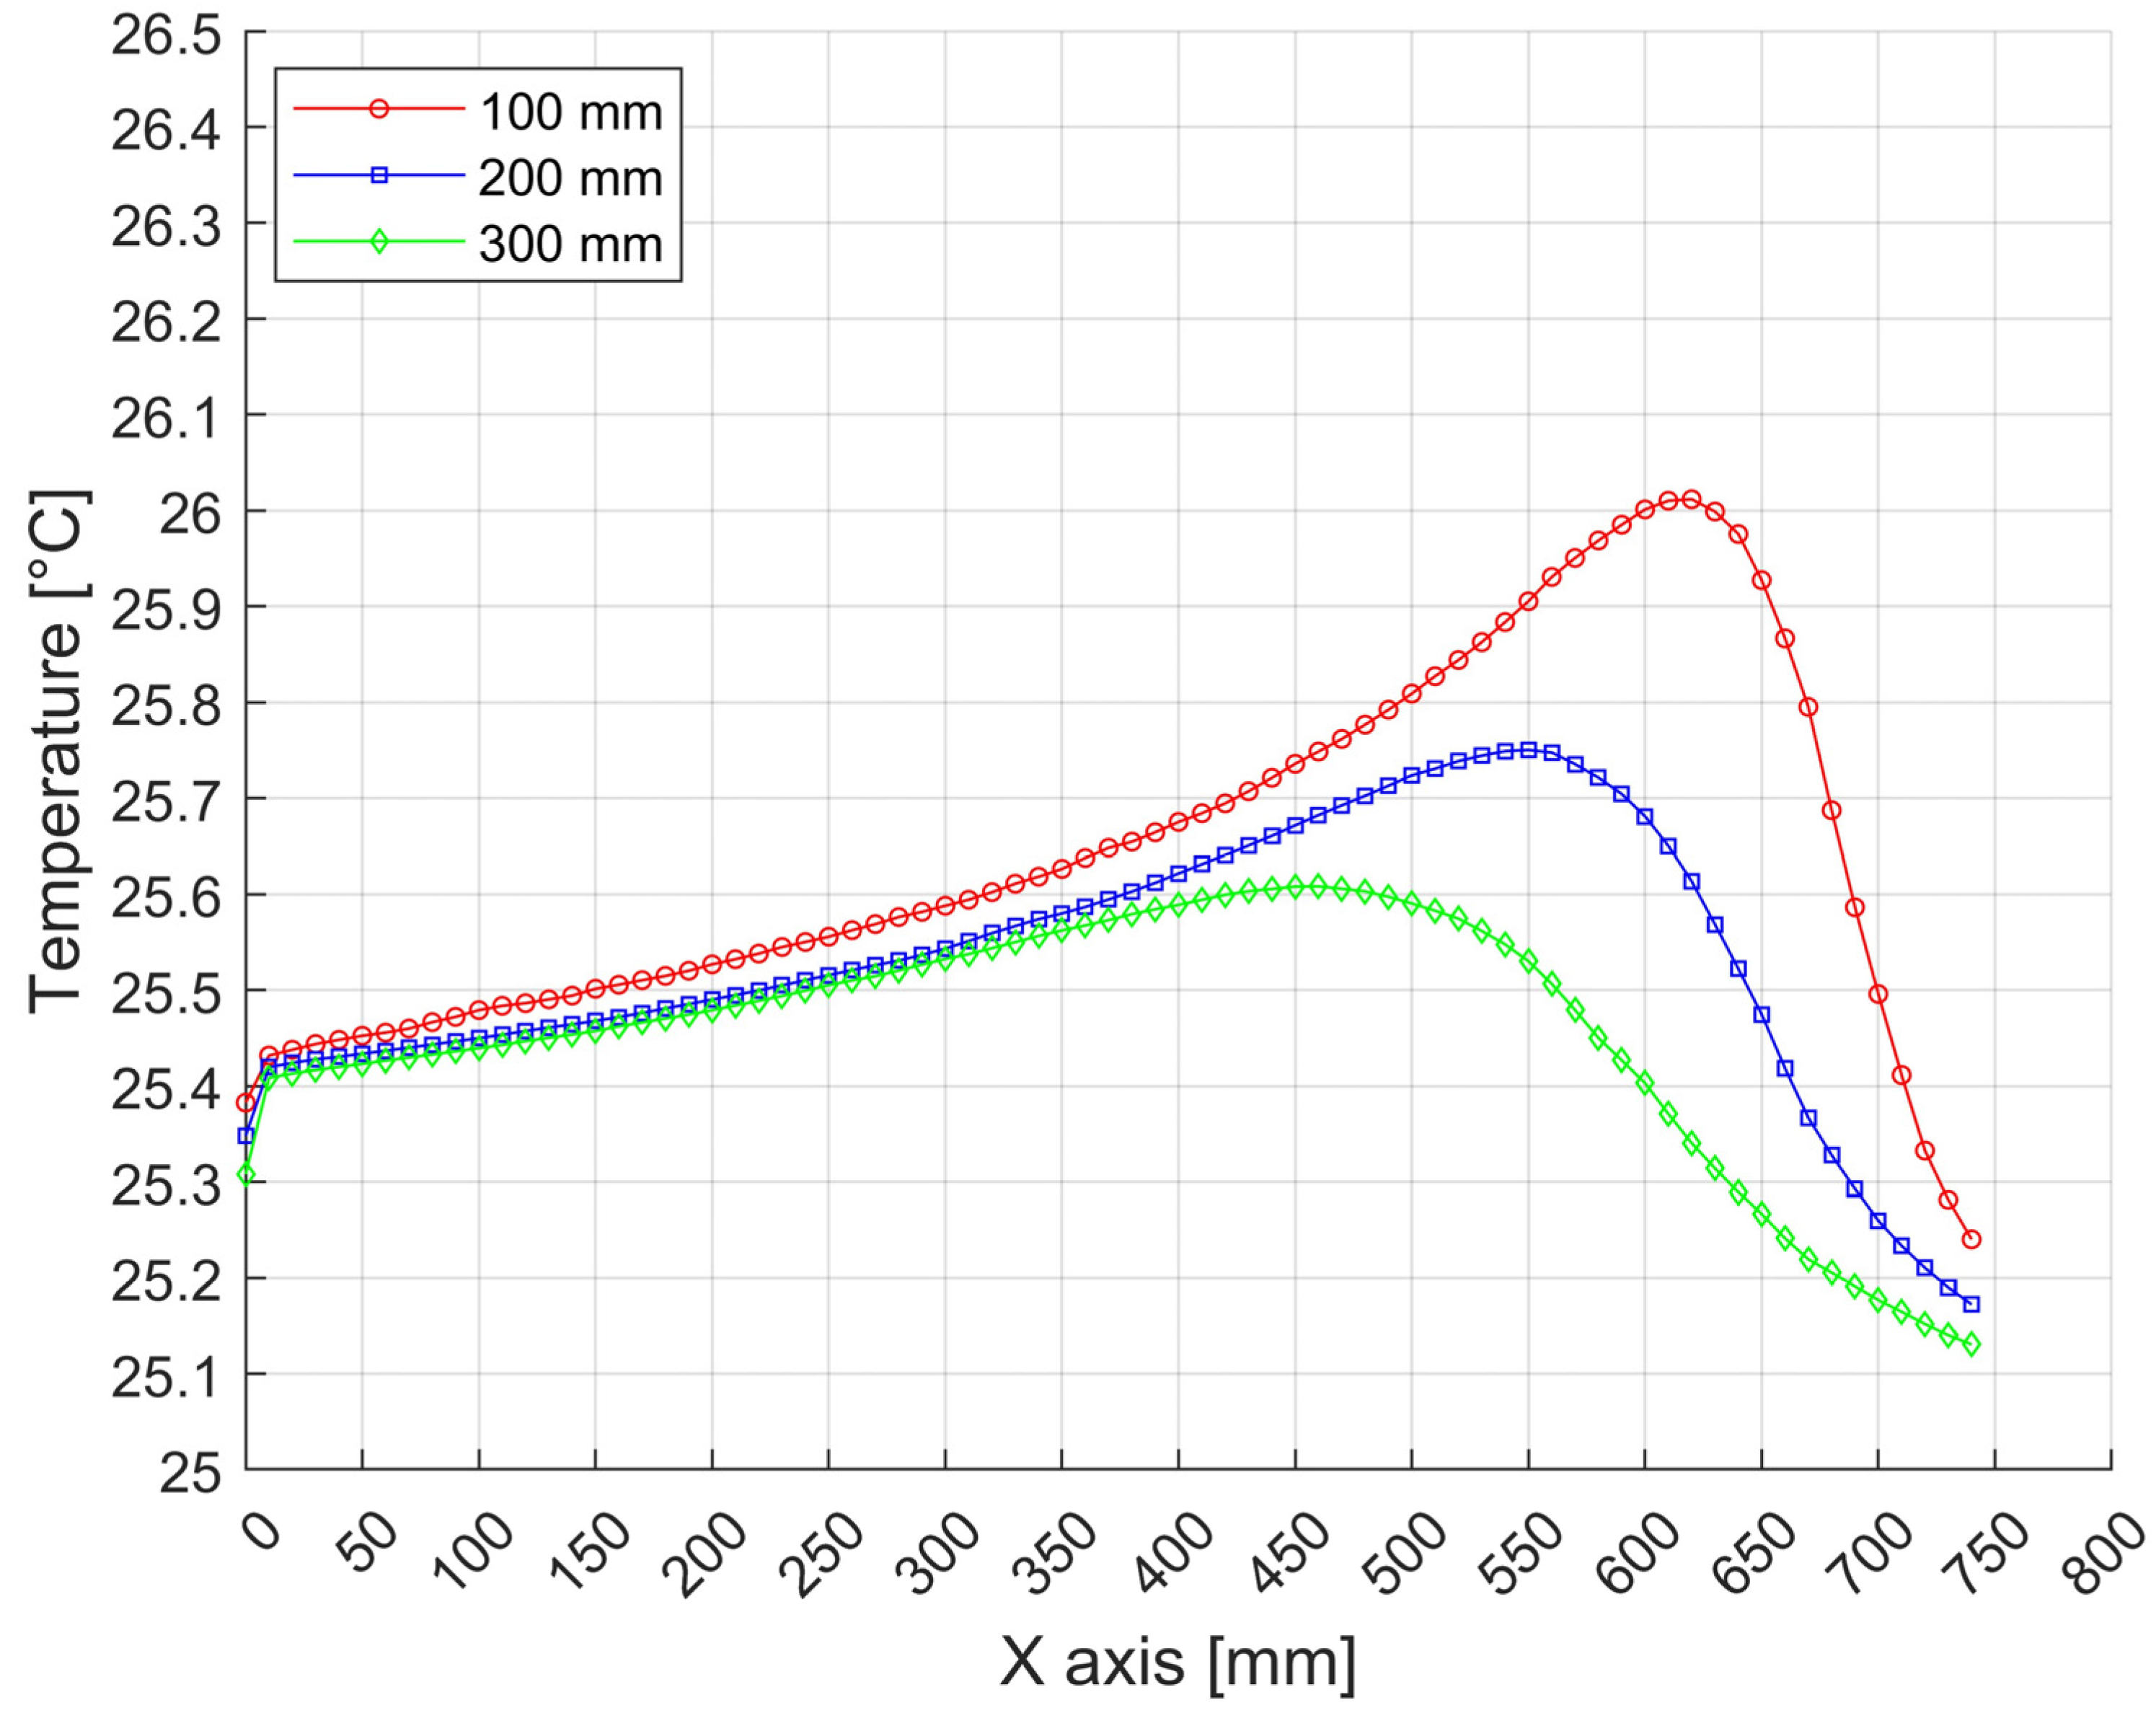
Figure 27.
Temperature distributions over a press with a width of 1750 mm and a height of 1200 mm in levels of 100 mm at 100 mm intervals (in Figure 15, the position shown in red).
CFD numerical simulation results for the tire vulcanization press for Variant 2 with a width of 1750 mm and a height of 1200 mm.
4. Results
The results from the analytical model presented in the previous sections were used to create energy balances. The energy balance of the tire vulcanization technology was carried out by comparing the heat consumption for heating the tire (from 25 °C to 175 °C) and the heat lost during vulcanization. Data used for energy balance calculations are shown in Table 5.
Table 5.
Input and comparison parameters for the energy balance.
The results of the energy balance calculations depending on the thickness of the insulation are shown in Table 6 and Table 7.
Table 6.
Calculate the heat loss and total heat consumption (heating + loss) and compare the proportion of heat loss as a function of insulation thickness for a passenger tire.
Table 7.
Calculate heat loss and total heat consumption and compare the proportion of heat loss as a function of insulation thickness for a truck tire.
The results of the calculations of the dependence of heat loss on the external temperature of the container surface are shown in Table 8 and Table 9.
Table 8.
Calculate heat loss and total heat consumption (heating + loss) and compare the proportion of lost heat as a function of the external temperature of the container housing for passenger pneumatics. 1200/750.
Table 9.
Calculate loss heat and total heat consumption (heating + loss) and compare post-loss heat as a function of the external temperature of the container housing for cargo tire-matics. 1750/1200.
5. Discussion
The global and European tire production industry continues to expand, leading to an increasing demand for accurate evaluation of the energy intensity associated with tire manufacturing. Tire vulcanization is a highly energy-demand process, necessitating a methodology for assessing its energy intensity that is simple, repeatable, and directly applicable in standard industrial operations. Heat transfer from the process to the surrounding environment directly influences the surface temperature of the vulcanization container. This external temperature is an easily measurable parameter under normal operating conditions.
The developed analytical model, which quantifies vulcanization heat losses based on the container’s external temperature, is a practical and reliable tool for determining the energy intensity of the vulcanization process in tire manufacturing. This model and the numerical simulations conducted to enhance the understanding of heat transfer mechanisms provide a solid foundation for identifying critical areas of heat loss and selecting appropriate energy-saving measures.
This paper is based on a case study, and the manufacturer did not provide experimental results from operational measurements. Further research will investigate the experimental validation of the analytical and numerical models for various types and sizes of vulcanization presses. This will allow for a comprehensive assessment of the models’ accuracy regarding the size and type of the vulcanization press.
6. Conclusions
In this study, an analytical model was developed to evaluate heat losses in a vulcanization press. The container surface temperature was a reference parameter for calculating heat dissipation. The model accounts for heat transfer through convection, conduction, and radiation. It was applied to assess the impact of insulation thickness and aluminum foil usage on reducing heat flux from the vulcanization process during tire manufacturing. Two vulcanization container types were analyzed for passenger car and truck tire production. The analytical model results were used to evaluate the contribution of heat losses to the total energy consumption required for the vulcanization of a single tire.
The heat loss during vulcanization of a single-passenger car tire decreased from 18.9% to 4.87%, with an increase in insulation thickness from 5 mm to 40 mm. Similarly, the heat loss during vulcanization for a truck tire decreased from 29.94% to 8.60% with the same insulation thickness increase. Additionally, the heat loss during vulcanization of a single passenger car tire ranged from 5.11% to 51.56% as the container surface temperature increased from 30 °C to 100 °C, while for a truck tire, it increased from 6.71% to 58.5% under the same conditions.
A CFD simulation was conducted using ANSYS Fluent to understand heat transfer mechanisms better. The simulation examined heat flux through the container structure and its surrounding environment. Thermal field visualization provided a more transparent representation of heat distribution across the vulcanization press wall, highlighting critical areas of potential energy losses.
The developed analytical model is a valuable and practical tool for assessing the energy intensity of the vulcanization process in tire manufacturing. It is based on the external temperature, a parameter easily measured in industrial settings, making it a reliable method for evaluating energy intensity.
Author Contributions
Conceptualization, R.L. and M.M.; Data curation, K.K.; Formal analysis, K.K.; Methodology, R.L.; Software, R.L.; Supervision, M.M.; Validation, A.M.; Visualization, A.M.; Writing—original draft, R.L. All authors have read and agreed to the published version of the manuscript.
Funding
The work was created with the support of the project KEGA 047ŽU-4/2022 Innovative Approaches to Modelling Fluid Dynamics in Energy Systems, VEGA 1/0670/23 Research on Performance Parameters of Heat Transfer in the Cooling and Heating of Metal Hydride Alloys in Hydrogen Storage Tanks Using Phase Change Materials and VEGA 1/0680/23 Investigation of transfer properties of loop heat pipe in increasing thermal efficiency of heat sources by using waste heat of flue gases.
Data Availability Statement
The original contributions presented in this study are included in the article. Further inquiries can be directed to the corresponding author.
Conflicts of Interest
The authors declare no conflicts of interest.
Nomenclature
| m | Insulation thickness in m | |
| m | Outer diameter of insulation in m | |
| m | Inner diameter of insulation in m | |
| m | Air gap width in m | |
| m2 | Vertical wall area | |
| K | Container wall temperature in K | |
| K | Ambient temperature in K | |
| W/m2·K4 | Stefan-Boltzmann constant | |
| K | Initial iteration temperature Tsi(K) = corrected temperature | |
| °C | Initial iteration temperature tsi(°C) | |
| W/m2 | Radiative heat flux density | |
| °C | The mean temperature between tw and tsi v °C | |
| K | The mean temperature between Tw and Tsi v K | |
| 1/K | Coefficient of volumetric expansion of air | |
| kg/m3 | Density of air at mean temperature in the cavity | |
| J/kg·K | Specific heat capacity of air | |
| W/m·K | Coefficient of thermal conductivity of air | |
| kg/m.s | Dynamic viscosity of air | |
| m2/s | Kinematic viscosity of air | |
| m2/s | Thermal conductivity of air | |
| - | Rayleigh number | |
| Gap height/width ratio | ||
| Fulfilment of the Nusselt condition | ||
| - | Prandtl number | |
| - | Nusselt criterion | |
| W/m2·K | Heat transfer coefficient | |
| W/m2·K | Heat flux density by convection through the cavity | |
| Total heat flux through the cavity | ||
| W/m2·K | Initial value of the coefficient of heat transfer to the outside wall | |
| Thermal resistance of insulation and sheet metal | ||
| W/m2 | Heat flux density by conduction in the insulation and in the sheet | |
| K | Temperature of the vertical sheet metal wall in K | |
| °C | Vertical sheet metal wall temperature in °C | |
| 1/K | Coefficient of volumetric expansion of air | |
| kg/m3 | Air density at external wall temperature | |
| J/kg·K | Specific heat capacity of air | |
| W/m·K | Coefficient of thermal conductivity of air | |
| kg/m.s | Dynamic viscosity of air | |
| m2/s | Kinematic viscosity of air | |
| m2/s | Thermal conductivity of air | |
| - | Rayleigh number | |
| - | Prandtl number | |
| - | Nusselt criterion | |
| W/m2·K | Heat transfer coefficient of the outside sheet metal wall | |
| Difference of heat flux densities in the cavity and in the insulation | ||
| K | Temperature correction | |
| K | Corrected temperature | |
| W | Heat flux through the vertical wall | |
| W/m2 | Heat flux density through the horizontal wall | |
| m2 | Horizontal wall area | |
| W | Heat flux through the horizontal wall | |
| W | Total heat flux from the container |
References
- eur-lex.europa. Available online: https://eur-lex.europa.eu/legal-content/EN/TXT/PDF/?uri=CELEX:32023L1791 (accessed on 12 February 2024).
- vti.diva-portal. Available online: https://vti.diva-portal.org/smash/get/diva2:1611409/FULLTEXT01.pdf (accessed on 12 February 2024).
- Saidur, R.; Mekhilef, S. Energy use, energy savings and emission analysis in the Malaysian rubber producing industries. Appl. Energy 2010, 87, 2746–2758. [Google Scholar] [CrossRef]
- Tsai, W.-H. Carbon taxes and carbon right costs analysis for the tire industry. Energies 2018, 11, 2121. [Google Scholar] [CrossRef]
- Taušová, M.; Domaracká, L.; Čulková, K.; Tauš, P.; Kaňuch, P. Development of Energy Poverty and Its Solutions through the Use of Renewables: The EU Case with a Focus on Slovakia. Energies 2024, 17, 3762. [Google Scholar] [CrossRef]
- Gudadhe, M.; Lohakare, P.; Meshram, M.; Padole, A. Energy analysis in tire manufacturing Industries. Int. J. Mech. Eng. Technol. 2015, 6, 112–119. [Google Scholar]
- Krishnan, A.; Francis, R.M.; Rahul Raj, K.R.; Thomas, N.; Muhammed Sadique, V.K.; Sriram, A. Energy Audit: A Case Study of Tyre Retreading Unit in Kerala; Springer: Singapore, 2020; pp. 251–261. [Google Scholar]
- Chikri, Y.A.; Wetzels, W. Decarbonisation Options for the Dutch Tyre Industry; PBL: The Hague, The Netherlands, 2019; Available online: https://www.pbl.nl/uploads/default/downloads/pbl-2019-decarbonisation-options-for-the-dutch-tyre-industry_3819.pdf (accessed on 12 February 2024).
- Mitsubishi Heavy Industries Technical Review Vol. 46 No. 4. Available online: https://www.mhi.co.jp/technology/review/pdf/e474/e474025.pdf (accessed on 2 December 2024).
- european-rubber-journal. Future Tire Profiles—Uzer Makina. Available online: www.european-rubber-journal.com/article/2064958/future-tire-profiles-uzer-makina (accessed on 10 October 2023).
- Stankevičiūté, L. Energy Use and Energy Management in Tyre Manufacturing: The Trelleborg 1 Case. Master’s Thesis, Lund University, Lund, Sweden, 2000. [Google Scholar]
- Uo, J.; Li, H.; Yang, H.; Zhang, S. A collaborative detection approach for internal steam leakage of tyre vulcanization workshop with artificial immune algorithm. Comput. Appl. Math. 2018, 37, 4219–4236. [Google Scholar] [CrossRef]
- Pentakota, L.K.; Albertelli, P.; Strano, M. Energy Efficiency of the Vulcanization Process of a Bicycle Tyre. Int. J. Precis. Eng. Manuf.-Green Tech. 2023, 10, 979–998. [Google Scholar] [CrossRef]
- David, P.D.; Theodore, L.B.; Adrienne, S.L. Fundamentals of Heat and Mass Transfer, 6th ed.; Frank, P.I., Ed.; John Wiley & Sons: Hoboken, NJ, USA, 2007; ISBN 978-0471457282. [Google Scholar]
- Chen, T.S.; Tien, H.C.; Armaly, B.F. Natural convection on horizontal, inclined and vertical plates with variable surface temperature or heat flux. Int. J. Heat Mass Transf. 1986, 29, 1465–1478. [Google Scholar]
- Maluta, F.; Paglianti, A.; Montante, G. A PBM-Based Procedure for the CFD Simulation of Gas–Liquid Mixing with Compact Inline Static Mixers in Pipelines. Processes 2023, 11, 198. [Google Scholar] [CrossRef]
- Mao, Z.; Chen, Y.; Wang, W.; Cai, Q.; Yuan, X.; Zhou, J.; Du, X.; Zhang, B.; Zhang, Y.; Xiao, R. CFD Calculation of Natural Convection Heat Transmission in a Three-Dimensional Pool with Hemispherical Lower Head. Energies 2024, 17, 3113. [Google Scholar] [CrossRef]
- Bhowmick, S.; Roy, L.R.; Xu, F.; Saha, S.C. Natural Convection Fluid Flow and Heat Transfer in a Valley-Shaped Cavity. Computation 2024, 12, 146. [Google Scholar] [CrossRef]


Disclaimer/Publisher’s Note: The statements, opinions and data contained in all publications are solely those of the individual author(s) and contributor(s) and not of MDPI and/or the editor(s). MDPI and/or the editor(s) disclaim responsibility for any injury to people or property resulting from any ideas, methods, instructions or products referred to in the content. |
© 2025 by the authors. Licensee MDPI, Basel, Switzerland. This article is an open access article distributed under the terms and conditions of the Creative Commons Attribution (CC BY) license (https://creativecommons.org/licenses/by/4.0/).