Abstract
Accurate simulation and assimilation of CO2 concentrations are of great significance for global carbon cycle research, carbon emission monitoring, and climate policy formulation. In this study, we conducted simulation and assimilation of CO2 concentrations over central, eastern, and southern China from March to August 2020 using the WRF-Chem model (Weather Research and Forecasting model coupled with Chemistry) coupled with the Ensemble Adjustment Kalman Filter (EAKF) assimilation method. We designed four progressive experiments (CTRL, MET_DA, CO2_DA, and FULL_DA) to evaluate the impacts of assimilating meteorological observations and multi-satellite fused XCO2 concentrations on CO2 simulation performance. Compared to the CTRL simulation, the MET_DA experiment shows that the correlation coefficients (R) for meteorological elements, including wind speed, temperature, and relative humidity, improved by approximately 9.68%, 2.03%, and 16.05%, respectively. The CO2_DA experiment showed improved accuracy in CO2 concentration simulation. The validation against WDCGG (World Data Centre for Greenhouse Gases) and TCCON (Total Carbon Column Observing Network) observations demonstrated that R increased to 0.970 and 0.830, respectively, with corresponding RMSEs reduced to 2.598 ppm and 2.042 ppm. Building upon the improvements of CO2_DA, the FULL_DA experiment achieved greater accuracy, with R reaching 0.972 and 0.875, and RMSE reduced to 2.309 ppm and 1.693 ppm, respectively. In addition, the bias was lowered by 46.74% and 77.58%. The results show that assimilation of both meteorological and multi-source fused XCO2 datasets achieves optimal performance in enhancing the accuracy of CO2 concentration simulations. This study employs an hourly, multi-source fused CO2 dataset that features an increased number of observations and greater spatial coverage. By assimilating this dataset, we achieve more accurate simulations of CO2 concentrations, thereby providing reliable support for carbon monitoring and emission estimation.
1. Introduction
As one of the world’s largest carbon emitters, China’s variations in atmospheric carbon dioxide (CO2) concentrations have a significant impact on both regional and global climate change [1]. In recent years, with the rapid advancement of industrialization and urbanization, China’s CO2 emissions have exhibited pronounced spatial and temporal heterogeneity. At the same time, meteorological factors—such as temperature, precipitation, wind speed, and planetary boundary layer height—have profoundly influenced the processes of CO2 dispersion, uptake, and redistribution [2]. To address these challenges, China has introduced a series of key policies aimed at carbon reduction and climate governance. As early as 2021, the Ministry of Ecology and Environment had launched the Pilot Program for Carbon Monitoring and Assessment, which initiated coordinated monitoring of CO2 and CH4 in 16 major cities [3]. To improve the national monitoring framework, the plan aims to establish a multi-scale, multi-parameter observation network covering the entire country by 2025. At the strategic level, China has set clear climate targets of peaking carbon emissions before 2030 and achieving carbon neutrality before 2060. These goals have been reinforced by the 14th Five-Year Plan for Climate Change Mitigation, which emphasizes the enhancement of greenhouse gas monitoring capabilities and the integration of multi-source data [4].
Currently, CO2 concentration monitoring in China relies on a multi-component framework that integrates ground-based observations [5,6], remote sensing techniques [7,8,9], and numerical simulations [10,11,12,13]. Ground remote sensing-based measurements provide high-precision point data but are limited in spatial coverage. Remote sensing enables large-scale monitoring, but its accuracy can be affected by atmospheric conditions such as cloud cover and aerosols. In contrast, atmospheric chemical models have gained widespread use due to their spatiotemporal continuity and robust representation of physical and chemical processes. These models can effectively compensate for gaps and uncertainties in observational data. However, model outputs are highly dependent on the accuracy of initial conditions and emission inventories. Without adequate observational data for assimilation, systematic biases may occur in the simulations. Therefore, the optimal integration of multi-source observations with numerical models has become a critical scientific challenge for improving the accuracy of meteorological variables and CO2 concentration simulations.
Current mainstream data assimilation techniques can be broadly categorized into two major frameworks: variational assimilation and ensemble-based filtering. Representative methods include three-dimensional variational assimilation (3D-VAR) [14,15], four-dimensional variational assimilation (4D-VAR) [16,17], the Ensemble Kalman Filter (EnKF) [18,19,20], and the Ensemble Adjustment Kalman Filter (EAKF) [21,22]. These methods are fundamentally based on the theory of optimal estimation, with the core objective of optimally combining observational data and model background fields to generate a more accurate analysis field. In variational assimilation, the optimal analysis is obtained by constructing and minimizing a cost function. This function typically consists of two key components: the background term, which quantifies the deviation between the analysis and the background field, and the observation term, which reflects the consistency between the analysis and the observations [23]. By adjusting the relative weights of these two components, an optimal analysis can be derived. The 3D-VAR method uses a static background error covariance matrix, usually derived from historical climatological statistics [24]. While computationally efficient, its fixed error covariance structure makes it difficult to accurately capture the spatial and temporal variability of the actual atmosphere. The 4D-VAR approach extends 3D-VAR by incorporating the temporal dimension and employing an adjoint model to assimilate observations over a defined time window [25]. This enables a more accurate depiction of the dynamic evolution of atmospheric systems, but at the cost of increased computational complexity due to the need to construct and run the adjoint model.
Research on carbon dioxide data assimilation began with optimizing model parameters and fluxes. Koffi et al. [26] pioneered the use of the CCDAS system to evaluate the constraints of different observations on BETHY model parameters, finding that flux observations were more effective than high-frequency concentration observations in optimizing key parameters such as GPP, and advocating a combined use of concentration and flux observations. Tian et al. [27] proposed the groundbreaking joint assimilation framework TanTracker, which simultaneously optimizes 3D CO2 concentrations and surface fluxes based on PODEn4DVar, reducing reliance on the assumption of a perfect transport model, and demonstrated significant advantages through validation with GOSAT data. Huang et al. [28] established the EnKF-CMAQ regional system based on EnKF, utilizing East Asian ground observations to highlight the role of wind transport; Peng et al. [29] further developed CFI-CMAQ, introducing EnKS to achieve grid-scale flux inversion. Deng et al. [30] constructed an LPDM high-resolution inversion system, focusing on improving transport errors through meteorological assimilation; He et al. [31] developed CTDAS-Lagrange, coupling a global framework with a regional Lagrangian model to optimize fluxes and boundary conditions. In recent years, Hu et al. [32] improved the respiration flux parameterization in WRF-VPRM, enhancing CO2 simulation capability under extreme weather conditions; Ho et al. [33] optimized the coupling strategy between WRF-GHG and ERA5 to reduce transport errors; Peng et al. [34] achieved direct assimilation of eddy covariance flux observations into the EnSRF framework, outperforming concentration assimilation in regional-scale growing season flux estimates and promoting the integrated development of multi-source observation direct assimilation.
Compared with traditional variational assimilation methods, which are constrained by static background field assumptions and fixed observational weights, filtering-based assimilation demonstrates significant advantages in atmospheric assimilation under complex meteorological conditions. These advantages stem from its dynamic error covariance estimation and adaptive observation integration capabilities [35]. In recent years, with the development of advanced data assimilation techniques such as EnKF and EAKF, an increasing number of researchers have applied these methods innovatively to the joint simulation of meteorological variables and atmospheric CO2 concentrations [29,36,37]. In the field of meteorological research, Lei et al. [38] coupled EnKF with the WRF model to conduct forecasting experiments on a typhoon in the northwest Pacific in 2016. Their results indicated that the WRF/EnKF system outperformed both the NCEP and ECMWF systems in typhoon prediction. George et al. [39] applied the WRF-DART/EnKF system to study the heavy rainfall event that happened over Chennai city in India, demonstrating the superiority of the method in precipitation forecasting and analyzing the impact of model parameters. Yang et al. [40] systematically evaluated the performance of EnKF assimilation in the WRF model during January and July 2016 over East Asia. The results showed that EnKF exhibits strong seasonal adaptability under complex weather systems in the region, particularly during the convectively active summer period. Sun et al. [41] employed the EAKF algorithm in a WRF-DART coupled system to assimilate multi-source ocean observations and assess the influence of data assimilation on air–sea interactions in the Red Sea. In the study of CO2 concentrations, Seo et al. [42] used the WRF-Chem/DART coupled system with the EAKF algorithm to assimilate and simulate atmospheric CO2 concentrations over East Asia in January (winter) and July (summer) of 2019, providing a detailed analysis of seasonal spatiotemporal CO2 distribution characteristics. Zhang et al. [43] built a high-resolution atmospheric transport model using the WRF-Chem/DART system and assimilated OCO-2 satellite XCO2 observations with EAKF, quantitatively evaluating the improvement in CO2 simulation accuracy over the Midwestern United States. Jin et al. [44], in response to the increasing frequency of wildfires under global climate change, developed an innovative technique for estimating wildfire CO2 emissions by integrating OCO-2 XCO2 retrievals with the WRF-Chem/DART system using EAKF-based assimilation. Zhang et al. [45] developed the Global Carbon Assimilation System (GCAS-EK) based on the EnKF algorithm, which assimilates multi-platform atmospheric CO2 observations into an ecosystem model, achieving joint optimization of surface carbon fluxes and atmospheric CO2 concentration fields and significantly improving the accuracy of key global carbon cycle parameters. Huang et al. [28] addressed regional-scale CO2 simulation by establishing a RAMS-CMAQ coupled system within an EnKF assimilation framework. By assimilating high-density ground-based CO2 observations over East Asia, they systematically validated the performance of the regional system in carbon flux inversion and CO2 concentration field simulation. Building upon the framework established by Zhang et al. [43], Jin et al. [46] coupled OCO-2 satellite observation data with the WRF-Chem/DART atmospheric transport model to perform assimilation and inversion of CO2 concentrations and fluxes in Lisbon, Portugal. These research advances not only demonstrate the unique advantages of filtering-based assimilation methods in handling nonlinear atmospheric chemical processes but also provide essential technical support for the development of high-precision carbon monitoring and early warning systems.
However, most existing studies have employed low spatial resolutions (>50 km) modeling frameworks [47]. Moreover, the assimilation process predominantly relies on monthly averaged observational data from a single satellite source [46]. Owing to the scarcity of available data, such studies are unable to achieve assimilation analysis at hourly temporal resolution. In addition, the density of carbon monitoring stations in China is significantly lower than that in developed countries such as the United States, Europe, and Japan. The severe lack of observational data has introduced limitations in the application of CO2 concentration simulation and assimilation systems over China. This study innovatively incorporates multi-source satellite fusion observational data at 6 h intervals and assimilates them into the WRF-Chem/DART model, effectively addressing the issue of limited simulation accuracy caused by insufficient single-source satellite observations. This approach enhances the synergistic integration between the model and carbon satellite data, improving the accuracy and reliability of the simulation results.
In this study, we conducted a comprehensive simulation and assimilation of CO2 concentrations over China from March to August 2020, using the WRF-Chem model coupled with the EAKF method. Four comparative experiments were designed to assimilate different combinations of meteorological observations and a multi-source satellite-fused CO2 concentration dataset into the WRF-Chem model. It aims to improve the accuracy of carbon assimilation by assimilating a multi-source satellite-fused dataset, which increases the number of observations, spatial coverage, and accuracy of hourly CO2 concentration compared to the single satellite product, and to assess the individual and combined contributions of meteorological and CO2 concentrations through a novel design of progressive experiments. The processes of assimilation provide a reference for developing a more accurate regional carbon assimilation system over China.
2. Materials and Methods
2.1. Study Area
The study area, delineated by the red box in Figure 1, covers central, eastern, and southern China, spanning from 20° N to 41° N and 99° E to 121° E. This area includes economically developed regions such as the Yangtze River Delta and the Beijing-Tianjin-Hebei region, which are core zones of energy consumption and carbon emissions in China. Analyzing the spatiotemporal distribution characteristics of CO2 concentrations in this region helps to reveal the mechanisms through which human activities affect the carbon cycle and to assess the spatial and temporal patterns of regional carbon emissions.
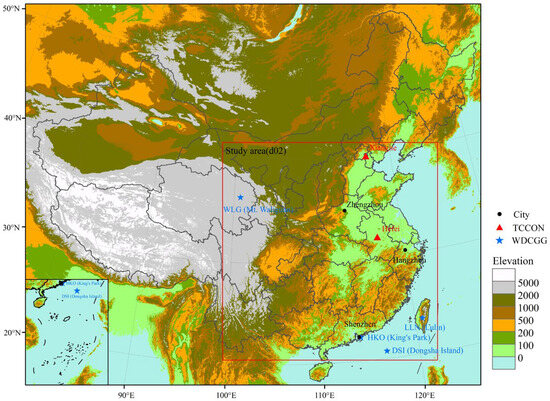
Figure 1.
WRF-Chem simulation domain of the study area.
2.2. Data
2.2.1. Input Data for WRF-Chem
In this study, the WRF-Chem model was employed for numerical simulations, with four primary categories of input data: meteorological forcing fields, CO2 emission inventories, initial conditions, and boundary conditions.
Meteorological data were obtained from the Final Operational Global Analysis (FNL) dataset released by the National Centers for Environmental Prediction (NCEP), with a spatial resolution of 1° × 1° and a temporal resolution of 6 h. This dataset provides key meteorological variables such as temperature and humidity. The FNL data were obtained from https://gdex.ucar.edu/datasets/d083002/ (accessed on 15 October 2025).
Anthropogenic emissions were derived from the Multi-resolution Emission Inventory model for Climate and air pollution research (MEIC) developed by Tsinghua University, with a spatial resolution of 0.25° × 0.25° and a temporal resolution on a monthly scale. This inventory was specifically designed based on domestic emission characteristics and accurately represents the spatiotemporal distribution of regional CO2 emissions. The MEIC inventory was retrieved from http://meicmodel.org.cn/ (accessed on 15 October 2025).
The oceanic CO2 emission fluxes were derived from the Japan Meteorological Agency (JMA) Ocean Map, which provides high-resolution, data-constrained estimates of air–sea CO2 exchange. Specifically, the regional version of the dataset was used, offering a fine spatial resolution of 0.25° × 0.25° over the western North Pacific. The JMA data were collected from https://www.data.jma.go.jp/kaiyou/english/co2_flux/co2_flux_data_en.html (accessed on 15 October 2025).
Biogenic fluxes were calculated using the Vegetation Photosynthesis and Respiration Model (VPRM) [48], which dynamically simulates carbon exchange processes for various vegetation types by integrating MODIS-derived vegetation indices and meteorological parameters. Key inputs include the enhanced vegetation index (EVI), land surface water index (LSWI), 2 m air temperature (T), and downward shortwave radiation. The model outputs gross ecosystem exchange (GEE) and ecosystem respiration (ER). The specific calculation is as follows [12]:
where α, β, and λ denote vegetation-specific empirical coefficients; PAR0 is the vegetation-dependent half-saturation value of photosynthetically active radiation (PAR); and , and are scaling factors for temperature, water stress, and phenology, respectively.
Initial and boundary conditions were provided by the Carbon Tracker 2022 product released by the National Oceanic and Atmospheric Administration (NOAA), with a temporal resolution of 3 h and a spatial resolution of 3° × 2°. This dataset combines ground-based observations with satellite-derived inversion data. The Carbon Tracker data were downloaded from http://carbontracker.noaa.gov/ (accessed on 15 October 2025).
2.2.2. Observations for Meteorological Data Assimilation
Meteorological data assimilation in this study utilized the NCEP ADP Global Upper Air and Surface Weather Observations dataset. This dataset is stored in PREPBUFR binary format and integrates multi-source observations from the Global Telecommunications System (GTS). It primarily includes three categories of observational sources:
Conventional observations: These include data from surface stations (SYNOP/METAR), ships and buoys, radiosondes (SONDE), aircraft reports (AIREP), and wind profilers.
Active remote sensing data: Sea surface wind observations from the QuikSCAT satellite, which provides all-weather measurement capabilities.
Passive remote sensing data: Satellite-derived wind data (SATOB), mainly retrieved from polar-orbiting and geostationary meteorological satellites using infrared, visible, and water vapor channels.
The observed meteorological variables include key parameters such as pressure, dew point temperature, geopotential height, surface winds, and upper-level temperature, humidity, and wind components. The PREPBUFR format retains comprehensive metadata regarding quality control procedures and background information, ensuring data reliability. Figure 2 illustrates the spatial distribution of observation stations at two representative times—May and August 2020. The dataset was obtained from the UCAR Research Data Archive: https://rda.ucar.edu/datasets/d337000/ (accessed on 15 October 2025).
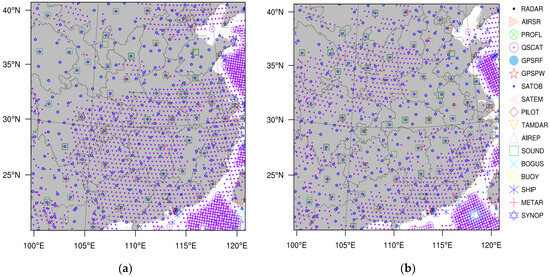
Figure 2.
PrepBUFR observational data used for meteorological data assimilation in this study: (a) 00:00 UTC on 17 May 2020; (b) 12:00 UTC on 10 August 2020. (Data source: NCEP ADP dataset).
2.2.3. XCO2 Fusion Data from Satellite Observation
The satellite remote sensing dataset used in this study is a multi-source XCO2 fusion product developed by Jin et al. [49]. This dataset integrates global XCO2 observations from multiple satellite platforms, including GOSAT, GOSAT-2, OCO-2, and OCO-3, covering the study period from March to August 2020. Using Maximum Likelihood Estimation (MLE) and Optimal Interpolation (OI) techniques based on the re-evaluated uncertainty, it provides a high-resolution and high-temporal-frequency global XCO2 dataset. The dataset demonstrates high accuracy against TCCON (Total Carbon Column Observing Network) data, achieving an R of 0.96, RMSE of 2.62 ppm, and MAE of 1.53 ppm. The dataset covers the period from January 2003 to August 2020, with a spatial resolution of 0.5° × 0.5° and a temporal resolution of 3 h. Figure 3 presents the multi-source fused XCO2 data at two representative times: 19:30 UTC on 2 April 2020, and 19:30 UTC on 27 June 2020, with high data coverage and clear spatial variation in CO2 concentration. The figure demonstrates that the fused dataset has high spatial coverage and effectively captures regions with elevated local CO2 concentrations. Since the fused XCO2 data used for assimilation represent column concentrations, their relationship with the CO2 concentration at each layer in WRF-Chem is calculated as follows [50]:
where n is the total number of vertical layers in WRF-Chem, i denotes the ith model layer, represents the pressure thickness of the ith layer, and indicate the bottom-level and top-level pressures of the model, respectively.
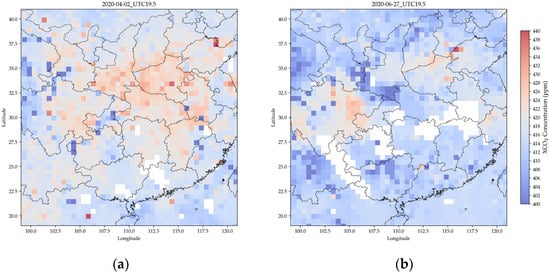
Figure 3.
Multi-source satellite-fused XCO2 data used for assimilation in this study: (a) 19:30 UTC on 2 April 2020; (b) 19:30 UTC on 27 June 2020. (Data source: Jin et al. [49]).
2.2.4. Observations for Validation
The data used to validate the simulation and assimilation of meteorological conditions in this study were obtained from the National Climatic Data Center (NCDC), which operates under the NOAA of the United States. The Integrated Surface Database (ISD) provided by NCDC is a global database that compiles hourly and synoptic surface observations from over 100 different sources. It includes a wide range of meteorological variables such as wind speed, wind direction, temperature, dew point, cloud cover, sea-level pressure, visibility, precipitation, and snow depth. For this study, meteorological station data from four representative cities were selected for validation: Zhengzhou (34.43° N, 113.39° E), Hangzhou (30.14° N, 120.10° E), Chengdu (30.45° N, 103.52° E), and Shenzhen (22.32° N, 114.00° E), as shown in Figure 1. The NCDC data were retrieved from the public FTP server at: ftp://ftp.ncdc.noaa.gov/pub/data/noaa/isd-lite/ (accessed on 15 October 2025).
The data used to validate the CO2 concentration simulation and assimilation in this study were obtained from two major sources: long-term high-precision observations from multiple stations in TCCON, and extensive historical and real-time measurements provided by WDCGG (World Data Centre for Greenhouse Gases), a global data platform for greenhouse gas monitoring and sharing. The study domain includes two TCCON stations—Hefei (31.91° N, 117.17° E) and Xianghe (39.80° N, 116.96° E)—as well as four WDCGG stations: LLN (Lulin, 23.47° N, 120.87° E), WLG (Mt. Waliguan, 36.29° N, 100.90° E), HKO (King’s Park, 22.31° N, 114.17° E), and DSI (Dongsha Island, 20.70° N, 116.73° E). Detailed information is provided in Table 1. TCCON data are available at: https://tccondata.org/ (accessed on 15 October 2025). WDCGG data are available at: https://gaw.kishou.go.jp/ (accessed on 15 October 2025).

Table 1.
Details of ground-based observation stations in this study.
2.3. Methods
2.3.1. WRF-Chem Model
The Weather Research and Forecasting model coupled with Chemistry (WRF-Chem) is an atmospheric simulation system developed by the Forecast Systems Laboratory (FSL) under the NOAA [51]. By deeply integrating the WRF meteorological model with the Chem chemical transport module, WRF-Chem enables the simultaneous simulation of meteorological and chemical processes. The model employs a unified coordinate system and consistent physical parameterization schemes, supporting high-resolution simulations from regional to urban scales, and is particularly effective in analyzing the feedback mechanisms of chemical processes on meteorological fields. In this study, the model was configured with a horizontal resolution of 27 km × 27 km for the outer domain covering China, with an inner nest over the study area set at 9 km × 9 km, and a time step of 20 s. 29 vertical layers extend from the surface to 50 hPa, with a finer resolution near the surface. The domain was projected using a Lambert conformal projection centered at 31° N, 110.3° E. Version 4.2.2 of WRF-Chem was used, and model outputs were generated at hourly intervals. For CO2 simulation, the chemical mechanism was activated using the option chem_opt = 16. The physical and chemical parameterization schemes used in the simulation are listed in Table 2 [52], ensuring accurate representation of meteorology-chemistry interactions.
Table 2.
Physical and chemical options in WRF-Chem.
2.3.2. WRF-DART Model
The Data Assimilation Research Testbed (DART) is an open-source software platform for data assimilation research developed and maintained by the Data Assimilation Research Section (DAReS) at the National Center for Atmospheric Research (NCAR) [59]. DART features a modular design that supports flexible coupling with various assimilation algorithms and numerical models, providing a robust framework for research in atmospheric chemistry, meteorology, and climate [60]. DART has been widely coupled with the WRF-Chem model and applied in many studies involving assimilation of meteorological [61] and air pollutant observations [62]. Building upon the existing meteorological data assimilation system, this study further extends the coupling capabilities between DART and WRF-Chem by developing a CO2 assimilation module. A multi-source satellite XCO2 data assimilation system was successfully constructed, enabling the assimilation of observations from major international carbon-monitoring satellites, including OCO-2/3, GOSAT, and TanSat. The system utilizes the EAKF algorithm to assimilate XCO2 retrievals and improve the accuracy of CO2 concentration simulations. The assimilation system employed a 30-member ensemble with 6-hourly cycling [63], utilizing multiplicative inflation [64], Gaspari-Cohn localization (500 km horizontally, 0.2 scale heights vertically) [65], and adaptive bias correction. The observation error covariance R incorporated both the per-pixel retrieval uncertainties from Jin et al. [49] and a representation error (σ_rep = 1ppm) [66], with the total error defined as .
2.3.3. EAKF Method
As a key member of the EnKF family, the EAKF adopts a unique “adjustment” strategy for state updates. Its core idea lies in updating ensemble members through deterministic transformations rather than stochastic perturbations [64]. The forecast step remains consistent with the conventional EnKF approach [64]:
where denotes the forecast state of the ith ensemble member, M represents the nonlinear dynamical model, is the analysis state at the previous time step, and is an optional model error term. In this step, each ensemble member is integrated forward in time using the dynamical model, forming the forecast ensemble. The analysis step represents the core innovation of the EAKF, which adopts a sequential observation processing strategy. First, the ensemble forecast mean and covariance are computed. These statistics characterize the probabilistic distribution of the forecast state [64]:
Unlike the traditional EnKF, the EAKF employs an unbiased estimator by dividing by N − 1, allowing for a more accurate representation of forecast uncertainty. The forecast error covariance matrix is calculated using the outer product of ensemble perturbations, thus avoiding the direct computation of high-dimensional matrices. During the observation assimilation phase, observational data are optimally combined with model forecasts based on Bayes’ theorem. EAKF adopts a sequential observation processing approach, in which each observation is assimilated individually. This strategy significantly reduces computational complexity [64]:
The observation operator H is used to map the model state space to the observation space, resulting in a forecast ensemble in observation space. The ensemble mean , the observation-space variance (which includes the observation error covariance R), and the state–observation cross-covariance are then calculated [64]:
The Kalman gain is calculated as follows [64]:
This equation defines the sensitivity of the model state to the observations. The numerator represents the covariance between the state and the observations, while the denominator reflects the uncertainty in the observations. The ensemble adjustment is computed as follows [64]:
Unlike traditional stochastic perturbation methods, the EAKF does not introduce random noise. Instead, it applies a deterministic adjustment to each ensemble member: the innovation (i.e., the difference between the observation and the ensemble member’s forecasted observation, is used to update the state through the Kalman gain K. This approach effectively avoids errors introduced by random sampling and is particularly well-suited for small to medium-sized ensembles.
By processing observations sequentially, the EAKF enables adaptive localization, which effectively suppresses spurious correlations from distant observations. Its deterministic update mechanism preserves ensemble statistical consistency without requiring post-processing. While retaining the nonlinear handling capabilities of the EnKF, the EAKF significantly reduces sampling errors and overcomes the computational bottleneck associated with high-dimensional covariance matrices. As a result, it has become a key technique in mesoscale data assimilation and Earth system modeling.
2.3.4. Statistical Evaluation Indicators
In this study, three statistical metrics are employed to evaluate the model’s performance: the correlation coefficient (R) [67], root mean square error (RMSE) [68], and bias [69]. R measures the strength and direction of the linear relationship between the model predictions and observations, indicating how well the simulated values track the observed variations. RMSE quantifies the magnitude of errors between predicted and observed values, while bias represents the average difference between the predictions and observations, serving as an indicator of systematic error. The formulas for these metrics are as follows [67,68,69]:
where denotes the ith observed value, represents the ith model-predicted value, and are the mean values of the observations and model predictions, respectively, and n is the number of samples.
3. Results
3.1. Experimental Design
To systematically evaluate the impact of different assimilation strategies on CO2 concentration simulations, four experiments were conducted to evaluate different assimilation strategies in this study. The baseline experiment (CTRL) simulated CO2 concentrations without any data assimilation; the MET_DA experiment assimilated only meteorological variables; the CO2_DA experiment assimilated only CO2 concentration data; and the FULL_DA experiment simultaneously assimilated both meteorological fields and CO2 concentrations.
Among them, the CTRL experiment serves as the reference baseline. The CO2_DA experiment assimilates multi-source satellite-fused CO2 data to evaluate its impact on the CO2 transport process. The MET_DA experiment assimilates meteorological variables such as temperature, pressure, humidity, and wind to examine the performance of meteorological assimilation. The FULL_DA experiment is used to assess the joint assimilation effect of meteorological fields and CO2 concentrations. This progressive experiment design (CTRL → MET_DA/CO2_DA → FULL_DA) effectively distinguishes the individual contributions of meteorological field optimization and CO2 assimilation to the simulation results. All experiments adopt identical physical parameterization schemes and initial conditions to ensure the comparability of results.
3.2. Simulation and Assimilation of Meteorological Variables
We first conducted simulations and assimilation of meteorological variables over the study area to construct a high-precision meteorological field, providing a foundation for subsequent CO2 simulations. The results of the CTRL and MET_DA experiments were compared. Figure 4 presents the simulation and assimilation results of meteorological elements in Chengdu and Zhengzhou from March to August 2020. In the figure, black dots represent ground-based observations, blue lines indicate simulated values, and red lines represent assimilated values. Table 3 shows the assimilation evaluation results for meteorological elements in Chengdu, Zhengzhou, Hangzhou, and Shenzhen. From Table 3, Figure 4 and Figure 5, it can be seen that the data assimilation improved the model’s simulation performance at most stations; however, the degree of improvement varied across regions and was dependent on specific meteorological variables.
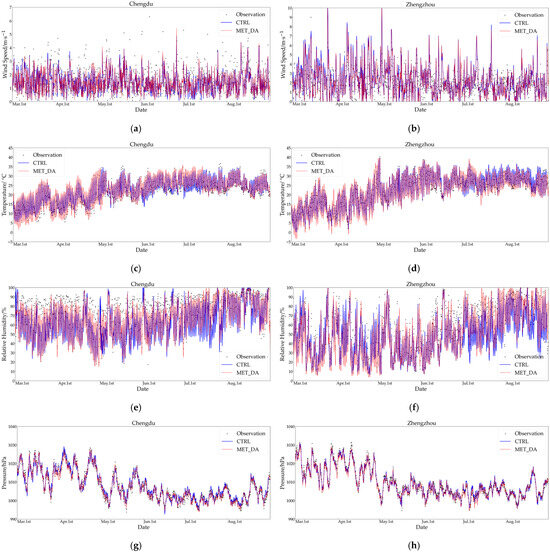
Figure 4.
Comparison of CTRL, MET_DA, and observations in Chengdu and Zhengzhou; (a,c,e,g) Wind speed, temperature, relative humidity, and pressure over Chengdu, respectively; (b,d,f,h) Wind speed, temperature, relative humidity, and pressure over Zhengzhou, respectively.
Table 3.
Statistical analysis of simulated and assimilated meteorological variables.
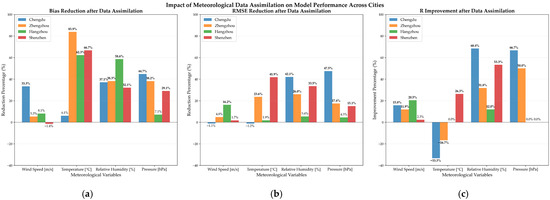
Figure 5.
Impact of meteorological data assimilation at four stations: (a) Percentage reduction in Bias (%), (b) percentage reduction in RMSE (%), and (c) percentage improvement in R (%).
In terms of wind speed, both the simulation and assimilation results for the four cities exhibited relatively large systematic biases, and the assimilation process reduced these biases. Chengdu showed the smallest bias (Sim: −0.12 m/s, Ass: −0.08 m/s), with a slight improvement in the underestimation after assimilation. The correlation coefficient increased from 0.62 to 0.68, indicating that the assimilation integrated the observational data. In Zhengzhou, the simulated wind speed was overestimated (Bias: 1.51 m/s); although slightly improved after assimilation (Bias: 1.43 m/s), the RMSE remained close to 2 m/s, likely due to insufficient model resolution associated with the complex terrain of the Taihang Mountains in the region. In Hangzhou and Shenzhen, the simulated wind speeds were underestimated (Bias: −0.74 m/s and −0.70 m/s, respectively). After assimilation, Hangzhou’s RMSE decreased from 1.17 to 0.98, showing improvement, whereas the assimilation effect in Shenzhen was limited, possibly due to the complex land–sea breeze interactions in coastal areas that were not fully captured during assimilation.
The temperature analysis indicates that the assimilation technique had a more pronounced improvement effect in coastal cities compared to inland cities. This can be attributed to the fact that, as shown in Figure 2, the assimilated data in coastal regions incorporate observations from both land and marine underlying surfaces, thereby improving the representation of land-sea interactions and boundary-layer processes in the model. In Chengdu and Shenzhen, the simulated temperature biases were relatively large (2.31 °C and 3.78 °C, respectively). After assimilation, the bias in Shenzhen was reduced to 1.26 °C, whereas in Chengdu, it was only slightly improved to 2.17 °C—likely due to the model’s inadequate representation of inversion layers associated with basin topography. In contrast, Zhengzhou and Hangzhou exhibited smaller initial biases, and after assimilation, Zhengzhou’s bias was reduced from 0.62 °C to 0.10 °C, indicating that temperature field assimilation performs better in plain regions.
The evaluation of relative humidity revealed a clear pattern of systematic dry bias. Among all sites, Chengdu exhibited more improvement, with the RMSE decreasing from 14.74% to 8.54%, a reduction of 42.1%. Despite this, all cities showed a consistent underestimation of humidity in the simulations. After assimilation, the biases in Chengdu, Zhengzhou, and Shenzhen were reduced by 3–4%, while the improvement in Hangzhou was relatively limited. The post-assimilation correlation coefficients of relative humidity at all sites exceeded 0.85, indicating that the data assimilation process captured the spatiotemporal evolution of humidity.
The analysis of surface pressure showed that the R values for all cities were ≥0.97 and approached 0.99 after assimilation, suggesting that the large-scale characteristics of pressure were accurately simulated. Notably, the RMSE at the Hangzhou station was only 1.06 hPa, reflecting the model’s high accuracy in simulating surface pressure.
From a regional perspective, the assimilation gains in inland cities (such as Chengdu and Zhengzhou) were generally higher than those in coastal cities. This may be attributed to the higher density of observation stations in inland areas and the stronger constraints imposed by the assimilation system on local circulation [70]. However, in regions with complex terrain (e.g., the Chengdu Basin), limitations in the assimilation of temperature and humidity remain evident. For example, the improvement in temperature bias after assimilation was limited (only reduced by 0.14 °C), highlighting the need for more refined land surface data assimilation schemes in future research.
3.3. CO2 Concentrations Validated with WDCGG
The WRF-Chem simulated and assimilated CO2 concentrations were compared against observations from WDCGG. Figure 6 presents time series comparisons between observed CO2 concentrations and those simulated by the CTRL, CO2_DA, and FULL_DA experiments at four WDCGG sites from March to August 2020. In the figure, black triangles represent observed values, the blue line denotes CTRL, the green line represents CO2_DA, and the red line indicates FULL_DA.
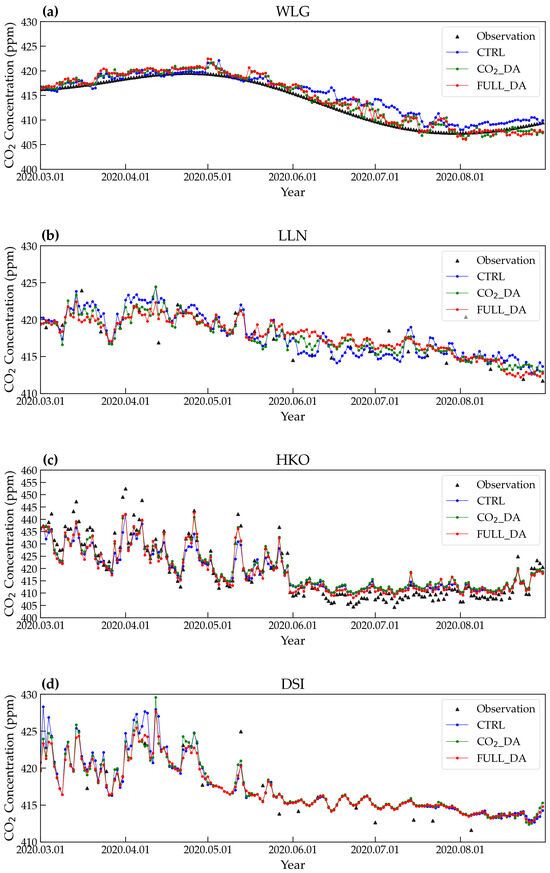
Figure 6.
Time series comparison of WRF-Chem simulated and assimilated surface CO2 concentrations against in situ surface observations from the WDCGG network; (a) WLG station, (b) LLN station, (c) HKO station, and (d) DSI station.
As shown in Figure 6, the assimilation results at the two inland sites, WLG and LLN, are relatively significant, with differences between assimilated and simulated CO2 concentrations mostly ranging from 1 to 5 ppm. The assimilation at the LLN site is particularly effective: around 10 April 2020, the assimilated CO2 concentration decreased by 2–3 ppm compared to the simulation; around 3 June 2020, the assimilated value increased by 3–4 ppm relative to the simulation. These substantial changes may reflect the combined influence of local emission sources and atmospheric transport processes at inland sites, and demonstrate the assimilation system’s ability to effectively capture regional CO2 variability.
In contrast, the assimilation effects at the two coastal sites, HKO and DSI, show smaller changes. This may be due to the moderated CO2 concentrations influenced by oceanic regulation and the dominant role of large-scale circulation. Additionally, the representation of oceanic CO2 sources in WRF-Chem also buffered the adjustment through data assimilation. During the period from June to August 2020, the assimilated results at both sites were relatively close to the simulated values. This could be attributed to the dominance of marine air masses during the summer monsoon season, which reduces the spatiotemporal variability of CO2 concentrations in the region and results in more consistent performance between the simulation and assimilation systems. Additionally, enhanced vertical mixing in summer may further weaken the impact of surface emissions on the CO2 concentrations observed at these stations.
A comparison between the CO2_DA and FULL_DA experiments reveals that the accuracy of CO2 concentration simulations is closely tied to the assimilation processes within the chemical module of WRF-Chem. Assimilating CO2 observations alone can alter the simulation results, indicating that CO2 data assimilation impacts the accuracy of concentration estimates. However, the simultaneous assimilation of meteorological variables provides an improvement in CO2 characterization, as meteorological conditions indirectly influence the spatial and temporal distribution of CO2 through atmospheric transport, boundary layer mixing, and other physical processes.
As shown in Figure 7, the results of CO2_DA and FULL_DA experiments are relatively close, suggesting that while the assimilation of meteorological elements does influence CO2 concentrations, its impact is weaker than that of direct CO2 assimilation. This indicates that, within the current assimilation framework, the assimilation of CO2 observations remains the primary driver of improvements in concentration simulations, while meteorological data assimilation plays a complementary role. The combined effect of both types of assimilation is essential for accurately reproducing real-world variations in CO2 concentrations.
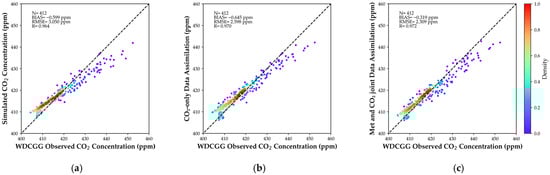
Figure 7.
Comparison of WRF-Chem simulated and assimilated CO2 concentrations with WDCGG station observations; (a) Comparison between CTRL and observations, (b) Comparison between CO2_DA and observations, (c) Comparison between FULL_DA and observations.
3.4. XCO2 Concentrations Validated with TCCON
We performed pressure-weighted vertical integration of the WRF-Chem simulated CO2 concentration profiles to derive column-averaged dry-air mole fractions of CO2 (XCO2), which were then compared with observations from TCCON sites, as shown in Figure 8. Both the pre-assimilation and post-assimilation simulation results exhibited certain biases, with the largest discrepancies observed at the Hefei site: during May to June 2020, the assimilation process improved the XCO2 estimates by approximately 2–3 ppm. The Xianghe site, having a more complete observational time series, clearly demonstrated the assimilation system’s improvement on XCO2 simulation. We also found that the differences between FULL_DA and CO2_DA simulations were minimal, indicating that meteorological data assimilation had a limited effect on improving XCO2 concentration simulations, and that CO2 concentration assimilation was the primary factor enhancing simulation accuracy.
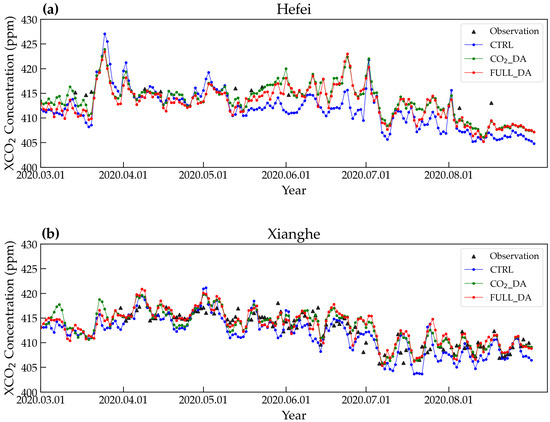
Figure 8.
Time series comparison of WRF-Chem simulated and assimilated column-averaged dry-air mole fractions (XCO2) against TCCON site observations; (a) Hefei site, (b) Xianghe site.
Figure 9 presents the comparison between the simulated and assimilated results and the TCCON station observations. The statistical analysis in Table 4 shows that the CO2_DA experiment improved simulation performance, reducing the bias from 1.155 ppm to −0.351 ppm, decreasing the RMSE by 34.5%, and increasing the R by 17.6%. Building on this, the FULL_DA experiment brought additional improvements, further reducing the bias by 26.2%, lowering the RMSE by 17.1%, and increasing the R by 5.4%. Overall, compared with the CTRL, both assimilation schemes substantially enhanced simulation accuracy. The R of CO2_DA and FULL_DA reached 0.830 and 0.875, respectively, representing improvements of 17.6% and 24.0% over the CTRL experiment. These results indicate that the assimilation system effectively improves the consistency between simulation and observations, and incorporating meteorological data assimilation provides further performance gains.
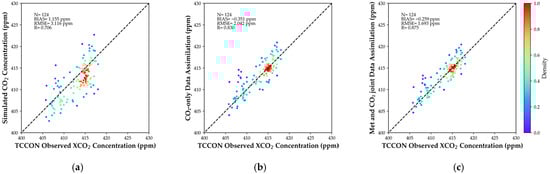
Figure 9.
Comparison of WRF-Chem simulated and assimilated CO2 concentrations with TCCON site observations; (a) Comparison between CTRL and observations, (b) Comparison between CO2_DA and observations, (c) Comparison between FULL_DA and observations.
Table 4.
Evaluation metrics for simulated and assimilated CO2 concentrations.
3.5. Spatiotemporal Analysis of XCO2 Concentrations Before and After Assimilation
We quantified the impacts of assimilating CO2 alone, incrementally assimilating meteorological variables, and jointly assimilating both on the simulation results by computing the three differential terms: (CO2_DA − Sim), (FULL_DA − CO2_DA), and (FULL_DA − Sim). Figure 10 displays their respective spatial distributions of concentration differences. The results clearly illustrate that the impact of assimilating CO2 is greater than that of assimilating meteorological data alone. This is particularly evident at the Xianghe site, where the changes induced by meteorological assimilation are mostly confined to the range of −2 to 2 ppm, while CO2 assimilation leads to more substantial adjustments, ranging from −3 to 6 ppm. The combined assimilation of both data types demonstrates the most substantial improvement in simulating XCO2 concentrations, with changes spanning −4 to 7 ppm, effectively reducing the bias compared to the ground-based observations. The combined assimilation of both data types demonstrates the most substantial improvement in simulating XCO2 concentrations, effectively reducing the bias compared to the ground-based observations.
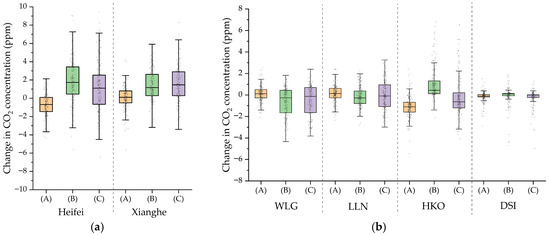
Figure 10.
The magnitudes of changes in CO2 concentration resulting from different assimilation experiments: (A) FULL_DA − CO2_DA, representing the impact of incremental meteorological assimilation; (B) CO2_DA − Sim, indicating the effect of CO2 assimilation alone; and (C) FULL_DA − Sim, showing the total joint effect of assimilating both CO2 and meteorological data. (a) Results from the TCCON sites, (b) Results from the WDCGG sites.
Based on hourly XCO2 concentration data simulated by the WRF-Chem model, this study conducted a comparative analysis of the spatial distribution characteristics of monthly mean XCO2 concentrations before and after assimilation, as shown in Figure 11 and Figure 12. The simulated average XCO2 concentrations from March to May and from June to August 2020 reveal the following: (a) CTRL represents the baseline simulation without assimilation; (b) CO2_DA shows the concentration distribution after assimilating only CO2 observational data; and (c) FULL_DA reflects the outcome of assimilating both CO2 and meteorological data. To further quantify the assimilation effects, (d) presents the concentration difference between CO2_DA and CTRL (CO2_DA − CTRL), while (e) displays the systematic bias between FULL_DA and CO2_DA (FULL_DA − CO2_DA).
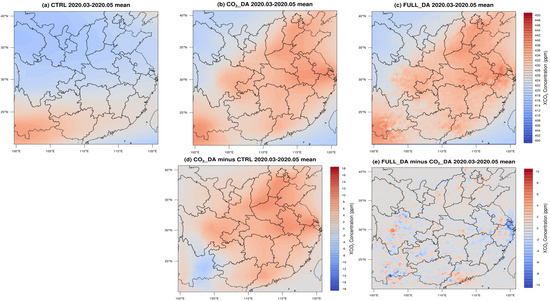
Figure 11.
Comparison of mean XCO2 concentrations from March to May 2020 based on simulation and assimilation results: (a) CTRL; (b) CO2_DA; (c) FULL_DA; (d) Difference between CO2_DA and CTRL; (e) Difference between FULL_DA and CO2_DA.
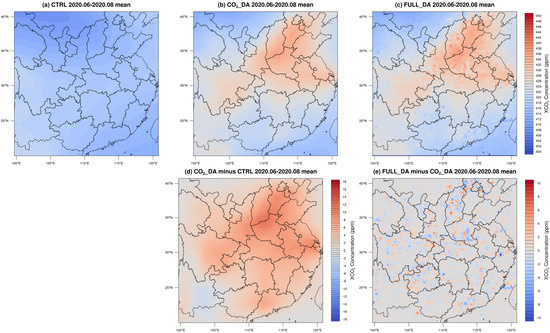
Figure 12.
Comparison of mean XCO2 concentrations from June to August 2020 based on simulation and assimilation results. Descriptions are consistent with those in Figure 9.
Analysis of the WRF-Chem assimilation experiment results indicates that different assimilation schemes affected the spatial distribution of XCO2 concentrations across China. As shown in Figure 11, the CO2_DA experiment, which assimilated only CO2 observational data, revealed widespread positive increments of 4–9 ppm in central, eastern, and southern China. The most prominent increases—ranging from 10 to 13 ppm—were observed in southern Hebei, southwestern Shanxi, and eastern Sichuan. This spatial pattern closely aligns with China’s energy consumption and agricultural production distribution, suggesting that the assimilation process effectively corrected model biases related to anthropogenic emissions in these areas. Notably, a negative increment of 3–8 ppm appeared in eastern Yunnan, which may reflect a more accurate representation of local forest carbon sinks provided by satellite observations.
With the further incorporation of meteorological field assimilation, the FULL_DA results revealed more complex adjustment patterns in the spatial distribution of XCO2 concentrations. Although the overall magnitude of change was relatively small (±2 ppm), distinct spatial variations emerged in key regions. For example, the Yangtze River Delta showed a negative bias of 1–2 ppm, likely due to enhanced horizontal diffusion of CO2 caused by the optimized wind fields. In contrast, areas such as eastern Yunnan and the Sichuan Basin exhibited fluctuations in concentration changes, which may be attributed to uneven adjustments in meteorological fields resulting from complex terrain. A comparison of Figure 11d,e reveals that changes in XCO2 concentrations were primarily driven by the direct assimilation of CO2 concentrations, which shaped the overall distribution pattern. In contrast, meteorological assimilation mainly introduced localized refinements (within ±2 ppm), effectively fine-tuning the concentration field.
Analysis of Figure 12 reveals that from June to August 2020, the CO2_DA mean results show an increase of 3–9 ppm in XCO2 concentrations across central China. The most pronounced increases, reaching 12–15 ppm, occur in the border region of Shaanxi, Shanxi, and Henan provinces. This may be attributed to the region’s status as a major energy and agricultural production area, with high anthropogenic CO2 emissions. After incorporating meteorological data assimilation, the difference between FULL_DA and CO2_DA indicates only slight adjustments within ±2 ppm in localized areas—consistent with the difference patterns observed for March to May 2020. The study also finds that XCO2 concentrations across China from June to August are lower than those from March to May, mainly due to enhanced summer vegetation carbon uptake and improved atmospheric dispersion conditions.
4. Discussion
4.1. Comparison of Assimilation with Other Datasets and Models
Our study compares the simulation results after data assimilation using the WRF-Chem model with the performance of existing mainstream models. As a representative global-scale model, the widely used atmospheric chemical model GEOS-Chem/CMAQ shows a correlation coefficient ranging between 0.82 and 0.93 and an RMSE between 1.19 ppm and 2.63 ppm when compared with site observation data [71,72,73]. This accuracy level is comparable to the assimilation simulation results of this study. It should be noted that GEOS-Chem adopts a longitude-latitude grid resolution of 2° × 2.5°, whereas the regional-scale WRF-Chem model used in this study achieves kilometer-level horizontal resolution, providing significant advantages in capturing spatial details of CO2 concentrations.
Furthermore, compared to other atmospheric chemical models based on the WRF meteorological framework (such as WRF-GHG, WRF-CO2, and WRF-STILT), although these similar models share a common foundation in meteorology-chemistry coupling mechanisms, this study enhances the consistency between simulation results and measured data by introducing advanced data assimilation techniques. Specifically, the biases of existing similar models mostly range between 1.7 ppm and 4.9 ppm [10,74,75], whereas the assimilation scheme in this study significantly reduces the bias to between 0.3 ppm and 1.5 ppm, achieving a relative improvement of approximately 72.7%. This enhancement not only validates the effectiveness of assimilation technology in reducing systematic errors but also elevates the simulation accuracy to a new level for practical applications.
Our study also conducted a systematic comparison between the results and the CAMS global greenhouse gas reanalysis (EGG4) data, as illustrated in Figure 13. The results demonstrate high consistency between the assimilated outputs and the EGG4 data, with R of 0.912, RMSE of 0.655 ppm, and bias of −0.303 ppm. Compared to the simulation results without assimilation (R: 0.780, RMSE: 0.987 ppm, Bias: −0.439 ppm), the assimilation method improved the correlation coefficient by 17%, reduced the RMSE by 34%, and decreased the bias by 31%. It is worth noting that the EGG4 data have a spatial resolution of 0.75° × 0.75° and a temporal resolution of 3 h, whereas the assimilation system developed in this study provides a dataset with higher spatiotemporal resolution (9 km spatial resolution and 1 h temporal resolution). This advantage enables our dataset to more accurately capture the spatiotemporal variations in CO2 concentrations at the urban scale, thereby offering stronger technical support for regional carbon emission monitoring and policy assessment.
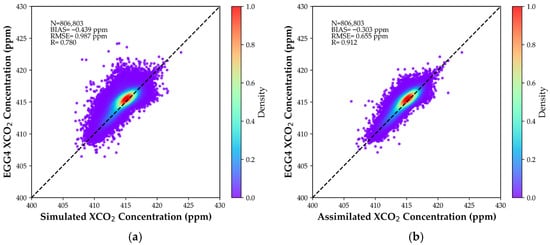
Figure 13.
Comparison of WRF-Chem simulated and assimilated CO2 concentrations with EGG4 datasets; (a) Comparison between CTRL and EGG4, (b) Comparison between FULL_DA and EGG4.
Compared to studies utilizing single-satellite data (e.g., OCO-2 only) [42,43,46], the multi-source satellite assimilation approach adopted in this study offers advantages in both data coverage and accuracy. Assimilation based on a single satellite, though capable of improving overall simulation accuracy to some extent, is subject to considerable spatiotemporal limitations. Due to long satellite revisit cycles, continuous high-frequency observation over a region of interest is difficult to achieve, which restricts the effectiveness of assimilation, especially for capturing short-term variations.
In contrast, by integrating multi-source satellite observations (such as OCO-2, GOSAT, and TanSat), this study substantially enhances the spatiotemporal coverage and information volume of the input data. Multi-source assimilation improves the characterization of spatial CO2 distribution and helps mitigate uncertainties arising from instrument-specific biases inherent in single-satellite products. This approach is particularly beneficial over China, where sampling from individual satellites is often insufficient. Consequently, the use of multi-source data leads to more reliable assimilation results compared to single-satellite strategies.
4.2. Sensitivity and Uncertainty Analysis
Recognizing the importance of evaluating the robustness of our assimilation system, we conducted a series of sensitivity tests to assess the impacts of key model parameters and input data uncertainties on the simulation results. A thorough evaluation of these uncertainties is essential for interpreting the assimilation results in a reliable manner. The sensitivity experiments focused on ensemble size, observation errors, emission inventories, and initial and boundary conditions, though sensitivity to different satellite data fusion strategies was not explicitly tested due to computational constraints and lack of alternative fused products, which we acknowledge as a limitation.
To evaluate the sensitivity to ensemble size, we compared the default 30-member ensemble with a larger 50-member ensemble. The results indicate that while the larger ensemble slightly reduces the spread of analysis increments, the overall spatial patterns and the relative improvements from CO2 and meteorological assimilation remain consistent, suggesting that our main conclusions are not highly sensitive to increases in ensemble size beyond 30 members.
The sensitivity to observation errors was tested by applying both increased and decreased error assumptions (±20%) to the fused XCO2 product. This product integrates observations from multiple satellite platforms, each carrying inherent systematic biases and spatiotemporal sampling limitations. Although cross-calibration and bias correction were applied during fusion, residual uncertainties—especially in regions with high aerosol loading or large solar zenith angles—may propagate into the assimilation system. As expected, larger observation errors reduce the weight of observations during assimilation, weakening the constraint on simulations, while smaller errors strengthen it. Importantly, in both cases, the differential impacts between CO2 and meteorological assimilation remained significant and qualitatively consistent.
Uncertainties in the prior anthropogenic emission inventory, specifically the MEIC inventory used as the baseline in this study, represent a major source of error in simulated CO2 concentrations. To evaluate their influence, we conducted sensitivity experiments by perturbing anthropogenic emission fluxes by ±30%. These perturbations considerably affect prior model biases, particularly over strong source regions such as urban and industrial areas. While the assimilation of XCO2 observations corrects a substantial portion of concentration biases induced by emission errors in the posterior estimates, the assimilation process primarily optimizes the concentration fields rather than the emission fluxes themselves. Consequently, residual errors in the prior emissions remain a persistent source of uncertainty that assimilation can only partially correct.
Additionally, the CT2022 model data, which provided initial and boundary conditions, introduced uncertainties related to model representativeness and large-scale transport errors. Although it is challenging to fully isolate these effects, sensitivity tests using different initial conditions from an alternative global model simulation indicated that the assimilation process reduced dependency on initial values after several adjustment cycles. The influence of CT2022 uncertainties was most pronounced during the first two days but diminished rapidly as assimilation progressed.
Furthermore, TCCON and WDCGG observations are “point-scale” measurements, whereas model-simulated CO2 concentrations represent “grid-scale” values. The 9 km model grid integrates various underlying surfaces and source-sink processes within the grid cells. In contrast, ground-based station observations reflect only the local environmental characteristics within a few hundred meters surrounding the site. Such a scale mismatch introduces systematic uncertainties in model-observation comparisons. Future studies could incorporate approaches such as buffer-zone analysis around stations or multi-station ensemble validation to reduce uncertainties arising from scale discrepancies.
In summary, although input uncertainties from multiple sources affect the absolute magnitude of the analyzed XCO2 concentrations, the key conclusion regarding the optimal performance of combined meteorological and CO2 concentration assimilation remains robust across all sensitivity tests. The assimilation system demonstrates considerable capability in mitigating errors from diverse sources, thereby enhancing the reliability of the optimized concentrations. Future work should include intercomparisons with other fused products or single-satellite retrievals to better quantify structural uncertainties in the fusion methodology.
5. Conclusions
This study conducted a comprehensive numerical simulation and data assimilation analysis of CO2 concentrations over parts of central, eastern, and southern China from March to August 2020, using the WRF-Chem model coupled with the EAKF assimilation system. Compared with previous studies that only assimilated single-satellite data, the fused XCO2 dataset assimilated in this study features hourly multi-satellite observations and extensive spatial coverage, thereby improving the accuracy of simulated concentrations. Four progressive experiments (CTRL, MET_DA, CO2_DA, FULL_DA) were conducted to evaluate the improvement in regional CO2 concentration simulations under different data assimilation strategies.
The study first established a high-precision meteorological field to lay the foundation for subsequent CO2 simulations. Validation results from the CTRL experiment in four representative cities indicated that the baseline meteorological fields demonstrated generally acceptable performance for the intended purpose of supporting CO2 transport simulations. For wind speed, Chengdu, Hangzhou, and Shenzhen showed systematic negative biases, with Bias ranging from −0.12 to −0.74 m/s, while Zhengzhou exhibited a clear overestimation (Bias = 1.51 m/s). The RMSE across the cities ranged from 0.89 to 2.07 m/s, with R between 0.56 and 0.62. Temperature simulations performed the best overall, with R above 0.81 for all cities. Chengdu, Zhengzhou, and Hangzhou reached a high R of 0.94, though systematic biases were still apparent—particularly in Shenzhen, where the bias was most pronounced (Bias = 3.78 °C). In terms of relative humidity, all cities showed negative biases, ranging from −2.80% to −9.80%, with Chengdu and Shenzhen experiencing the largest deviations (Bias > 9%). RMSEs for relative humidity were relatively high, between 12.73% and 18.40%. Pressure simulations remained the most accurate, with R exceeding 0.97 for all cities. Absolute biases were below 1.5 hPa, and RMSEs were all under 2 hPa.
The MET_DA experiment, based on the DART assimilation platform, significantly improved the accuracy of meteorological variable simulations by integrating multi-source ADP observational data. The results showed that data assimilation led to overall enhancements in the performance of all meteorological parameters. For relative humidity, Chengdu exhibited the most significant improvement, with RMSE decreasing from 14.74% to 8.54%, and R increasing from 0.81 to 0.94. Shenzhen also saw a notable RMSE reduction from 18.40% to 12.23%. In temperature assimilations, the average bias across all stations decreased by 42.3%. The most substantial improvement occurred in Shenzhen, where the bias dropped from 3.78 °C to 1.26 °C, a 66.7% reduction. For wind speed, Hangzhou’s RMSE decreased from 1.17 m/s to 0.98 m/s after assimilation, representing a relative reduction of 16.2%. Atmospheric pressure continued to show the highest simulation accuracy, with R above 0.97 in all cities. This process of optimization supplied a more reliable meteorological field to drive the subsequent simulations.
In terms of CO2 simulation, we conducted the CTRL experiment as the baseline without data assimilation, the CO2_DA experiment to iteratively optimize the CO2 initial field using multi-source satellite-fused data, and the FULL_DA experiment to jointly assimilate satellite-observed CO2 concentrations and meteorological observations, thereby comprehensively evaluating the coupled optimization effect of meteorological fields and CO2 concentrations. The CTRL simulation results show that the model performed well in simulating near-surface CO2 concentrations, achieving a high R of 0.964 with WDCGG observations, bias of −0.599 ppm, and RMSE of 3.050 ppm. The comparison with TCCON observations demonstrated good performance, with XCO2 concentrations showing R of 0.706, bias of 1.155 ppm, and RMSE of 3.116 ppm. The CO2_DA experiment significantly improved simulation performance, increasing the R values to 0.970 (WDCGG) and 0.830 (TCCON), and reducing the RMSE to 2.598 ppm and 2.042 ppm, respectively—indicating that satellite data assimilation effectively optimized the CO2 initial field. The FULL_DA experiment achieved even better agreement, with R values reaching 0.972 and 0.875 for the two validation datasets, and RMSE further reduced to 2.309 ppm and 1.693 ppm. The biases were also controlled at low levels, −0.319 ppm and −0.259 ppm, respectively. These results demonstrate that joint assimilation of meteorological fields and CO2 concentrations can comprehensively enhance simulation accuracy. Altogether, this series of experiments confirms the significant improvements that multi-source data assimilation brings to CO2 concentration simulations.
Based on hourly XCO2 concentration data simulated using the WRF-Chem model from March to August 2020, we calculated the monthly averages for the periods of March–May and June–August and analyzed their spatial distribution characteristics. The results clearly show that the spatial patterns of XCO2 concentrations vary across the three simulation schemes—CTRL, CO2_DA, and FULL_DA. Difference analyses reveal that assimilating multi-source satellite remote sensing data improves the simulation of XCO2 concentrations, particularly over most areas in central and eastern China, where assimilation leads to increases of 4–9 ppm, with some localized improvements exceeding 10 ppm. In contrast, the impact of meteorological data assimilation on XCO2 concentration is relatively limited, with changes generally within ±2 ppm. These findings indicate that optimizing the initial CO2 field plays a dominant role in XCO2 simulations, while meteorological assimilation provides supplementary refinement. This study offers a methodological reference for building a more accurate carbon data assimilation system for China and provides technical support for the application of future satellite CO2 observations and regional carbon budget assessments.
Author Contributions
Conceptualization, W.L. and X.L.; methodology, W.L.; software, W.L.; validation, W.L., C.L. and B.H.; formal analysis, W.L.; investigation, X.L.; resources, C.L.; data curation, C.L.; writing—original draft preparation, W.L.; writing—review and editing, W.L.; visualization, H.X.; supervision, X.L.; project administration, X.L.; funding acquisition, X.L. All authors have read and agreed to the published version of the manuscript.
Funding
This research was funded by the Intergovernmental International Science and Technology Innovation Cooperation Program under National Key Research and Development Plan (2024YFE0198600).
Data Availability Statement
The datasets and model codes used in this study are all publicly available. The WRF-Chem model version 4.2.2 was obtained from https://github.com/wrf-model/WRF/releases (accessed on 15 October 2025), while the WRF-DA system version 4.2.2 was acquired from https://github.com/wrf-model/WRFDA (accessed on 15 October 2025). The DART model version 11.15.0 was obtained from https://github.com/NCAR/DART (accessed on 15 October 2025). CO2 observations were provided by the Total Carbon Column Observing Network available at https://doi.org/10.14291/tccon.ggg2020, and by the World Data Centre for Greenhouse Gases at https://gaw.kishou.go.jp (accessed on 15 October 2025). The fused multi-source satellite XCO2 concentration dataset is accessible at https://doi.org/10.1016/j.atmosres.2022.106385. The meteorological data used in this study included the NCEP ADP Global Upper Air and Surface Weather Observations available at https://doi.org/10.5065/Z83F-N512, and the FNL Operational Global Analysis data at https://doi.org/10.5065/D6M043C6. Global carbon emissions data were obtained from Tsinghua University’s Multi-resolution Emission Inventory for China at https://doi.org/10.1007/s11430-023-1230-3, and from NOAA’s CarbonTracker CT2022 dataset at https://doi.org/10.25925/z1gj-3254. All datasets are openly accessible for scientific research purposes.
Acknowledgments
The authors acknowledge the CO2 observations from TCCON (https://tccondata.org/, accessed on 15 October 2025) and WDCGG (https://gaw.kishou.go.jp/, accessed on 15 October 2025), the fused multi-source satellite XCO2 concentration dataset (https://doi.org/10.1016/j.atmosres.2022.106385), ADP Global Upper Air and Surface Weather Observations from NCEP (https://rda.ucar.edu/datasets/d337000/, accessed on 15 October 2025), the WRF-Chem model (https://www2.acom.ucar.edu/wrf-chem/, accessed on 15 October 2025) and all the connected input data including FNL (Final) Operational Global Analysis data from NCEP of the NOAA (https://gdex.ucar.edu/datasets/d083002/, accessed on 15 October 2025), MEIC dataset from Tsinghua University’s Department of Earth System Science (http://meicmodel.org.cn/, accessed on 15 October 2025) and the CarbonTracker CT2022 dataset from NOAA’s Global Monitoring Laboratory (GML) (https://gml.noaa.gov/ccgg/carbontracker/, accessed on 15 October 2025).
Conflicts of Interest
The authors declare no conflicts of interest.
References
- Cheng, W.; Dan, L.; Deng, X.; Feng, J.; Wang, Y.; Peng, J.; Tian, J.; Qi, W.; Liu, Z.; Zheng, X.; et al. Global monthly gridded atmospheric carbon dioxide concentrations under the historical and future scenarios. Sci. Data 2022, 9, 83. [Google Scholar] [CrossRef]
- Delsarte, I.; Cohen, G.; Momtbrun, M.; Höhener, P.; Atteia, O. Soil carbon dioxide fluxes to atmosphere: The role of rainfall to control CO2 transport. Appl. Geochem. 2021, 127, 104854. [Google Scholar] [CrossRef]
- He, B.; Xue, Y.; Lu, X.; Zhao, L.; Jin, C.; Wang, P.; Li, P.; Liu, W.; Yin, W.; Yuan, T. Monitoring oil and gas field CH4 leaks by Sentinel-5P and Sentinel-2. Fuel 2025, 383, 133889. [Google Scholar] [CrossRef]
- Hepburn, C.; Qi, Y.; Stern, N.; Ward, B.; Xie, C.; Zenghelis, D. Towards carbon neutrality and China’s 14th Five-Year Plan: Clean energy transition, sustainable urban development, and investment priorities. Environ. Sci. Ecotechnol. 2021, 8, 100130. [Google Scholar] [CrossRef]
- Ji, M.; Xu, Y.M.; Zhang, Y.; Mo, Y.P.; Zhu, S.Y.; Wang, W.; Zhou, M.Q.; Morino, I.; Ohyama, H.; Shiomi, K.; et al. Validation of Remotely Sensed XCO2 Products With TCCON Observations in East Asia. IEEE J. Sel. Top. Appl. Earth Observ. Remote Sens. 2024, 17, 7159–7169. [Google Scholar] [CrossRef]
- Labzovskii, L.D.; Kenea, S.T.; Lindqvist, H.; Kim, J.; Li, S.; Byun, Y.H.; Goo, T.Y. Towards Robust Calculation of Interannual CO2 Growth Signal from TCCON (Total Carbon Column Observing Network). Remote Sens. 2021, 13, 3868. [Google Scholar] [CrossRef]
- Hu, K.; Liu, Z.R.; Shao, P.F.; Ma, K.Y.; Xu, Y.; Wang, S.Q.; Wang, Y.Y.; Wang, H.; Di, L.; Xia, M.; et al. A Review of Satellite-Based CO2 Data Reconstruction Studies: Methodologies, Challenges, and Advances. Remote Sens. 2024, 16, 3818. [Google Scholar] [CrossRef]
- Hu, K.; Zhang, Q.; Feng, X.Y.; Liu, Z.R.; Shao, P.F.; Xia, M.; Ye, X.L. An Interpolation and Prediction Algorithm for XCO2 Based on Multi-Source Time Series Data. Remote Sens. 2024, 16, 1907. [Google Scholar] [CrossRef]
- Yang, H.J.; Li, T.W.; Wu, J.A.; Zhang, L.F. Inter-comparison and evaluation of global satellite XCO2 products. Geo-Spat. Inf. Sci. 2025, 28, 131–144. [Google Scholar] [CrossRef]
- Jing, Y.; Wang, T.; Zhang, P.; Chen, L.; Xu, N.; Ma, Y. Global Atmospheric CO2 Concentrations Simulated by GEOS-Chem: Comparison with GOSAT, Carbon Tracker and Ground-Based Measurements. Atmosphere 2018, 9, 175. [Google Scholar] [CrossRef]
- Tan, Z.; Wang, J.; Yu, Z.; Luo, Y. Spatiotemporal Analysis of XCO2 and Its Relationship to Urban and Green Areas of China’s Major Southern Cities from Remote Sensing and WRF-Chem Modeling Data from 2010 to 2019. Geographies 2023, 3, 246–267. [Google Scholar] [CrossRef]
- Dong, X.; Yue, M.; Jiang, Y.; Hu, X.; Ma, Q.; Pu, J.; Zhou, G. Analysis of CO2 spatio-temporal variations in China using a weather-biosphere online coupled model. Atmos. Chem. Phys. 2021, 21, 7217–7233. [Google Scholar] [CrossRef]
- Liang, A.; Gu, J.; Xiang, C. Multi-Source Satellite and WRF-Chem Analyses of Atmospheric Pollution from Fires in Peninsular Southeast Asia. Remote Sens. 2023, 15, 5463. [Google Scholar] [CrossRef]
- Seo, M.; Kim, H.M. Effect of meteorological data assimilation using 3DVAR on high-resolution simulations of atmospheric CO2 concentrations in East Asia. Atmos. Pollut. Res. 2023, 14, 101759. [Google Scholar] [CrossRef]
- Yang, Y.; Qiu, C.J.; Gong, J.D. Physical initialization applied in WRF-Var for assimilation of Doppler radar data. Geophys. Res. Lett. 2006, 33, L22807. [Google Scholar] [CrossRef]
- Yang, S.; Li, D.Q.; Chen, L.Q.; Liu, Z.Q.; Huang, X.Y.; Pan, X. The Regularized WSM6 Microphysical Scheme and Its Validation in WRF 4D-Var. Adv. Atmos. Sci. 2023, 40, 483–500. [Google Scholar] [CrossRef]
- Huang, X.Y.; Xiao, Q.N.; Barker, D.M.; Zhang, X.; Michalakes, J.; Huang, W.; Henderson, T.; Bray, J.; Chen, Y.S.; Ma, Z.Z.; et al. Four-Dimensional Variational Data Assimilation for WRF: Formulation and Preliminary Results. Mon. Weather Rev. 2009, 137, 299–314. [Google Scholar] [CrossRef]
- Zhang, J.; Li, F.; Yu, G.; Zhang, X.L.; Feng, Z.B. A hybrid data assimilation method for reconstructing airflow path parameters of a multi-zone model. J. Build. Eng. 2024, 95, 110240. [Google Scholar] [CrossRef]
- Zhu, L.; Meng, Z.Y.; Weng, Y.H.; Zhang, F.Q. Assimilation of All-sky Geostationary Satellite Infrared Radiances for Convection-Permitting Initialization and Prediction of Hurricane Joaquin (2015). Adv. Atmos. Sci. 2022, 39, 1859–1872. [Google Scholar] [CrossRef]
- Hu, Y.W.; Li, Y.; Ma, X.Y.; Liang, Y.F.; You, W.; Pan, X.B.; Zang, Z.L. The optimization of SO2 emissions by the 4DVAR and EnKF methods and its application in WRF-Chem. Sci. Total Environ. 2023, 888, 163796. [Google Scholar]
- Wang, R.; Shen, Z. A Deep Neural Network-Ensemble Adjustment Kalman Filter and Its Application on Strongly Coupled Data Assimilation. J. Mar. Sci. Eng. 2024, 12, 108. [Google Scholar] [CrossRef]
- Xu, M.; Wang, Y.; Zhang, J.; Yang, D.; Yin, X.; Gao, Y.; Wang, G.; Lv, X. Data assimilation in a regional high-resolution ocean model by using Ensemble Adjustment Kalman Filter and its application during 2020 cold spell event over Asia-Pacific region. Appl. Ocean Res. 2022, 129, 103375. [Google Scholar] [CrossRef]
- Rabier, F.; Järvinen, H.; Klinker, E.; Mahfouf, J.F.; Simmons, A. The ECMWF operational implementation of four-dimensional variational assimilation. I: Experimental results with simplified physics. Q. J. R. Meteorol. Soc. 2000, 126, 1143–1170. [Google Scholar] [CrossRef]
- Dobricic, S.; Pinardi, N. An oceanographic three-dimensional variational data assimilation scheme. Ocean Model. 2008, 22, 89–105. [Google Scholar] [CrossRef]
- Gauthier, P.; Tanguay, M.; Laroche, S.; Pellerin, S.; Morneau, J. Extension of 3DVAR to 4DVAR: Implementation of 4DVAR at the Meteorological Service of Canada. Mon. Weather Rev. 2007, 135, 2339–2354. [Google Scholar] [CrossRef]
- Koffi, E.N.; Rayner, P.J.; Scholze, M.; Chevallier, F.; Kaminski, T. Quantifying the constraint of biospheric process parameters by CO2 concentration and flux measurement networks through a carbon cycle data assimilation system. Atmos. Chem. Phys. 2013, 13, 10555–10572. [Google Scholar] [CrossRef]
- Tian, X.; Xie, Z.; Liu, Y.; Cai, Z.; Fu, Y.; Zhang, H.; Feng, L. A joint data assimilation system (Tan-Tracker) to simultaneously estimate surface CO2 fluxes and 3-D atmospheric CO2 concentrations from observations. Atmos. Chem. Phys. 2014, 14, 13281–13293. [Google Scholar] [CrossRef]
- Huang, Z.K.; Peng, Z.; Liu, H.N.; Zhang, M.G.; Ma, X.G.; Yang, S.C.; Lee, S.D.; Kim, S.Y. Development of CMAQ for East Asia CO2 data assimilation under an EnKF framework: A first result. Chin. Sci. Bull. 2014, 59, 3200–3208. [Google Scholar] [CrossRef]
- Peng, Z.; Zhang, M.; Kou, X.; Tian, X.; Ma, X. A regional carbon data assimilation system and its preliminary evaluation in East Asia. Atmos. Chem. Phys. 2015, 15, 1087–1104. [Google Scholar] [CrossRef]
- Deng, A.J.; Lauvaux, T.; Davis, K.J.; Gaudet, B.J.; Miles, N.; Richardson, S.J.; Wu, K.; Sarmiento, D.P.; Hardesty, R.M.; Bonin, T.A.; et al. Toward reduced transport errors in a high resolution urban CO2 inversion system. Elem. Sci. Anthr. 2017, 5, 20. [Google Scholar]
- He, W.; van der Velde, I.R.; Andrews, A.E.; Sweeney, C.; Miller, J.; Tans, P.; van der Laan-Luijkx, I.T.; Nehrkorn, T.; Mountain, M.; Ju, W.M.; et al. CTDAS-Lagrange v1.0: A high-resolution data assimilation system for regional carbon dioxide observations. Geosci. Model Dev. 2018, 11, 3515–3536. [Google Scholar]
- Hu, X.M.; Gourdji, S.M.; Davis, K.J.; Wang, Q.Y.; Zhang, Y.; Xue, M.; Feng, S.; Moore, B.; Crowell, S. Implementation of Improved Parameterization of Terrestrial Flux in WRF-VPRM Improves the Simulation of Nighttime CO2 Peaks and a Daytime CO2 Band Ahead of a Cold Front. J. Geophys. Res. Atmos. 2021, 126, e2020JD034362. [Google Scholar] [CrossRef]
- Ho, D.; Galkowski, M.; Reum, F.; Botía, S.; Marshall, J.; Totsche, K.U.; Gerbig, C. Recommended coupling to global meteorological fields for long-term tracer simulations with WRF-GHG. Geosci. Model Dev. 2024, 17, 7401–7422. [Google Scholar] [CrossRef]
- Peng, Z.; Kou, X.X.; Wang, S.Y.; Zhang, Y.; Zhang, M.G.; Hu, F.; Miao, S.G.; Dou, J.X. Quantifying Observational Constraints in Top-Down Estimation of Terrestrial Biosphere Carbon Fluxes by CO2 Concentration and Eddy Covariance Flux Measurement Based on EnSRF and CMAQ. J. Geophys. Res. Atmos. 2025, 130, e2024JD041540. [Google Scholar]
- Kong, L.; Tang, X.; Zhu, J.; Wang, Z.F.; Li, J.J.; Wu, H.J.; Wu, Q.Z.; Chen, H.S.; Zhu, L.L.; Wang, W.; et al. A 6-year-long (2013-2018) high-resolution air quality reanalysis dataset in China based on the assimilation of surface observations from CNEMC. Earth Syst. Sci. Data 2021, 13, 529–570. [Google Scholar] [CrossRef]
- Kim, J.; Kim, H.M.; Cho, C.H. Influence of CO2 observations on the optimized CO2 flux in an ensemble Kalman filter. Atmos. Chem. Phys. 2014, 14, 13515–13530. [Google Scholar] [CrossRef]
- Park, J.; Kim, H.M. Design and evaluation of CO2 observation network to optimize surface CO2 fluxes in Asia using observation system simulation experiments. Atmos. Chem. Phys. 2020, 20, 5175–5195. [Google Scholar]
- Lei, L.L.; Ge, Y.J.; Tan, Z.M.; Zhang, Y.; Chu, K.K.; Qiu, X.; Qian, Q.F. Evaluation of a Regional Ensemble Data Assimilation System for Typhoon Prediction. Adv. Atmos. Sci. 2022, 39, 1816–1832. [Google Scholar]
- George, B.; Kutty, G. Multivariate ensemble sensitivity analysis applied for an extreme rainfall over Indian subcontinent. Atmos. Res. 2022, 277, 106324. [Google Scholar]
- Yang, E.G.; Kim, H.M. A comparison of variational, ensemble-based, and hybrid data assimilation methods over East Asia for two one-month periods. Atmos. Res. 2021, 249, 105257. [Google Scholar]
- Sun, R.; Sanikommu, S.; Subramanian, A.C.; Mazloff, M.R.; Cornuelle, B.D.; Gopalakrishnan, G.; Miller, A.J.; Hoteit, I. Enhanced regional ocean ensemble data assimilation through atmospheric coupling in the SKRIPS model. Ocean Model. 2024, 191, 102424. [Google Scholar] [CrossRef]
- Seo, M.G.; Kim, H.M. Evaluation of high-resolution regional CO2 data assimilation-forecast system in East Asia using observing system simulation experiment and effect of observation network on simulated CO2 concentrations. Q. J. R. Meteorol. Soc. 2025, 151, e4987. [Google Scholar] [CrossRef]
- Zhang, Q.W.; Li, M.Q.; Wei, C.; Mizzi, A.P.; Huang, Y.J.; Gu, Q.R. Assimilation of OCO-2 retrievals with WRF-Chem/DART: A case study for the Midwestern United States. Atmos. Environ. 2021, 246, 118106. [Google Scholar] [CrossRef]
- Jin, J.P.; Zhang, Q.W.; Wei, C.; Gu, Q.R.; Huang, Y.J. Wildfire CO2 Emissions in the Conterminous United States from 2015 to 2018 as Estimated by the WRF-Chem Assimilation System from OCO-2 XCO2 Retrievals. Atmosphere 2024, 15, 186. [Google Scholar] [CrossRef]
- Zhang, S.; Zheng, X.; Chen, J.M.; Chen, Z.; Dan, B.; Yi, X.; Wang, L.; Wu, G. A global carbon assimilation system using a modified ensemble Kalman filter. Geosci. Model Dev. 2015, 8, 805–816. [Google Scholar] [CrossRef]
- Jin, J.P.; Huang, Y.J.; Wei, C.; Wang, X.P.; Xu, X.J.; Gu, Q.R.; Wang, M.Q. Analysis of CO2 Concentration and Fluxes of Lisbon Portugal Using Regional CO2 Assimilation Method Based on WRF-Chem. Atmosphere 2025, 16, 847. [Google Scholar] [CrossRef]
- Agustí-Panareda, A.; Diamantakis, M.; Massart, S.; Chevallier, F.; Muñoz-Sabater, J.; Barré, J.; Curcoll, R.; Engelen, R.; Langerock, B.; Law, R.M.; et al. Modelling CO2 weather—Why horizontal resolution matters. Atmos. Chem. Phys. 2019, 19, 7347–7376. [Google Scholar] [CrossRef]
- Mahadevan, P.; Wofsy, S.C.; Matross, D.M.; Xiao, X.; Dunn, A.L.; Lin, J.C.; Gerbig, C.; Munger, J.W.; Chow, V.Y.; Gottlieb, E.W. A satellite-based biosphere parameterization for net ecosystem CO2 exchange: Vegetation Photosynthesis and Respiration Model (VPRM). Glob. Biogeochem. Cycle 2008, 22. [Google Scholar]
- Jin, C.; Xue, Y.; Jiang, X.; Zhao, L.; Yuan, T.; Sun, Y.; Wu, S.; Wang, X. A long-term global XCO2 dataset: Ensemble of satellite products. Atmos. Res. 2022, 279, 106385. [Google Scholar] [CrossRef]
- Connor, B.J.; Boesch, H.; Toon, G.; Sen, B.; Miller, C.; Crisp, D. Orbiting carbon observatory: Inverse method and prospective error analysis. J. Geophys. Res. Atmos. 2008, 113, D05305. [Google Scholar] [CrossRef]
- Grell, G.A.; Peckham, S.E.; Schmitz, R.; McKeen, S.A.; Frost, G.; Skamarock, W.C.; Eder, B. Fully coupled “online” chemistry within the WRF model. Atmos. Environ. 2005, 39, 6957–6975. [Google Scholar] [CrossRef]
- Liu, W.; Ling, X.; Xue, Y.; Wu, S.; Gao, J.; Zhao, L.; He, B. Study on the Concentration of Top Air Pollutants in Xuzhou City in Winter 2020 Based on the WRF-Chem and ADMS-Urban Models. Atmosphere 2024, 15, 129. [Google Scholar] [CrossRef]
- Lin, Y.; Farley, R.D.; Orville, H.D. Bulk parameterization of the snow field in a cloud model. J. Appl. Meteorol. Climatol. 1983, 22, 1065–1092. [Google Scholar]
- Mlawer, E.J.; Taubman, S.J.; Brown, P.D.; Iacono, M.J.; Clough, S.A. Radiative transfer for inhomogeneous atmospheres: RRTM, a validated correlated-k model for the longwave. J. Geophys. Res. Atmos. 1997, 102, 16663–16682. [Google Scholar]
- Dudhia, J. Numerical Study of Convection Observed during the Winter Monsoon Experiment Using a Mesoscale Two-Dimensional Model. J. Atmos. Sci. 1989, 46, 3077–3107. [Google Scholar]
- Grell, G.A.; Dudhia, J.; Stauffer, D.R. A Description of the Fifth-Generation Penn State/NCAR Mesoscale Model (MM5); NCAR Tech. Note; University Corporation for Atmospheric Research: Boulder, CO, USA, 1994. [Google Scholar] [CrossRef]
- Chen, F.; Dudhia, J. Coupling an advanced land surface-hydrology model with the Penn State-NCAR MM5 modeling system. Part I: Model implementation and sensitivity. Mon. Weather Rev. 2001, 129, 569–585. [Google Scholar]
- Hong, S.Y.; Noh, Y.; Dudhia, J. A new vertical diffusion package with an explicit treatment of entrainment processes. Mon. Weather Rev. 2006, 134, 2318–2341. [Google Scholar]
- Grell, G.A.; Dévényi, D. A generalized approach to parameterizing convection combining ensemble and data assimilation techniques. Geophys. Res. Lett. 2002, 29, 38-1–38-4. [Google Scholar] [CrossRef]
- Anderson, J.; Hoar, T.; Raeder, K.; Liu, H.; Collins, N.; Torn, R.; Avellano, A. The data assimilation research testbed a community facility. Bull. Amer. Meteorol. Soc. 2009, 90, 1283–1296. [Google Scholar]
- Williams, J.L.I.; Maxwell, R.M.; Delle Monache, L. Development and verification of a new wind speed forecasting system using an ensemble Kalman filter data assimilation technique in a fully coupled hydrologic and atmospheric model. J. Adv. Model. Earth Syst. 2013, 5, 785–800. [Google Scholar] [CrossRef]
- Ma, C.; Wang, T.; Mizzi, A.P.; Anderson, J.L.; Zhuang, B.; Xie, M.; Wu, R. Multiconstituent Data Assimilation With WRF-Chem/DART: Potential for Adjusting Anthropogenic Emissions and Improving Air Quality Forecasts Over Eastern China. J. Geophys. Res. Atmos. 2019, 124, 7393–7412. [Google Scholar] [CrossRef]
- Evensen, G. Sequential data assimilation with a nonlinear quasi-geostrophic model using Monte Carlo methods to forecast error statistics. J. Geophys. Res. Oceans 1994, 99, 10143–10162. [Google Scholar] [CrossRef]
- Anderson, J.L. An ensemble adjustment Kalman filter for data assimilation. Mon. Weather Rev. 2001, 129, 2884–2903. [Google Scholar] [CrossRef]
- Rood, R.B.; Gaspari, G.; Cohn, S.E. Construction of Correlation Functions in Two and Three Dimensions. Q. J. R. Meteorol. Soc. 1998, 125, 723–757. [Google Scholar]
- Scholze, M.; Buchwitz, M.; Dorigo, W.; Guanter, L.; Shaun, Q.G. Reviews and syntheses: Systematic Earth observations for use in terrestrial carbon cycle data assimilation systems. Biogeosciences 2017, 14, 3401–3429. [Google Scholar] [CrossRef]
- Taylor, R. Interpretation of the Correlation Coefficient: A Basic Review. J. Diagn. Med. Sonog. 1990, 6, 35–39. [Google Scholar] [CrossRef]
- Chai, T.; Draxler, R.R. Root mean square error (RMSE) or mean absolute error (MAE)?—Arguments against avoiding RMSE in the literature. Geosci. Model Dev. 2014, 7, 1247–1250. [Google Scholar] [CrossRef]
- Chen, J.W.; Dong, H.D.; Wang, X.; Feng, F.L.; Wang, M.; He, X.N. Bias and Debias in Recommender System: A Survey and Future Directions. ACM Trans. Inf. Syst. 2023, 41, 1–19. [Google Scholar] [CrossRef]
- Fujita, T.; Stensrud, D.J.; Dowell, D.C. Surface data assimilation using an ensemble Kalman filter approach with initial condition and model physics uncertainties. Mon. Weather Rev. 2007, 135, 1846–1868. [Google Scholar] [CrossRef]
- Zhang, L.L.; Yue, T.X.; Wilson, J.P.; Zhao, N.; Zhao, Y.P.; Du, Z.P.; Liu, Y. A comparison of satellite observations with the XCO2 surface obtained by fusing TCCON measurements and GEOS-Chem model outputs. Sci. Total Environ. 2017, 601, 1575–1590. [Google Scholar] [CrossRef]
- Ballav, S.; Naja, M.; Patra, P.K.; Machida, T.; Mukai, H. Assessment of spatio-temporal distribution of CO2 over greater Asia using the WRF-CO2 model. J. Earth Syst. Sci. 2020, 129, 80. [Google Scholar] [CrossRef]
- Cogan, A.J.; Boesch, H.; Parker, R.J.; Feng, L.; Palmer, P.I.; Blavier, J.; Deutscher, N.M.; Macatangay, R.; Notholt, J.; Roehl, C.; et al. Atmospheric carbon dioxide retrieved from the Greenhouse gases Observing Satellite (GOSAT): Comparison with ground-based TCCON observations and GEOS-Chem model calculations. J. Geophys. Res. Atmos. 2012, 117. [Google Scholar] [CrossRef]
- Karbasi, S.; Abdi, A.H.; Malakooti, H.; Orza, J. Atmospheric CO2 column concentration over Iran: Emissions, GOSAT satellite observations, and WRF-GHG model simulations. Atmos. Res. 2025, 314, 107818. [Google Scholar] [CrossRef]
- Fan, H.; Zhao, C.F.; Yang, Y.K.; Yang, X.C.; Wang, C.Y. Impact of emissions from a single urban source on air quality estimated from mobile observation and WRF-STILT model simulations. Air Qual. Atmos. Health 2021, 14, 1313–1323. [Google Scholar] [CrossRef]
Disclaimer/Publisher’s Note: The statements, opinions and data contained in all publications are solely those of the individual author(s) and contributor(s) and not of MDPI and/or the editor(s). MDPI and/or the editor(s) disclaim responsibility for any injury to people or property resulting from any ideas, methods, instructions or products referred to in the content. |
© 2025 by the authors. Licensee MDPI, Basel, Switzerland. This article is an open access article distributed under the terms and conditions of the Creative Commons Attribution (CC BY) license (https://creativecommons.org/licenses/by/4.0/).