Abstract
The aim of this research work was to optimize the chemical treatment of two biomass materials, spent coffee grounds (SCGs) and date pits (DPs), for their use as adsorbents in the removal of methylene blue (MB). The treatment was carried out using sodium hydroxide (NaOH) following a two-level full factorial design, varying the activating solution concentration, activation time, and activation temperature. Only the model based on SCG proved statistically significant. The optimal pretreatment conditions (0.2 M, 5.5 h, 22 °C) yielded an adsorption capacity of 140.23 mg·g−1. The optimal material was characterized by FTIR, BET, SEM, and pHpzc analyses. The effects of pH (1–11), initial concentration (5–300 mg·L−1), adsorbent dose (0.25–2 g·L−1), contact time (0–420 min), and temperature (22–50 °C) on MB adsorption onto the optimal adsorbent were investigated. Adsorption was enhanced by increasing the pH, contact time, and initial concentration, but decreased with higher adsorbent dose and temperature. Kinetic analysis revealed that the pseudo-second-order model best described the data (R2 = 0.96), with a notable contribution from intraparticle diffusion (R2 = 0.98). The Sips model (R2 = 0.99) adequately represented the adsorption isotherm. These findings confirm the strong potential of this biosorbent for the removal of cationic dyes from aqueous solutions.
1. Introduction
Water is an essential natural resource, not only for sustaining life but also for supporting human activities such as agriculture, industry, and urban development. However, access to clean and sufficient water is increasingly threatened, particularly in developing countries where adverse climatic conditions, combined with growing anthropogenic pressures, exacerbate water scarcity [1]. At the same time, the intensification of industrial, agricultural, and urban activities has led to a significant increase in water pollution due to the discharge of untreated effluents. These wastewaters contain a wide range of harmful organic and inorganic contaminants, including synthetic dyes and heavy metals, which are known to cause serious environmental and public health problems [2,3].
Synthetic dyes, widely used in the textile, leather, paper, and plastic industries, are among the most problematic pollutants. Due to their high chemical stability, resistance to biodegradation, and intense coloration even at low concentrations, these substances persist in aquatic environments, severely affecting water quality and aquatic life. Their effective removal has therefore become a major environmental concern and a focus of ongoing research in the field of wastewater treatment [4,5,6].
To address this challenge, various treatment technologies have been developed, including biological methods (using microorganisms, algae, or enzymes), chemical processes (such as Fenton reactions and advanced oxidation processes), and physical techniques (such as filtration, reverse osmosis, and adsorption). Among these, adsorption stands out for its simplicity, efficiency, and ability to remove contaminants even at low concentrations. It requires minimal infrastructure and offers rapid treatment, making it an attractive option. However, the widespread application of conventional adsorbents like activated carbon is hindered by high production costs and difficulties related to regeneration [7,8].
As a result, increasing attention has been directed toward the development of low-cost, eco-friendly alternatives derived from agricultural biomass [9]. These materials are abundantly available, inexpensive, and often biodegradable, making them suitable candidates for sustainable wastewater treatment. Several agricultural waste materials have shown promising adsorption capabilities for a variety of pollutants, including dyes, heavy metals, organic compounds, and certain gases. Notable examples include Rauvolfia tetraphylla leaves [10], orange peels [11], Neolamarckia cadamba waste pulp [12], Chili stalks [13], bamboo leaves [14], and cockle shells [15,16].
However, raw biomass materials often exhibit limited adsorption efficiency due to their low surface area, poor porosity, and the scarcity of active binding sites. To overcome these limitations, various modification techniques have been applied, among which chemical treatment is particularly effective. Such treatment enhances the structural properties of lignocellulosic materials by increasing their surface area and porosity and by altering their surface functional groups, thus improving their affinity toward the targeted pollutants [17]. The efficiency of this process depends strongly on operating parameters such as the type and concentration of the activating agent, activation temperature, and contact time, which vary widely from one study to another—often without clear methodological justification. These variations significantly affect the performance of the resulting biosorbent.
In this context, the present work aims to optimize the conditions of chemical treatment. Spent coffee grounds (SCGs) and date pits (DPs), two abundant and readily available agricultural waste materials in Algeria, were selected as raw materials owing to their low cost and ease of collection. In this study, the key treatment parameters—including the concentration of the activating agent, activation temperature, and activation time—were optimized using a full factorial experimental design. This statistical approach not only enables the identification of optimal treatment conditions but also reduces the number of experiments and provides valuable insights into the interactions among influencing factors [18]. Furthermore, the efficiency of these activated biomass materials in removing methylene blue (MB), a toxic cationic dye widely used in industrial processes and a standard model pollutant in adsorption studies [19], was evaluated using various analytical techniques.
A comprehensive adsorption study was then conducted using batch experiments to assess the influence of operational parameters such as pH, contact time, initial dye concentration, adsorbent dosage, and temperature on the performance of the optimized biosorbent. The adsorption mechanism was analyzed to determine the most appropriate model for describing methylene blue adsorption under the studied conditions.
2. Materials and Methods
2.1. Materials and Chemicals
The SCG were collected from a coffee shop in Oran (Algeria), while DP were obtained from domestic sources. Both raw materials were thoroughly washed several times with tap water to remove impurities, followed by rinsing with distilled water, and then oven-dried. The DP were subsequently milled into a fine powder using a Retsch SK 100 grinder (Haan, Germany). The resulting samples were denoted as RSCG (raw spent coffee grounds) and RDP (raw date pits).
Both biomasses were then subjected to chemical treatment with sodium hydroxide (NaOH) to enhance their adsorption performance. The choice of alkaline treatment was guided by preliminary tests, which showed superior results compared to acid treatment. These findings are consistent with literature reports indicating that NaOH treatment increases porosity, introduces oxygenated surface functional groups, and improves affinity toward polar pollutants [20,21,22].
2.2. Full Factorial Experimental Design
To systematically evaluate the influence of key activation parameters, a full factorial 23 design was employed. This approach allows the simultaneous study of multiple factors and their interactions, providing deeper insights compared to the traditional one-factor-at-a-time method while reducing the number of required experiments [18]. In alkaline chemical activation, the concentration of the activating agent, the activation temperature, and the activation time are the three independent parameters that primarily govern the formation of porosity and surface functional groups [23]. The selected ranges for NaOH concentration (0.2–0.7 M), activation temperature, and activation time (1.5–5.5 h) were defined based on preliminary trials, which helped identify operational intervals that ensure effective activation without excessive degradation of the material. Each factor was investigated at two levels, with three center-point replicates added to estimate experimental error, resulting in a total of 11 experiments. The selected ranges and levels are summarized in Table 1. The response variable was defined as the maximum adsorption capacity of methylene blue (MB).

Table 1.
Experimental domain and levels of the studied factors.
After treatment, the materials were thoroughly washed with distilled water until neutral pH was reached, then dried at 60 °C to constant weight, ground, and sieved. Only the particle size fraction between 1 mm and 500 µm was retained for adsorption experiments.
2.3. Adsorption Experiment
MB adsorption onto the biosorbents was conducted in batch mode. For each experiment, 25 mg of adsorbent was suspended in 25 mL of MB solution at a defined initial concentration. The flasks were tightly sealed and placed on a multi-position magnetic stirrer at room temperature for 24 h to ensure optimal contact between the adsorbent and the solution.
After stirring, the suspensions were centrifuged to separate the solid phase. The residual dye concentration was then measured by UV-Visible spectrophotometry at 665 nm. The amount of dye adsorbed was calculated using the following equation:
where Qt is the amount of dye adsorbed at time t (mg·g−1), C0 is the initial dye concentration (mg·L−1), Ct is the residual dye concentration at time t (mg·L−1), V is the volume of the solution (L), and m is the mass of the adsorbent (g).
The dye removal efficiency can also be expressed as a percentage (R%) using the following equation:
The analysis of the adsorption results allowed the identification of the optimal chemical treatment conditions for the biosorbent. The material thus optimized was selected for the continuation of the study. This second part of the work is devoted to its detailed characterization, as well as to the investigation of the influence of various physicochemical parameters on the adsorption efficiency of methylene blue.
2.4. Characterization of the Optimized Material
The characterization of the optimized material was carried out using several analytical techniques. The specific surface area and pore structure characteristics were determined using a Micromeritics ASAP 2020 analyzer at the Centre de Recherche Scientifique et Technique en Analyses Physico-Chimiques (CRAPC) in Tipaza, Algeria. Prior to the analysis, the sample was automatically degassed to eliminate moisture and volatile compounds that could interfere with gas adsorption. The interpretation of the adsorption/desorption isotherm was performed using two methods: the Brunauer–Emmett–Teller (BET) method to calculate the total specific surface area, and the Barrett–Joyner–Halenda (BJH) method to estimate pore size distribution and total pore volume. Morphological observation was performed using scanning electron microscopy (SEM) at the École Nationale Polytechnique de Constantine, by dispersing the adsorbent powder onto a carbon adhesive disk mounted on a sample holder. Surface functional groups were identified by Fourier-transform infrared spectroscopy (FTIR) using a Shimadzu IRAffinity-1S spectrometer (Kyoto, Japan), covering a spectral range of 400 to 4000 cm−1, in order to identify chemical bonds likely to interact with the target pollutants. Finally, the determination of the pH at the point of zero charge (pHpzc) was carried out by adjusting distilled water to initial pH values ranging from 2 to 11 using HCl (0.1 M) or NaOH (0.1 M) solutions, while keeping other parameters constant (1 g·L−1 of biosorbent, at room temperature of 23 ± 2 °C for 24 h).
2.5. Effect of Physicochemical Parameters on Methylene Blue Adsorption
The influence of several physicochemical parameters on the adsorption of methylene blue by the optimal biosorbent was systematically investigated. The effect of adsorbent dosage was evaluated by varying the adsorbent/adsorbate ratio (r) from 0.25 to 2 g·L−1, at unadjusted pH, with an initial dye concentration of 125 mg·L−1, under constant stirring at room temperature (22 ± 2 °C) until equilibrium. The effect of initial pH was examined over a range of 1 to 11, adjusted using HCl or NaOH solutions, with a fixed ratio of r = 1 g·L−1 and the same operating conditions. Kinetic studies were carried out by contacting 500 mg of biosorbent with 500 mL of dye solution at 125 mg·L−1, at natural pH (5.5) and under continuous agitation; samples were withdrawn at regular time intervals, centrifuged, and analyzed by spectrophotometry. Finally, the influence of temperature was investigated at 22, 30, and 50 °C, under the same experimental conditions, in order to determine the thermodynamic nature of the process.
2.6. Kinetic and Isotherm Studies
Kinetic modeling provides insights into the time-dependent behavior of adsorption and helps identify the most suitable model for evaluating the performance of adsorbent materials. In this study, the experimental data were fitted to the four most commonly used kinetic models: pseudo-first-order, pseudo-second-order, Elovich, and intraparticle diffusion, as represented by the following equations [24]:
Here, (mg·g−1) is the amount of dye adsorbed at equilibrium, (mg·g−1) is the amount adsorbed at time t, K1 (min−1), K2 (g·mg−1·min−1), and Kint (mg·g−1·min−0.5) are the rate constants of the pseudo-first order, pseudo-second order, and intraparticle diffusion models, respectively. α (mg·g−1·min−1) is the initial adsorption rate, and β (g·mg−1) is the desorption constant. The constant C gives an indication of the boundary layer thickness.
To better understand the adsorption mechanism and identify the most suitable isotherm model for methylene blue retention by the optimal biosorbent, three theoretical isotherm models were applied: Langmuir [24], Freundlich [24], and Sips [25], as follows:
where (mg·g−1) represents the maximum adsorption capacity, KL (L·mg−1) is the Langmuir constant, KF (mg·g−1) (L·mg−1)1⁄n and n are the Freundlich constants representing adsorption capacity and intensity, respectively. KS (L·mg−1) and ms are the Sips model constants.
All fittings were performed using OriginPro software 2018 (9.6), based on the minimization of the sum of squared errors.
2.7. Thermodynamic Analysis Methods
To understand the nature of the adsorption process, it is crucial to evaluate key thermodynamic parameters, including the standard enthalpy change (ΔH° in J·mol−1), the entropy change (ΔS° in J·mol−1·K−1), and the standard Gibbs free energy change (ΔG° in J·mol−1). These parameters provide insight into whether the process is spontaneous and endothermic or exothermic. They are calculated using the following relations [2]:
R represents the universal gas constant (8.314 J·mol−1·K−1), T is the absolute temperature expressed in Kelvin, KC denotes the thermodynamic equilibrium constant (L·g−1), ρ is the density of water (g·L−1).
3. Results and Discussion
3.1. Optimization of Biosorbent Treatment Conditions
3.1.1. Experimental Matrix
In most studies reported in the literature the chemical treatment of biomass follows a standardized protocol applied uniformly, without a clear justification for the choice of operating conditions. However, our preliminary experiments showed that these conditions significantly affect the adsorption performance of the biosorbents and strongly depend on the type of biomass. To address this, a factorial experimental design was employed to evaluate the effects of NaOH concentration, treatment time, and treatment temperature on the maximum adsorption capacity of methylene blue (Qₘ). The experimental conditions and corresponding responses are summarized in Table 2.
Table 2.
Full factorial experimental design matrix and corresponding responses.
The treatments applied according to the experimental matrix confirmed the influence of operating conditions on adsorption performance. Figure 1 clearly illustrates this effect by comparing the methylene blue adsorption isotherms of the raw biomasses with those of two activated samples: one exhibiting the highest performance and the other the lowest. For SCG, sample SCG3 (experiment 3) shows a significant improvement relative to the raw material (RSCG), whereas sample SCG5 (experiment 5) does not exhibit any notable change. A similar trend is observed for DP: only sample DP8 (experiment 8) demonstrates a marked increase in adsorption capacity, while DP1 (experiment 1) performs comparably to the raw biomass (RDP).
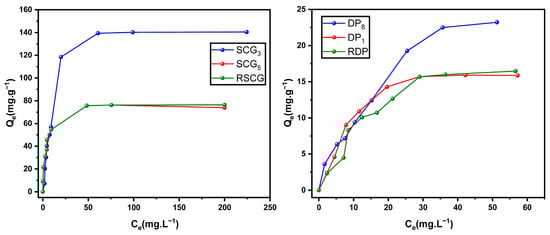
Figure 1.
Adsorption isotherms of methylene blue on raw and activated biomasses (pH = 5.5, T = 22 °C, r = 1 g L−1, 5 ≤ C0 ≤ 300 mg L−1).
These observations clearly demonstrate that the effectiveness of chemical treatment is highly dependent on the specific operating conditions, which vary according to the type of biomass. As a result, optimal treatment parameters for one biomass may not be applicable or effective for another, highlighting the need for tailored activation protocols. Consequently, certain treatments may fail to enhance adsorption performance relative to the raw material.
In the case of spent coffee grounds, the optimized activation conditions applied in this study markedly enhance the adsorption performance of SCG3 compared with values commonly reported in the literature. Nascimento et al. [26] reported a maximum MB adsorption capacity of 40.85 mg·g−1 for thermally modified coffee grounds, whereas Nitayaphat et al. [27] and Franca et al. [28] reported only 4.68 mg·g−1 and 18.7 mg·g−1, respectively, for MB adsorption on raw coffee residues.
3.1.2. Analysis of Experimental Results
Mathematical Modeling
The statistical analysis of the experimental data was carried out using Minitab 18 software (Minitab, LLC, State College, PA, USA). The resulting mathematical models, expressed in uncoded units, are presented in Equations (13) and (14) below:
Qm(SCG) = 29.2 + 135.9C + 22.63t + 0.007Ta − 31.13C.t − 0.623C·Ta − 0.0565t·Ta + 8.15CP
Qm(DP) = 17.8 + 7.3C − 1.65t + 0.030Ta + 1.24C.t − 0.180C·Ta + 0.0268t·Ta − 0.78CP
C: NaOH concentration (M), t: activation time (h), Tₐ: activation temperature (°C), CP: dummy variable associated with the center-point runs, equal to 1 at the design center and 0 for all other experimental conditions.
Model Fitting Quality and Validation of DP
The analysis of the model developed for methylene blue adsorption onto DP did not yield a statistically satisfactory fit, as shown by a number of tests. First, the analysis of the determination coefficients indicates an R2 value of 42.02%, meaning that the model explains only about 42% of the response variability. More concerning is the adjusted R2 value, which is zero, indicating a complete lack of predictive power [29]. Unlike the classical R2, the adjusted R2 accounts for the number of factors included in the model and may decrease when irrelevant variables are added [29,30]. An adjusted R2 value equal to or less than zero suggests that the model does not provide any improvement over a simple mean-based estimation [31]. Moreover, a marked difference between R2 and adjusted R2 may indicate the presence of non-significant terms [30,32]. Next, the Student’s t-test applied to the model coefficients was used to assess the individual significance of the factors. At a 5% significance level, a factor is considered significant if the observed t-statistic (tobs) is greater than or equal to the critical value (tcrit = 3.182) [33]. The results presented in Table 3 show that neither the main effects nor the interactions exceed this threshold, confirming their lack of significance. Finally, the Fisher test (ANOVA) was used to evaluate the overall validity of the model. The observed value Fobs = 0.31 is much lower than the critical value Fcrit = 8.89, indicating that the model as a whole is not statistically significant [31]. This conclusion is supported by the ANOVA table results (Table 4). In summary, all statistical analyses lead to the same conclusion: the linear model proposed for DP lacks both predictive validity and statistical relevance, and therefore cannot be retained for modeling the adsorption process. A more advanced approach using response surface methodology would be necessary. However, considering that the treatment does not significantly improve the performance of the DP—with a maximum adsorption capacity not exceeding 23.3 mg g−1 this chemical treatment appears to be of limited interest.
Table 3.
Student’s t-test values for the model coefficients for DP.
Table 4.
Results of the analysis of variance (ANOVA) for the maximum adsorption capacity of DP.
Model Fitting Quality and Validation of SCG
- ❖
- Main Effects of different factors
The analysis of the main effects plot (Figure 2) shows that the activating agent concentration has a negligible effect on the response, which remains virtually constant throughout all tested levels. In contrast, activation time and temperature show pronounced slopes, indicating a significant influence on the biosorbent’s adsorption capacity.
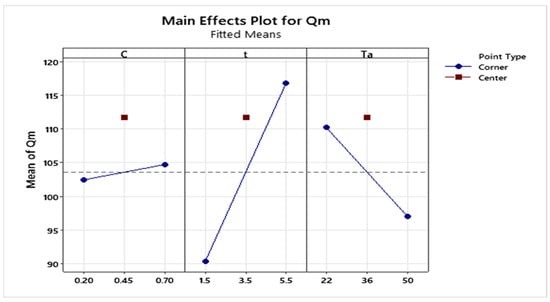
Figure 2.
Main effects plot of the factors on the maximum adsorption capacity of MB onto SCG.
- ❖
- Interaction effects of different factors
The interaction plot (Figure 3) highlights a significant interaction between concentration and time, as shown by the crossing of the curves. Conversely, the curves representing the interactions between concentration and temperature, as well as between time and temperature, are nearly parallel, suggesting no notable interaction between these factors.
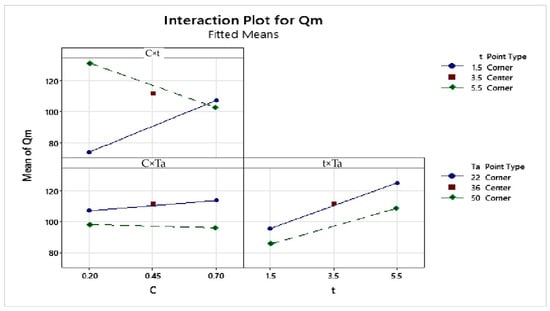
Figure 3.
Interaction effects plot of the factors on the maximum adsorption capacity of MB onto SCG.
- ❖
- Student’s t-Test
The analysis of the Pareto chart (Figure 4) shows that activation time and temperature are the most influential factors on the response, with their tobs values exceeding the critical value tcrit = 3.182, confirming their significant effect. In contrast, the tobs value associated with NaOH concentration remains below this critical threshold, indicating that this factor has no notable influence under the experimental conditions used in this study [33].
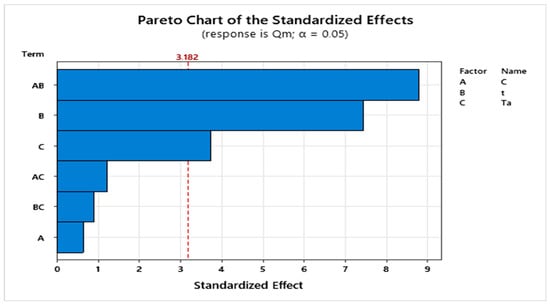
Figure 4.
Pareto chart of standardized effects.
- ❖
- Analysis of Variance (ANOVA)
The results of the analysis of variance (ANOVA), presented in Table 5, show that the mathematical model (Equation (13)) adequately describes the response as a function of the variables studied. The F value (Fobs) observed does indeed exceed the critical value (Fcrit), thus confirming the model’s statistical significance [31]. Furthermore, the coefficients of determination R2 (98.11%) and adjusted R2 (93.69%) indicate a good fit [34]. Since the gap between them is less than 5%, the presence of non-significant terms can be excluded [30]. In addition, the low value of the residual standard deviation (S = 5.00265) confirms the model’s predictive accuracy [34].
Table 5.
Fisher test results (ANOVA) for SCG.
In summary, the statistical analyses confirm that model (13) is valid. The obtained p-value (p = 0.000), well below the significance threshold of 0.05, also confirms the overall significance of the model [35]. The results highlight the predominant influence of activation temperature and time on the amount adsorbed. Conversely, NaOH concentration showed no significant effect within the tested range (0.2–0.7 M), suggesting that it could be excluded from the model without compromising its predictive capacity.
- ❖
- Response Optimization
The objective of this step is to determine the optimal combination of factors that maximizes the adsorption capacity of methylene blue onto the activated biosorbent (Figure 5). Based on the experimental results and the statistical analysis of model (13), the optimal conditions were identified as follows: NaOH concentration of 0.2 M (low level), activation time of 5.5 h (high level), and activation temperature of 22 °C (low level). Under these conditions, the predicted maximum adsorption capacity is 137.20 mg·g−1. This set of parameters corresponds to experiment 3, which achieved the highest adsorption performance among all tests. The corresponding material, designated SCG3, was therefore selected for subsequent experimental investigations.
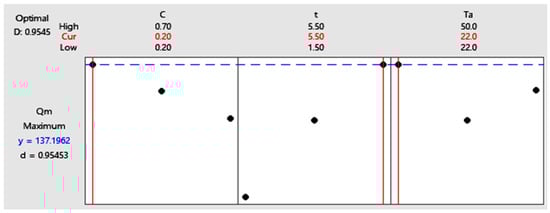
Figure 5.
Response optimization chart obtained using Minitab.
3.2. Characterization of Materials
3.2.1. Physical Characterization
Characterization by Gas Adsorption–Desorption
The main textural parameters of the biosorbent are summarized in Table 6. BET analysis indicates a specific surface area of 37.44 m2·g−1, with an excellent coefficient of determination (R2 = 0.99). The total pore volume is estimated at 0.0240 cm3·g−1, and the average pore diameter, calculated using the BJH method, is 4.39 nm, indicating the mesoporous nature of the material. This porous structure is particularly suitable for the adsorption of intermediate-sized organic molecules such as methylene blue, which has molecular dimensions of approximately 1.7 × 0.76 nm and a thickness of 0.325 nm, corresponding to an average surface area of 1.30 nm2 per molecule [36].
Table 6.
Results of BET and BJH analyses.
In comparison to other biosorbents, SCG3 exhibits a much better performance. Its specific surface area is substantially higher than those reported for Moringa oleifera (4.01 m2·g−1) [37] and Crab Shell (13.4 m2·g−1) [38], while its adsorption capacity for methylene blue reaches 140 mg·g−1. By contrast, raw wild carob [4], although exhibiting a slightly higher porosity (79 m2·g−1), achieves a maximum adsorption capacity of only 78.8 mg·g−1. This evidence suggests that the exceptional adsorption performance of SCG3 cannot be ascribed solely to its porous texture; rather, it is also governed by the chemical characteristics of its surface, particularly the presence of active functional groups capable of establishing interactions with the target molecules.
Characterization by Scanning Electron Microscopy (SEM)
The scanning electron microscopy (SEM) analysis of SCG3 reveals a highly irregular surface morphology with well-developed porosity (Figure 6). Pores of various sizes are observed, predominantly macroporous in nature, indicating a heterogeneous porous structure. This morphology is favorable for adsorption, as it facilitates the diffusion of dye molecules toward internal active sites, thereby enhancing the overall performance of the material.
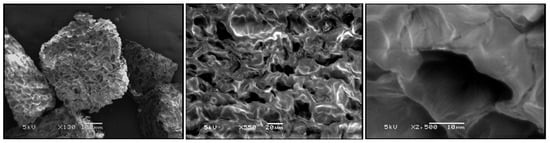
Figure 6.
SEM images of SCG3.
3.2.2. Chemical Characterization
Characterization of Surface Functional Groups by FTIR Spectroscopy
To achieve a more comprehensive identification of the surface functional groups of the biosorbent, its structure was analyzed using Fourier-transform infrared (FTIR) spectroscopy. The spectra obtained for SCG3 before and after MB adsorption (SCG3) are presented in Figure 7. Table 7 summarizes the characteristic functional groups identified on the biosorbent surface, along with their corresponding nature and wavenumbers.
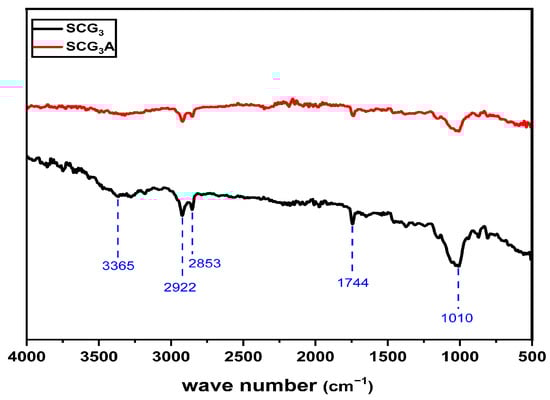
Figure 7.
FTIR spectra of SCG3 before and after adsorption.
The FTIR spectra of the biosorbent before and after MB adsorption shows significant modifications, highlighting the involvement of specific functional groups in the adsorption process. The disappearance of the absorption band at 3365 cm−1, attributed to the stretching vibrations of O–H bonds, suggests interactions between MB ions and hydroxyl groups on the biosorbent surface. This interaction may be due to complexation with O− sites or disruption of intra- and intermolecular hydrogen bonding in biopolymers such as cellulose, hemicellulose, and lignin [39]. The high polarity of hydroxyl groups promotes the formation of new hydrogen bonds with the positively charged sulfur atoms (≡S+) of the dye.
A marked decrease is also observed in the band at 1744 cm−1, corresponding to the stretching vibrations of carbonyl groups (C=O), indicating their probable involvement in hydrogen bonding or dipole–dipole interactions with the cationic sites of MB. Similarly, the reduced intensity of the band at 1010 cm−1, associated with C–O vibrations (present in alcohols, acids, esters, and phenols), confirms their participation in the adsorption process, most likely through hydrogen bonding.
Overall, these findings confirm that MB adsorption onto the SCG3 material is primarily governed by electrostatic interactions and hydrogen bonding between the surface functional groups and the cationic sites of the dye.
Table 7.
Surface functional groups of SCG3 identified by FTIR spectroscopy.
Table 7.
Surface functional groups of SCG3 identified by FTIR spectroscopy.
| Wave Number (cm−1) | In the Bibliography | Type of Vibration |
|---|---|---|
| 3365 | 3600–3300 | O–H stretching vibrations of Hydroxyl (carboxylic acids, alcohols and phenols) and O–H stretching vibrations of cellulose, pectin, absorbed water and lignin [40,41,42] |
| 2922–2853 | 3000–2800 | Symmetric and asymmetric C–H stretching vibrations of aliphatic molecules [43] |
| 1744 | 1729 | Stretch of C=O [44] |
| 1010 | 1350–900 | C–O stretching vibrations in alcohols, phenols, acids, ethers or ester [41,42] |
pH at the Point of Zero Charge (pHpzc)
The point of zero charge (pHpzc) refers to the pH at which the surface of the material carries a net zero electrical charge. This is a key parameter for understanding the electrostatic interactions between the adsorbent surface and the ionic species in solution [45]. For SCG3, the pHpzc was determined to be 5.42, as shown in Figure 8, indicating an acidic surface character that favors the adsorption of cationic molecules such as methylene blue at pH values above this point.
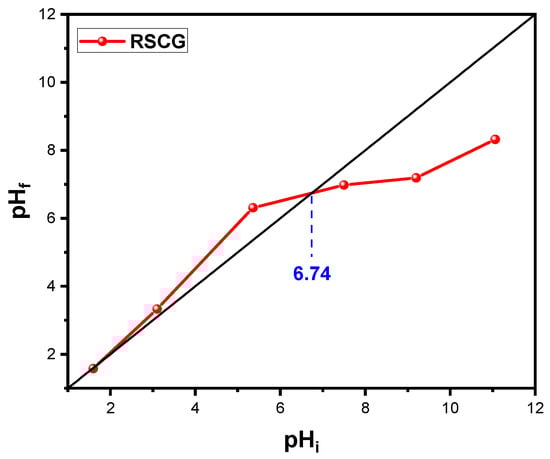
Figure 8.
Isoelectric points of RSCG and SCG3 (t = 24 h, T = 22 °C, r = 1 g·L−1).
In comparison, the pHpzc of the raw material (RSCG) was estimated at 6.74, indicating an initially neutral surface. The decrease in pHpzc after chemical treatment with NaOH reflects an enrichment of the surface with acidic functional groups. As reported by İbrahim Teğin [22], NaOH activation of pistachio green hulls promotes the introduction of oxygen-containing groups such as carboxyl (–COOH) and carbonyl (C=O) functions. This modification is confirmed by FTIR spectra, which display more intense absorption bands associated with O–H, C=O, and C–O vibrations. These functional groups, particularly carboxylic acids and phenols, can release protons (H+), thereby increasing surface acidity and accounting for the observed decrease in the pHpzc.
3.3. Evaluation of the MB Adsorption Performance onto SCG3
3.3.1. Effect of pH
pH is a crucial factor in adsorption studies, as it influences both the chemical structure of the adsorbent and the adsorbate, as well as the interaction mechanism between them. It is therefore essential to assess the adsorption efficiency over a range of pH values. The results shown in Figure 9 indicate that the adsorption capacity increases with the rising of the pH. This behavior can be attributed to the fact that, at a pH higher than the pHpzc, the biosorbent surface becomes negatively charged, while the dye molecules carry a positive charge. This promotes adsorption through electrostatic interactions between oppositely charged adsorbent surfaces and dye ions. Conversely, at low pH values, the sorbent surface is surrounded by H+ ions, which compete with the dye cations for the available adsorption sites, thereby reducing the effectiveness of adsorption. However, operating at high pH levels can raise environmental concerns when treating wastewater. For this reason, a balance must be found between adsorption performance and environmental compliance. A neutral pH (around 7) is generally recommended, as it offers good adsorption efficiency while minimizing ecological impact.
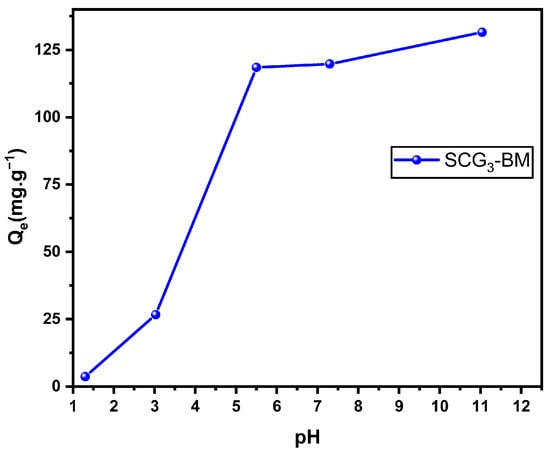
Figure 9.
Effect of initial pH on the adsorption capacity of MB onto SCG3 (C0 = 125 mg·L−1, T = 22 °C, r = 1 g·L−1).
3.3.2. Effect of Contact Time
Figure 10 illustrates the evolution of the amount adsorbed (Qt) as a function of contact time. The resulting curve exhibits a typical profile observed in the adsorption of cationic dyes: a rapid initial phase, followed by a gradual decrease in the adsorption rate until equilibrium is reached. The steep slope during the initial stage indicates a strong affinity between the adsorbent and the dye molecules, due to the abundance of readily accessible active sites on the adsorbent surface. Subsequently, the adsorption rate slows down, likely due to the progressive occupation of available sites and the emergence of repulsive forces between the dye molecules already adsorbed and those remaining in solution. Equilibrium is reached after approximately 4 h, indicating a relatively fast adsorption process. This behavior is consistent with the findings of Bounaas et al. [2], as well as those reported by Marrakchi et al. [46] and Bentahar [47] in similar studies on dye removal using biomaterials.
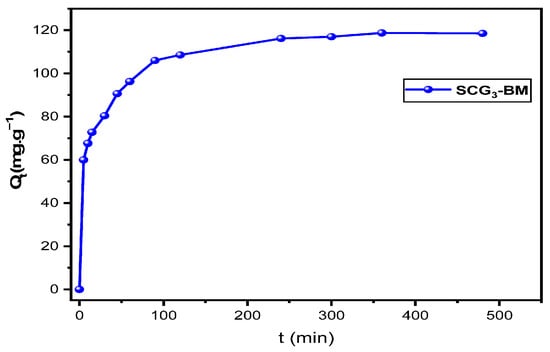
Figure 10.
Adsorption kinetics of MB onto SCG3 (C0 = 125 mg L−1, pH = 5.5, T = 22 °C, r = 1 g L−1).
3.3.3. Effect of Adsorbent Dosage
The study of the adsorbent/adsorbate ratio’s influence on MB adsorption revealed a marked increase in removal efficiency (R%), from 32.09% to 93.53%, with increasing adsorbent dosage (Figure 11). This improvement is attributed to the greater availability of active sites on the surface of SCG3 as the adsorbent mass increases [48,49]. However, the adsorption capacity per unit mass (Qe) decreased with higher solid-to-liquid ratios, dropping from 177.7 to 64.74 mg·g−1. This decline can be explained by the incomplete saturation of adsorption sites [50], by the reduction in the concentration gradient between the bulk solution and the adsorbent surface [51], and by the particle agglomeration that limits the available surface area [52]. The optimal balance between removal efficiency and adsorption capacity was obtained at a solid-to-liquid ratio of 1 g·L−1, corresponding to R% = 85.58% and Qe = 118.49 mg·g−1.
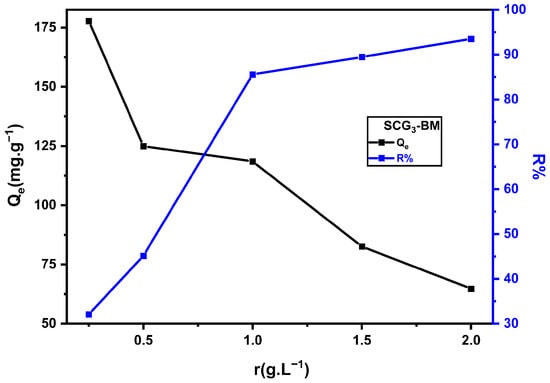
Figure 11.
Effect of SCG3 dosage on MB adsorption (C0 = 125 mg·L−1, pH = 5.5, T = 22 °C).
3.3.4. Effect of Temperature
Figure 12 presents the effect of the temperature on the adsorption of MB by the SCG3 material. The thermodynamic study indicates that the adsorption process is exothermic, as evidenced by the marked decrease in adsorption capacity with increasing temperature. This behavior may result from the weakening of electrostatic interactions between the MB molecules and the active sites of the adsorbent, the increased solubility of the dye in the aqueous medium, or by the possible alterations in the surface properties of the adsorbent [53]. Similar trends have been reported by Bounaas et al. [7] Dogar et al. [54] and Zhang et al. [55] for other biosorbent systems. Consequently, the highest adsorption performance is obtained at room temperature, which can be considered optimal for this system.
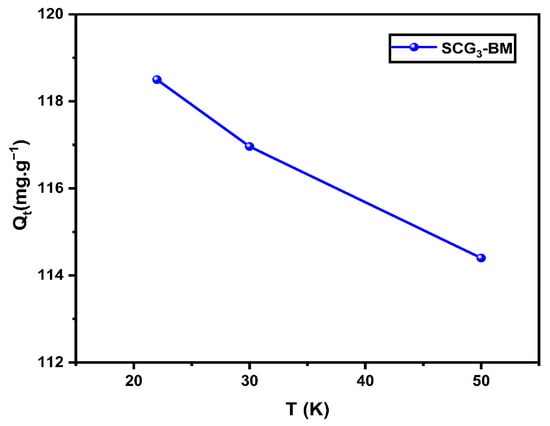
Figure 12.
Effect of temperature on MB adsorption onto SCG3 (C0 = 125 mg·L−1, pH = 5.5, r = 1 g·L−1).
3.4. Thermodynamic Analysis
The evaluation of thermodynamic parameters is essential for understanding the nature and feasibility of the adsorption process. In this study, the effect of temperature was investigated through the calculation of the standard enthalpy (ΔH°), standard entropy (ΔS°), and Gibbs free energy (ΔG°), using the relationship between ln(Kc) and the inverse of the absolute temperature (1/T), as shown in Figure 13. The corresponding values are presented in Table 8. The negative value of ΔH° confirms the exothermic nature of methylene blue (MB) adsorption onto the SCG3 biosorbent, and its low magnitude (<20 kJ·mol−1) suggests that the process is governed by physical interactions. The Gibbs free energy (ΔG°) is negative across all temperatures studied, indicating that the process is spontaneous and thermodynamically favorable. Furthermore, the positive value of ΔS° suggests an increase in disorder at the solid–liquid interface, likely due to the displacement of water molecules initially hydrating the dye ions, which are replaced by interactions with the biosorbent’s active sites. This increase in entropy also reflects a favorable affinity between the adsorbent and the adsorbate [40]. Overall, these findings demonstrate that MB adsorption onto SCG3 is a spontaneous, exothermic process dominated by physical interactions and accompanied by an entropy gain at the interface. These thermodynamic trends are consistent with findings reported for methylene blue adsorption onto other lignocellulosic biomasses [7,56].
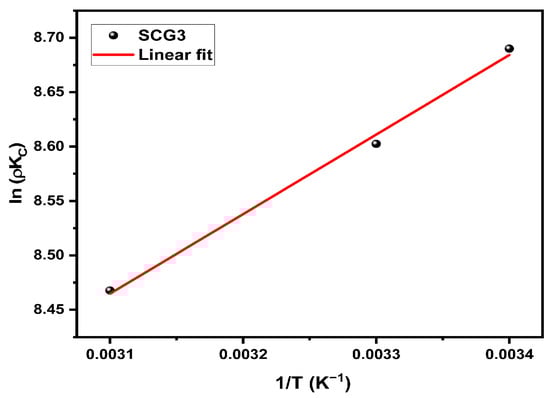
Figure 13.
Van’t Hoff plots for MB adsorption onto SCG3.
Table 8.
Thermodynamic parameters of MB adsorption onto SCG3.
3.5. Adsorption Kinetic Modeling
The adsorption process typically proceeds through successive stages: (i) external diffusion of dye molecules across the boundary layer surrounding the adsorbent particles, (ii) intraparticle diffusion through the pores, and (iii) interaction with the active adsorption sites. In this study, the mechanical stirring applied during the experiments minimizes external mass transfer resistance, thereby emphasizing intraparticle transport and surface interactions.
To describe the kinetics of MB adsorption onto SCG3, four models were evaluated: pseudo-first-order (PFO), pseudo-second-order (PSO), and Elovich models, all fitted using their nonlinear forms, and the intraparticle diffusion model, fitted using its linear form. The non-linear fits of the PFO, PSO, and Elovich models are presented in Figure 14, with the corresponding kinetic parameters in Table 9. Model selection was based on the coefficient of determination (R2) and the agreement between theoretical (Qe,th) and experimental (Qe,exp) equilibrium adsorption capacities. Although the PFO model provides an acceptable fit, the PSO model offers better performance, with R2 = 0.96 and Qe,th (115.40 mg·g−1) closely matching Qe,exp (118.49 mg·g−1). The Elovich model also exhibits an excellent fit (R2 = 0.99), indicating a high initial adsorption rate (α = 181.02 mg·g−1·min−1) and a low desorption activation energy (β = 0.07 g·mg−1), consistent with a rapid uptake during the initial phase.
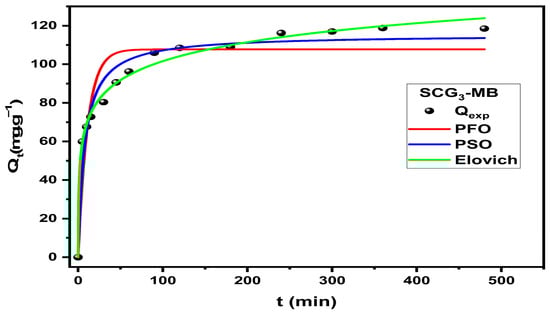
Figure 14.
Nonlinear fit of the PFO, PSO, and Elovich models of MB adsorption onto SCG3.
Table 9.
Kinetic parameters of MB adsorption onto SCG3.
The intraparticle diffusion plots in Figure 15 displays two distinct linear regions, indicating that the adsorption mechanism is governed by two successive stages. The first, steeper segment corresponds to rapid dye penetration into the outer surface and macropores, while the second, gentler slope reflects the gradual approach to equilibrium as molecules diffuse deeper into the micropores and adsorption sites become saturated. The parameters for this model are reported in Table 10.
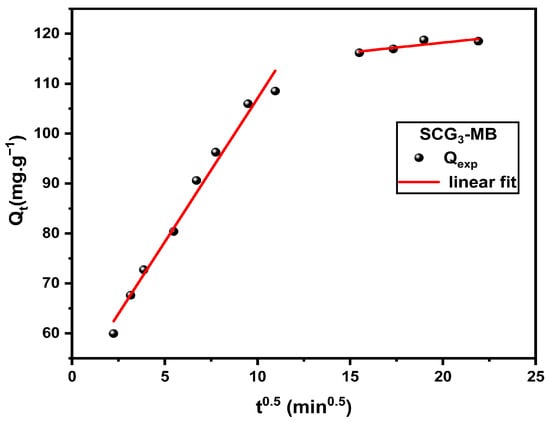
Figure 15.
Intraparticle diffusion models of MB adsorption onto SCG3.
Table 10.
Parameters of the intraparticle diffusion models of MB adsorption onto SCG3.
3.6. Adsorption Isotherm Modeling
Adsorption isotherms are essential for understanding the adsorption mechanism and selecting the most suitable adsorbent by evaluating the affinity between the adsorbent and the adsorbate. In this study, the adsorption equilibrium was modeled using the Langmuir, Freundlich, and Sips isotherms, all fitted using their nonlinear forms.
As shown in Figure 16, the experimental data fit all three models reasonably well, with the Langmuir model providing a notable performance, estimating a theoretical maximum adsorption capacity of Qmax,th = 160.65 mg·g−1, which is close to the experimental value Qmax,exp = 140.23 mg·g−1. Although the Freundlich model indicates favorable adsorption (1/n = 0.326), its lower coefficient of determination (R2 = 0.81) limits its applicability to this system.
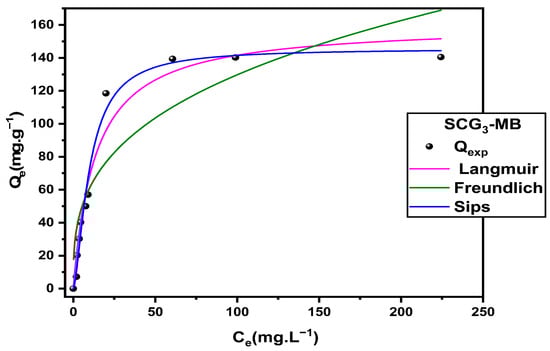
Figure 16.
Nonlinear fitting of the MB adsorption isotherm onto SCG3.
To gain deeper insight into the adsorption process, the three-parameter Sips model was employed. It exhibited the best overall fit, effectively combining the features of the Langmuir and Freundlich models. This hybrid isotherm accounts for surface heterogeneity at low concentrations (Freundlich behavior) and monolayer adsorption at high concentrations (Langmuir behavior) [57]. The maximum adsorption capacity predicted by the Sips model (Qmax,th = 145.59 mg·g−1) is slightly lower than that predicted by Langmuir but closely aligns with the experimental value. This discrepancy can be attributed to the Langmuir model’s assumption of a perfectly homogeneous surface, which often leads to overestimation [58]. In contrast, the Sips model incorporates the energetic heterogeneity of the adsorbent surface, offering a more realistic representation of the adsorption process, especially at higher concentrations. The parameters obtained from the three models are summarized in Table 11, further confirming the suitability of the Sips model in describing this adsorption system.
Table 11.
Parameters of isotherm models for MB adsorption onto SCG3.
To conclude and highlight the performance of our material, Table 12 provides a comparison of the maximum adsorption capacities of methylene blue onto various chemically activated biomasses. According to the presented data, SCG3 exhibits a higher adsorption capacity than many other biosorbents, emphasizing its efficiency and potential as an effective adsorbent material.
Table 12.
Comparison of maximum adsorption capacities of methylene blue (MB) on various chemically activated biomasses.
4. Conclusions
This study was conducted within the framework of valorizing agri-food waste for environmental purposes, particularly for the remediation of water contaminated by industrial dyes. Two abundant biomaterials in our region, spent coffee grounds and date pits, were chemically activated using sodium hydroxide (NaOH) according to a full factorial design at two levels. The main objective was to optimize the conditions of this treatment to improve the adsorption performance of methylene blue (MB). The results showed that NaOH-treated coffee grounds exhibited better adsorption performance than date pits. The optimal treatment conditions—agitation for 5.5 h, temperature of 22 °C, and NaOH concentration of 0.2 M—led to the preparation of the SCG3 material, which achieved an adsorption capacity of 140.23 mg·g−1, confirming its efficiency under simple and economical conditions. Characterization of SCG3 revealed a specific surface area of 37.44 m2·g−1, the presence of functional groups (–OH, C=O, C–O, C–H) involved in the adsorption mechanism, and a point of zero charge (pHpzc) of 5.42, indicating an acidic surface favorable for adsorption in basic media. The study of MB adsorption showed that removal efficiency increased with the adsorbent/adsorbate ratio, whereas the amount adsorbed per unit mass decreased, with an optimal compromise found at 1 g·L−1. The pH of the solution significantly influenced the process, with adsorption being unfavorable in acidic media and strongly enhanced in basic media. Thermodynamic analysis indicated a spontaneous, physical, and exothermic process. Kinetic modeling showed that the pseudo-second-order model best described the adsorption process, while the Elovich model revealed a high initial adsorption rate and low activation energy, confirming the physical nature of the mechanism. Intraparticle diffusion modeling identified two main steps: an initial diffusion of molecules into the solid, followed by adsorption equilibrium where the interaction takes place. Finally, adsorption isotherm modeling showed that the Sips model provided the best fit to the experimental data. Overall, this research highlights the remarkable potential of NaOH-activated coffee grounds as an efficient, low-cost, and readily available biosorbent for the treatment of colored wastewater, promoting the valorization of organic residues as part of sustainable solutions for industrial effluent treatment.
Author Contributions
Conceptualization, M.B. (Meryem Bounaas), M.H., B.G. and K.D.; methodology, M.B. (Meryem Bounaas), W.H., A.B., K.D., M.B. (Mourad Benzina) and M.H.; formal analysis, M.B. (Meryem Bounaas) and A.B.; investigation, B.G. and K.D.; data curation, M.H., M.B. (Meryem Bounaas), K.D. and A.P. (Antonio Panico); writing—original draft preparation, M.B. (Mourad Benzina), A.B., K.D., G.T., A.P. (Antonio Pizzi) and G.T.; writing—review and editing, K.D., A.P. (Antonio Panico) and A.P. (Antonio Pizzi); supervision, K.D., M.B. (Meryem Bounaas) and A.P. (Antonio Pizzi); project administration, M.B. (Meryem Bounaas) and K.D. All authors have read and agreed to the published version of the manuscript.
Funding
This research received no external funding.
Data Availability Statement
The data that support the findings of this study are available on request from the corresponding author.
Acknowledgments
This work was supported by the École Nationale Polytechnique de Constantine (Algeria). The authors would like to express their sincere thanks to Fodil Aoulmi, application engineer at CRAPC, Tipaza, for performing the BET analysis. Special thanks are also extended to Mohamed Redda Boudchicha, lecturer at the École Nationale Polytechnique de Constantine, and to Sabah Boubekri, Principal Engineer of the university laboratories at the same institution, for their valuable contribution to the SEM characterization.
Conflicts of Interest
The authors declare no conflicts of interest.
References
- Ahmed, T.; Zounemat-Kermani, M.; Scholz, M. Climate Change, Water Quality and Water-Related Challenges: A Review with Focus on Pakistan. Int. J. Environ. Res. Public Health 2020, 17, 8518. [Google Scholar] [CrossRef]
- Bounaas, M.; Bouguettoucha, A.; Chebli, D.; Derbal, K.; Benalia, A.; Pizzi, A. Effect of Washing Temperature on Adsorption of Cationic Dyes by Raw Lignocellulosic Biomass. Appl. Sci. 2024, 14, 10365. [Google Scholar] [CrossRef]
- Rathi, B.S.; Kumar, P.S.; Vo, D.V.N. Critical Review on Hazardous Pollutants in Water Environment: Occurrence, Monitoring, Fate, Removal Technologies and Risk Assessment. Sci. Total Environ. 2021, 797, 149134. [Google Scholar] [CrossRef] [PubMed]
- Bounaas, M.; Bouguettoucha, A.; Chebli, D.; Gatica, J.M.; Vidal, H. Role of the Wild Carob as Biosorbent and as Precursor of a New High-Surface-Area Activated Carbon for the Adsorption of Methylene Blue. Arab. J. Sci. Eng. 2021, 46, 325–341. [Google Scholar] [CrossRef]
- Baatache, O.; Derbal, K.; Benalia, A.; Aberkane, I.; Guizah, Q.E.; Khalfaoui, A.; Pizzi, A. Valorization of Pine Cones (Pinus Nigras) for Industrial Wastewater Treatment and Crystal Violet Removal: A Sustainable Approach Based on Bio-Coagulants and a Bio-Adsorbent. Water 2024, 16, 260. [Google Scholar] [CrossRef]
- Miyah, Y.; Lahrichi, A.; Idrissi, M.; Boujraf, S.; Taouda, H.; Zerrouq, F. Assessment of Adsorption Kinetics for Removal Potential of Crystal Violet Dye from Aqueous Solutions Using Moroccan Pyrophyllite. J. Assoc. Arab. Univ. Basic Appl. Sci. 2017, 23, 20–28. [Google Scholar] [CrossRef]
- Bounaas, M.; Bouguettoucha, A.; Chebli, D.; Reffas, A.; Gatica, J.M.; Amrane, A. Batch Adsorption of Synthetic Dye by Maclura Pomifera, a New Eco-Friendly Waste Biomass: Experimental Studies and Modeling. Int. J. Chem. React. Eng. 2019, 17, 20180063. [Google Scholar] [CrossRef]
- Vimonses, V.; Lei, S.; Jin, B.; Chow, C.W.K.; Saint, C. Kinetic Study and Equilibrium Isotherm Analysis of Congo Red Adsorption by Clay Materials. Chem. Eng. J. 2009, 148, 354–364. [Google Scholar] [CrossRef]
- Liu, Z.; Liu, Z.; Chen, J.; Mo, L.; Wei, P.; Yuan, Q.; Fu, Y.; Liu, X. A Novel Biomass-Based NOB-Rich Porous Carbon Self-Assembled into Crosslinked 3D Layered Structures for Supercapacitors. Chem. Eng. J. 2025, 520, 165740. [Google Scholar] [CrossRef]
- Swain, J.; Samal, P.P.; Qaiyum, M.A.; Dey, B.; Dey, S. Biosorption of Crystal Violet, a Cationic Dye onto Alkali Treated Rauvolfia Tetraphylla Leaf: Kinetics, Isotherm and Thermodynamics. Water Conserv. Sci. Eng. 2024, 9, 1. [Google Scholar] [CrossRef]
- Khalfaoui, A.; Benalia, A.; Selama, Z.; Hammoud, A.; Derbal, K.; Panico, A.; Pizzi, A. Removal of Chromium (VI) from Water Using Orange Peel as the Biosorbent: Experimental, Modeling, and Kinetic Studies on Adsorption Isotherms and Chemical Structure. Water 2024, 16, 742. [Google Scholar] [CrossRef]
- Das, S.; Samal, P.P.; Qaiyum, M.A.; Dutta, S.; Dey, B.; Dey, S. Neolamarckia Cadamba (Cadamba) Waste Pulp as a Natural and Techno-Economic Scavenger for Methylene Blue from Aqueous Solutions. Int. J. Phytoremediation 2024, 26, 208–218. [Google Scholar] [CrossRef]
- Panda, A.; Samal, P.P.; Qaiyum, M.A.; Dey, B.; Dey, S. Think before Throw: Waste Chili Stalk Powder for Facile Scavenging of Cationic Dyes from Water. Environ. Monit. Assess. 2024, 196, 118. [Google Scholar] [CrossRef]
- Mahato, R.; Qaiyum, M.A.; Samal, P.P.; Dutta, S.; Dey, B.; Dey, S. Exploring the Promising Potential of Fallen Bamboo Leaves (Bambusa bambos) for Efficient Removal of Crystal Violet from Wastewater. Int. J. Phytoremediation 2023, 25, 1042–1051. [Google Scholar] [CrossRef]
- Laggoun, Z.; Khalfaoui, A.; Benalia, A.; Ghomrani, A.F.; Bouchareb, R.; Mahfouf, A.; Pizzi, A.; Panico, A.; Derbal, K. Application of Response Surface Design for Optimization of Direct Red Dye Biosorption onto Cockleshells. Appl. Sci. 2023, 13, 12333. [Google Scholar] [CrossRef]
- Nayeem, A.; Mizi, F.; Ali, M.F.; Shariffuddin, J.H. Utilization of Cockle Shell Powder as an Adsorbent to Remove Phosphorus-Containing Wastewater. Environ. Res. 2023, 216, 114514. [Google Scholar] [CrossRef] [PubMed]
- Yu, H.; Zhang, Y.; Wang, L.; Tuo, Y.; Yan, S.; Ma, J.; Zhang, X.; Shen, Y.; Guo, H.; Han, L. Experimental and DFT Insights into the Adsorption Mechanism of Methylene Blue by Alkali-Modified Corn Straw Biochar. RSC Adv. 2024, 14, 1854–1865. [Google Scholar] [CrossRef] [PubMed]
- Montgomery, D.C. Design and Analysis of Experiments, 9th ed.; Wiley: Hoboken, NJ, USA, 2017. [Google Scholar]
- Bollinger, J.C.; Lima, E.C.; Mouni, L.; Salvestrini, S.; Tran, H.N. Molecular Properties of Methylene Blue, a Common Probe in Sorption and Degradation Studies: A Review. Environ. Chem. Lett. 2025, 23, 1403–1424. [Google Scholar] [CrossRef]
- Lee, Y.G.; Shin, J.; Kwak, J.; Kim, S.; Son, C.; Cho, K.H.; Chon, K. Effects of Naoh Activation on Adsorptive Removal of Herbicides by Biochars Prepared from Ground Coffee Residues. Energies 2021, 14, 1297. [Google Scholar] [CrossRef]
- Cazetta, A.L.; Vargas, A.M.M.; Nogami, E.M.; Kunita, M.H.; Guilherme, M.R.; Martins, A.C.; Silva, T.L.; Moraes, J.C.G.; Almeida, V.C. NaOH-Activated Carbon of High Surface Area Produced from Coconut Shell: Kinetics and Equilibrium Studies from the Methylene Blue Adsorption. Chem. Eng. J. 2011, 174, 117–125. [Google Scholar] [CrossRef]
- Teğin, İ.; Öc, S.; Saka, C. Adsorption of Copper (II) from Aqueous Solutions Using Adsorbent Obtained with Sodium Hydroxide Activation of Biochar Prepared by Microwave Pyrolysis. Biomass Convers. Biorefin. 2025, 15, 6805–6816. [Google Scholar] [CrossRef]
- Abegunde, S.M.; Idowu, K.S.; Adejuwon, O.M.; Adeyemi-Adejolu, T. A Review on the Influence of Chemical Modification on the Performance of Adsorbents. Resour. Environ. Sustain. 2020, 1, 100001. [Google Scholar] [CrossRef]
- Musah, M.; Azeh, Y.; Mathew, J.; Umar, M.; Abdulhamid, Z.; Muhammad, A. Adsorption Kinetics and Isotherm Models: A Review. Caliphate J. Sci. Technol. 2022, 4, 20–26. [Google Scholar] [CrossRef]
- Bounaas, M.; Bouguettoucha, A.; Chebli, D.; Reffas, A.; Harizi, I.; Rouabah, F.; Amrane, A. High Efficiency of Methylene Blue Removal Using a Novel Low-Cost Acid Treated Forest Wastes, Cupressus Semperirens Cones: Experimental Results and Modeling. Part. Sci. Technol. 2019, 37, 500–509. [Google Scholar] [CrossRef]
- do Nascimento, N.N.R.; Silva, A.L.M.d.T.; Silva, W.L.; Rodrigues, M.G.F. Valorization of Coffee Agro-Industrial Residue for Biochar Production: Use as Adsorbent for Methylene Blue Removal. Desalin. Water Treat. 2024, 320, 100767. [Google Scholar] [CrossRef]
- Nitayaphat, W.; Jintakosol, T.; Engkaseth, K.; Wanrakakit, Y. Removal of Methylene Blue from Aqueous Solution by Coffee Residues. Chiang Mai J. Sci. 2015, 42, 407–416. [Google Scholar]
- Franca, A.S.; Oliveira, L.S.; Ferreira, M.E. Kinetics and Equilibrium Studies of Methylene Blue Adsorption by Spent Coffee Grounds. Desalination 2009, 249, 267–272. [Google Scholar] [CrossRef]
- Montgomery, D.C. Design and Analysis of Experiments, 8th ed.; Wiley: Hoboken, NJ, USA, 2012. [Google Scholar]
- Trinh, T.K.; Kang, L.S. Response Surface Methodological Approach to Optimize the Coagulation-Flocculation Process in Drinking Water Treatment. Chem. Eng. Res. Des. 2011, 89, 1126–1135. [Google Scholar] [CrossRef]
- Vivier, S. Stratégies D’Optimisation par la Méthode des Plans D’Expériences et Application aux Dispositifs Électrotechniques Modélisés par Éléments Finis. Doctoral Dissertation, Université des Sciences et Technologie de Lille-Lille I, Lille, France, 2002. [Google Scholar]
- Ghafari, S.; Aziz, H.A.; Isa, M.H.; Zinatizadeh, A.A. Application of Response Surface Methodology (RSM) to Optimize Coagulation-Flocculation Treatment of Leachate Using Poly-Aluminum Chloride (PAC) and Alum. J. Hazard. Mater. 2009, 163, 650–656. [Google Scholar] [CrossRef]
- Sampaio, N.A.d.S.; Caraschi, J.C.; de Miranda, F.F.; Prates, G.A.; Galli, L.C.d.L.A.; Bezerra, G.A.; Vieira, M.R. Using a Full Factorial Experiment to Optimize the Performance of an Industrial Chemical Process. Rev. Gestão Soc. Ambient. 2025, 19, e012015. [Google Scholar] [CrossRef]
- Long, Y.; Xu, J.; Shen, D.; Du, Y.; Feng, H. Effective Removal of Contaminants in Landfill Leachate Membrane Concentrates by Coagulation. Chemosphere 2017, 167, 512–519. [Google Scholar] [CrossRef]
- Gottipati, R.; Mishra, S. Process Optimization of Adsorption of Cr(VI) on Activated Carbons Prepared from Plant Precursors by a Two-Level Full Factorial Design. Chem. Eng. J. 2010, 160, 99–107. [Google Scholar] [CrossRef]
- Hegyesi, N.; Vad, R.T.; Pukánszky, B. Determination of the Specific Surface Area of Layered Silicates by Methylene Blue Adsorption: The Role of Structure, PH and Layer Charge. Appl. Clay Sci. 2017, 146, 50–55. [Google Scholar] [CrossRef]
- Kumari, P.; Sharma, P.; Srivastava, S.; Srivastava, M.M. Biosorption Studies on Shelled Moringa Oleifera Lamarck Seed Powder: Removal and Recovery of Arsenic from Aqueous System. Int. J. Miner. Process. 2006, 78, 131–139. [Google Scholar] [CrossRef]
- An, H.K.; Park, B.Y.; Kim, D.S. Crab Shell for the Removal of Heavy Metals from Aqueous Solution. Water Res. 2001, 35, 3551–3556. [Google Scholar] [CrossRef] [PubMed]
- Gnanasambandam, R.; Proctor, A. Determination of Pectin Degree of Esterification by Diffuse Reflectance Fourier Transform Infrared Spectroscopy. Food Chem. 2000, 68, 327–332. [Google Scholar] [CrossRef]
- Radenkovi, M. Corn Residue-Based Activated Carbon for Heavy Metal Removal: A Review of Adsorptive Performance and Properties. Processes 2025, 13, 3406. [Google Scholar] [CrossRef]
- Liang, S.; Guo, X.; Feng, N.; Tian, Q. Isotherms, Kinetics and Thermodynamic Studies of Adsorption of Cu2+ from Aqueous Solutions by Mg2+/K+ Type Orange Peel Adsorbents. J. Hazard. Mater. 2010, 174, 756–762. [Google Scholar] [CrossRef]
- Liou, T.H. Development of Mesoporous Structure and High Adsorption Capacity of Biomass-Based Activated Carbon by Phosphoric Acid and Zinc Chloride Activation. Chem. Eng. J. 2010, 158, 129–142. [Google Scholar] [CrossRef]
- Cheng, J.; Liu, H.; Yang, X.; Lei, T.; Guo, Q. Methane Sorption Behavior in Nanopores of Coal: A Molecular Dynamics Simulation Based on a Reconstructed Macromolecular Model. Processes 2025, 13, 3478. [Google Scholar] [CrossRef]
- Mokoena, L.S.; Mpitso, K.; Mofokeng, J.P. Fabrication and Characterization of Poly (Lactic Acid) (PLA)/Ethylene Vinyl Acetate (EVA)/Graphene Oxide (GO) Polymer Composites for the Purpose of Removing Lead Ions (Pb(II)) from Water. Processes 2025, 13, 3697. [Google Scholar] [CrossRef]
- Khalfaoui, A.; Benalia, A.; Laggoun, Z.; Bouchareb, R.; Zaamta, I.; Melloul, R.; Menasria, A.; Merouani, S.; Pizzi, A.; Derbal, K. Effective Synthesis and Application of Artichoke and Orange Peels-Based Bio-Sorbents for Ketoprofen Removal from Wastewater: Process Optimization Using Factorial Methodology. Desalin. Water Treat. 2024, 317, 100197. [Google Scholar] [CrossRef]
- Marrakchi, F.; Ahmed, M.J.; Khanday, W.A.; Asif, M.; Hameed, B.H. Mesoporous-Activated Carbon Prepared from Chitosan Flakes via Single-Step Sodium Hydroxide Activation for the Adsorption of Methylene Blue. Int. J. Biol. Macromol. 2017, 98, 233–239. [Google Scholar] [CrossRef]
- Bentahar, Y. Caractérisation Physico-Chimique Des Argiles Marocaines: Application à L’Adsorption de L’Arsenic et des Colorants Cationiques en Solution Aqueuse. Doctoral Dissertation, COMUE Université Côte d’Azur, Nice, France, Université Abdelmalek Essaâdi, Tétouan, Morocco, 2016. [Google Scholar]
- Hameed, B.H.; Ahmad, A.A. Batch Adsorption of Methylene Blue from Aqueous Solution by Garlic Peel, an Agricultural Waste Biomass. J. Hazard. Mater. 2009, 164, 870–875. [Google Scholar] [CrossRef]
- Senthil Kumar, P.; Sivaranjanee, R.; Vinothini, U.; Raghavi, M.; Rajasekar, K.; Ramakrishnan, K. Adsorption of Dye onto Raw and Surface Modified Tamarind Seeds: Isotherms, Process Design, Kinetics and Mechanism. Desalination Water Treat. 2014, 52, 2620–2633. [Google Scholar] [CrossRef]
- Patil, A.K.; Shrivastava, V.S. Alternanthera Bettzichiana Plant Powder as Low Cost Adsorbent for Removal of Congo Red from Aqueous Solution. Int. J. ChemTech Res. 2010, 2, 842–850. [Google Scholar]
- Vadivelan, V.; Vasanth Kumar, K. Equilibrium, Kinetics, Mechanism, and Process Design for the Sorption of Methylene Blue onto Rice Husk. J. Colloid Interface Sci. 2005, 286, 90–100. [Google Scholar] [CrossRef] [PubMed]
- Ofomaja, A.E.; Ho, Y.S. Equilibrium Sorption of Anionic Dye from Aqueous Solution by Palm Kernel Fibre as Sorbent. Dye. Pigment. 2007, 74, 60–66. [Google Scholar] [CrossRef]
- Salleh, M.A.M.; Mahmoud, D.K.; Karim, W.A.W.A.; Idris, A. Cationic and Anionic Dye Adsorption by Agricultural Solid Wastes: A Comprehensive Review. Desalination 2011, 280, 1–13. [Google Scholar] [CrossRef]
- Doǧar, Ç.; Gürses, A.; Açikyildiz, M.; Özkan, E. Thermodynamics and Kinetic Studies of Biosorption of a Basic Dye from Aqueous Solution Using Green Algae Ulothrix sp. Colloids Surf. B Biointerfaces 2010, 76, 279–285. [Google Scholar] [CrossRef]
- Zhang, J.; Zhou, Q.; Ou, L. Kinetic, Isotherm, and Thermodynamic Studies of the Adsorption of Methyl Orange from Aqueous Solution by Chitosan/Alumina Composite. J. Chem. Eng. Data 2012, 57, 412–419. [Google Scholar] [CrossRef]
- Sen, T.K. Adsorptive Removal of Dye (Methylene Blue) Organic Pollutant from Water by Pine Tree Leaf Biomass Adsorbent. Processes 2023, 11, 1877. [Google Scholar] [CrossRef]
- Foo, K.Y.; Hameed, B.H. Insights into the Modeling of Adsorption Isotherm Systems. Chem. Eng. J. 2010, 156, 2–10. [Google Scholar] [CrossRef]
- Senapati, S.; Giri, J.; Mallick, L.; Singha, D.; Bastia, T.K.; Rath, P.; Rana, M.K.; Panda, A.K. Rapid Adsorption of Industrial Cationic Dye Pollutant Using Base-Activated Rice Straw Biochar: Performance, Isotherm, Kinetic and Thermodynamic Evaluation. Discov. Sustain. 2025, 6, 46. [Google Scholar] [CrossRef]
- Franceschini, S.B.; Sendeski, C.P.; DE LIMA, K.D.; Nicolini, K.P.; Nicolini, J. A ‘Green’ Adsorbent: Effect of Chemical Modification of Biosorbents on the Adsorption of Methylene Blue and Malachite Green. An. Acad. Bras. Cienc. 2023, 95, e20210124. [Google Scholar] [CrossRef]
- Karaoglu, M.H.; Ugurlu, M. Adsorption and Recovery of Methylene Blue from Aqueous Solution by NaOH-Treated of Prina. Asian J. Chem. 2011, 23, 2577–2583. [Google Scholar]
- Hamad, H.N.; Idrus, S.; Yusuf, B.; Jamali, N.S.; Ahsan, A.; Suhartini, S.; Wahab, A.M.A. Optimized Bentonite Clay Adsorbents for Methylene Blue Removal. Processes 2024, 12, 738. [Google Scholar] [CrossRef]
- Lata, H.; Garg, V.K.; Gupta, R.K. Removal of a Basic Dye from Aqueous Solution by Adsorption Using Parthenium Hysterophorus: An Agricultural Waste. Dye. Pigment. 2007, 74, 653–658. [Google Scholar] [CrossRef]
- Amode, J.O.; Santos, J.H.; Alam, Z.M.; Mirza, A.H.; Mei, C.C. Adsorption of Methylene Blue from Aqueous Solution Using Untreated and Treated (Metroxylon spp.) Waste Adsorbent: Equilibrium and Kinetics Studies. Int. J. Ind. Chem. 2016, 7, 333–345. [Google Scholar] [CrossRef]
- Danish, M.; Ahmad, T.; Hashim, R.; Said, N.; Akhtar, M.N.; Mohamad-Saleh, J.; Sulaiman, O. Comparison of Surface Properties of Wood Biomass Activated Carbons and Their Application against Rhodamine B and Methylene Blue Dye. Surf. Interfaces 2018, 11, 1–13. [Google Scholar] [CrossRef]
- Hussin, Z.M.; Talib, N.; Hussin, N.M.; Hanafiah, M.A.K.M.; Khalir, W.K.A.W.M. Methylene Blue Adsorption onto NaOH Modified Durian Leaf Powder: Isotherm and Kinetic Studies. Am. J. Environ. Eng. 2015, 5, 38–43. [Google Scholar]
- Aichour, A.; Zaghouane-Boudiaf, H.; Iborra, C.V.; Polo, M.S. Bioadsorbent Beads Prepared from Activated Biomass/Alginate for Enhanced Removal of Cationic Dye from Water Medium: Kinetics, Equilibrium and Thermodynamic Studies. J. Mol. Liq. 2018, 256, 533–540. [Google Scholar] [CrossRef]
- Nasuha, N.; Hameed, B.H. Adsorption of Methylene Blue from Aqueous Solution onto NaOH-Modified Rejected Tea. Chem. Eng. J. 2011, 166, 783–786. [Google Scholar] [CrossRef]
Disclaimer/Publisher’s Note: The statements, opinions and data contained in all publications are solely those of the individual author(s) and contributor(s) and not of MDPI and/or the editor(s). MDPI and/or the editor(s) disclaim responsibility for any injury to people or property resulting from any ideas, methods, instructions or products referred to in the content. |
© 2025 by the authors. Licensee MDPI, Basel, Switzerland. This article is an open access article distributed under the terms and conditions of the Creative Commons Attribution (CC BY) license (https://creativecommons.org/licenses/by/4.0/).