Abstract
Nitric acid (HNO3) is predominantly produced in large production plants using the Ostwald process. In view of its widespread application as synthetic fertilizer, small- scale and local production has become of interest. The chemical precursor of nitric acid is NOx gas, which can be produced from air at percentage-level concentrations using small-scale, electrically powered warm plasma reactors. Using gas-phase plasma, the downstream conversion of NOx into fertilizer is a crucial, but as yet understudied step. This work aims to help close this gap and support the further development of plasma-driven nitrogen fixation and subsequent NOx scrubbing. The chemistry of NOx absorption through gas scrubbing is investigated at a 1% NOx concentration using a synthetic mimic of a plasma-produced NOx stream in order to maintain maximal controllability. pH values of the scrubber solution were kept in the range of 1 to 5 and it was recirculated for up to 30 h. The kinetics of NOx absorption were found to be strongly pH-dependent, requiring several hours of recirculation to reach steady state conditions. Once at steady state, the NOx removal efficiency turned out to be rather pH independent and reached around 84% for experiments at pH 1–4. The formation of nitrous acid (HNO2) byproduct reached a constant value of around 3.43 mM based on a dynamic equilibrium of its formation and decomposition. Approaches to minimize undesired nitrite and nitrous acid byproduct formation are discussed.
1. Introduction
Ammonium nitrate fertilizer, an essential element in our global food production system, is currently produced in large chemical plants [1,2]. Ammonia (NH3), being the base chemical, is produced in the Haber–Bosch process. Ammonia synthesis, using hydrogen gas produced from fossil methane, is responsible for a significant percentage of global carbon dioxide emissions [3,4,5]. In the subsequent Ostwald process, NH3 is catalytically oxidized with O2 to form NO2, which upon reaction with water forms HNO3. The chemistry of this industrial absorption process is complex. The process entails about 40 entangled reaction steps with intermediates and by-products such as HNO2, N2O, N2O3 and N2O4 [6]. NO oxidation and NO2 absorption are performed under pressures of up to 10 bar and at NOx gas concentrations of around 10%. The commercial HNO3 product is typically a concentrated solution containing up to 65 wt.% HNO3 [7,8,9].
Electricity-powered plasma technology is an emerging alternative for nitric acid production with continuously improving energy efficiency [10,11,12]. In plasma, electrons and gas molecules are excited such that nitrogen and oxygen gas from atmospheric air react to NOx [11,13]. In general, plasma reactors are divided into three groups based on gas temperature: thermal plasma, non-thermal plasma and warm plasma, which can be described as an intermediate of the former two. In warm plasma, electron temperatures are elevated, while gas molecules are also heated but not to the extent of thermal plasma gas temperatures. This creates only a partial equilibrium between the electrons and gas molecules, causing warm plasma to be the most promising type for NOx production considering yield over energy requirement [11,14,15,16].
Plasma-based nitrogen oxidation is a strongly growing research domain. It encompasses dry or gas-phase plasma, using only air and electricity for the production of NOx, but also plasma–liquid systems are of growing research interest for the production of plasma-activated water (PAW), rich in NO2− and NO3−. In these plasma–liquid reactors, plasma discharge can be in direct or indirect contact with the liquid phase [17,18]. A large number of short-lived species (e.g., H*, OH*, H2O2, …) are produced when the plasma interacts with water, with the advantage of also creating oxidizing agents like H2O2 or O3. This results in highly complex reaction pathways and often lowers the energy to NOx efficiency [18,19,20,21].
Using gas-phase plasma, produced NOx gas still needs to react with water to form HNO3 like in the Ostwald process. This is performed afterwards in a gas–water contactor or scrubber. However, in plasma processes, NOx is produced at concentrations in the range of a few percent, which is substantially lower than in the Ostwald processes (ca. 10%), leading to different absorption conditions [7,8,11,15].
Besides serving as a precursor for HNO3, NOx gas is also a known air pollutant emitted at parts-per-million levels during combustion processes [22,23]. NOx scrubbing is also an end-of-pipe solution to eliminate it from flue gas [24,25]. Under near-ambient temperature and pressure conditions, the low aqueous solubility of NO and the slow kinetics of its spontaneous oxidation to the better-dissolving NO2 often necessitate the use of oxidizing agents like H2O2 and O3 [25,26,27,28,29,30].
The operation conditions of scrubbers for the absorption of plasma-based NOx are in between those of the Ostwald process and NOx emission abatement technologies. While NOx absorption is extensively modelled, for example by Patwardhan et al. [31], only limited experimental research has been performed on NOx to HNO3 conversion under reaction conditions relevant to gas-phase plasma-NOx with a downstream scrubbing unit. In order to make an estimation of the feasibility or implementation potential of plasma technology for nitrate fertilizer production, more research on the NOx absorption step is necessary [11,32].
In this work, NOₓ absorption processes and, in particular, the formation and transformation of NO2− and NO3− in liquid-phase reactions are studied. In order to allow a more direct investigation, a NOx-containing gas mixture is used, mimicking the NOx gas produced from gas-phase warm plasma reactors. As plasma-NOx production is a strongly emerging domain, NOx concentrations of up to 5% are reported but are at the moment still on the upper end of achieved concentrations. Therefore, a NOx concentration of 1% was chosen to represent a current, small-scale plasma reactor [11,15,33].
Insight was gained on the influence of scrubbing liquid pH on NOx absorption kinetics, since alkaline solutions are often deemed more effective for NOx removal compared to neutral or acidic solutions due to the acidic character of NOx [22,34]. Also, nitrate capacities and the formation of undesired nitrous acid side products were studied without the addition of oxidizing agents for long-term recirculation.
2. Materials and Methods
2.1. Setup
The experimental setup for NOx absorption experiments is depicted in Figure 1. A mixture of NO, O2 and N2 gases delivered from gas cylinders was fed to the absorption column at 3 L/h. Absorption liquid was circulated at 375 mL/min in such a way that gas and liquid were running in counter-current. A large contact area was assured between liquid and gas by filling the column with packing material consisting of glass Raschig rings with diameter and height 6 mm (Glasatelier Saillart, Meerhout, Belgium), depicted in Figure 2.
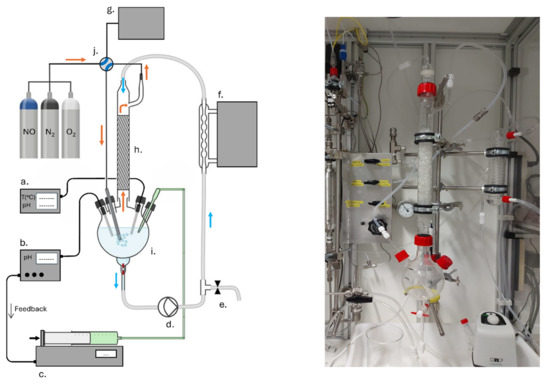
Figure 1.
Schematic representation of the NOx scrubber experimental setup (left). (a) pH and temperature monitoring; (b) pH controller; (c) KOH solution pump; (d) recirculation pump; (e) scrubber solution sample valve; (f) cryostat; (g) NOx gas analyzer; (h) absorption column filled with packing material; (i) round bottom flask with probe inlets; (j) bypass valve (→) direction of gas flow (→) direction of liquid flow. Photo of the real setup on the (right).
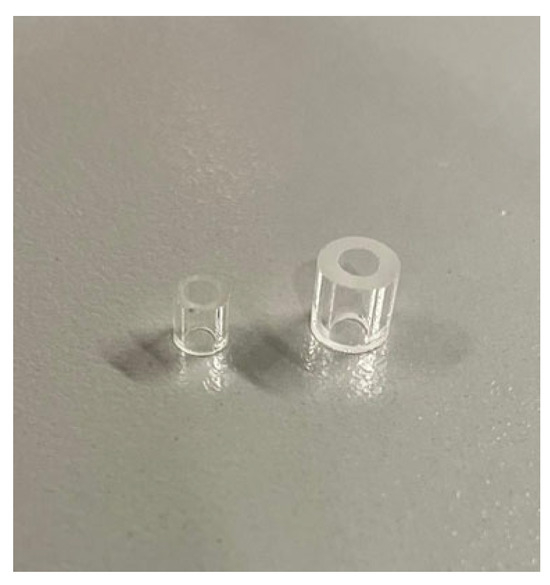
Figure 2.
Glass Raschig rings used as packing material, 4 mm diameter (left) and 6 mm diameter (right).
The column was kept at a constant temperature of 293 K by a cryostat. The liquid outlet of the column is connected to a round flask with openings for the gas inlet, base solution inlet, pH probe (Mettler Toledo, Zaventem, Belgium, SevenCompact) and pH control system (Hannah instruments, Temse, Belgium, HI510 and HI1006-1850). The pH of the scrubbing solution was kept constant as follows. The round flask was filled with acidified aqueous solution of H2SO4 (Acros Organics, Geel, Belgium, 96 wt%) or H3PO4 (Acros Organics, Geel, Belgium, 85 wt%) at the intended pH, in a range from pH 1 to pH 5. During operation of the absorption column, the pH was monitored and kept constant by dosing with 0.2 M KOH (Sigma-Aldrich, Hoeilaart, Belgium, ≥85%).
2.2. Gas Phase Composition and Analysis
The inlet gas mixture was composed of 1% NO, 20% O2 and 79% N2, and fed from gas cylinders using mass flow controllers (Bronkhorst, Olen, Belgium, EL-FLOW). The flow rate was 3 L/min. NO and NO2 concentrations in the gas mixture were measured with a UV analyzer (ABB, Diegem, Belgium, AO2020 Limas11HW). Calculations were performed in MATLAB software (MathWorks, Natick, MA, USA, R23022b) and Excel (Microsoft 365, Redmond, WA, USA, version 2502). Before starting the absorption, the feed gas was run for 30 min in bypass mode and sent directly to the analyzer without passing through the column to allow the gas composition to stabilize and to be verified. The NO and NO2 removal efficiency (RE) was estimated as the difference between the in- and outlet concentrations divided by the inlet concentration (Equation (1)):
In the bypass phase of each experiment, some NO oxidation already occurred in the gas lines, resulting in a mixture of NO and NO2 reaching the scrubber column. The oxidation ratio (OR), defined as the ratio of the concentration of NO2 over total NOx, is determined according to Equation (2). Oxidation ratios were very similar for all tests with OR values of 0.56 ± 0.008.
2.3. Liquid Phase Analysis
Liquid samples were taken every hour. Samples taken from the round flask were diluted 100 times and buffered at pH 7 using an equimolar mixture of 0.005 M NaH2PO4 (Merck, Hoeilaart, Belgium, >99%) and Na2HPO4 (Merck, Hoeilaart, Belgium 98–100%). Nitrous acid is a weak acid, being only partially deprotonated under acidic conditions. Protonation–deprotonation equilibrium of nitrous acid was considered to be established in the scrubber solution under all conditions. Estimates of the actual concentration of nitrous acid based on total nitrite analysis were made assuming a nitrous acid pKa value of 3.20 (Equation (3)) [35,36].
At this pH value, nitrous acid is deprotonated, which is needed for quantification using anion chromatography. The nitrate and nitrite contents of the liquid samples were analyzed using ion chromatography (Metrohm, Kontich, Belgium, Eco IC, A Supp 5 column, 850 IC conductivity detector).
3. Results
NOx scrubbing experiments were performed in a column with an empty bed volume (EBV) of 780 mL with 400 mL recirculation solution, of which the pH was kept fixed at values of 1, 2, 3, 4 and 5 by dosing with KOH, which not only has a pH regulating function but could also add value to the fertilizer (Figure 1). A gas mixture consisting of 1% NO, 20% O2 and 79% N2 entered the column in counter-current with the solution at a flow rate of 3 L/min, based on typical flow rates found for several reactor types including gliding arc [11,16,19,37]. In order to ensure sufficient contact area, the column was filled with an inert packing material. In- and outgoing NOx gasses were analyzed in-line using a UV detector. The HNO3, NO2− and HNO2 content of the scrubber solution was analyzed in regularly taken samples; thereafter HNO2 was deprotonated to NO2− by adding a buffer solution of pH 7 to enable quantification with ion chromatography. The combination of NO2− and HNO2 will later on be referred to as total nitrite concentration. For more information see Section 2. Data of preliminary tests, to indicate reproducibility, can be found in the Supplementary Information.
3.1. Scrubber Liquid Analysis
The nitrate, nitrite and total nitrite concentrations, standing for the sum of NO2− and HNO2 in the scrubber solution, were determined at 1 h time intervals (Figure 3). Experiments at pH 4 and 5 were run over two days. No liquid samples were taken during the night. The nitrate concentration steadily increased for all the five experiments at different pH values. At the end of the testing period, the nitrate concentration in the scrubber solution reached values of 12.6 mM at pH 1; 14.0 mM at pH 2; 10.4 mM at pH 3; 40.3 mM at pH 4; and 14.9 mM at pH 5 (Figure 3 and Table 1). However, it is important to note that tests at pH 4 and 5 ran for 30 h instead of 6 h. Table 2 illustrates the NO3− concentration for tests at pH 1–5 after 6 h. After the same amount of scrubbing time, NO3− concentrations reached 12.63 mM at pH 1 while only 2.97 mM was reached at pH 5. The nitrate accumulation rate decreased with increasing pH value.
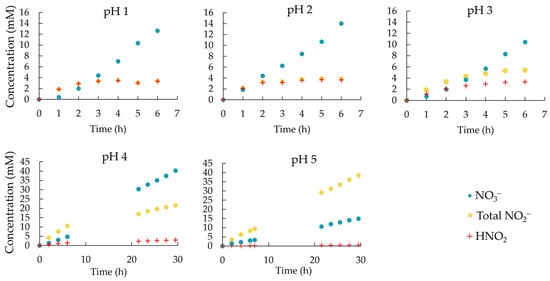
Figure 3.
Nitrate, total nitrite and nitrous acid concentration in the scrubber solution during NOx scrubbing experiments at pH 1, 2, 3, 4 and 5. For experiments at pH 4 and 5, the scrubber solution was not sampled during the night in the period from 9 to 20 h.

Table 1.
Total NO2− (sum of NO2− and HNO2 as measured), actual NO2−, HNO2 and NO3− concentrations in the scrubber solution at the end of the experiments of Figure 3 at different pH.
Table 2.
NO3− concentrations for tests at pH 1–5 after 6 h.
The total nitrite concentration displayed increasing values at higher pH. At pH 1, 2 and 3, the total nitrite concentration reached a plateau after 2 to 4 h (Figure 3) at ca. 3.37 mM, 3.86 mM and 5.41 mM for pH 1, 2 and 3, respectively (Table 1). At pH 4 and 5 the total nitrite concentration in the circulating solution did not reach a plateau, even when the scrubbing was prolongated to 30 h. The total nitrite concentrations rose to 21.6 and 38.4 mM, respectively, at pH 4 and 5. At pH 5, nitrite was the main NOx-derived compound in the scrubber liquid.
After the total nitrite concentration plateau was reached at pH 1, 2 and 3, the calculated HNO2 concentrations reached very similar concentrations of 3.35, 3.63 and 3.32 mM, respectively (Table 1). At pH 4, the HNO2 concentration reached 2.95 mM at the end of the 30 h testing period and had not fully reached a plateau yet, suggesting it could still increase to reach a value similar to that reached in the experiments at lower pH. At pH 5 the final HNO2 concentration reached only 0.599 mM, which is substantially below the plateau value reached at lower pH. Under this condition, it may take a very long time to reach the plateau.
3.2. Gas Phase Analysis
The NOx concentration in the gas exiting the scrubber under the different pH conditions is presented in Figure 4a,b. In experiments at pH 1, 2 and 3, NOx outlet concentrations initially were around 800 ppm, and increased during the experiment until a plateau value of ca. 1800 ppm was reached. The corresponding NOx removal efficiency decreased from ca. 95% initially, to 82.5%, 83.9% and 83.0% at pH 1, 2 and 3, respectively (Figure 4c).
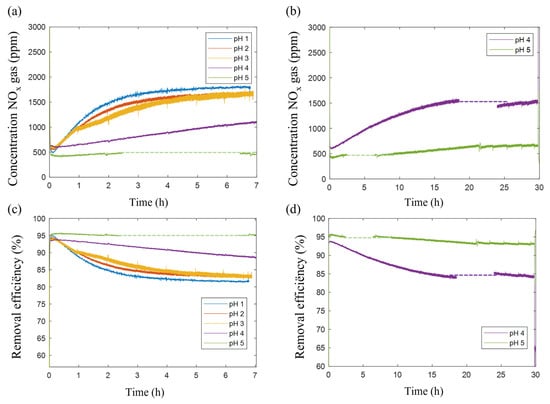
Figure 4.
(a) NOx outlet concentrations (ppm) for experiments over a time span of 7 h at pH 1, 2 and 3; (b) over a time span of 30 h at pH 4 and 5; (c) NOx removal efficiencies at all pH values over a time span of 7 h; (d) Removal efficiency in scrubbing experiment at pH 4 and 5 over a time span of 30 h. For representation, the moving average over 20 points of each curve is taken. Moving standard deviations of the curves of pH 1, 2, 3, 4 and 5 were 16, 68, 100, 38 and 28 ppm, respectively. Data of preliminary tests are shown in Supplementary Materials Figure S1 for comparison and reproducibility.
At pH 4 and 5, the outgoing NOx gas concentrations were significantly lower after 7 h, and still increasing (Figure 4b). When prolonging the scrubbing to 30 h at pH 4, a plateau value of ca. 84.2% removal efficiency was reached (Figure 4c), which is in the range of the values obtained at pH 1, 2 and 3. At pH 5, even after 30 h, the removal efficiency kept on slowly decreasing. Very long times would have been needed to verify the reaching of a plateau. Gaps in the data are due to a setup malfunction leading to an artefact in the data, irrelevant for further interpretation.
4. Discussion
The reaction network of NOx gas absorption in aqueous media is complex and involves dissolution as well as chemical reactions involving reaction intermediates and reversible and irreversible reactions, in gas as well as liquid phase. The reactions considered most important in the gas phase are presented in Equations (4)–(7) [6,38,39,40,41].
2 NO (g) + O2 (g) → 2 NO2 (g)
NO (g) + NO2 (g) ⇌ N2O3 (g)
NO (g) + NO2 (g) + H2O ⇌ 2 HNO2 (g)
2 NO2 (g) ⇌ N2O4 (g)
According to Equations (4)–(6), NO gas is converted into NO2, N2O3, and HNO2, respectively, which are more water-soluble. NO2 also dimerizes to form N2O4 (Equation (7)).
The main reactions in the liquid phase are given in Equations (8)–(11). Dissolved N2O3 and N2O4 are converted into either HNO2 or a combination of HNO2 and HNO3 [31,40,42]. The reactions of Equations (8)–(11) are often assumed irreversible since the rate of the back reactions, being bimolecular, is considered negligible in the present diluted, aqueous solutions [38,43,44,45].
2 NO2 (l) + H2O → HNO2 (l) + HNO3 (l)
N2O3 (l) + H2O → 2 HNO2 (l)
N2O4 (l) + H2O → HNO2 (l) + HNO3 (l)
3 HNO2 (l) → H2O + 2 NO (g) + HNO3 (l)
In liquid phase, nitrous acid is prone to disproportionation, leading to HNO3, NO and H2O formation according to Equation (11) [31,42,46,47]. The poorly soluble NO molecules desorb from the solution and return to the gas phase, where they re-enter the reaction network [48]. The HNO2 decomposition reaction mechanism is often assumed as described by Schwartz et al. to be fourth order in HNO2, but accurate rate equations remain a matter of discussion [42,44,45].
The observation of a total nitrite (NO2− and HNO2) concentration plateau in the scrubber liquid at fixed pH values of 1, 2 and 3 (Figure 3) can be understood as follows. Nitrous acid decomposition is a disproportionation reaction involving several HNO2 molecules and a reaction order higher than 1 (Equation (11)) [44,45]. With increasing HNO2 concentration, the HNO2 disproportionation reaction rate will increase until it equals the rate of HNO2 formation (Equations (8)–(10)), leading to a steady-state HNO2 concentration. At a constant pH, this also means a steady-state NO2− concentration.
This is in agreement with what is seen in analysis of the gas phase. The decrease in NOx removal efficiency with time at constant pH (Figure 4c,d) could be attributed to this formation of NO by HNO2 disproportionation (Equation (11)) [41,49]. Here as well, it is noticed that once the system reaches its steady state, NOx removal efficiencies are very similar for pH 1, 2, 3 and 4. The similar limitation of the NOx removal efficiency is also likely to be a consequence of the similar HNO2 concentration (Table 1) and equal rate of the HNO2 decomposition reaction (Equation (11)).
While at steady state pH does not seem to influence removal efficiency, in the transient period, on the other hand, the pH does matter, as observed in earlier studies [24,31,34,38]. The time after which the steady state condition is reached is pH-dependent. For tests at pH 1, 2 and 3 the HNO2 concentrations reach steady state after approximately 4, 5 and 6 h, respectively. At pH 4 and 5, the accumulation of HNO2 in the scrubber solution progresses much more slowly due to the acid dissociation reaction (Figure 3). The higher the pH, the more HNO2 directly dissociates into NO2− and the longer it takes for enough HNO2 to accumulate for the dissociation reaction (Equation (11)) to balance the formation rate. Per pH unit, ten times more HNO2 is converted to NO2−, which is reflected in Table 1.
The test at pH 4 nearly reached its steady state after 30 h, but the test at pH 5 did not reach this level within the tested timespan. Notably, much of the experimental research focuses on short-duration tests, often with recirculation times for the scrubbing solution limited to an hour [38,50]. An important conclusion to draw is that running experiments for shorter timespans than necessary to reach steady state could wrongly lead to the assumption that increasing the pH of the scrubbing solution also increases removal efficiency in the long term.
Nitrate, being a strong acid and assumed to be always in its dissociated form, accumulates over time in the scrubber solution (Figure 3). In the transient period, the concentration increases more than proportionally with time. This can also be attributed to the increasing rate of the HNO2 decomposition reaction (Equation (11)), which also forms HNO3. Given the steady-state NO2− and HNO2 concentrations and the ongoing NO3− accumulation, there is no point in expressing a nitrate selectivity in these tests, as it is strongly time-dependent. What can be expressed is the steady-state NO2− amount that remains present.
It is possible that the final removal efficiency is a combination of NO that was not absorbed and went directly to the outlet of the system and NO that was released during HNO2 disproportionation. The disproportionation reaction, however, does play an important role, since HNO2 concentrations reach a plateau value after a few hours for a constant RE while solubility limits are far from being reached [51,52]. Also, the fact that removal efficiencies for the same empty bed residence time (EBRT) and gas concentrations reach their constant value after different times depending on pH and HNO2 concentration, is another indication that the disproportionation reaction does play a significant role in determining the removal efficiency.
In practical applications of nitrate fertilizer production, nitrite and nitrous acid are undesired side products. Even though the maximal allowed nitrite concentration in nitrogen fertilizer is in many countries not explicitly regulated, effects of nitrite toxicity are reported at concentrations starting from 0.11 mM [53,54]. Below these concentrations, nitrite is converted in soil processes into nitrate by nitrite-oxidizing bacteria [55,56]. This study hints at a few abiotic options expected to lower the steady-state HNO2 concentration without sacrificing the NOx removal efficiency.
A first approach to consider is to increase the liquid volume in the round bottom flask. For a constant EBRT but larger liquid volume, a slower increase in HNO2 concentration is expected for the same absolute amount of NOx absorbed. This means that the disproportionation reaction is also slowed down, resulting in a lower steady-state HNO2 concentration and NO formation. In a first preliminary experiment at pH 1 with liquid volumes of 250 mL and 400 mL, similar removal efficiencies of 83.6% and 82.5% were reached, respectively. Total nitrite concentrations seemed to stagnate after 6 h at 4.07 and 3.37 mM for 250 mL circulation volume and 400 mL, respectively; 4.04 mM and 3.35 mM of this were in the form of HNO2. Increasing the volume of the scrubbing liquid 1.6 times reduced the nitrite content by around 17%. Increasing the liquid volume as well as slowing down the disproportionation reaction also decreased the rate of NO3− formation. After 6 h, nitrate concentrations of 19.6 mM and 12.6 mM were obtained for 250 mL and 400 mL scrubbing solution. However, this could be remedied by increasing the time over which the experiment was ran. While our results indicate that larger volumes indeed reduced the nitrite concentration in the scrubbing liquid, the tested volumes were limited by the size of the instrumentation. Further validation and optimization of the effect of the scrubbing volume on the nitrite concentration is recommended when implementing this approach.
Another option would be to increase the NOx oxidation ratio. As shown in other experimental contexts, this can increase the removal efficiency as well as nitrate selectivity over nitrite [22,49,50]. By oxidizing NO to NO2 and forming N2O4 instead of N2O3, it is likely that the reactions of Equations (7), (8) and (10) are favored over the reactions of Equations (6) and (9), lowering in this way the HNO2 formation and disproportionation rate. The NOx oxidation ratio is dependent on the composition of the plasma-produced NOx gasses but also on the oxidation reaction of NO (Equation (4)), which is a spontaneous reaction, second-order dependent on NO partial pressure and first-order dependent on O2 partial pressure [31,57]. As is often done, pressurizing the air in or at the outlet of the plasma process will improve the NO2 content of the NOx, as showcased, for example, by Tsonev et al. reaching an OR of 94% [41,58,59]. Another solution would be to prolong the residence time of the gas in the scrubber, as also noted by Abdelaziz et al. [33].
A third option to further lower the nitrite content would be to store the scrubbing solution in a storage tank after the desired nitrate concentration is reached. Braida and Ong (2000) showed that the decomposition of nitrite occurs spontaneously through either the nitrous acid disproportionation reaction (Equation (11)) or its decomposition to NO and NO2 [36]. The rate of nitrite removal is dependent on the aeration rate and favored by lower pH values. The contribution of Equation (11) becomes larger when lowering the aeration rate. In the context of also maximizing the NO3− concentration, this would be the preferred option. At 1 mM NO2− and solution pH of 2.85, 90% of the NO2− would be removed after 24 h without extra aeration [36]. Thus, at low pH values, undesired nitrite and nitrous acid are expected to be eliminated over time, producing nitric acid and NOx gas. The gas phase enriched with NOx could be recovered from the storage tank and again injected into the scrubber to ensure no NOx is released to the environment.
Plasma technology is a fast-developing research domain with various reactor types, each characterized by distinct energy efficiencies and NOₓ concentration outputs. When looking at industrial applications for fertilizer production, it is important to evaluate whether it is preferable to operate at a higher energy consumption over a shorter period of time or at a lower energy consumption over a longer duration, depending on renewable energy availability. Based on this evaluation, the most suitable reactor type can be selected, along with a corresponding NOₓ absorption unit.
The Haber–Bosch process for nitrogen fixation has an energy efficiency of 0.5–0.6 MJ/mol-N. State-of-the-art plasma reactors are currently reaching energy efficiencies approaching 1 MJ/mol-N and are therefore still less energy efficient [11,14,15]. Further development of plasma reactors and NOx absorption units is needed to make this technology for green nitrogen fixation competitive with the Haber–Bosch process.
5. Conclusions
This study provides experimental data on the NOx absorption chemistry in aqueous solution under conditions relevant for small-scale fossil carbon-free nitric acid production based on warm plasma technology. A synthetic gas mixture containing 1% NOx, considered a relevant concentration range for current, energy-efficient warm plasma reactors, was sent over a gas–water contactor or scrubber. The scrubbing liquid was an aqueous solution with constant pH in the range 1 to 5 and was recirculated for up to 30 h.
The NOx removal efficiency was observed to be higher for increased pH at the onset of the experiment, yet decreased over the course of the experiment to a plateau value of ca. 83%, independent of pH. The explanation lies in a corresponding increase in the HNO2 concentration until a plateau is reached, and a negative correlation between HNO2 concentration and removal efficiency. The steady-state HNO2 concentration and, therefore, the HNO2 decomposition rate were observed to be very similar for all pH values. It is thus concluded that pH does not influence removal efficiency when running experiments sufficiently long for a steady state to be reached. However, pH does remain an important parameter concerning the NO2− concentration, as it is the determining factor in the NO2− ↔ HNO2 equilibrium.
This paper gives a concise insight in NOx absorption kinetics, capacities and steady state removal efficiencies at a 1% NOx concentration. It therefore aims to contribute to bridging a gap between classical NOx absorption research and the upcoming plasma domain.
Besides the pH value, also other NOx concentrations, oxidation ratios, flow rates or temperature effects can be studied in further research to clarify an often overlooked area of downstream NOx absorption for small-scale plasma-based (H)NO3 production.
Supplementary Materials
The following supporting information can be downloaded at: https://www.mdpi.com/article/10.3390/pr13123897/s1, Supplementary Materials—Preliminary Duplicate Tests at Different pH Values. Figure S1: NOx gas outlet concentrations of the published test and its duplicate at pH 1 (upper left), pH 3 (upper right), and pH 4 (below); Figure S2: Total nitrite concentrations of the published tests and its duplicate at pH 1 (left), pH 4 (right).
Author Contributions
Conceptualization, L.H. and J.M.; methodology, A.V. and R.D.W.; software, L.H., A.V. and R.D.W.; validation, A.V. and R.D.W.; formal analysis, A.V. and R.D.W.; investigation, A.V. and R.D.W.; resources, J.M.; data curation, A.V. and R.D.W.; writing—original draft preparation, A.V., R.D.W. and L.H.; writing—review and editing, J.M.; visualization, A.V.; supervision, J.M.; project administration, L.H. and A.V.; funding acquisition, L.H. and J.M. All authors have read and agreed to the published version of the manuscript.
Funding
This research was funded by the European Union—Next generation EU and the Research Foundation Flanders (FWO) in the bio-economy project called PNAC (Grant number G0G2322N) and by the Flemish government (department EWI) in the STAP project (ref. AH.2022.000690). L.H. acknowledges Flanders Innovation & Entrepreneurship for an innovation mandate (Number HBC.2023.0674) and the Flemish Industrial Research fund (IOF) for an IOF mandate (Number: VTI-23-00165). R.D.W. acknowledges the Research Foundation Flanders for an FWO-SB fellowship (Grant number: 1S91426N).
Data Availability Statement
The original contributions presented in this study are included in the article/Supplementary Materials. Further inquiries can be directed to the corresponding author.
Acknowledgments
The authors acknowledge the assistance of Stef Usé for construction and maintenance of the test setup.
Conflicts of Interest
The authors declare no conflicts of interest.
Abbreviations
The following abbreviations are used in this manuscript:
| PAW | Plasma-activated water |
| OR | Oxidation Ration |
| EBV | Empty Bed Volume |
| RE | Removal Efficiency |
| EBRT | Empty Bed Residence time |
References
- Ritchie, H. How Many People Does Synthetic Fertilizer Feed? Available online: https://ourworldindata.org/how-many-people-does-synthetic-fertilizer-feed (accessed on 2 August 2024).
- European Commission. Fertilisers—Agriculture and Rural Development. 2019. Available online: https://agriculture.ec.europa.eu/system/files/2019-07/market-brief-fertilisers_june2019_en_0.pdf (accessed on 14 November 2025).
- Kyriakou, V.; Garagounis, I.; Vourros, A.; Vasileiou, E.; Stoukides, M. An Electrochemical Haber-Bosch Process. Joule 2020, 4, 142–158. [Google Scholar] [CrossRef]
- Bird, F.; Clarke, A.; Davies, P.; Surkovic, E. Ammonia: Zero-Carbon Fertiliser, Fuel and Energy Store; Royal Society: London, UK, 2020. [Google Scholar]
- Mayer, P.; Ramirez, A.; Pezzella, G.; Winter, B.; Sarathy, S.M.; Gascon, J.; Bardow, A. Blue and Green Ammonia Production: A Techno-Economic and Life Cycle Assessment Perspective. iScience 2023, 26, 107389. [Google Scholar] [CrossRef]
- Joshi, J.B.; Mahajani, V.V.; Juvekar, V.A. Invited Review Absorption of Nox Gases. Chem. Eng. Commun. 1985, 33, 1–92. [Google Scholar] [CrossRef]
- Grande, C.A.; Andreassen, K.A.; Cavka, J.H.; Waller, D.; Lorentsen, O.-A.; Øien, H.; Zander, H.-J.; Poulston, S.; García, S.; Modeshia, D. Process Intensification in Nitric Acid Plants by Catalytic Oxidation of Nitric Oxide. Ind. Eng. Chem. Res. 2018, 57, 10180–10186. [Google Scholar] [CrossRef]
- Salman, A.U.R.; Enger, B.C.; Auvray, X.; Lødeng, R.; Menon, M.; Waller, D.; Rønning, M. Catalytic Oxidation of NO to NO2 for Nitric Acid Production over a Pt/Al2O3 Catalyst. Appl. Catal. A Gen. 2018, 564, 142–146. [Google Scholar] [CrossRef]
- Thiemann, M.; Scheibler, E.; Wiegand, K.W. Nitric Acid, Nitrous Acid, and Nitrogen Oxides. In Ullmann’s Encyclopedia of Industrial Chemistry; Wiley-VCH: Weinheim, Germany, 2000; Volume 24, pp. 177–223. [Google Scholar]
- Pei, X.; Li, Y.; Luo, Y.; Man, C.; Zhang, Y.; Lu, X.; Graves, D.B. Nitrogen Fixation as NOx Using Air Plasma Coupled with Heterogeneous Catalysis at Atmospheric Pressure. Plasma Process. Polym. 2024, 21, 2300135. [Google Scholar] [CrossRef]
- Rouwenhorst, K.H.R.; Jardali, F.; Bogaerts, A.; Lefferts, L. From the Birkeland–Eyde Process towards Energy-Efficient Plasma-Based NOX Synthesis: A Techno-Economic Analysis. Energy Environ. Sci. 2021, 14, 2520–2534. [Google Scholar] [CrossRef]
- Vervloessem, E.; Gorbanev, Y.; Nikiforov, A.; De Geyter, N.; Bogaerts, A. Sustainable NOX: Production from Air in Pulsed Plasma: Elucidating the Chemistry behind the Low Energy Consumption. Green Chem. 2022, 24, 916–929. [Google Scholar] [CrossRef]
- Jardali, F.; Van Alphen, S.; Creel, J.; Ahmadi Eshtehardi, H.; Axelsson, M.; Ingels, R.; Snyders, R.; Bogaerts, A. NOx Production in a Rotating Gliding Arc Plasma: Potential Avenue for Sustainable Nitrogen Fixation. Green Chem. 2021, 23, 1748–1757. [Google Scholar] [CrossRef]
- Li, S.; Medrano, J.; Hessel, V.; Gallucci, F. Recent Progress of Plasma-Assisted Nitrogen Fixation Research: A Review. Processes 2018, 6, 248. [Google Scholar] [CrossRef]
- Abdelaziz, A.A.; Komuro, A.; Teramoto, Y.; Schiorlin, M.; Kim, D.-Y.; Nozaki, T.; Kim, H.-H. Atmospheric-Pressure Plasmas for NOx Production: Short Review on Current Status. Curr. Opin. Green. Sustain. Chem. 2024, 50, 100977. [Google Scholar] [CrossRef]
- Abdelaziz, A.A.; Teramoto, Y.; Nozaki, T.; Kim, H.-H. Performance of High-Frequency Spark Discharge for Efficient NOx Production with Tunable Selectivity. Chem. Eng. J. 2023, 470, 144182. [Google Scholar] [CrossRef]
- Thirumdas, R.; Kothakota, A.; Annapure, U.; Siliveru, K.; Blundell, R.; Gatt, R.; Valdramidis, V.P. Plasma Activated Water (PAW): Chemistry, Physico-Chemical Properties, Applications in Food and Agriculture. Trends Food Sci. Technol. 2018, 77, 21–31. [Google Scholar] [CrossRef]
- Zhao, X.; Tian, Y. Sustainable Nitrogen Fixation by Plasma-Liquid Interactions. Cell Rep. Phys. Sci. 2023, 4, 101618. [Google Scholar] [CrossRef]
- Gromov, M.; Kamarinopoulou, N.; De Geyter, N.; Morent, R.; Snyders, R.; Vlachos, D.; Dimitrakellis, P.; Nikiforov, A. Plasma-Assisted Nitrogen Fixation: The Effect of Water Presence. Green Chem. 2022, 24, 9677–9689. [Google Scholar] [CrossRef]
- Bae, J.H.; Lee, H.; Huh, S.C.; Park, S. Nitric and Nitrous Acid Formation in Plasma-Treated Water: Decisive Role of Nitrogen Oxides (NOx=1–3). Chemosphere 2024, 364, 143105. [Google Scholar] [CrossRef] [PubMed]
- Zhou, R.; Zhou, R.; Wang, P.; Xian, Y.; Mai-Prochnow, A.; Lu, X.; Cullen, P.J.; Ostrikov, K.K.; Bazaka, K. Plasma-Activated Water: Generation, Origin of Reactive Species and Biological Applications. J. Phys. D Appl. Phys. 2020, 53, 303001. [Google Scholar] [CrossRef]
- Thomas, D.; Vanderschuren, J. Nitrogen Oxides Scrubbing with Alkaline Solutions. Chem. Eng. Technol. 2000, 23, 449–455. [Google Scholar] [CrossRef]
- Sun, Y.; Zwolińska, E.; Chmielewski, A.G. Abatement Technologies for High Concentrations of NOx and SO2 Removal from Exhaust Gases: A Review. Crit. Rev. Environ. Sci. Technol. 2016, 46, 119–142. [Google Scholar] [CrossRef]
- Liu, B.; Peng, D.; Chiang, P.-C.; Chu, C. Performance Evaluation of NOx Absorption by Different Denitration Absorbents in Wet Flue Gas Denitration. J. Taiwan. Inst. Chem. Eng. 2023, 145, 104840. [Google Scholar] [CrossRef]
- Zhu, Z.; Xu, B. Purification Technologies for NOx Removal from Flue Gas: A Review. Separations 2022, 9, 307. [Google Scholar] [CrossRef]
- Skalska, K.; Miller, J.S.; Ledakowicz, S. Intensification of NOx Absorption Process by Means of Ozone Injection into Exhaust Gas Stream. Chem. Eng. Process. Process Intensif. 2012, 61, 69–74. [Google Scholar] [CrossRef]
- Thomas, D.; Vanderschuren, J. The Absorption-Oxidation of NOx with Hydrogen Peroxide for the Treatment of Tail Gases. Chem. Eng. Sci. 1996, 51, 2649–2654. [Google Scholar] [CrossRef]
- Myers, E.B.; Overcamp, T.J. Hydrogen Peroxide Scrubber for the Control of Nitrogen Oxides. Environ. Eng. Sci. 2002, 19, 321–327. [Google Scholar] [CrossRef]
- Si, M.; Shen, B.; Adwek, G.; Xiong, L.; Liu, L.; Yuan, P.; Gao, H.; Liang, C.; Guo, Q. Review on the NO Removal from Flue Gas by Oxidation Methods. J. Environ. Sci. 2021, 101, 49–71. [Google Scholar] [CrossRef]
- Ghriss, O.; Ben Amor, H.; Jeday, M.-R.; Thomas, D. Pilot-Scale Validation of the Modeling of NOx Reactive Absorption Process Using Aqueous Solutions Containing Nitric Acid and Hydrogen Peroxide. Period. Polytech. Chem. Eng. 2024, 68, 50–60. [Google Scholar] [CrossRef]
- Patwardhan, J.A.; Joshi, J.B. Unified Model for NOx Absorption in Aqueous Alkaline and Dilute Acidic Solutions. AIChE J. 2003, 49, 2728–2748. [Google Scholar] [CrossRef]
- Manaigo, F.; Rouwenhorst, K.; Bogaerts, A.; Snyders, R. Feasibility Study of a Small-Scale Fertilizer Production Facility Based on Plasma Nitrogen Fixation. Energy Convers. Manag. 2024, 302, 118124. [Google Scholar] [CrossRef]
- Abdelaziz, A.A.; Komuro, A.; Teramoto, Y.; Kim, D.Y.; Nozaki, T.; Kim, H.H. Modulating Dynamic Equilibrium to Enhance Plasma NOxformation for Efficient Green Fertilizer Production. J. Environ. Chem. Eng. 2025, 13, 118779. [Google Scholar] [CrossRef]
- Aoki, M.; Tanaka, H.; Komiyama, H.; Inoue, H. Simultaneous Absorption of NOx and NO2 into Alkaline Solutions. J. Chem. Eng. Jpn. 1982, 15, 362–367. [Google Scholar] [CrossRef]
- Lange, N.A.; Speight, J.G. Lange’s Handbook of Chemistry, 16th ed.; McGraw-Hill Education: New York, NY, USA, 2005; ISBN 0071432205. [Google Scholar]
- Braida, W.; Ong, S.K. Decomposition of Nitrite Under Various PH and Aeration Conditions. Water Air Soil. Pollut. 2000, 118, 13–26. [Google Scholar] [CrossRef]
- Denra, A.; Saud, S.; Nguyen, D.B.; Trinh, Q.T.; Nguyen, T.K.; An, H.; Nguyen, N.T.; Teke, S.; Mok, Y.S. Nitrogen Fixation by Rotational Gliding Arc Plasma at Surrounding Conditions. J. Clean. Prod. 2024, 436, 140618. [Google Scholar] [CrossRef]
- Ghriss, O.; Amor, H.B.; Jeday, M.-R.; Thomas, D. Nitrogen Oxides Absorption into Aqueous Nitric Acid Solutions Containing Hydrogen Peroxide Tested Using a Cables-Bundle Contactor. Atmos. Pollut. Res. 2019, 10, 180–186. [Google Scholar] [CrossRef]
- Li, Y.; Liu, Y.; Zhang, L.; Su, Q.; Jin, G. Absorption of NOx into Nitric Acid Solution in Rotating Packed Bed. Chin. J. Chem. Eng. 2010, 18, 244–248. [Google Scholar] [CrossRef]
- Hüpen, B.; Kenig, E.Y. Rigorous Modelling of NOx Absorption in Tray and Packed Columns. Chem. Eng. Sci. 2005, 60, 6462–6471. [Google Scholar] [CrossRef]
- Counce, R.M.; Perona, J.J. Gaseous Nitrogen Oxide Absorption in a Sieve-Plate Column. Ind. Eng. Chem. Fundam. 1979, 18, 400–406. [Google Scholar] [CrossRef]
- Schwartz, S.E.; White, W.H. Kinetics of Reactive Dissolution of Nitrogen Oxides into Aqueous Solution. Adv. Environ. Sci. Technol. 1983, 12, 1–116. [Google Scholar]
- Suchak, N.J.; Jethani, K.R.; Joshi, J.B. Modeling and Simulation of NOx Absorption in Pilot-scale Packed Columns. AIChE J. 1991, 37, 323–339. [Google Scholar] [CrossRef]
- Ingale, N.D.; Chatterjee, I.B.; Joshi, J.B. Role of Nitrous Acid Decomposition in Absorber and Bleacher in Nitric Acid Plant. Chem. Eng. J. 2009, 155, 851–858. [Google Scholar] [CrossRef]
- Rayson, M.S.; Mackie, J.C.; Kennedy, E.M.; Dlugogorski, B.Z. Accurate Rate Constants for Decomposition of Aqueous Nitrous Acid. Inorg. Chem. 2012, 51, 2178–2185. [Google Scholar] [CrossRef]
- Abel, E.; Schmid, H. Kinetik der Salpetrigen Säure. Z. Für Phys. Chem. 1928, 132U, 55–77. [Google Scholar] [CrossRef]
- Thomas, D.; Vanderschuren, J. Modeling of NOx Absorption into Nitric Acid Solutions Containing Hydrogen Peroxide. Ind. Eng. Chem. Res. 1997, 36, 3315–3322. [Google Scholar] [CrossRef]
- Sander, R. Compilation of Henry’s Law Constants (Version 5.0.0) for Water as Solvent. Atmos. Chem. Phys. 2023, 23, 10901–12440. [Google Scholar] [CrossRef]
- Thomas, D.; Vanderschuren, J. Analysis and Prediction of the Liquid Phase Composition for the Absorption of Nitrogen Oxides into Aqueous Solutions. Sep. Purif. Technol. 1999, 18, 37–45. [Google Scholar] [CrossRef]
- Talviste, R.; Jõgi, I.; Raud, S.; Noori, H.; Raud, J. Nitrite and Nitrate Production by NO and NO2 Dissolution in Water Utilizing Plasma Jet Resembling Gas Flow Pattern. Plasma Chem. Plasma Process. 2022, 42, 1101–1114. [Google Scholar] [CrossRef]
- Potassium Nitrite. KNO2. CID 516910—PubChem. Available online: https://pubchem.ncbi.nlm.nih.gov/compound/Potassium-nitrite#section=Boiling-Point (accessed on 14 November 2025).
- Nitrous Acid|HNO2|CID 24529—PubChem. Available online: https://pubchem.ncbi.nlm.nih.gov/compound/Nitrous-Acid (accessed on 14 November 2025).
- Lee, E.; Rout, P.R.; Bae, J. The Applicability of Anaerobically Treated Domestic Wastewater as a Nutrient Medium in Hydroponic Lettuce Cultivation: Nitrogen Toxicity and Health Risk Assessment. Sci. Total Environ. 2021, 780, 146482. [Google Scholar] [CrossRef] [PubMed]
- Hoque, M.M.; Ajwa, H.A.; Smith, R. Nitrite and Ammonium Toxicity on Lettuce Grown under Hydroponics. Commun. Soil. Sci. Plant Anal. 2007, 39, 207–216. [Google Scholar] [CrossRef]
- Shen, Q.R.; Ran, W.; Cao, Z.H. Mechanisms of Nitrite Accumulation Occurring in Soil Nitrification. Chemosphere 2003, 50, 747–753. [Google Scholar] [CrossRef] [PubMed]
- Beeckman, F.; Motte, H.; Beeckman, T. Nitrification in Agricultural Soils: Impact, Actors and Mitigation. Curr. Opin. Biotechnol. 2018, 50, 166–173. [Google Scholar] [CrossRef]
- Tsukahara, H.; Ishida, T.; Mayumi, M. Gas-Phase Oxidation of Nitric Oxide: Chemical Kinetics and Rate Constant. Nitric Oxide 1999, 3, 191–198. [Google Scholar] [CrossRef]
- Tsonev, I.; O’Modhrain, C.; Bogaerts, A.; Gorbanev, Y. Nitrogen Fixation by an Arc Plasma at Elevated Pressure to Increase the Energy Efficiency and Production Rate of NOx. ACS Sustain. Chem. Eng. 2023, 11, 1888–1897. [Google Scholar] [CrossRef]
- Angineni, J.; Reddy, P.M.K.; Anga, S.; Somaiah, P.V. Nitrogen Fixation by Simple Gling Arc Plasma Reactor at Elevated Pressure for Synthesis of Aqueous Nitrogen Fertilizer. Plasma Process. Polym. 2025, 22, 2400209. [Google Scholar] [CrossRef]
Disclaimer/Publisher’s Note: The statements, opinions and data contained in all publications are solely those of the individual author(s) and contributor(s) and not of MDPI and/or the editor(s). MDPI and/or the editor(s) disclaim responsibility for any injury to people or property resulting from any ideas, methods, instructions or products referred to in the content. |
© 2025 by the authors. Licensee MDPI, Basel, Switzerland. This article is an open access article distributed under the terms and conditions of the Creative Commons Attribution (CC BY) license (https://creativecommons.org/licenses/by/4.0/).