Abstract
This study aimed to extract rice bran oil rich in γ-oryzanol from white (WB) and parboiled rice bran (PB) using ultrasound as a pre-treatment to supercritical fluid extraction (US + SFE), supercritical fluid extraction (SFE), and conventional solvent extraction. PB oil exhibited superior quality compared to WB, with low free fatty acid (FFA) levels and higher γ-oryzanol content. PB oil extracted by US + SFE achieved a yield of 18.2 ± 0.4%, γ-oryzanol content of 1.53 ± 0.19 g 100 g−1, and low FFA content (0.27 ± 0.01%), showing improved oil quality compared to SFE (yield 13.5 ± 0.3%, γ-oryzanol 1.13 ± 0.08%, FFA 0.55 ± 0.01%) and conventional extraction (yield 25.0 ± 1.3%, γ-oryzanol 2.03 ± 0.04%, FFA 1.12 ± 0.01%). The US + SFE oil also showed lower peroxide value (1.7 mEq kg−1) and preserved fatty acid profiles containing palmitic, oleic, and linoleic acids. US induced structural disruption in bran, enhancing oil release. Additionally, chitosan–gelatin nanoemulsions were developed to protect the extracted oil. Formulations exhibited droplet sizes of 119–352 nm, polydispersity indices below 0.3, and zeta potentials from –12.4 to 38.8 mV. Gelatin-based nanoemulsions maintained FFAs at 0.56 ± 0.2% and peroxide values at 4.71 ± 0.2 mEq kg−1 over 90 days, demonstrating superior oxidative stability. These results highlight the potential of US and SFE combined with nanostructured delivery systems to valorize agro-industrial byproducts and develop stable, functional ingredients and drug carrier systems.
1. Introduction
Rice is considered one of the world’s most important food crops, with significant importance in both economic and nutritional contexts. Brazil is the leading producer in South America, with annual production reaching approximately 7.2 million metric tons, while China is the world’s largest producer, with around 144 million metric tons [1]. After harvesting, rice undergoes processing steps in which the husk and bran are removed, making it suitable for human consumption.
White rice is obtained after polishing, during which the outer layers of the grain are removed. The bran generated from this process exhibits high lipase and lipoxygenase activities, making it highly susceptible to enzymatic hydrolysis and oxidation, which limit its stability and shelf life. In contrast, parboiled rice undergoes a hydrothermal (partial precooking) treatment prior to dehulling. This process promotes starch gelatinization, improves nutrient retention, and partially inactivates enzymes, resulting in greater oxidative stability, although it requires more energy and increases production costs [2]. Regardless of its origin, rice bran is an important source of carbohydrates (34–54% w w−1), lipids (13–23% w w−1), proteins (12–17% w w−1), fiber (6–14% w w−1), ash (8–18% w w−1), and several bioactive compounds [3]. Despite its nutritional value, most rice bran is still underutilized, being primarily used as poultry feed, burned as fuel, or discarded, with only a small fraction processed into rice bran oil (RBO). This limited valorization results in resource loss and environmental impacts. Its commercial value remains low, averaging USD 180–280 per ton, with less than 10% used for food applications [4].
Although rice bran is still underutilized, it represents a promising raw material due to its high stability of bioactive compounds, such as polyunsaturated fatty acids (PUFAs) and γ-oryzanol [5]. γ-oryzanol is a compound with numerous beneficial properties for health, including reducing the incidence of cancer, controlling coronary heart disease, reducing cholesterol levels, antioxidant properties and anti-inflammatory activity [6]. However, the extraction of RBO still presents specific challenges, particularly in preventing oxidation. The susceptibility to oxidation is primarily attributed to the interaction between the oil and rice bran lipase and lipoxygenase, which results in the hydrolysis of the oil into free fatty acids [7].
Therefore, the methods employed in RBO extraction are crucial for avoiding oxidation and preserving the bioactive compounds [8]. Cell disruption and thermal stabilization techniques of rice bran can be applied as pretreatment for oil extraction [5]. Among the extraction methods, solvent extraction remains the most widely used for RBO extraction, both in research and industry, requiring high volumes of solvent (ethanol, hexane, dichloromethane, ethyl acetate, petroleum ether, ethyl ether), high temperatures, and long processing times [9]. However, in the current context of the climate crisis, there is a growing interest in unconventional alternatives, such as the use of ultrasound (US), electrical technologies, and supercritical fluid extraction (SFE) [10]. These methods offer advantages such as shorter processing times, reduced use of solvents, lower temperatures (which are favorable to the preservation of bioactive compounds), and better control of acidity [9,11].
US as an extraction pretreatment is a promising and relatively unexplored technique for extracting RBO. The process utilizes sound waves that promote the formation of cavitation bubbles, the collapse of which causes cell rupture, mass transfer, and the extraction of intracellular compounds [12,13]. Given its advantages, US can be combined with other non-conventional methods, such as SFE [14]. SFE is widely applied for plant matrices oil extraction [15,16]. In this technique, fluids exist in a supercritical state, exhibiting properties of both liquids and gases, when subjected to conditions above their critical temperature and pressure. The specific temperature–pressure combination governs fluid diffusivity, which directly impacts extraction efficiency. Because viscosity and diffusivity are inversely related, reduced viscosity facilitates deeper solvent penetration into the sample matrix, thereby enhancing lipid extraction yields [17].
The food industry has been exploring the expansion of unsaturated fatty acid intake by the population through the development of functional foods. In this sense, nanoemulsions have been studied as delivery systems for the transport of different functional ingredients. Designed to protect bioactive compounds for various administration purposes, nanoemulsions are produced from emulsions with droplet sizes ranging from 20 to 500 nm. The efficacy of nanocapsules depends, among other factors, on the characteristics of the wall material and the level of interactions [18]. Chitosan is a biodegradable and non-toxic linear cationic polysaccharide obtained by alkaline deacetylation of chitin [19,20]. Gelatin is a protein derived from the partial hydrolysis of animal collagen, presenting many different functional groups accessible in its structure [21]. Chitosan and gelatin can be used to prepare nanocapsules of various shapes and sizes, enhancing shelf life, texture, and stability through their surface properties [22,23].
Although nanoemulsions are widely studied, several formulation approaches have been proposed depending on the type of oil, surfactant system, and processing method. Recent studies have shown the use of high-energy and low-energy techniques, multicomponent stabilizing systems, and biopolymer-based coatings to enhance stability and protect bioactive compounds [24,25,26]. Nonetheless, the application of nanoemulsions specifically designed to encapsulate RBO rich in γ-oryzanol is still limited, particularly when targeting oxidative protection during long-term storage. Furthermore, there is a lack of studies integrating emerging extraction technologies (US pretreatment + supercritical CO2 extraction) with biopolymer-based nanoemulsion stabilization.
The aim of this study was to perform a practical and environmentally friendly extraction of RBO rich in γ-oryzanol using ultrasound combined with supercritical fluid (US + SFE), and to evaluate chitosan and gelatin as carriers for the oxidative protection of RBO rich in γ-oryzanol in nanocapsules of these biopolymeric materials.
2. Materials and Methods
2.1. Material
The raw materials, white (WB) and parboiled (PB) rice brans, were obtained from a rice processing industry located in Pelotas, RS, Brazil and stored at −18 °C until further use. Rice brans were characterized according to the AOAC methodology [27] for moisture (method 925.10), ash (method 945.46), and protein content (method 960.52). Carbohydrates were estimated by difference following AOAC guidelines. The lipid content was determined by the Bligh and Dyer method [28].
Chitosan (high molecular weight ~ 670 kDa, deacetylated degree > 70%), and gelatin from bovine skin (type B, gel strength of 225 g Bloom) were purchased from Sigma-Aldrich (Barueri, SP, Brazil). Ethyl alcohol, ethyl ether, phenolphthalein, sodium hydroxide, isopropyl alcohol, acetic acid, and surfactant Tween 80® (Polyoxyethylen–20–sorbitan–monooleate) were acquired from Êxodo Científica (Sumaré, SP, Brazil). All other used reagents were of analytical grade. Carbon dioxide (99.9%) was supplied by White Martins (Rio de Janeiro, RJ, Brazil).
2.2. Rice Bran Oil Extraction
RBO was extracted using: US + SFE; SFE; and a conventional method. For US + SFE, US was used as a pretreatment to promote tissue disruption, thereby evaluating its effect on the oil extraction yield from rice bran. The experiments were conducted using a probe-type ultrasonic device (Ultrasonic Homogenizer EL-HX1000E, Elevelab, Porto Alegre, RS, Brazil; 20 kHz, 6 mm probe diameter, 1000 W) operated at 60% of amplitude for 30 min. This condition was selected based on a preliminary assessment in which amplitudes between 45% and 60% were tested, and the highest amplitude consistently resulted in greater oil extraction yields. A total of 20 g of WB or PB was used for each trial, mixed with 100 mL of distilled water (solid-to-solvent ratio of 0.2 g mL−1) in a 250 mL jacketed glass cell. US treatments were conducted under controlled temperature conditions (≤30 °C), and the temperature was continuously monitored throughout the process. After treatment, samples were centrifuged (6000× g, 20 min) to separate the supernatant and then freeze-dried (Liobras, K108, São Carlos, SP, Brazil) for 48 h, −80 °C and 52 µmHg to remove residual moisture. The samples were then subjected to SFE. Control experiments were also performed using SFE without the US pretreatment.
Figure 1 presents a scheme of the SFE setup. The CO2 cylinder was connected to the syringe pump (model 500D ISCO, TELEDYNE, Lincoln, NE, USA) which is equipped with a water jacket coupled to a termostatic bath, ensuring that CO2 remained cooled before pressurization. The equipment also comprised a 62.4 cm3 stainless steel extraction vessel, with 19 mm diameter and 220 mm bed height, coupled to a circulation bath. The experiments were realized with supercritical CO2 and ethanol as cosolvent. Ethanol increases CO2 polarity, improving solubility and mass transfer of more polar components such as γ-oryzanol. For that, approximately 20 g of sample was loaded into the extraction vessel. Supercritical CO2 was used as the solvent, and ethanol was employed as a cosolvent at a cosolvent-to-feed mass ratio (CFR) of 4:1. The extraction temperature and pressure were maintained at 40 ± 2 °C and 25 MPa, respectively. After pressurization, a static period of 5 min was applied to allow thermal and mechanical equilibrium. Then, the dynamic extraction took place, with a CO2 flow rate of 5.0 g min−1 for a total extraction time of 60 min. The process parameters, such as temperature, pressure, flow rate and CFR, were selected based on previous studies [29,30]. After the extraction period, decompression was performed gradually by opening the control valve at a constant rate (5.0 g min−1), allowing CO2 to expand and separate from the extract in the separator vessel. The extract was collected from the separator after complete depressurization.
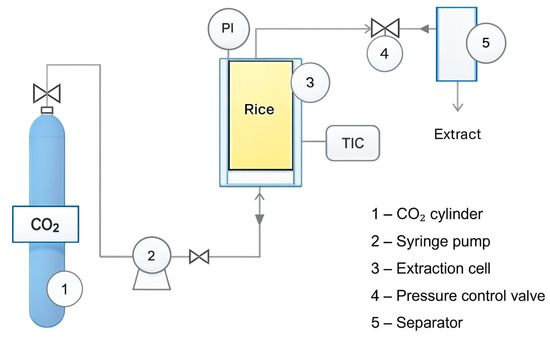
Figure 1.
Supercritical fluid extractor.
The cosolvent (ethanol) was evaporated from the oil extracts in an oven at 40 ± 2 °C, under vacuum conditions, until constant weight, resulting in RBO. The RBO samples were collected in glass flasks, weighted using an analytical balance, and stored at −18 °C for further analysis. The extraction yield (gRBO100 g−1dry solid) was calculated as the ratio of the total mass of RBO to the mass of raw material used to feed the system on a dry basis, according to Equation (1).
Soxhlet extraction with ethanol solvent was used as a conventional method of extraction for comparison [30]. The extraction was performed at the solvent’s boiling temperature at atmospheric pressure for 8 h, using 5 g of WB or PB and 180 mL of solvent. After, the solvent was evaporated from oil extracts in an air-circulating oven at 40 ± 2 °C, under vacuum conditions until constant weight. All extractions were performed in triplicate.
2.3. Analytical Methodology for Extract Characterization
The γ-oryzanol content was determined according to the method of Codex Stan 210-1999 [31], with minor modifications [32]. Approximately 0.01 g of sample was dissolved in 10 mL of isopropyl alcohol, and the absorbance was read at 327 nm in a 1 cm cell (UV-1601, Shimadzu Corporation, Kyoto, Japan). The γ-oryzanol content (g 100 g−1) was calculated using Equation (2).
where W is the weight of the sample, A is the extinction coefficient (absorbance) of the sample solution, and E is the specific extinction coefficient = 338.
The percentage of free fatty acids (%FFAs) and peroxide value (PV) were determined according to AOCS methodology [33] and calculated by Equations (3) and (4).
where is the volume of sodium thiosulfate spent on the sample titration, VB is the volume of the blank titration, is the normality of the sodium thiosulfate, and W is the oil weight., is the volume of sodium hydroxide spent on the sample titration, and corresponds to the molarity of the NaOH solution.
The iodine value (IV) and the saponification value (SV) were determined by nuclear magnetic resonance (NMR) (Bruker High Field, model 400 MHz Ascend, Rheinstetten, Germany). NMR spectra were recorded using a 400 MHz (1H) spectrometer equipped with a 9.4 T magnet and a 5 mm probe. For analysis, 20 mg of lipid were dissolved in 0.7 mL of CDCl3 and placed in the instrument. A standard 1H pulse sequence with a 90° pulse was applied, using an acquisition time of 9.109 s, 2000 scans, and a spectral width of 24.03 kHz. By using the integrated signal of 1H NMR spectra data of aliphatic and olefinic hydrogens, Equations (5)–(7) were used to determine the average molecular weight, iodine value (IV), and saponification value (SV).
in which Mw is triacylglycerol molecular weight, T is the total hydrogen content (%), and V is the vinyl hydrogen.
Fatty acids were identified by gas chromatography (Shimadzu, GCMSQP2010 Plus, Tokyo, Japan), and the injection in the equipment was in the methyl esters form [34]. The samples were derivatized following the protocol of Hartman & Lago [35]. A 10% (w/v) KOH solution in methanol was added, and the mixture was dispersed in an ultrasonic bath. It was then incubated in a water bath at 60 °C for 90 min. Afterward, 1 M H2SO4 was introduced and the incubation step was repeated for another 90 min. Once cooled, n-hexane was added, the tube was vortexed, and briefly centrifuged to allow phase separation. The upper organic layer was collected and stored in an amber vial under refrigeration until chromatographic analysis.
2.4. Nanoemulsions Preparation
The RBO rich in γ-oryzanol obtained from the better extraction method was used in the formulations of chitosan and gelatin nanoemulsions to evaluate the use of different biopolymeric carriers for oxidative protection. The aqueous phase was prepared by dissolving chitosan in 1% (v v−1) acetic acid solution and gelatin in distilled water for 12 h, under stirring (300 rpm) at 25 °C. The total biopolymer concentration was 1% (w v−1), with different mass ratios of chitosan to gelatin: 100CH:0G; 50CH:50G; 0CH:100G. Afterward, RBO (1%, w v−1) and surfactant Tween 80® (Polyoxyethylen–20–sorbitan–monooleate) (5% of the total amount of biopolymer) were added to the aqueous phase. This surfactant was selected for its biocompatibility and effectiveness in stabilizing oil-in-water nanoemulsions [36]. The biopolymer solutions were not buffered, so the pH remained the same as the solutions formed, being approximately 4.4. The nanoemulsions were produced using a high–energy emulsification method by a mechanical stirrer (Dremel, model 300, Mount Prospect, IL, USA) at 13,000 rpm, always checked with a tachometer, for 20 min.
2.5. Nanoemulsion Characterization
2.5.1. Physicochemical Stability
The stability of the nanoemulsions was evaluated in test tubes over a period of 90 days at room temperature (25 °C) [37]. Weekly visual assessments were conducted to monitor phase separation. Nanoemulsions that remained stable (i.e., without visible phase separation) were characterized regarding their size distribution and polydispersity index (PDI) using dynamic light scattering (DLS) at 25 °C (Litesizer™ 500, Anton Paar, Graz, Austria), after a 500-fold dilution of the samples [25].
The zeta potential was determined via electrophoretic light scattering (ELS) using a Litesizer™ 500 (Anton Paar, Austria) at 25 °C. Electrolytes within the nanoemulsions passed through a capillary channel, producing distinct electrophoretic mobilities. These mobilities were calculated from the Doppler shift in scattered light according to the Helmholtz–Smoluchowski equation [25]. The pH of the nanoemulsions was measured by a digital pH meter (Marte, MB–10, Santa Rita do Sapucaí, MG, Brazil) at room temperature. The rheological properties of the nanoemulsions were evaluated immediately after their preparation. The apparent viscosity (ƞₐ) was measured using a viscometer (DV-III Ultra, Middleboro, MA, USA).
2.5.2. Oxidative Evaluation
The stability of RBO encapsulated in chitosan and gelatin nanoemulsions stored at 25 °C was assessed immediately after preparation (day zero) and up to 90 days thereafter by monitoring the %FFAs and PV until unacceptable values were observed according to the General Standard for Food Additives [38].
2.6. Electron Microscopy Analysis
The morphology and structure of nanoemulsion droplets were examined through transmission electron microscopy (TEM) (JEM-1230, Japanese Electronics, Tokyo, Japan) [39]. A drop of the nanoemulsion was placed on a copper grid pre-stained with phosphotungstic acid. Excess liquid was blotted with filter paper, and the sample was allowed to dry. The morphology was subsequently examined under a microscope, and the images were processed using Digital Micrograph software v 3.4 (Gatan, Pleasanton, CA, USA).
The microstructure of WB and PB, both before and after extraction, was evaluated using scanning electron microscopy (SEM, Jeol JSM-6610LV, Akishima, Tokyo, Japan) to determine the morphological changes resulting from extraction. The samples were mounted on stubs with double-sided adhesive and sputter-coated (Denton Vacuum, Desk V, Moorestown, NJ, USA) with gold. An accelerating voltage of 10 kV and magnifications of 1000× and 3000× were employed.
2.7. Statistical Analysis
Software Statistica 12.0 (Statsoft Inc., Tulsa, OK, USA) at a significance level of 95% (p ≤ 0.05) was used to perform data analysis. The experiments were performed in triplicate. The differences among the average values were evaluated by Analysis of variance (ANOVA) and Tukey’s test of multiple comparisons.
3. Results and Discussion
3.1. Rice Bran Characterization
For WB and PB, the moisture contents were 10.1 ± 0.1% and 9.2 ± 0.1%, the ash contents were 9.4 ± 0.5% and 12.3 ± 0.3%, lipids contents 11.0 ± 0.1% and 20.0 ± 0.4%, protein contents 10.9 ± 0.2% and 15.6 ± 0.1%, and carbohydrates contents 58.5 ± 0.1% and 42.9 ± 0.4%, respectively. The chemical compositions of WB and PB cited in the literature were: approximately 8–18% ash, 12–23% lipids, 12–17% proteins, and 34–54% carbohydrates [40]. The influence of different extraction methods on the yield, composition, and structure of RBO and rice bran was investigated. The results are presented and discussed in the following sections according to the type of material analyzed and the characterization approach applied.
3.2. Effect of Extraction Techniques on Rice Bran Yield, Bioactive Content, and Microstructure
Table 1 presents the extraction yield, %FFAs, and γ-oryzanol concentration for all extraction experiments. As expected, conventional solvent extraction produced the highest oil yield, given the strong solvating power of organic solvents toward both neutral and polar lipid fractions. In contrast, supercritical CO2 extraction typically results in lower yields because CO2 is highly selective for non-polar compounds and exhibits reduced solubility for polar lipids [16]. The use of ethanol as co-solvent increases CO2 polarity but still limits the extraction of lipid compounds, compared to Soxhlet extraction. Even when US was applied as a pretreatment, the US + SFE process did not fully compensate for the lower solvating capacity of CO2, leading to reduced extraction efficiency compared to the conventional method.

Table 1.
Extraction yield (%), free fatty acid (FFA), and γ-oryzanol content for rice bran oil from different extraction methods.
The extraction yield of PB oil using the US + SFE method was significantly higher (p ≤ 0.05) (18.2 ± 0.4%) compared to the SFE method (13.5 ± 0.3%), representing an extraction efficiency of around 72% of conventional extraction (25.0 ± 1.3%) for the same sample. This result proved that US treatment contributed to cell rupture, promoting a more significant release of RBO. Kayathi et al. [3] reported a yield of approximately 20% (w w−1) for the SFE of oil from rice bran using a high CO2 flow and an extended extraction time of 29.8 g min−1 and 2 h, respectively. In the present work, a satisfactory yield (8.3–18.2%) was achieved using an inferior CO2 flow rate (5 g min−1) and a shorter extraction time (1 h), with US treatment applied.
However, the effects of US treatment on WB did not result in significant differences (p > 0.05) in extraction yield, with values ranging from 8.3 ± 0.4% to 8.5 ± 1.1% for US + SFE and SFE methods, respectively. This fact may be associated with the parboiling process, which subjects the rice grain to heat, making the effect of US more pronounced in the oil extraction process. According to Aluthge et al. [5], the extractability of RBO can be increased through processes that use heat, steam, modification of cellular structure, tissue rupture, and drying.
Regarding the %FFAs, the US + SFE method yielded oils with significantly lower values (p ≤ 0.05), at 0.69 ± 0.01% and 0.27 ± 0.01% oleic acid for WB and PB, respectively. These values are below the threshold established by the Food and Drug Administration, making the oil suitable for human consumption (<1% oleic acid) [33]. Danielski et al. [38] applied SFE to reduce the FFA content while minimizing phytosterol loss in RBO during extraction. They found an FFA content of 1.46% oleic acid. In the present study, it was observed that US treatment promoted lower acidity values, mainly due to the cavitation-induced thermal and mechanical effects that contribute to the partial inactivation of lipase and lipoxygenase. The collapse of cavitation bubbles generates localized hotspots, shear stress, and micro-turbulence, which reduce the activity of these enzymes responsible for hydrolyzing triacylglycerols into FFAs. As a result, less lipid hydrolysis occurs prior to extraction, leading to lower FFA levels in the final oil [41]. Aluthge et al. [5] reported various thermal stabilization methods for rice bran to improve oil extractability and oxidative stability, including microwave heating, chemical stabilization or refrigeration, infrared radiation, ohmic heating, steam heating, and enzyme-based biological approaches. However, no results have been found so far regarding US treatment, highlighting the relevance of the present study.
In addition to the effect of US, the differences in FFA content among the extraction methods can be explained by the characteristics of each process and solvent system. In the conventional method (Soxhlet with ethanol), the solvent operates at reflux for extended periods (8 h), under continuous heating. Ethanol is known to extract FFAs [42], and these prolonged and exhaustive conditions enhance the solubilization of FFAs in the bran matrix, leading to the highest FFA levels. In contrast, supercritical CO2 extraction preferentially extracts non-polar lipids due to its low polarity. Although ethanol was added as a co-solvent to increase CO2 polarity, the overall polarity of the CO2/ethanol mixture remains lower than that of pure ethanol. As a result, SFE produced oils with lower FFA contents.
The γ-oryzanol contents ranged from 0.92 ± 0.03 to 2.03 ± 0.04 g 100 g−1, with the highest value observed in oils obtained by conventional extraction. Although the conventional method provided the highest levels of γ-oryzanol, the extracted oils presented acidity levels higher than the limits established by regulation, requiring a refining step to deacidify them. This additional step can result in significant losses of bioactive compounds, such as γ-oryzanol itself, in addition to increasing the complexity of the process. Losses are reported in the refining steps with a decrease in γ-oryzanol content from 4% (neutralization step) to 2.3% (during bleaching and deodorization step) [38,43].
The PB oil extracted by the US + SFE method showed a γ-oryzanol content of 1.53 ± 0.19 g 100 g−1, corresponding to 63% of the total content. Furthermore, a comparison between extraction methods for PB revealed that US + SFE produced RBO with significantly higher (p ≤ 0.05) amounts of γ-oryzanol than RBO obtained by the SFE method alone. These findings demonstrate that the US + SFE approach offers the advantage of obtaining RBO with reduced acidity while preserving desirable levels of bioactive compounds such as γ-oryzanol.
Although three analytical parameters were evaluated (extraction yield, %FFA and γ-oryzanol concentration), the selection of the optimal extraction condition was guided primarily by oil quality indicators rather than yield alone. For the nanoemulsion application proposed in this study, lower FFA levels and greater retention of γ-oryzanol were prioritized, as these parameters directly influence oxidative stability and functional bioactivity. Conventional solvent extraction indeed provided higher yields; however, it resulted in oils with elevated acidity and lower γ-oryzanol retention. In contrast, the combined US + SFE method produced slightly lower yields but offered clear improvements in FFA reduction and bioactive compound preservation. Therefore, when balancing both yield and quality criteria, the US + SFE condition was identified as the most advantageous extraction strategy.
Physical changes that happened on the particle surface were analyzed before and after extraction. The microstructures of the untreated material, as well as extracted samples using SFE and US + SFE are presented in Figure 2.

Figure 2.
Representative SEM micrographs of untreated white (WB) and parboiled (PB) rice bran and the bran residues after the extraction methods (SFE and US + SFE). The micrographs have a magnification of 1000× (A–C; G–I) or 3000× (D–F; J–L).
The US treatment acted by disrupting the cellular structure, thereby enhancing solvent permeation during the SFE process, as observed in the microscopies (Figure 2). It is evident that the rice bran residues following the extraction treatments appeared less agglomerated compared to the untreated samples. Furthermore, visible structural damage is observed in the PB after the US + SFE treatment, which supports the higher extraction yield of 18.2 ± 0.4%.
Martínez-Padilha et al. [44] reported that the use of US resulted in a higher oil yield, with %FFA and PV below the industrial specification level and enhanced phenolic compounds. Chen et al. [45] reported a similar effect on SEM images of coffee powders after using US combined with microwaves to remove oil. The mechanical vibration effect of the US wave and the simultaneous enhancement in the US system produced heavy vibration and instantaneous energy, leading to the destruction of the coffee cells, due to which the oil leaked out quickly rather than through a slow permeation process, resulting in higher extraction yields of green coffee oil.
Ruttarattanamongkol et al. [46] also reported an increase in the yield of RBO extraction by applying pre-extraction treatment with supercritical fluid. These structural changes in the rice bran facilitate the enhanced penetration of the supercritical fluid, thereby improving the efficiency of the oil extraction process.
3.3. Comparative Characterization of Rice Bran Oil: Conventional vs. Alternative Extraction Approaches
Only PB oil was selected for detailed characterization because this sample presented the most promising extraction results, with higher oil yield, lower FFA content, and higher γ-oryzanol concentrations. The quality and compositional parameters of RBO obtained from PB are compared in Table 2. Additionally, gas chromatography was used to identify fatty acid profiles, and 1H NMR spectroscopy (Figure 3) was employed to assess the chemical profile and potential compositional changes in RBO resulting from different extraction approaches.
Table 2.
Quality and compositional parameters of parboiled rice bran oil (RBO) obtained from conventional and US + SFE.
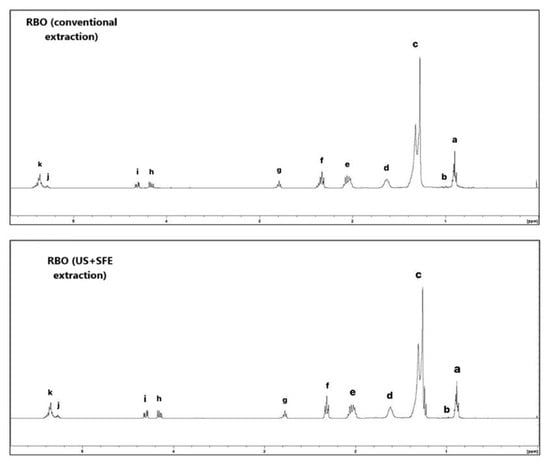
Figure 3.
1H NMR spectrum of RBO conventional and US + SFE methods. The characteristic signals of unsaturated fatty acids include the olefinic hydrogens at δ 5.40–5.26 ppm (k–j), which also comprise glycerol carbons. Hydrogens bonded to glycerol methylene groups appear at δ 4.32–4.10 ppm (i–h); to bis-allylic carbons at δ 2.80–2.70 ppm (g); and to α-carbonyl methylene groups at δ 2.35–2.20 ppm (f). Allylic hydrogens are observed at δ 2.10–1.90 ppm (e), followed by β-carbonyl methylene groups at δ 1.70–1.50 ppm (d). Other methylene carbons of fatty acids resonate at δ 1.40–1.15 ppm (c). Methyl groups of linolenic acid appear at δ 0.95 ppm (b), while the remaining methyl groups of fatty acids are detected at δ 0.88 ppm (a).
To determine the most suitable extraction method, all parameters in Table 2 were considered. However, for the nanoemulsion application proposed in this study, oil quality parameters were prioritized, particularly FFA content and PV, as these directly influence oxidative stability and long-term emulsion performance. Although the conventional method produced oil with higher γ-oryzanol content and a greater proportion of unsaturated fatty acids, it also resulted in oil with significantly higher FFA and PV, indicating a more advanced stage of oxidation. In contrast, the RBO obtained through the US + SFE method showed a significant reduction (p ≤ 0.05) in %FFA and PV compared to the RBO obtained by the conventional extraction method, while maintaining acceptable γ-oryzanol levels. This is likely due to the mild temperature conditions of the process (40 °C), as well as the selectivity of supercritical extraction in removing impurities. Therefore, the US + SFE method was selected as the best extraction strategy when balancing compositional properties with overall oil quality. The values obtained are within the acceptable limits for human consumption. According to the Codex Alimentarius Commission, these values (PV ≤ 5 mEq kg−1 and %FFA ≤ 0.3) confirm that the oil used in this study meets the required quality standards, classifying it as refined RBO [31,47].
Ruttarattanamongkol et al. [46] observed that the concentration of γ-oryzanol increased significantly with the extraction time using SFE, becoming consistent after 80 min and reaching the maximum content at 100 min. The authors obtained a γ-oryzanol content in RBO stabilized at around 10,000 and 30,000 mg kg−1 after 80 min and 100 min. In the present work, values close to γ-oryzanol were found, equivalent to 15,300 mg kg−1 (1.53 ± 0.19 g 100 g−1) using a shorter extraction time of 1 h with the US + SFE method. These findings suggest that US + SFE is an effective method for extracting high-value bioactive compounds from rice bran, particularly for maximizing γ-oryzanol production.
By using the integrated signal of the 1H NMR spectra (Figure 3) corresponding to aliphatic and olefinic hydrogens (a–k) and applying Equations (5)–(7), it was possible to determine the iodine value (IV) and saponification value (SV), which were approximately 92 ± 2 cgI2 g−1 and 163 ± 1 mgKOH g−1 for RBO (conventional method), and 90 ± 2 cgI2 g−1 and 168 ± 1 mgKOH g−1 for RBO (US + SFE method). These results are consistent with literature data for RBO [30]. The IV is associated with the unsaturation degree of the oil, while the SV indicates the average molecular weight of the fatty acids; these values were not significantly changed (p > 0.05) by the different extraction approaches, confirmed by the similarity of 1H NMR spectrum for both samples of RBO (Figure 3).
The dominant fatty acids in all RBO samples are palmitic (C16:0), oleic (C18:1), and linoleic (C18:2) acids (Table 2), which is consistent with previous reports [30,48]. A reduction in linoleic acid content was observed for RBO (US + SFE). Phan et al. [48] reported that ultrasonic intensity had a strong effect on unsaturated fatty acids, particularly linolenic acid in RBO. This was attributed to US-induced cavitation, which altered the structural and functional components of unsaturated fatty acids.
3.4. Characterization of Chitosan-Gelatin-Rice Bran Oil Nanoemulsions
The RBO used in the nanoemulsion experiments was extracted from PB using the combined US + SFE process, in accordance with the previously presented results. The physical characteristics of the chitosan and gelatin nanoemulsions were evaluated to understand their colloidal stability and structural behavior. The parameters analyzed included particle size, PDI, zeta potential, viscosity, and pH (Table 3). Among the evaluated parameters, particle size, PDI, and zeta potential were prioritized, as they are most directly associated with the physicochemical stability of the nanoemulsions.
Table 3.
Size distributions, polydispersity index (PDI), zeta potential, viscosity, and pH of nanoemulsions.
All emulsions exhibited droplet sizes within the nanoemulsions range (20–500 nm). However, a significant reduction in droplet size was observed in the nanoemulsions 50CH:50G and 0CH:100G compared to the pure chitosan nanoemulsion (100CH:0G). All samples showed a PDI lower than 0.3. The PDI is a measure of the breadth of the particle size distribution, with values ranging from 0 to 1. The lower the value, the more homogeneous the sample, and values below 0.3 are considered appropriate.
The zeta potential increased with the chitosan amount, with values ranging from 36.3 to 38.8 mV for 50CH:50G and 100CH:0G nanoemulsions, while pure gelatin formulation (0CH:100G) exhibited a negative value of −12.4 mV. The positive results for nanoemulsions 50CH:50G and 100CH:0G should be attributed to the presence of a positive charge on the chitosan molecule when in an acidic medium (pH ≈ 3.7) [49]. Vilanculos et al. [25] prepared chitosan–xanthan gum–PUFA nanoemulsions and found a pronounced positive zeta potential value (39.8 mV) for the nanoemulsion of pure chitosan, which is related to protonated amino groups through the chitosan structure. The reduction in droplet charge in the blends can be explained by the partial substitution of chitosan (a cationic biopolymer) with gelatin, which is an amphoteric biopolymer and, therefore, has a lower charge on the droplet surface.
The negative charge of 0CH:100G nanoemulsion can be attributed to the amphoteric character of gelatin. Gelatin is an amphoteric polyelectrolyte macromolecule, meaning it contains both cationic and anionic groups in its structure and can act as either an acid or a base, depending on the pH of the medium. Type B gelatin obtained by alkaline hydrolysis of collagen (generally from bovine leather) has an isoelectric point (Ip) of approximately 4.7 to 5.2. This indicates that nanoemulsions with a pH above the isoelectric point will acquire a negative charge [49]. Khramtsov et al. [50] developed nanoparticles from type B gelatin, which had a zeta potential of around –11 mV. This value is significantly below the conventional limit of ±30 mV associated with colloidal stability conferred by electrostatic repulsion [51]. This observation suggests that the stability of the nanoparticles is not due exclusively to electrostatic interactions, but rather to the contribution of other stabilizing forces, as confirmed by the results obtained in the detailed analysis of colloidal stability conducted by the authors.
It was observed that the apparent viscosity of the nanoemulsions decreased with the addition of gelatin, with values of 24, 20, and 5 mPa. s for 100CH:0G, 50CH:50G, and 0CH:100G, respectively. The higher viscosity values can be explained by the high molecular weight (≈670 kDa) of the chitosan used in the preparation of nanoemulsions. In contrast, the average molecular weight of gelatin (225 Bloom) is 40–50 kDa, with this value being related to the Bloom number, which measures the gel strength. The differences in polymer molecular weight are significant for modulating the rheological and texture properties of the nanoemulsions, which may affect not only their physicochemical stability but also the development of distinct food products. Vilanculos et al. [25] found apparent viscosity values ranging from 5 to 20 mPa. s for chitosan emulsions with low to medium molecular weight (<300 kDa).
TEM analysis was performed to identify the size, shape, and dispersion of components in polymer matrices and verify the formation of aggregates and structural homogeneity (Figure 4). TEM images reveal predominantly spherical nanocapsules, characteristics previously described in studies [25,50]. The observed dimensions are in accordance with the size range previously determined by dynamic light scattering (DLS) analyses, in the range of 200–300 nm for 100CH:0G and 100–200 nm for 50CH:50G and 0CH:100 G. The average diameter of the pure gelatin 0CH:100 G nanoemulsion obtained by TEM (<100 nm) was smaller than the hydrodynamic diameter (Table 3), which is explained by the well-known tendency of DLS to overestimate the size of the nanoparticles. Furthermore, microscopy revealed a more homogeneous size distribution of the 0CH:100 nanoemulsion.
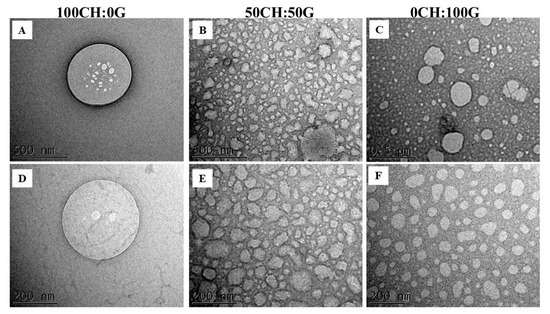
Figure 4.
Transmission electron microscopy (TEM) of nanoemulsions. Scale bars are 500 nm (A–C) or 200 nm (D–F). Samples were prepared with different mass ratios of chitosan to gelatin: 100CH:0G, 50CH:50G, and 0CH:100G.
3.5. Stability of Chitosan-Gelatin-RBO Nanoemulsions
The stability of nanoemulsions upon storage is necessary for their practical application in any field. The chitosan–gelatin–RBO nanoemulsions presented visually stably after 90 days (Figure 5) with no phase separation. All formulations maintained physical stability throughout storage, with no creaming, sedimentation, or other visual destabilization phenomena. After storage, when creaming is formed (phase separation), emulsions separate into an optically opaque layer at the top, a strongly turbid layer in the middle, and/or a slightly turbid layer at the bottom. Due to its small droplet size, the nanoemulsions have shown increased stability to gravitational separation or aggregation. The stability of the chitosan–gelatin–RBO nanoemulsions was evaluated over 90 days by monitoring the %FFA and PV (Figure 6).
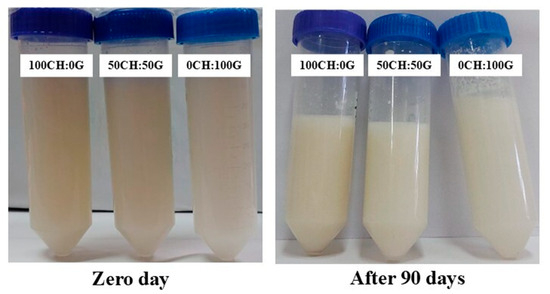
Figure 5.
Visual appearance of chitosan–gelatin–RBO nanoemulsions upon storage. Samples were prepared with different mass ratios of chitosan to gelatin: 100CH:0G, 50CH:50G, and 0CH:100G.
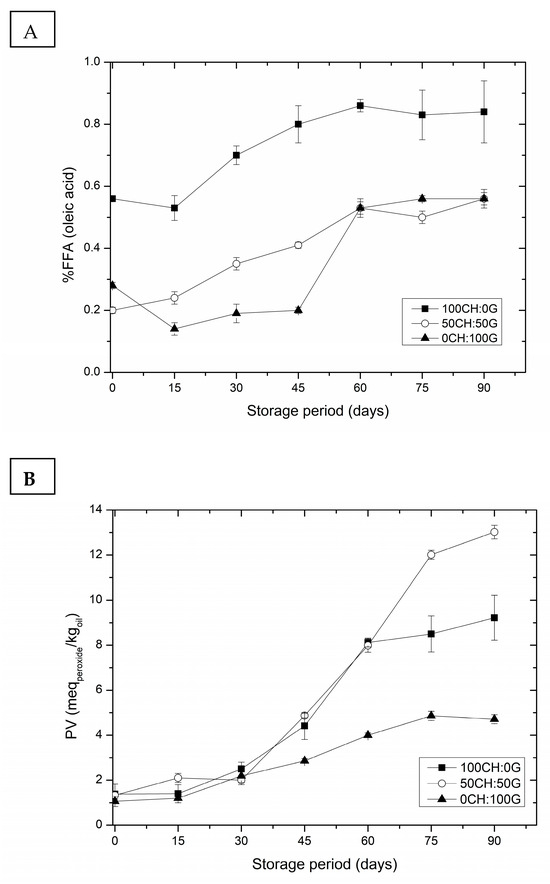
Figure 6.
(A) free fatty acid (%FFA) and (B) peroxide value (PV) of chitosan–gelatin–RBO nanoemulsions through 90 days. Samples were prepared with different mass ratios of chitosan to gelatin: 100CH:0G, 50CH:50G, and 0CH:100G.
As expected for lipid-based systems, both %FFA and PV increased throughout storage due to hydrolytic and oxidative reactions. However, the nanoemulsion with pure gelatin (0CH:100G) remained more stable during the storage period, exhibiting the lowest %FFA and PV at the end of 90 days, with 0.56 ± 0.2% oleic acid and 4.71 ± 0.2 mEq kg−1, respectively. The presence of gelatin (a non-ionic agent) acting as a cosurfactant in association with Tween 80 (a non-ionic agent) is capable of forming interfacial complexes on the surface of the dispersed globules. These may have contributed to greater emulsion stabilization compared to when only one emulsifying agent is used. The interfacial complex helped gelatin adhere to the lipid surfaces, forming an electrically charged film and providing a better barrier to oxidation [21]. In contrast, nanoemulsions containing chitosan (100CH:0G) exhibited higher %FFA and PV, likely due to the polymer sensitivity to pH, which can reduce droplet charge and weaken electrostatic repulsion. Moreover, the interfacial layer formed by chitosan was less dense and rigid compared to gelatin, providing a less effective barrier against oxidation and droplet coalescence [24]. Consequently, the 0CH:100G nanoemulsion demonstrated the best stability results after 90 days of storage, with values within the acceptable limits according to the CODEX Alimentarius Commission (PV ≤ 5 mEq kg−1 and %FFA ≤ 1).
These results have significant implications for the development of nanoemulsions to enhance food and beverages. With the additional biopolymer coating on the droplets, stable emulsions containing RBO rich in γ-oryzanol were successfully prepared. These edible coatings, based on biocomponents (gelatin and chitosan), have functional qualities and provide protection and stability for the emulsion.
4. Conclusions
This study demonstrated that US + SFE yielded PB oil with higher extraction efficiency (18.2 ± 0.4%) and better preservation of γ-oryzanol (1.53 ± 0.19%) compared to SFE alone (yield 13.5 ± 0.3%, γ-oryzanol 1.13 ± 0.08%). Oils extracted by US + SFE exhibited improved quality parameters, including lower acidity (0.27 ± 0.01% oleic acid) and PV (1.7 mEq kg−1), reflecting enhanced oxidative stability. Encapsulation of the oil in chitosan, gelatin, and their blends produced nanoemulsions with droplet sizes ranging from 50 to 400 nm. Over 90 days, gelatin-based nanoemulsions showed superior oxidative stability, effectively preserving γ-oryzanol and protecting the oil from degradation. These findings underscore the potential of US + SFE for producing high-quality RBO and demonstrate that biopolymeric nanoemulsions, particularly gelatin-based systems, are promising carriers for the stable delivery of bioactive compounds. This approach expands the applicability of γ-oryzanol-rich oil in nutraceutical, cosmetic, and functional food products while adding value to an underutilized agro-industrial byproduct.
Author Contributions
S.A.P.: Conceptualization, Methodology, Formal analysis, Resources, and Writing—Original Draft; M.L.M.: Methodology, Formal analysis, Writing—Original Draft, and Visualization; M.L.G.V.: Resources, Writing—Original Draft, and Visualization; A.C.R.: Methodology and Resources. D.P.J.: Methodology and Resources. T.R.S.C.J.: Resources, Writing—Original Draft, and Visualization; L.A.d.A.P.: Conceptualization, Resources, Writing—Review & Editing, and Supervision. All authors have read and agreed to the published version of the manuscript.
Funding
This research was funded by Coordenação de Aperfeiçoamento de Pessoal de Nível Superior (CAPES)/Brazil, Conselho Nacional de Desenvolvimento Científico e Tecnológico (CNPq)/Brazil, Fundação de Amparo à Pesquisa do Estado do RS (FAPERGS)/Brazil, and Secretaria de Desenvolvimento, Ciência e Tecnologia/RS/Brazil (projects DCIT 70/2015 and DCIT 77/2016).
Data Availability Statement
The raw data supporting the results of this article will be made available by the authors on request.
Acknowledgments
The authors would like to thank Coordenação de Aperfeiçoamento de Pessoal de Nível Superior (CAPES)/Brazil, Conselho Nacional de Desenvolvimento Científico e Tecnológico (CNPq)/Brazil, Fundação de Amparo à Pesquisa do Estado do RS (FAPERGS)/Brazil, and Secretaria de Desenvolvimento, Ciência e Tecnologia/RS/Brazil (projects DCIT 70/2015 and DCIT 77/2016) for the financial support; and Nanosul/FURG of the Associate Laboratory of the National System of Laboratories in Nanotechnology (SisNANO)/Brazil and Integrated Analysis Center of the Federal University of Rio Grande (CIA)/FURG/Brazil for research support.
Conflicts of Interest
The authors declare no conflicts of interest.
References
- United States Department of Agriculture (USDA) World Agricultural Production. 2025. Available online: https://apps.fas.usda.gov/PSDOnline/app/index.html#/app/downloads (accessed on 9 August 2025).
- dos Santos Bilhalva, N.; de Moraes, R.S.; Leal, M.M.; Biduski, B.; Coradi, P.C. Evaluation Method of the Physical and Physicochemical Quality of White and Parboiled Rice Processing in the Industry Using NIR and Multivariate Analysis. J. Cereal Sci. 2025, 124, 104230. [Google Scholar] [CrossRef]
- Kayathi, A.; Chakrabarti, P.P.; Bonfim-Rocha, L.; Cardozo-Filho, L.; Bollampalli, A.; Jegatheesan, V. Extraction of γ-Oryzanol from Defatted Rice Bran Using Supercritical Carbon Dioxide (SC-CO2): Process Optimisation of Extract Yield, Scale-up and Economic Analysis. Process. Saf. Environ. Prot. 2021, 148, 179–188. [Google Scholar] [CrossRef]
- Sapwarobol, S.; Saphyakhajorn, W.; Astina, J. Biological Functions and Activities of Rice Bran as a Functional Ingredient: A Review. Nutr. Metab. Insights 2021, 14, 11786388211058559. [Google Scholar] [CrossRef] [PubMed]
- Aluthge, D.S.U.; Ranaweera, K.K.D.S.; Gunathilake, I.A.D.S.R. The Effect of Stabilization Heat Treatment on Rice Bran Quality Parameters, Including Total Phenolic Content, Gamma Oryzanol Content, Antioxidant Potential, Oxidative Stability and Extraction Yield during Storage. Food Chem. Adv. 2023, 3, 100531. [Google Scholar] [CrossRef]
- Yang, W.; Ma, H.; Lan, H.; Liao, W.; Lin, X.; Li, C. Application of Cold Plasma for Rice Bran Preservation: Effects on Stability and Quality. Innov. Food Sci. Emerg. Technol. 2025, 102, 104025. [Google Scholar] [CrossRef]
- Bollinedi, H.; Singh, A.K.; Singh, N.; Gopala, K.S.; Bhowmick, P.K.; Vinod, K.K.; Nagarajan, M.; Ellur, R.K. Genetic and Genomic Approaches to Address Rapid Rancidity of Rice Bran. Crit. Rev. Food Sci. Nutr. 2021, 61, 75–84. [Google Scholar] [CrossRef]
- Kamchonemenukool, S.; Wongwaiwech, D.; Thongsook, T.; Weerawatanakorn, M. Subcritical Liquified Dimethyl Ether and Supercritical Fluid Carbon Dioxide Extraction of Gamma Oryzanol from Rice Bran Acid Oil. J. Agric. Food Res. 2023, 14, 100672. [Google Scholar] [CrossRef]
- Das, P.; Nayak, P.K.; Kesavan, R. krishnan Ultrasound Assisted Extraction of Food Colorants: Principle, Mechanism, Extraction Technique and Applications: A Review on Recent Progress. Food Chem. Adv. 2022, 1, 100144. [Google Scholar] [CrossRef]
- Jaeschke, D.P.; Merlo, E.A.; Mercali, G.D.; Rech, R.; Marczak, L.D.F. The Effect of Temperature and Moderate Electric Field Pre-Treatment on Carotenoid Extraction from Heterochlorella Luteoviridis. Int. J. Food Sci. Technol. 2019, 54, 396–402. [Google Scholar] [CrossRef]
- Gasparetto, H.; de Castilhos, F.; Paula Gonçalves Salau, N. Recent Advances in Green Soybean Oil Extraction: A Review. J. Mol. Liq. 2022, 361, 119684. [Google Scholar] [CrossRef]
- Linares, G.; Rojas, M.L. Ultrasound-Assisted Extraction of Natural Pigments from Food Processing By-Products: A Review. Front. Nutr. 2022, 9, 891462. [Google Scholar] [CrossRef]
- Teixeira, I.R.; Marczak, L.D.F.; Mercali, G.D.; Jaeschke, D.P. Saline Extraction Assisted by Ultrasound: A Method to Obtain Purified Phycocyanin. J. Biotechnol. 2024, 384, 38–44. [Google Scholar] [CrossRef] [PubMed]
- Thomas, A.; Vithu, P.; Pulissery, S.K.; Sreeja, R.; Rajesh, G.K. Ultrasound Pretreatment for Supercritical Fluid Extraction of β-Carotene from Gac Fruit: Process Optimization and Characterization of Gac Oil and Residual Powder. Chem. Eng. Process.-Process. Intensif. 2025, 217, 110534. [Google Scholar] [CrossRef]
- López-Hortas, L.; Rodríguez, P.; Díaz-Reinoso, B.; Gaspar, M.C.; de Sousa, H.C.; Braga, M.E.M.; Domínguez, H. Supercritical Fluid Extraction as a Suitable Technology to Recover Bioactive Compounds from Flowers. J. Supercrit. Fluids 2022, 188, 105652. [Google Scholar] [CrossRef]
- Ahangari, H.; King, J.W.; Ehsani, A.; Yousefi, M. Supercritical Fluid Extraction of Seed Oils—A Short Review of Current Trends. Trends Food Sci. Technol. 2021, 111, 249–260. [Google Scholar] [CrossRef]
- Banafi, A.; Wee, S.K.; Tiong, A.N.T.; Kong, Z.Y.; Saptoro, A.; Sunarso, J. Modeling of Supercritical Fluid Extraction Bed: A Critical Review. Chem. Eng. Res. Des. 2023, 193, 685–712. [Google Scholar] [CrossRef]
- Luo, M.; Zhang, X.; Wu, J.; Zhao, J. Modifications of Polysaccharide-Based Biomaterials under Structure-Property Relationship for Biomedical Applications. Carbohydr. Polym. 2021, 266, 118097. [Google Scholar] [CrossRef]
- Gerhardt, R.; Farias, B.S.; Moura, J.M.; de Almeida, L.S.; da Silva, A.R.; Dias, D.; Cadaval, T.R.S.; Pinto, L.A.A. Development of Chitosan/Spirulina Sp. Blend Films as Biosorbents for Cr6+ and Pb2+ Removal. Int. J. Biol. Macromol. 2020, 155, 142–152. [Google Scholar] [CrossRef]
- Vieira, M.L.G.; Pinheiro, C.P.; Silva, K.A.; Lutke, S.F.; Cadaval, T.R.S.A.; Dotto, G.; Pinto, L.A. de A. Chitosan and Cyanoguanidine-Crosslinked Chitosan Coated Glass Beads and Its Application in Fixed Bed Adsorption. Chem. Eng. Commun. 2019, 206, 1485–1497. [Google Scholar] [CrossRef]
- Sanprasert, S.; Kumnerdsiri, P.; Seubsai, A.; Lueangjaroenkit, P.; Pongsetkul, J.; Petcharat, T.; Kaewprachu, P.; Sai-ut, S.; Rawdkuen, S.; Teerapattarakan, N.; et al. Techno-Functional Gelling Mechanism and Rheological Properties of Gelatin Capsule-Waste Gel Modified with Kappa-Carrageenan for Future Functional Food Applications. Future Foods 2025, 12, 100723. [Google Scholar] [CrossRef]
- Pérez-Pacheco, Y.; Tylkowski, B.; García-Valls, R. Chitosan Micro/Nanocapsules in Action: Linking Design, Production, and Therapeutic Application. Molecules 2025, 30, 252. [Google Scholar] [CrossRef]
- Milano, F.; Masi, A.; Madaghiele, M.; Sannino, A.; Salvatore, L.; Gallo, N. Current Trends in Gelatin-Based Drug Delivery Systems. Pharmaceutics 2023, 15, 1499. [Google Scholar] [CrossRef]
- Lu, J.; Yin, X.; Wu, Q.; Wang, M.; Han, L.; Su, S. Fabrication and Stability of Pickering Nanoemulsion Stabilized by Self-Aggregated Chitosan Nanoparticles. Food Chem. 2025, 484, 144445. [Google Scholar] [CrossRef]
- Roda Zitha Vilanculos, J.; Silva de Farias, B.; Inês Engelmann, J.; Silveira Ribeiro, E.; Diaz de Oliveira, P.; Roberto Sant’Anna Cadaval, T.; Antonio de Almeida Pinto, L. Physicochemical Evaluation of Chitosan–Xanthan Gum Nanoemulsions as Polyunsaturated Enriched Lipid–Carrier. J. Mol. Liq. 2023, 386, 122533. [Google Scholar] [CrossRef]
- Naewkanya, P.; Daothaisong, P.; Sowasod, N.; Loruthai, O.; Bunwatcharaphansakun, P.; Tanthapanichakoon, W. Development of Nanoemulsions Containing Essential Oils for Gel Formulations. Appl. Sci. Eng. Prog. 2025. [Google Scholar] [CrossRef]
- AOAC International Official Methods of Analysis of AOAC International; Latimer, G.W., Jr., Ed.; Oxford University Press: Oxford, UK, 2023. [Google Scholar]
- Bligh, E.G.; Dyer, W.J. A Rapid Method of Total Lipid Extraction and Purification. Can. J. Biochem. Physiol. 1959, 37, 911–917. [Google Scholar] [CrossRef] [PubMed]
- Trevisani Juchen, P.; Nolasco Araujo, M.; Hamerski, F.; Corazza, M.L.; Pedersen Voll, F.A. Extraction of Parboiled Rice Bran Oil with Supercritical CO2 and Ethanol as Co-Solvent: Kinetics and Characterization. Ind. Crops Prod. 2019, 139, 111506. [Google Scholar] [CrossRef]
- Punia, S.; Kumar, M.; Siroha, A.K.; Purewal, S.S. Rice Bran Oil: Emerging Trends in Extraction, Health Benefit, and Its Industrial Application. Rice Sci. 2021, 28, 217–232. [Google Scholar] [CrossRef]
- Codex Standards for Fats and Oils from Vegetable Sources. 2001. Available online: https://www.fao.org/4/y2774e/y2774e04.htm (accessed on 10 August 2025).
- Bucci, R.; Magrì, A.D.; Magrì, A.L.; Marini, F. Comparison of Three Spectrophotometric Methods for the Determination of γ-Oryzanol in Rice Bran Oil. Anal. Bioanal. Chem. 2003, 375, 1254–1259. [Google Scholar] [CrossRef]
- AOAC International AOCS—Official Methods and Recommended Practices of the American Oil Chemists Society. Available online: https://www.scirp.org/reference/referencespapers?referenceid=3019699 (accessed on 8 September 2025).
- Metcalfe, L.D.; Schmitz, A.A.; Pelka, J.R. Rapid Preparation of Fatty Acid Esters from Lipids for Gas Chromatographic Analysis. Anal. Chem. 1966, 38, 514–515. [Google Scholar] [CrossRef]
- Hartman, L.; Lago, R.C. Rapid Preparation of Fatty Acid Methyl Esters from Lipids. Lab. Pract. 1973, 22, 475–476 passim. [Google Scholar]
- Mahdi, E.S.; Sattar, M.; Sakeena, M.H.F.; Abdulkarim, M.; Noor, A.M.; Abdullah, G. Effect of Surfactant and Surfactant Blends on Pseudoternary Phase Diagram Behavior of Newly Synthesized Palm Kernel Oil Esters. Drug. Des. Devel. Ther. 2011, 5, 311. [Google Scholar] [CrossRef]
- Rojas, C.E.B.; de Farias, B.S.; Bertolo, J.; Ribeiro, E.S.; Diaz, P.S.; Cadaval Junior, T.R.S.; Pinto, L.A.d.A. Effect of Chitosan Molecular Weight on the Stability and Bioaccessibility of Nanoemulsions for Lycopene Preservation. Int. J. Biol. Macromol. 2025, 331, 148299. [Google Scholar] [CrossRef]
- Danielski, L.; Zetzl, C.; Hense, H.; Brunner, G. A Process Line for the Production of Raffinated Rice Oil from Rice Bran. J. Supercrit. Fluids 2005, 34, 133–141. [Google Scholar] [CrossRef]
- Cameu, G.M.; Almeida, L.; Oliveira, A.P.; Igansi, A.; Jaeschke, D.P.; Silveira, N.; Paes, R.; Dias, D.; Pinto, L.A.d.A.; Cadaval, T.R.S. Enhanced Adsorption of Pb(II) and Cd(II) by Activated Carbon Derived from Peach Stones for Efficient Water Decontamination. Processes 2025, 13, 3064. [Google Scholar] [CrossRef]
- Wang, Y. Applications of Rice Bran Oil. In Rice Bran and Rice Bran Oil; Elsevier: Amsterdam, The Netherlands, 2019; pp. 159–168. [Google Scholar]
- Rathnakumar, K.; Kalaivendan, R.G.T.; Eazhumalai, G.; Raja Charles, A.P.; Verma, P.; Rustagi, S.; Bharti, S.; Kothakota, A.; Siddiqui, S.A.; Manuel Lorenzo, J.; et al. Applications of Ultrasonication on Food Enzyme Inactivation- Recent Review Report (2017–2022). Ultrason. Sonochem. 2023, 96, 106407. [Google Scholar] [CrossRef]
- Lv, Y.; Ye, Z.; Luo, S.; Xiong, Y.; Liu, Y.; Zhang, Z. Removal Strategies for the Undesirable Components from the Crude Vegetable Oils: A Review. J. Clean Prod. 2024, 478, 143983. [Google Scholar] [CrossRef]
- Strieder, M.M.; Pinheiro, C.P.; Borba, V.S.; Pohndorf, R.S.; Cadaval, T.R.S.; Pinto, L.A.A. Bleaching Optimization and Winterization Step Evaluation in the Refinement of Rice Bran Oil. Sep. Purif. Technol. 2017, 175, 72–78. [Google Scholar] [CrossRef]
- Martínez-Padilla, L.P.; Franke, L.; Xu, X.-Q.; Juliano, P. Improved Extraction of Avocado Oil by Application of Sono-Physical Processes. Ultrason. Sonochem. 2018, 40, 720–726. [Google Scholar] [CrossRef]
- Chen, Q.; Dong, W.; Wei, C.; Hu, R.; Long, Y. Combining Integrated Ultrasonic-Microwave Technique with Ethanol to Maximise Extraction of Green Coffee Oil from Arabica Coffee Beans. Ind. Crops Prod. 2020, 151, 112405. [Google Scholar] [CrossRef]
- Ruttarattanamongkol, K.; Chittrakorn, S.; Tochampa, W. Rice Bran Valorization: Oil Extraction via Extrusion-SC CO2 Processing and Development of Protein Hydrolysates from Its Residue. Appl. Food Res. 2024, 4, 100605. [Google Scholar] [CrossRef]
- Khan, S.A.; de Carvalho Arabidian, V.; da Silveira Junior, N.; de Farias, B.S.; Kessler, F.; Paes, R.L.; Pinto, L.A.d.A.; Cadaval Junior, T.R.S. Valorization Glycerol Produced as a By-Product in the Biodiesel Industry: An Insight into Technical and Economic Studies. Biorefinery Ind. Effl. A Sustain. Circ. Econ. 2025, 307–316. [Google Scholar] [CrossRef]
- Phan, V.M.; Junyusen, T.; Liplap, P.; Junyusen, P. Effects of Ultrasonication and Thermal Cooking Pretreatments on the Extractability and Quality of Cold Press Extracted Rice Bran Oil. J. Food Process. Eng. 2019, 42, e12975. [Google Scholar] [CrossRef]
- Sharkawy, A.; Barreiro, F.; Rodrigues, A. Pickering Emulsions Stabilized with Chitosan/Gum Arabic Particles: Effect of Chitosan Degree of Deacetylation on the Physicochemical Properties and Cannabidiol (CBD) Topical Delivery. J. Mol. Liq. 2022, 355, 118993. [Google Scholar] [CrossRef]
- Khramtsov, P.; Burdina, O.; Lazarev, S.; Novokshonova, A.; Bochkova, M.; Timganova, V.; Kiselkov, D.; Minin, A.; Zamorina, S.; Rayev, M. Modified Desolvation Method Enables Simple One-Step Synthesis of Gelatin Nanoparticles from Different Gelatin Types with Any Bloom Values. Pharmaceutics 2021, 13, 1537. [Google Scholar] [CrossRef]
- Uskoković, V. Revisiting the Fundamentals in the Design and Control of Nanoparticulate Colloids in the Frame of Soft Chemistry. Rev. J. Chem. 2013, 3, 271–303. [Google Scholar] [CrossRef][Green Version]
Disclaimer/Publisher’s Note: The statements, opinions and data contained in all publications are solely those of the individual author(s) and contributor(s) and not of MDPI and/or the editor(s). MDPI and/or the editor(s) disclaim responsibility for any injury to people or property resulting from any ideas, methods, instructions or products referred to in the content. |
© 2025 by the authors. Licensee MDPI, Basel, Switzerland. This article is an open access article distributed under the terms and conditions of the Creative Commons Attribution (CC BY) license (https://creativecommons.org/licenses/by/4.0/).