Abstract
The hydrocarbon accumulation process in the Dongying Formation (a key Cenozoic reservoir in the western Bohai Bay Basin) is complex due to superimposed tectonic activities. To reconstruct its evolution, we integrated fluid inclusion analysis, burial–thermal history reconstruction, and fault–cap rock sealing evaluation. Results reveal that the Baoding Sag experienced at least two major hydrocarbon charging stages, further subdivided into four sub-periods (I–IV) based on the microthermometry and fluorescence characteristics (ranging from yellow, indicating marginal maturity, to blue, indicating maturity). The hydrocarbons exhibit a mixed composition, as reflected in the fluid inclusions and Ro evolution, indicating a complex charging history derived from two source rocks (Es1 and Es3). However, two key tectonic activities that significantly influenced the hydrocarbon accumulation process can still be distinguished: uplift erosion at 22.3 Ma and strike-slip faulting at 11.8 Ma. Specifically, the 11.8 Ma strike-slip faulting caused the leakage of early hydrocarbons (Periods I–II) from the Dongying Formation into the Guantao Formation, with a critical fault juxtaposition threshold of ~86 m. This fault activity also introduced water washing of the hydrocarbon reservoir. Later, around 0.36 Ma, gas washing occurred as the source rocks matured, further complicating the calculation of the mixing ratio between the two source rock contributions.
1. Introduction
The accumulation characteristics of hydrocarbons play a vital role during the exploration phase, especially when it comes to the detailed characterization of hydrocarbon reservoirs in the later stages of oilfield development [1,2]. However, these characteristics can vary significantly across different basins due to their unique geological evolution processes [3,4]. Notably, late-stage tectonic activity often reshapes pre-existing hydrocarbon reservoirs [5,6]. Thus, analyzing the interplay between hydrocarbon accumulation and tectonic evolution remains crucial for petroleum exploration [7,8].
Fluid inclusions serve as a reliable tool for dating hydrocarbon accumulation and adjustment by preserving records of paleo-pressure, paleo-temperature, and fluid composition—key indicators of ancient reservoir conditions [3,9]. These inclusions are typically captured along with the formation of diagenetic minerals (primary fluid inclusions) or fractures (secondary inclusions) during the periods of hydrocarbon generation and migration [3,5]. As such, they can be identified through petrographic analysis (size, shape, distribution, and assemblages) [5]. Currently, a variety of testing techniques are employed in fluid inclusion analysis, including Linkam heating–freezing stages, UV fluorescence, fluorescence spectroscopy, micro-laser Raman spectroscopy, gas chromatography–mass spectrometry, and carbon isotope mass spectrometry [3]. Advances in detection technology have increasingly refined the application of fluid inclusions in studying the hydrocarbon accumulation process [10]. For instance, the microthermometric data obtained from Linkam heating–freezing stages, specifically the homogenization temperature (Thom) of brine inclusions associated with hydrocarbon inclusions, can indicate the minimum hydrocarbon expulsion temperature [11]. When combined with the regional burial–thermal history derived from basin modeling, this data can be used to date hydrocarbon charging events and illustrate their relation to tectonic activity [12]. Additionally, the final ice melting temperature (Tm) is related to salinity and can be used to calculate the wt% of NaCl using empirical equations [13]. This parameter also allows for the assessment of how later tectonic activity has altered hydrocarbon reservoirs [5,14]. Moreover, the fluorescence color and spectral signatures of hydrocarbon inclusions, obtained through UV (Ultraviolet) fluorescence and fluorescence spectroscopy, respectively, can provide insights into changes in hydrocarbon maturity, charging cycles, and migration pathways [15]. Therefore, studying the characteristics of fluid inclusions in hydrocarbon reservoirs, through detailed petrographic analysis and advanced detection techniques, is instrumental in understanding the hydrocarbon accumulation and alteration processes.
The Bohai Bay Basin, a Cenozoic faulted basin, accounts for more than 30% of China’s total oil reserves [16]. After four decades of exploration and development, the Mesoproterozoic and Neoproterozoic hydrocarbon reservoirs in the deep part of the basin have been extensively explored more than the Cenozoic reservoirs, particularly in the western part of the basin, such as the Baoding Sag, which is also rich in hydrocarbon resources, according to previous studies [17]. The Dongying Formation is the main Cenozoic reservoir in the Baoding Sag, and significant discoveries have been made in the drilling of the BQ1X well, with a high-yield, early-low maturing oil flow of 100 cubic meters per day obtained from depths ranging from 1770.0 to 1795.8 m, confirming a scale benefit reserve of hundreds of millions of tons by China National Petroleum Corporation Huabei Oilfield Company [1]. Extensive research has been conducted on the petroleum accumulation process, and a formation model of deep source supply-deep fault conduction-fault ridge convergence-orderly accumulation has been established [17]. However, in recent years, there have still been multiple cases of dry wells in drilling, despite the fact that the well locations are on favorable hydrocarbon migration channels, with well-developed reservoirs and favorable structural parts [18]. The considerable bitumen found in dry wells in the Dongying Formation, primarily derived from the Shahejie Formation below, confirms the occurrence of hydrocarbon migration and/or accumulation in the past [19]. While the impact of late tectonic activities on hydrocarbon reservoirs has been acknowledged by some researchers, there remains a significant gap in understanding how these activities influence hydrocarbon accumulation and are, in turn, shaped by tectonic evolution.
Macroscopically, the damage inflicted by tectonic movements on hydrocarbon reservoirs is primarily manifested in three aspects: (1) Stratum uplift and erosion, which not only compromise the preservation conditions of hydrocarbon reservoirs but also alter trap characteristics. Additionally, this process can influence the infiltration of surface water, thereby inflicting further damage on hydrocarbon reservoirs [5]. (2) Fracture cutting, which disrupts the equilibrium of the pressure system and diminishes the sealing properties of caprocks. Concurrently, this process may also facilitate the infiltration of surface water [20]. (3) The combined effects of multiple tectonic movements [21]. Tectonic-driven alterations in hydrocarbon reservoirs are recorded by inclusion records. For instance, uplift-related erosion may induce hydrocarbon phase separation within inclusions, resulting in the formation of asphaltene-rich microveins (commonly observed as brown oil streaks) [5,11]. Concurrently, meteoric water infiltration along fault conduits can modify the ionic composition of inclusion fluids, manifesting as salinity variations [5,6]. Extensive fluid-inclusion work in the area has revealed a clear bimodal distribution of homogenization temperatures; when calibrated against burial–thermal modeling, this indicated two hydrocarbon-charging events in the Dongying Formation: a Miocene–Pliocene charging at 7.5–5.5 Ma and a later Pliocene–Pleistocene charging at ~2 Ma [19]. During the Neogene, the northwestern Bohai Bay Basin was predominantly in a stable subsidence phase, with no intense tectonic activities [22]. In this period, only the strike-slip movement of the Tan-Lu fault led to the initial existing faults’ reactivation in the study area, and was also accompanied by the formation of some new faults [23,24]. Therefore, fracture cutting is likely the primary factor that has altered the hydrocarbon reservoirs in the Dongying Formation. Specifically, hydrocarbons in the Dongying Formation are confined to fault-bound traps whose development is intimately linked to fault activity [17,18]. Owing to the pronounced heterogeneity along fault planes, some segments serve as conduits for hydrocarbon migration, whereas others act as effective seals [21,25]. The vertical sealing property of faults is particularly crucial for the formation of hydrocarbon reservoirs. The most widely used quantitative method to determine fault vertical sealing in the upper caprock is to calculate the displacement pressure [26,27] and statistics on the relationship between fault juxtaposition thickness and the longitudinal distribution of petroleum [28]. The former method needs numerous experimental testing data and is suitable for areas with a relatively high degree of development, while the latter is simple and easy to implement for oil fields with a low degree of exploration and development [27]. However, despite the critical role of tectonic movement in hydrocarbon accumulation and adjustment, particularly regarding fault vertical sealing characteristics, their specific relationship in the Bohai Bay Basin remains significantly understudied.
To address the research gap in understanding how tectonic movements influence hydrocarbon accumulation and adjustment in the Dongying Formation of the Bohai Bay Basin, we integrated fluid inclusion analysis, seismic interpretation, and oil testing data. This multidisciplinary approach aimed to: (1) reconstruct the hydrocarbon charge process, (2) characterize the tectonic-driven adjustment and alteration of hydrocarbon accumulation, and (3) elucidate the coupling mechanisms between these processes in the western Bohai Bay Basin.
2. Geological Setting
The Bohai Bay Basin is a prolific oil basin in eastern China, containing the Baoding Sag in the west that covers ~4000 km2 between the Taihang Mountain and Gaoyang uplifts, and trending NE (Figure 1). It can be divided into three sets of vertical structural layers (Figure 1) [21]: (1) the lower structural layers composed of the Paleogene Kongdian Formation (Ek) to Section 2 of the Shahejie Formation (Es2), which formed in the rifting episode of the basin; (2) the middle structural layers composed of Paleogene Section 1 of the Shahejie Formation (Es1) to Dongying Formation (Ed), which formed in the tectonic transition episode between the rifting and post-rifting episode of the basin; and (3) the upper structural layers composed of Neogene Guantao Formation (Ng) to Minghuazhen Formation (Nm), which formed in the post-rifting episode. Specifically, the passage from the tectonic transition episode to the post-rifting episode was marked by positive inversion, during which extensive uplift eroded the Dongying Formation and produced a major regional unconformity (T2) [17,18]. Notably, around 12 Ma, a distinct left-rotating strike-slip movement was observed, which was a consequence of the Tan-Lu fault movement [23,24].
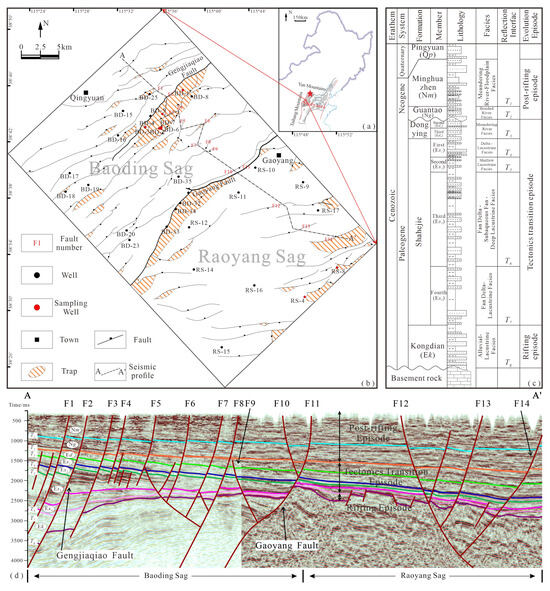
Figure 1.
The location of study area (a); the faults and sample wells distribution characteristics in the Baoding–Raoyang Sag (b); a general lithologic column in Baoding Sag (c); and the N-W seismic cross-section with the faulting and stratigraphic layering characteristics (d), the section position is shown in (a).
The Es formation is primarily composed of delta-lake sedimentary rocks, forming two major lacustrine intervals (Es3 and Es1), which constitute the main source rocks in the Baoding Sag [17,29]. However, their TOC content is mostly below 0.5%, and their hydrocarbon generation potential (S1 + S2) is 0.1–1.0 mg/g, with reservoir temperatures below 100 °C, indicating poor hydrocarbon source rock characteristics [17,30]. Despite these unfavorable source rock qualities, ongoing exploration activities in the Baoding Sag have uncovered that the hydrocarbon within the Dongying and Guantao Formations primarily originates from the adjacent Raoyang Sag (Es3 and Es1), where the average TOC is 1.74% and the Ro is mainly above 0.5% [17,31]. The Ed formation is characterized by meandering river sedimentary facies, which transition upwards into braided river sedimentary facies of the Ng formation [17]. Specifically, these two formations serve as the primary petroleum reservoirs in the study area, with porosities ranging from 13.0% to 35.4% and permeabilities typically between 20 and 100 mD, and the Ng formation exhibits significantly superior petrophysical properties compared to the Ed formation [1,17]. From 2022 to 2023, the region has consistently added reserves on a scale exceeding 100 million tons [1]. Specifically, the Dongying Formation is predominantly associated with fault-bound traps, which are evident both on the pane view and cross-sections (Figure 1). Hydrocarbon, migrating from Es3 and Es1 formation through faults, typically accumulates at structural highs near faults, laterally enclosed by faults and capped by a mudstone cover layer [1,32]. Therefore, the vertical sealing of the fault–cap is particularly crucial for hydrocarbon accumulation in the Dongying Formation.
3. Materials and Methods
3.1. Fluid Inclusion Testing
Nineteen samples, comprising six from the Shahejie Formation, eight from the Dongying Formation, and five from the Guantao Formation (Table 1), were collected from the cores of fourteen wells (Figure 1) in the Western Bohai Bay Basin. These samples were doubly polished to obtain UV fluorescence and fluorescence spectroscopy data, as well as to determine microthermometric data (Thom and Tm). The homogenization temperature of oil inclusions is typically several tens of degrees Celsius lower than the trapping temperature, whereas the homogenization temperature of saline fluid inclusions (especially those coexisting with hydrocarbon inclusions in a single entrapment) is much closer to the trapping temperature. Therefore, the term “Thom” mentioned here specifically refers to saline fluid inclusions. The UV fluorescence and fluorescence data were acquired using a LEICA SP8 Microscopic confocal instrument (Leica Microsystems GmbH, Wetzlar, Germany), with an excitation wavelength of 365 nm from UV405 ultraviolet light. The microthermometric characteristics were measured using a Linkam THMS 600G hot and cold stage (Linkam, England), with a testing temperature range of −180 to 500 °C and an accuracy of ±0.1 °C. Salinity data were primarily derived from freezing point temperature measurements in conjunction with empirical formulas (W = 0.008 + 1.78|Tm| − 0.0442|Tm|2 + 0.000557|Tm|3) [13]. All experiments were conducted in the laboratory at China University of Petroleum (Beijing). Additionally, the burial–thermal history recovery of individual wells was simulated using Petromod software (v2016.2) [33], with key internal parameters (such as organic matter maturity (Ro), formation boundaries, lithology, thermal conductivity, etc.) primarily sourced from the Exploration Research Institute of Huabei Oilfield.

Table 1.
The microthermometric of inclusions in the western Bohai Bay Basin.
3.2. Fault–Cap Sealing Properties Estimation
In the Dongying Sag, both the reservoir and cap rocks are primarily composed of clastic materials [17]. Given this composition, the damage caused by faults to the strata is predominantly characterized by brittle failure, and the cap sealing performance deteriorates as the fault juxtaposition thickness decreases, thereby increasing the likelihood of petroleum escaping to the upper reservoir [28]. The fault juxtaposition thickness, denoted as Hfjt, can be calculated using the following formula:
where Hg represents the cap rock thickness and Hd is the fault throw, and here two typical calculation models for fault juxtaposition thickness are presented in Figure 2. By integrating the vertical oil–water distribution characteristics (it can be obtained from the oil test data on the oil field) observed in multiple wells, the thickness threshold for the vertical sealing property of the fault juxtaposition can be determined [28,34].
Hfjt = Hg − Hd
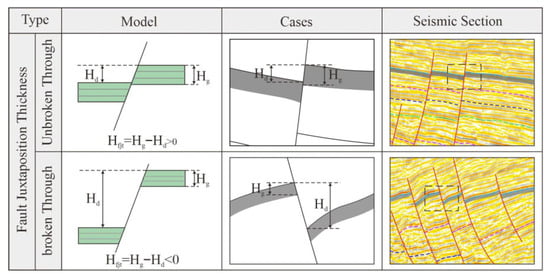
Figure 2.
Schematic diagrams illustrating cap-rock thickness and fault-throw characteristics used to calculate fault-juxtaposition thickness for both fault unbroken through and broken through the cap rock scenarios.
4. Results
4.1. Fluid Inclusion Character
4.1.1. Fluid Inclusion Petrography
The petrography of fluid inclusions includes both microscopic observation and microscope observation [5]. Microscopic observation is primarily aimed at the external environment of the inclusions: identifying the minerals in which inclusions are captured, their assemblages, and the diagenetic sequence [35]. Microscope observation is mainly focused on the inclusions themselves, such as the inclusions’ shape, size, color, abundance, distribution, gas–liquid ratio [36].
Microscopic observation revealed that fluid inclusions in the reservoirs of the Dongying Sag predominantly occur in enlarged quartz edges, fractures through quartz, and the surface of quartz particles (Figure 3). These inclusions include both liquid and gas–liquid two-phase inclusions (Figure 3). And the inclusions are primarily round to irregular oval in shape, with sizes ranging from approximately 3 μm to 10 μm (Figure 3). They are mainly distributed in cluster-like and string-of-beads-like patterns, with some occurring randomly as single points (Figure 3). Under fluorescence illumination, the inclusions display four distinct fluorescence colors: yellow, yellow-green (with a low gas–liquid ratio of approximately 6–12%, average 7.2%), blue-green (with a low gas–liquid ratio of approximately 7–14%, average 8.1%), and blue (with a high gas–liquid ratio of approximately 8–65%, average 16.3%). However, inclusions from the Guantao Formation exhibit only two fluorescence colors: yellow-green and blue-green (Table 1 and Figure 3).
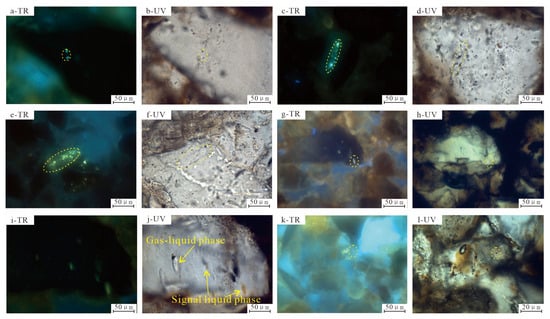
Figure 3.
Petrographic characteristics of fluid inclusions in Cenozoic clastic reservoirs of the Baoding Sag. (a,b): Dispersed blue hydrocarbon inclusions, Well BD-6, 1905.34 m; (c,d): beads-like yellow-green hydrocarbon inclusions, BD-6, 1907.23 m; (e,f): clustered-like yellow-green hydrocarbon inclusions, BD-6, 1906.56 m; (g,h): scattered yellow hydrocarbon inclusions, Well RS-5, 2976.72 m; (i,j): gas–liquid phase and signal phase hydrocarbon inclusion in crack, Well BD-4, 1987.65 m; (k,l): non-fluorescent hydrocarbon inclusions, it is brown under TR, Well BD-4, 1987.65 m. TR: Plane-polarized light, UV: Fluorescence photomicrograph.
4.1.2. Fluid Inclusion Fluorescence Spectral Character
The fluorescence spectral parameters of hydrocarbon inclusions serve as a valuable method for elucidating the hydrocarbon charging process. These parameters encompass the wavelength of the main peak of the spectrum (λmax), red-green entropy (Q), and Q535 (Q535 = SA/SB, where SA is the area enclosed by wavelengths 720 nm and 535 nm, and SB is the area enclosed by wavelengths 535 nm and 420 nm). Specifically, higher values of these three parameters indicate lower maturity of the crude oil within the inclusions, and vice versa [37,38].
There are four types of fluorescence spectral characteristics, with increasing maturity from Type I to Type IV (Table 2 and Figure 4): Type I: yellow fluorescence, with λmax ranging from 540.9 to 548.9 nm (average 544.2 nm), Q ranging from 0.596 to 0.783 (average 0.704), and QF535 ranging from 1.535 to 1.845 (average 1.701); Type II: yellow-green fluorescence, with λmax ranging from 518.2 to 534.1 nm (average 524.9 nm), Q ranging from 0.518 to 0.652 (average 0.580), and QF535 ranging from 1.256 to 1.667 (average 1.469); Type III: blue-green fluorescence, with λmax ranging from 500.9 to 510.4 nm (average 505.9 nm), Q ranging from 0.231 to 0.548 (average 0.418), and QF535 ranging from 0.780 to 1.463 (average 1.188); Type IV: blue fluorescence, with λmax ranging from 459.7 to 492.2 nm (average 474.3 nm), Q ranging from 0.067 to 0.452 (average 0.282), and QF535 ranging from 0.264 to 1.145 (average 0.763) (Table 2 and Figure 4a).

Table 2.
Fluorescence spectral parameters of hydrocarbon inclusion in Bohai Bay Basin.
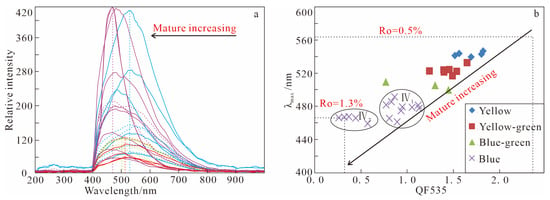
Figure 4.
The fluorescence spectral characteristics (a) and λmax vs. QF535 characteristics (b) of hydrocarbon inclusions in the study area. The solid line relates to the Baoding Sag samples, and dashed lines relate to the Raoyang Sag. The Ro value was determined based on the tested fluid inclusion samples.
Notably, Type IV can be distinctly divided into two subgroups based on λmax and QF535 characteristics: Type IV1 (λmax ranging from 462.0 to 492.2 nm, average 478.5 nm) and Type IV2 (λmax ranging from 459.7 to 468.4 nm, average 465.9 nm). The maturity of Type IV1 is significantly lower than that of Type IV2 (Figure 4b), suggesting potential mature evolution differences in the source rock composition [38]. Additionally, while the fluorescence spectral parameters of the Baoding and Raoyang Sags show similar wavelengths, they exhibit different relative intensities. This implies that although the source rocks are similar, they are at different stages of evolution and/or have experienced different secondary transformation processes [39].
4.1.3. Microthermometric
Thom and salinity of brine inclusions, which are associated with hydrocarbon inclusions but exhibit higher Thom values, can indicate the paleo-temperatures of the reservoir during hydrocarbon charging. These parameters can also be used in conjunction with the burial–thermal history recovery of wells to delineate distinct charging periods [40]. The Thom of coeval aqueous inclusions in the study area indicates two distinct stages of hydrocarbon injection, as evidenced by the shape of its column chart, which aligns with previous studies (Figure 5) [19]. However, based on fluorescence characteristics, the two hydrocarbon charging stages can be further divided into four sub-periods (I–IV). Additionally, the salinity values exhibit a broad range, spanning from 0.18% to 31.04% across all periods (Figure 5).

Figure 5.
Homogenization temperature characteristics of coeval aqueous inclusions (a) and their relationship with salinity (b).
Hydrocarbon inclusions with yellow fluorescence (period I), primarily found in enlarged quartz edges, with a Thom of 89.5 °C, indicating formation during the early diagenetic stage (Table 1). The salinity of coeval aqueous inclusions ranges from 2.9 to 20.3 wt%, with an average of 13.5 wt% (Table 1). Hydrocarbon inclusions with yellow-green fluorescence (period II), found in micro-cracks across quartz, has a Thom of coeval aqueous inclusions at 109.2 °C. These inclusions formed later than those in the enlarged quartz edges, and the salinity of coeval aqueous inclusions ranges from 0.2 to 31.0 wt%, with an average of 9.0 wt% (Table 1). Hydrocarbon inclusions with blue-green fluorescence (period III), also found in micro-cracks across quartz, has a Thom of coeval aqueous inclusions at 128.0 °C. The salinity of coeval aqueous inclusions ranges from 0.2 to 24.1 wt%, with an average of 9.2 wt% (Table 1). Hydrocarbon inclusions with blue fluorescence (period IV) have a Thom of coeval aqueous inclusions at 150.0 °C. The salinity of coeval aqueous inclusions ranges from 5.4 to 31.0 wt%, with an average of 15.9 wt% (Table 1).
Additionally, the division of Type IV1 and Type IV2, as indicated by fluorescence spectral characteristics, also shows differences in Thom, gas–liquid ratio, and salinity. Type IV1 has a Thom of coeval aqueous inclusions at 147.3 °C, with a gas–liquid ratio of approximately 8–13% (average 9.4%). The salinity of coeval aqueous inclusions ranges from 10.7 to 31.0 wt%, with an average of 21.25 wt% (Table 1). Type IV2 has a Thom of coeval aqueous inclusions at 153.7 °C, with a high gas–liquid ratio of approximately 12–65% (average 24.3%). The salinity of coeval aqueous inclusions ranges from 5.4 to 20.0 wt%, with an average of 9.9 wt% (Table 1).
4.2. Burial–Thermal History Recovery
Through the burial–thermal history recovery of wells, which tests inclusion characteristics, the effects of burial depth and individual differences can be mitigated, and the hydrocarbon generation conditions of source rocks can be ascertained [41]. The simulation results indicate that the sag has experienced multiple distinct uplift events (Figure 6a). Specifically, the Dongying Formation began to uplift and erode at 22.3 Ma, reached its peak at 16.9 Ma, and then rapidly deepened, entering a unified subsidence stage [23]. Additionally, a low-amplitude transient uplift effect occurred around 11.8–7.9 Ma, and it did not rise to the surface to undergo weathering and erosion (Figure 6a) [23,29].

Figure 6.
Simulation results of burial history for typical anomalous BD1 wells. The (a) is the simulation results of burial history, and (b) is the simulation results of Ro.
The source rocks of the Es3 formation in the Raoyang Sag have been mature since 28.2 Ma (0.5% < Ro), but due to low temperatures and subsequent uplift, they did not begin to expel a significant amount of hydrocarbons until 13.7 Ma (0.7% < Ro < 1.2%). Around 0.36 Ma, these source rocks entered the wet gas generation stage (1.2% < Ro; Figure 6b). In contrast, the source rocks of the Es1 formation show a much later maturation timeline, beginning at 11.6 Ma (0.5% < Ro). Similarly, due to low temperatures and later uplift, these rocks only started generating a large amount of hydrocarbons at 0.72 Ma (0.7% < Ro < 1.2%; Figure 6b). To date, the source rock has not entered the wet gas generation stage (Ro > 1.2%).
4.3. Fault–Cap Sealing Distribution Character
Through statistics, the fault juxtaposition thickness, combined with the distribution characteristics of oil and water, can qualitatively or semi-quantitatively forecast the leakage of the hydrocarbon in the reservoir [28]. In the Baoding Sag, most faults do not break through the caprock, with a fault juxtaposition thickness ranging from 0 to 241 m in the Dongying Formation, while the faults break through the caprock with a fault juxtaposition thickness ranging from −21 to 0 m. According to the distribution characteristics of oil and water in the fault-bound traps, the oil-water interface on the left was obviously higher than the right by around a fault juxtaposition thickness of 86 m (Figure 7a,b). Thus, we set 86 m as the threshold for hydrocarbon leakage in the Dongying Formation to the Guantao Formation; when the fault juxtaposition thicknesses fell below this value, the hydrocarbon would leak. Specifically, we also plotted the oil-gas wells of the Guantao Formation onto the fault–cap sealing distribution map and found that they were mainly distributed at structural high points around a fault juxtaposition thickness of less than 86 m (Figure 7c).
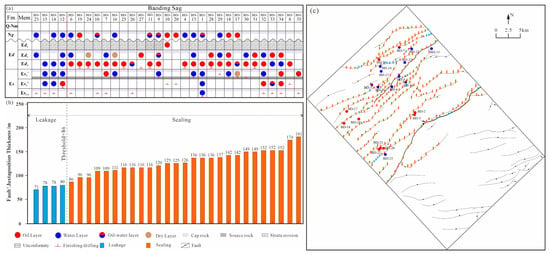
Figure 7.
The distribution characteristics of oil and water in different layers of wells within the fault-bound traps (a); (b) is the fault juxtaposition thickness of faults near the wells in (a); and (c) is the well and fault juxtaposition thickness distribution characteristics of the Guantao Formation in plane.
5. Discussion
5.1. Hydrocarbon Charging Process of Dongying Formation
The types, occurrences, fluorescence colors, Thom, salinities, and gas–liquid ratios of fluid inclusions serve as fundamental methods to distinguish and delineate hydrocarbon charging periods [5,26]. When combined with fluorescence spectral parameters, these methods can refine period division, allowing for a rough forecast of maturity characteristics, even among inclusions with identical fluorescence colors [19,37].
Figure 8 illustrates that the Dongying Formation underwent three successive hydrocarbon charging processes: (1) Marginal maturity stage (Period I). Hydrocarbon inclusions are yellow, occurring in the enlarged edges of quartz. The λmax, QF535, Thom, and salinity are 544.2 nm, 1.701, 89.5 °C, and 13.5 wt%, respectively (Figure 8a,b). Notably, solid asphalt was found around these yellow hydrocarbon inclusions, which appear non-fluorescent but brown under transmitted light (TR; Figure 3k,l), indicating alterations in the primary reservoirs [19]. (2) Early maturity stage (Period II). Hydrocarbon inclusions are yellow-green, occurring in internal cracks of quartz particles. The λmax, QF535, Thom, salinity, and gas–liquid ratio are 524.9 nm, 1.469, 109.2 °C, 9.0 wt%, and 7.2%, respectively (Figure 8c,d). (3) Early maturity stage (Period III). Hydrocarbon inclusions are blue-green. The λmax, QF535, Thom, and salinity are 505.9 nm, 1.188, 128.0 °C, and 9.2 wt%, respectively (Figure 8e,f). (4) Maturity stage (Period IV1). Hydrocarbon inclusions are blue, occurring in internal cracks of quartz particles (Figure 8g,h). The λmax, QF535, Thom, and salinity are 487.5 nm, 0.946, 147.3 °C, and 21.3 wt%, respectively. (5) Maturity stage (Period IV2): Hydrocarbon inclusions are blue, occurring on the surface of a quartz particle. The λmax, QF535, Thom, and salinity are 465.9 nm, 0.397, 153.7 °C, and 9.9 wt%, respectively (Figure 8i,j).
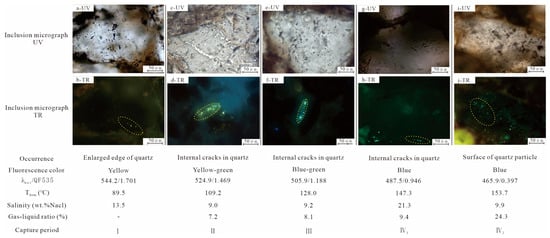
Figure 8.
Synthesis of capture periods based on fluid inclusion types, occurrence, fluorescence color, λmax, QF535, Thom, salinity, and gas–liquid ratio in Baoding Sag (a–j).
The Es1 and Es3 formations serve as the primary hydrocarbon sources for the Dongying Formation [17]. The Ro evolution indicates that both formations have reached the maturity stage, with Es3 achieving this much earlier (Figure 6). This suggests that both source rocks are capable of supplying mature oil to the Dongying Formation. Consequently, charging from the two source rocks imparted a mixed-source signature to the hydrocarbons within the Dongying Formation. The mixing process was most obvious in period IV, which can be further subdivided into IV1 and IV2 based on differences in λmax, QF535, Thom, and salinity. Additionally, the relative intensity of the wave decreases with migration [37,39]. The distribution of Es1 is closer to the Baoding Sag than Es3 in the Raoyang Sag [23]. Therefore, the higher relative intensity of period IV2 compared to period IV1 suggests that the hydrocarbons in period IV1 mainly originate from the highly mature Es3 source rock, while those in period IV2 are primarily related to the less mature Es1 source rock.
To further determine the hydrocarbon charging times, we reconstructed the burial–thermal history of the wells based on fluid inclusion characteristics, allowing us to approximate the charging ages [38]. Figure 9 illustrates that: period I primarily charged from 20.2 to 29.8 Ma (average 23.0 Ma); period II primarily charged from 11.7 to 20.1 Ma (average 15.9 Ma); period III primarily charged from 3.5 to 11.8 Ma (average 7.9 Ma); period IV primarily charged from 0.3 to 2.4 Ma (average 1.1 Ma). Notably, the charging times for IV1 (0.3–0.7 Ma) and IV2 (0.3–2.4 Ma) are quite similar, but IV1 shows much later; this result aligns with the tectonic and Ro evolution process. The relatively late and overlapping charging times suggest that faults provided communication pathways between the Shahejie source rock and the Dongying reservoir. These faults formed during the Neogene period and were associated with strike-slip movements [24].
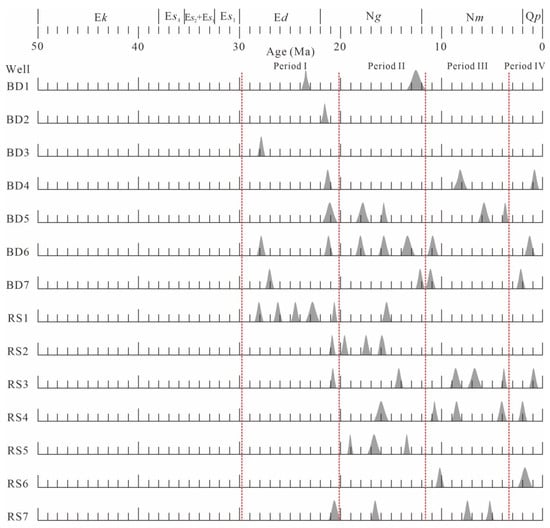
Figure 9.
Characteristics of hydrocarbon charging ages in the study area (The triangle corresponds to the hydrocarbon charging time indicated by the fluid inclusions and burial thermal history recovery models).
5.2. Adjustment and Alteration of the Dongying Formation
5.2.1. Adjustment and Alteration Construed by Inclusion Salinity
The fluid inclusion characteristics and burial thermal history recovery results indicate that subsequent uplift and fault activity have led to the adjustment and alteration of primary reservoirs in the study area, findings that align with previous studies [23]. The salinity of inclusions can also reflect the tectonic impact on reservoirs, typically through the dilution of formation water by mixing with fresh water (e.g., meteoric water) [5]. From the inclusion data, it is evident that the four periods (I–IV) all have an abnormally low salinity in the study area (Table 1 and Figure 5b). Generally, abnormally low salinity can be attributed to two primary causes: (1) as the maturity of hydrocarbon increases, the injection of late-stage hydrocarbons gradually reduces the salinity of formation water; (2) the mixing of fresh water from the atmosphere due to tectonic uplift or fracture activities [5,39]. The former is a gradual process, which is clearly inconsistent with the measured results (Figure 5b). Therefore, it is concluded that the latter may be the fundamental cause of the salinity decrease observed in the four periods.
The well burial history shows that the sag has undergone multiple distinct uplift events (Figure 6). Among these, the uplifts at 22.3 Ma and 11.8 Ma are most likely responsible for the infiltration of surface fresh water into the Dongying reservoir. The uplift at 22.3 Ma produced a region-wide weathered and eroded surface (major regional unconformity, T2; Figure 1b) that facilitated meteoric-water infiltration and allowed previously trapped hydrocarbons to leak. The discovery of solid asphalt in the Dongying reservoir serves as the most compelling evidence (Figure 3k,l; [19]. In contrast, the 11.8 Ma uplift was comparatively subtle and did not generate a recognizable regional unconformity. However, during this stage, a large number of strike-slip faults formed within the sag (Figure 1) [24], which could also provide pathways for the infiltration of surface fresh water into the Dongying reservoir. Therefore, the abnormally low salinity of the Dongying Formation suggests that the tectonic activities of the 22.3 Ma uplift erosion and the 11.8 Ma strike-slips fracturing have adjusted and altered the reservoir.
5.2.2. Adjustment and Alteration Constrained by Fluorescence Spectral
In addition to the effects of tectonic activity, secondary transformation processes such as oil pyrolysis, gas washing, biodegradation, water washing, and mixed sources can also adjust and alter the hydrocarbon characteristics in the reservoir. These processes can be constrained by fluorescence spectral data, particularly the inclusion density data derived from fluorescence spectral analysis [37,39]. Oil pyrolysis and gas washing processes lead to an increase in light components, a decrease in density, and a shift in fluorescence color toward the red region [37,39]. Oil pyrolysis requires an abnormally high-temperature event, such as magmatic activity (which has not been found in the study area), while gas washing is related to the injection of a large amount of gas [37]. The frequency distribution of oil-inclusion density at each stage is expected to follow a normal trend: (1) early hydrocarbon charge stage, low filling intensity and high oil density; (2) peak charge stage, maximum filling intensity and reduced density; (3) late charge stage, declining intensity and continued density decrease [1]. The early stage of hydrocarbon generation in source rocks has high density, which decreases as maturity increases: as implied from period I to period IV, the density continues to decrease [6]. Thus, the wide range of high-density values in periods I and II may be related to gas washing (Figure 10a), as inclusions with high gas content have also been discovered (Figure 3) [39].
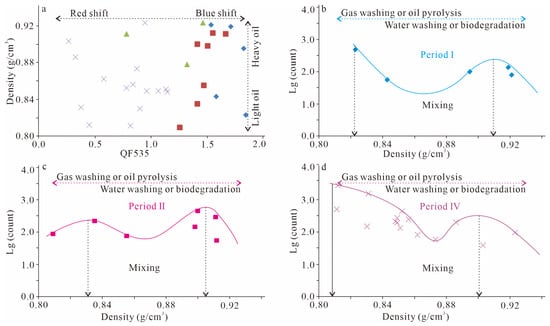
Figure 10.
Fluorescence spectral character (QF535 and density) of different hydrocarbon charge stages. (a) is the relation between QF535 and the density of all period samples; (b) is the relation between the frequency and density of period I; (c) is the relation between the frequency and density of period II; (d) is the relation between the frequency and density of period IV. The legend were similar to Figure 4.
Specifically, the broad range of low-density values observed in period IV exhibits an increase in density, which may also be influenced by biodegradation and water washing processes. These processes tend to increase heavy components, thereby increasing density and shifting fluorescence color toward the blue region (Figure 10a) [37]. The water washing process can be verified by the abnormally low salinity in the inclusions (around 22.3 Ma and 11.8 Ma; Figure 5b), while the latter process is difficult to verify based on our data. Therefore, the Dongying Formation has at least been subjected to both gas and water washing processes, with gas washing occurring much later (after 0.36 Ma; Figure 6). Moreover, the above analysis of fluid inclusion suggests that there are two source rocks supplying hydrocarbons to the Dongying Formation (Es1 and Es3). This characteristic can also be inferred from the bimodal density distribution observed at each stage, which implies a dual-source mixing process (Figure 10b,c). The mixing process can be calculated using a binary hybrid model based on the average density of each mode [6,42]. However, the subsequent alterations by gas and water washing have compromised the reliability of the results.
5.3. The Coupling Characteristics Between Hydrocarbon Distribution and Fault–Cap Sealing
5.3.1. The Hydrocarbon Relation Between the Dongying and Guantao Formations
Based on fluorescence color and gas-water ratio, the Guantao Formation exhibits two distinct stages of hydrocarbon charging (period I and period II; Table 1), with fluorescence spectral characteristics similar to those of the Dongying and Shahejie Formations (Figure 4). This similarity suggests that the hydrocarbons in the Guantao Formation likely originate from the same source rocks as in the Dongying Formation. To further elucidate the hydrocarbon relationship between the Dongying and Guantao Formations, we plotted the oil-water distribution of the Guantao Formation against the fault–cap sealing distribution of the Dongying Formation (Figure 7). The results indicate that the spatial distribution of oil wells is irregular; they are predominantly located around fault–cap sealing leakage zones where the fault juxtaposition thickness is below 86 m. In contrast, other areas show minimal hydrocarbon well discoveries (Figure 7). This pattern, combined with the presence of solid asphalt in the Dongying Formation, leads us to infer that the hydrocarbons in the Guantao Formation primarily leaked from the Dongying Formation, and this adjustment is inferred to have occurred prior to the wet gas generation stage according to the fluorescence color character and tectonic evolution character (11.8–7.8 Ma; Figure 6 and Figure 9).
5.3.2. The Relation Between Hydrocarbon Accumulation and Fault Activity Time
To further verify the tectonic adjustment of hydrocarbons from the Dongying Formation to the Guantao Formation, we conducted a statistical analysis of fault activity times and oil–water distribution characteristics in the Baoding Sag (Figure 11). The results show that faults from the Shahejie Formation to the Minghuazhen Formation were all active, but their activity decreased over time. Oil wells in the Guantao Formation are primarily associated with faults activated during the Minghuazhen Formation stage, with a fault juxtaposition thickness below 86 m (faults 1–3; Figure 11). However, fault 6 also activated during the Minghuazhen Formation, and the large fault juxtaposition thickness hindered the hydrocarbon leak from the Dongying Formation to the Guantao Formation. Additionally, the relatively low average growth index of these faults implies low fault activity, which leads to generally small-scale hydrocarbon reservoirs in the Guantao Formation (Figure 11).
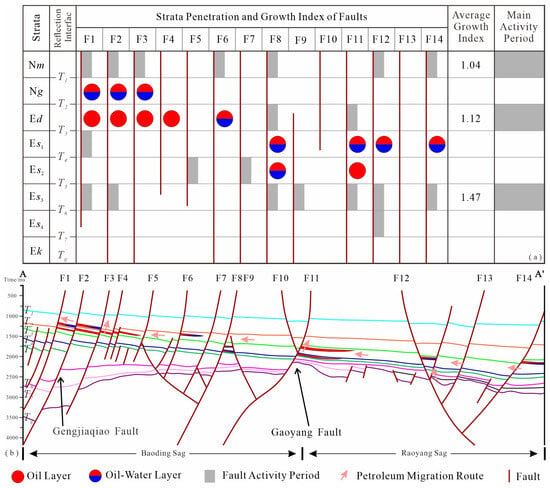
Figure 11.
The fault activity time and oil–water distribution character statistics result (a), and petroleum migration route in the reservoir (b). The A–A’ section position is shown in Figure 1b.
Thus, the hydrocarbon accumulation process of the Dongying Formation was that the Es3 began to charge hydrocarbon to the Dongying Formation at 28.2 Ma. And then the tectonic activity at 22.3 Ma and 11.8 Ma adjusted and altered the early Dongying reservoir character, along with the water washing process. Until 11.63 Ma, the Es1 began to charge hydrocarbon and made the hydrocarbon show a mixing character at the Dongying Formation, and fault activity around the early Minghuazhen further adjusted the hydrocarbon distribution character and made it leak to the Guantao Formation (fault juxtaposition thickness below 86 m). Around 0.36 Ma, the source rock entered the dry gas generation stage, and the upsurge of a large amount of gas caused the reservoir to undergo a gas-washing process and decreased the hydrocarbon density.
6. Conclusions
In this study, we investigated the hydrocarbon accumulation and alteration processes of the Dongying Formation affected by tectonic movement in the western Bohai Bay Basin, China, based on fluid inclusion and fault–cap sealing property analyses. Our findings are summarized as follows:
- (1)
- The study area has experienced at least two distinct stages of hydrocarbon charging. Based on microthermometric and fluorescence characteristics, these stages can be further divided into four sub-periods (I–IV), with fluorescence colors ranging from yellow (indicating marginal maturity) to blue (indicating maturity).
- (2)
- The salinity characteristics of the inclusions suggest that the Dongying Formation has undergone adjustments and alterations due to two significant tectonic events: the 22.3 Ma uplift erosion and the 11.8 Ma strike-slips fracturing. Fluorescence spectral data also indicate that the reservoir has been subjected to both gas and water washing processes, with gas washing occurring much later (after 0.36 Ma).
- (3)
- There are two source rocks supplying hydrocarbons to the Dongying Formation (Es1 and Es3; the burial history indicates that the latter released hydrocarbons relatively late). The inclusions exhibit a mixing characteristic, and this mixing is most evident in period IV, which can be further divided into IV1 and IV2 based on fluorescence spectral data.
- (4)
- The strike-slip fracturing around 11.8–7.8 Ma caused hydrocarbons of periods I and II to leak from the Dongying Formation and accumulate in the Guantao Formation, and this finding aligns with the fault activity characteristics. Additionally, the oil–water distribution characteristics suggest a fault juxtaposition thickness threshold for hydrocarbon leak at 86 m.
Author Contributions
Writing—original draft, J.Z. (Jieqiong Zhu); Conceptualization, X.L. (Xiaodong Li); Methodology, L.P.; Writing—original draft, Data curation, X.L. (Xiwei Li); Methodology, Supervision, K.C.; Investigation, C.W.; Conceptualization, Project administration, J.Z. (Jichao Zhang); Software, Y.L. (Yawen Li); Formal analysis, Y.L. (Yan Li); Validation, Y.Z.; Visualization, Z.S.; Writing—review and editing, Funding acquisition, Z.L.; Writing—review and editing, R.Z. All authors have read and agreed to the published version of the manuscript.
Funding
This study was supported by the Heilongjiang Provincial Natural Science Foundation of China (Number: ZL2024D003).
Data Availability Statement
The original contributions presented in this study are included in the article. Further inquiries can be directed to the corresponding authors.
Conflicts of Interest
Authors Jieqiong Zhu, Xiaodong Li, Longchuan Pu, Xiwei Li, Ketong Chen, Chengyun Wang, Jichao Zhang, Yawen Li, Yan Li, Yi Zhao and Zeqi Song were employed by the PetroChina Huabei Oilfield Company. The remaining authors declare that the research was conducted in the absence of any commercial or financial relationships that could be construed as a potential conflict of interest.
References
- Li, Z.; Xiao, Y.; Tian, J.; Li, X.; Wang, Y.; Wang, H.; Jian, Y.; Tang, X.; Jia, Y.; Ren, C.; et al. Potentials and favorable directions for new fields, newtypes of oil-gas exploration in Jizhong Depression, Bohai Bay Basin. Acta Pet. Sin. 2024, 45, 69–98. (In Chinese) [Google Scholar] [CrossRef]
- Zhu, L.; Wang, Z.; Wang, F.; Tian, Y. Discussion on influencing factors of hydrocarbon generation in deep source rocks: A case study of Bozhong Sag, Bohai Bay basin. Unconv. Resour. 2025, 6, 100166. [Google Scholar] [CrossRef]
- Herbert, V.; Simon, C. Using petroleum inclusions to trace petroleum systems—A review. Org. Geochem. 2019, 129, 99–123. [Google Scholar] [CrossRef]
- Wan, J.; Gong, Y.; Zhuo, Q.; Lu, X.; Huang, W. Fluid inclusion characteristics of the Jurassic reservoir and hydrocarbon accumulation process in the eastern Kuqa Depression, Tarim Basin. J. Pet. Explor. Prod. Technol. 2023, 13, 523–541. [Google Scholar] [CrossRef]
- Guo, Y.; Cao, J.; Liu, R.; Wang, H.; Zhang, H. Hydrocarbon accumulation and alteration of the Upper Carboniferous Keluke Formation in the eastern Qaidam Basin: Insights from fluid inclusion and basin modeling. J. Pet. Sci. Eng. 2022, 211, 110116. [Google Scholar] [CrossRef]
- Si, S.; Yu, Y.; Wang, X.; Wang, X.; Zhao, Y.; Wu, W. Tight Oil and Gas Charging Period andIts Accumulation Contribution of Fuyu Oil Layerin Sanzhao Sag, Songliao Basin. J. Jilin Univ. (Earth Sci. Ed.) 2023, 54, 1457–1467. (In Chinese) [Google Scholar] [CrossRef]
- Ahmed, K.; Liu, K.; Moussa, H.; Liu, J.; Ahmed, H.A.; Kra, K.L. Assessment of petroleum system elements and migration pattern of Borno (Chad) Basin, northeastern Nigeria. J. Petrol. Sci. Eng. 2022, 208, 109505. [Google Scholar] [CrossRef]
- Pang, X.; Jia, C.; Pang, H.; Yang, H. Destruction of hydrocarbon reservoirs due to tectonic modifications: Conceptual models and quantitative evaluation on the Tarim Basin, China. Mar. Petrol. Geol. 2018, 91, 401–421. [Google Scholar] [CrossRef]
- Terrence, P. A review of fluid inclusions in diagenetic systems. Acta Geol. Sin. (Engl. Ed.) 2015, 89, 697–714. [Google Scholar] [CrossRef]
- Osukuku, G.; Osinowo, O.; Sonibare, W.; Makhanu, E.; Orora, C. Integrated fluid inclusion studies and source rock parameters in constraining hydrocarbon potential in offshore Lamu Basin, Kenya. Energy Geosci. 2023, 4, 100142. [Google Scholar] [CrossRef]
- Zhang, F.; Chen, Z.; Zhaom, Z.; Gao, J.; Fu, L.; Li, C.; Zhang, L. Hydrocarbon accumulation periods in the Upper Paleozoic strata of the Western Ordos Basin, China, based on fluid inclusions and basin modeling. ACS Omega 2023, 8, 20536–20549. [Google Scholar] [CrossRef]
- Cao, Q.; Wei, X.; Chen, Z.; Zhao, J.; Tang, M. Hydrocarbon charge history of the Upper Paleozoic, Ordos Basin as revealed by fluid inclusions. Front. Phys. 2022, 10, 836977. [Google Scholar] [CrossRef]
- Zhu, J. Characterization of Fluid Inclusions in Chang 7 Shale Oil in Ordos Basin. Master’s Thesis, Xi’an Shiyou University, Xi’an, China, 2023. (In Chinese). [Google Scholar]
- Mao, W.; Ulrich, T.; Zhong, H. A numerical model for the quantification of fluid inclusion property variations caused by heterogeneous entrapment and post-entrapment modifications in the H2O-NaCl system. Chem. Geol. 2024, 661, 122190. [Google Scholar] [CrossRef]
- Zhang, Z.; Yang, X.; Hao, F.; Tian, J.; Chen, Y.; Luo, X. Fluid inclusion characteristics and hydrocarbon accumulation process in Lungu Area, Tarim Basin. Earth Sci. 2024, 49, 2407–2419. (In Chinese) [Google Scholar]
- Xu, C.; Peng, J.; Wu, Q.; Sun, Z.; Ye, T. Vertical dominant migration channel and hydrocarbon migration in complex fault zone, Bohai Bay Sag, China. Petrol. Explor. Dev. 2019, 46, 720–728. [Google Scholar] [CrossRef]
- Li, Z.; Ma, J.; Lou, Q.; Xiao, Y.; Wang, Q.; Pang, Q.; Wu, X.; Shao, Y.; Jin, J.; Zhong, X.; et al. Characteristics and hydrocarbon generation mechanism of early low-mature oil in Baoding sag, Bohai Bay Basin. Acta Pet. Sin. 2024, 45, 500–516. (In Chinese) [Google Scholar] [CrossRef]
- Liu, N.; Qiu, N.; Qin, M.; Cai, C.; Li, Z.; Yu, Z.; Wang, Y. Main controlling factors and models of hydrocarbon accumulation in the Shulu buried-hill belt, Jizhong depression, Bohai Bay basin. Acta Geol. Sin. 2023, 97, 897–910. (In Chinese) [Google Scholar] [CrossRef]
- Liu, J.; Ren, Y.; Wang, D.; Feng, Y.; Han, Y.; Du, M. Fluid inclusions characteristics and hydrocarbon accumulation Period of the reservoir in the Northern Section, Lixian Slope. Geol. Sci. Technol. Inf. 2016, 35, 53–58. (In Chinese) [Google Scholar]
- Morakinyo, A.; Mohamed, A.; Bowden, S. The release of petroleum from Central Africa rift basins over geological time as deduced from petroleum systems modelling. J. Afr. Earth Sci. 2021, 183, 104319. [Google Scholar] [CrossRef]
- Chu, R.; Yan, D.; Qiu, L.; Wang, H.; Wang, Q. Quantitative constraints on hydrocarbon vertical leakage: Insights from underfilled fault-bound traps in the Bohai Bay Basin, China. Mar. Pet. Geol. 2023, 149, 106078. [Google Scholar] [CrossRef]
- Zhao, Z.; Jiang, Y.; Jin, F.; Liu, H.; Yang, D.; Wang, X.; Zhao, K. Hydrocarbon accumulation mechanism and model of sub-sags in hydrocarbon-rich sag: A case study of Raoyang Sag in Jizhong Depression. Acta Pet. Sin. 2017, 38, 67–76. [Google Scholar] [CrossRef]
- Shan, S. Structural Geometry and Kinematics of the Taihang Mountain Piedmont Fault and Its Controlling on the Development of the Bohai Bay Basin. Ph.D. Thesis, University of Geosciences, Beijing, China, 2018. (In Chinese). [Google Scholar]
- Wang, Q. Study on the Difference in the Evolution Mechanism of Strike-Slip Fault System and Its Relationship with Oil and Gas Distribution in the Western Depression of Liaohe Sub-Basin. Ph.D. Thesis, Northeast Petroleum University, Daqing, China, 2023. (In Chinese). [Google Scholar] [CrossRef]
- Lindsay, N.; Murphy, F.; Walsh, J.; Watterson, J. Outcrop studies of shale smears on fault surfaces. Int. Assoc. Sedimentol. 1993, 15, 113–123. [Google Scholar]
- Fu, X.; Yan, L.; Meng, L.; Liu, X. Deformation mechanism and vertical sealing capacity of fault in the mudstone caprock. J. Earth Sci. 2019, 30, 367–375. [Google Scholar] [CrossRef]
- Vrolijk, P.; Urai, J.L.; Kettermann, M. Clay smear: Review of mechanisms and applications. J. Struct. Geol. 2016, 86, 95–152. [Google Scholar] [CrossRef]
- Fu, X.; Wang, H.; Song, X.; Wang, S.; Fan, M. Quantitative evaluation method and its application for vertical fault seal of thick caprock intervals. Pet. Geol. Oilfield Dev. Daqing 2024, 43, 95–104. (In Chinese) [Google Scholar] [CrossRef]
- Pang, Y. Geological Structure Characteristics and the Influence on Hydrocarbon Accumulation in Jizhong Depression. Master’s Thesis, China University of Petroleum (EastChina), Qingdao, China, 2012. [Google Scholar]
- Kong, X.; Jiang, Z.; Han, C.; Zhang, R. Organic Matter Enrichment and Hydrocarbon Accumulation Models of the Marlstone in the Shulu Sag, Bohai Bay Basin, Northern China. Int. J. Coal Geol. 2020, 217, 103350. [Google Scholar] [CrossRef]
- Wang, Y.; Cai, C.; Xiao, Y.; Ming, J.; Tian, R.; Ren, Y.; Zhu, Z.; Zhang, Y.; Shi, C. Geochemical Characteristics and Oil-Source Correlation of Crude Oils of Buried Hills in Shulu Sag, Jizhong Depression. Earth Sci. 2021, 46, 3630–3644. (In Chinese) [Google Scholar] [CrossRef]
- Li, Q.; You, X.; Jiang, Z.; Zhao, X.; Zhang, R. A type of continuous petroleum accumulation system in the Shulu Sag, Bohai Bay Basin, Eastern China. AAPG Bull. 2017, 101, 1791–1811. [Google Scholar] [CrossRef]
- Lutz, R.; Klitzke, P.; Weniger, P.; Blumenberg, M.; Franke, D.; Reinhardt, L.; Ehrhardt, A.; Berglar, K. Basin and petroleum systems modelling in the northern Norwegian Barents Sea. Mar. Petrol. Geol. 2021, 130, 105128. [Google Scholar] [CrossRef]
- Lü, Y.; Li, G.; Wang, Y.; Song, G. Quantitative analyses in fault sealing properties. Acta Pet. Sin. 1996, 17, 39–45. (In Chinese) [Google Scholar] [CrossRef]
- Goldstein, R. Fluid inclusion in the sedmentary and diagenetic systems. Lithos 2001, 55, 159–193. [Google Scholar] [CrossRef]
- Guo, X.; Liu, K.; He, S.; Song, G.; Wang, Y.; Hao, X.; Wang, B. Petroleum generation and charge history of the northern Dongying Depression, Bohai Bay Basin, China: Insight from integrated fluid inclusion analysis and basin modelling. Mar. Petrol. Geol. 2012, 32, 21–35. [Google Scholar] [CrossRef]
- Si, S.; Zhao, J.; Zhou, G.; Liu, F.; Liu, C.; Yan, G. Application of fluorescence spectroscopy in identification of aromatic components in single oil inclusions. Spectrosc. Spectr. Anal. 2020, 40, 1736–1740. (In Chinese) [Google Scholar]
- Zuo, G.; Cao, Z.; Liu, Y.; Guo, X.; Wang, B.; Chen, J.; Xu, H.; Zhang, X. Quantitative evaluation of petroleum maturity of different periods of charging of Ordovician reservoirs in Tahe Area using fluorescence spectrum parameters of oil. Earth Sci. 2024, 49, 2434–2447. [Google Scholar]
- Su, A.; Li, P.; Lei, M.; Liu, Q.; Zhang, X. Identifying gas-washing and water-washing of oil reservoir by fluorescence and infrared spectra of single oil inclusion. Spectrosc. Spectr. Anal. 2021, 41, 2649–2656. [Google Scholar]
- Ping, H.; Chen, H.; Jia, G. Petroleum accumulation in the deeply buried reservoirs in the northern Dongying Depression, Bohai Bay Basin, China: New insights from fluid inclusions, natural gas geochemistry, and 1–D basin modeling. Mar. Petrol. Geol. 2017, 80, 70–93. [Google Scholar] [CrossRef]
- Liu, H.; Lin, C.; Dong, C.; Luan, G.; Ren, L.; Zhang, G.; Zhang, Y.; Guan, B. Diagenetic fluid evolution and its implication for hydrocarbon accumulation in Ordovician carbonate of the Tazhong area, Tarim Basin: Constraints from petrology, fluid inclusions, and geochemistry of calcite cements. Mar. Pet. Geol. 2025, 176, 107360. [Google Scholar] [CrossRef]
- Zhao, R.; Shan, X.; Wu, C.; Yi, J.; Hao, G.; Wang, P. Formation and evolution of the Changbaishan volcanic geothermal system in a convergent plate boundary back-arc region constrained by boron isotope and gas data. J. Hydrol. 2019, 569, 188–202. [Google Scholar] [CrossRef]
Disclaimer/Publisher’s Note: The statements, opinions and data contained in all publications are solely those of the individual author(s) and contributor(s) and not of MDPI and/or the editor(s). MDPI and/or the editor(s) disclaim responsibility for any injury to people or property resulting from any ideas, methods, instructions or products referred to in the content. |
© 2025 by the authors. Licensee MDPI, Basel, Switzerland. This article is an open access article distributed under the terms and conditions of the Creative Commons Attribution (CC BY) license (https://creativecommons.org/licenses/by/4.0/).