You are currently viewing a new version of our website. To view the old version click .
Processes
  • Article
  • Open Access

16 November 2025

Heterogeneous UV–Fenton Process by Maize-Straw-Templated TiO2/Fe3O4 for the Degradation of Tetracycline: Optimization Using Response Surface Methodology

,
and
Key Laboratory of Songliao Aquatic Environment, Ministry of Education, Jilin Jianzhu University, Changchun 130118, China
*
Author to whom correspondence should be addressed.
Processes2025, 13(11), 3701;https://doi.org/10.3390/pr13113701 
(registering DOI)
This article belongs to the Section Environmental and Green Processes

Abstract

The heterogeneous Fenton-like catalysts TiO2/Fe3O4 were fabricated using maize straw as template (MST-TiO2/Fe3O4) by calcination followed by the hydrothermal method. The characterization showed that higher Fe3O4 particle dispersion, closer interaction between TiO2 and Fe3O4, stronger electron transfer ability, and lower leaching of Fe ions of MST-TiO2/Fe3O4 catalyst resulted in higher catalytic activity towards the degradation of tetracycline (TC) compared to pure Fe3O4. The best conditions for TC degradation were initial pH = 6.74, 11.52 mmol/L of H2O2, 0.38 g/L of MST-TiO2/Fe3O4, and a reaction time of 56.63 min according to the response surface methodology (RSM) result based on the Box–Behnken design (BBD). The quadratic model was well-fitted to the experimental data with R2 (0.9843) and adj-R2 (0.9660) by the analysis of variance (ANOVA). Under the optimum reaction conditions, a maximum removal rate of 98.67% was achieved. The findings of the present study revealed that heterogeneous UV–Fenton process catalyzed by MST-TiO2/Fe3O4 was a suitable way for the degradation of TC from aqueous environment.

1. Introduction

Antibiotic contamination is a potential threat to humans and the environment []. Tetracyclines (TCs) are the world’s second-most frequently used antibiotic that is commonly employed in livestock farming or added to livestock feed as growth promoters, and are designed to be stable and biorefractory [,]. Fenton-like and photocatalytic processes in advanced oxidation technology have shown great advantages. The essence of the Fenton-like reaction consists of Fe2+ and H2O2 reacting to generate high redox potential for the hydroxyl radial (•OH) and complete the cycle of Fe2+ and Fe3+. The heterogeneous Fenton technology that uses magnetic materials as catalysts has always attracted attention as a well-known example of AOPs. Compared to the homogeneous Fenton technology, the main advantages of this technology are as follows: no iron-containing sludge is produced, the suitable pH range is wider, the catalyst can be recycled, and the stability is better [,]. Fe3O4 is a type of iron oxide that has good magnetic properties; it is also non-toxic, reusable, and has a stable catalytic performance. The nanomodification of the catalyst is beneficial to increase its specific surface area and can indirectly increase catalytic activity. However, nano-sized Fe3O4 particles are easily agglomerated in the liquid phase, which affects its catalytic activity [].
In addition, the catalytic activity of pure heterogeneous Fenton is relatively weak, because studies have shown that Fe3+/Fe2+ circulation rate on the catalyst surface under neutral or alkaline conditions is lower than that under acidic conditions. Considering that the photo-generated electrons generated by photocatalysis described in the previous section can promote the conversion of Fe3+ to Fe2+, the synergistic effect of photocatalysis and Fenton technology has a good oxidation effect on tetracycline. Therefore, Fe3O4 can be combined with TiO2 to form a photocatalytic and heterogeneous Fenton system [,].
Orthogonal and single-factor tests are the more common experimental methods in the Fenton process []. However, these two methods are not able to analyze the interaction effects between the influencing factors, yet examining the interaction effects between factors is also the key to assessing the effect of each reaction parameter on the removal of pollutants by Fenton reaction. RSM is a method for the comprehensive analysis of test results using data obtained from a small number of tests []. It uses a reasonable experimental design to combine experimental, statistical, and mathematical models to fit a multiple quadratic regression equation function between the test factors and the test results, so as to analyze the influence of each test factor on the test results. Therefore, the RSM is used to design the experimental process, evaluate the individual and interaction effects of the process parameters, optimize the parameters with a minimum number of experiments, and predict the experimental results [,].
In this research, the MST-TiO2/Fe3O4 composite catalysts were prepared by calcination followed by a hydrothermal method and TC was selected as a model pollutant to study the hybrid process involved in the UV–Fenton and TiO2 photocatalytic oxidation of MST-TiO2/Fe3O4. RSM was applied to model and optimize TC degradation efficiency based on four main parameters including initial pH, H2O2 dosage, catalyst dosage, and reaction time. This study did not merely synthesize an effective catalyst but also optimized the UV–Fenton process’ procedure, energy, and material usage.

2. Materials and Methods

2.1. Reagents and Chemicals

All chemicals used in this study were analytical grade reagents and were used without further purification. Tetracycline (TC) HCl (C22H24N2O8 HCl) was obtained from Sigma (Sigma–Aldrich Chemical Co., Beijing, China). Sodium thiosulfate pentahydrate (Na2S2O3·5H2O), ferrous sulfate (FeSO4·7H2O), sulfuric acid, sodium hydroxide (NaOH), and hydrogen peroxide 30% (H2O2) were purchased from Shenyang East China Reagent Plant. All solutions were prepared in deionized water.

2.2. Synthesis and Characterization of MST-TiO2/Fe3O4

MST-TiO2/Fe3O4 and MST-TiO2 were prepared using our previously reported procedures [] and Fe3O4 was obtained through the hydrothermal synthesis method.
The phase structure characterization of all powders was carried out on a Rigaku D/Max 2550 diffractometer using Cu Kα radiation (λ = 1.54056 nm) at a scanning speed of 10° min−1 with the 2θ angle from 20° to 80°. The acceleration voltage and applied current were 3 kV and 20 mA, respectively. Microstructure and morphology of the synthesized samples were characterized by field emission scanning electron microscopy (FE-SEM, NOVA-230, FEI, Hillsboro, OR, USA). The chemical compositions were investigated by X-ray photoelectron spectroscope (XPS, Thermo Fisher Scientific 250Xi, Shanghai, China). Electrochemical impedance spectroscopy (EIS) was obtained by a computer-controlled impedance measurement unit (CHI760E, Shanghai Chenhua Instrument Co., Ltd., Shanghai, China). The ultraviolet-visible absorption properties of the samples were characterized using a Shimadzu U-4100 UV-Vis spectrophotometer. Barium sulfate was used as the reference standard, with a scanning wavelength range of 200–800 nm.

2.3. Experimental Procedure and Analysis

The batch UV–Fenton catalytic experiments were conducted in a 250 mL glass beaker using a magnetic agitator (750 rpm). A 10 w UVC-lamp (L: 220 mm, D: 80 mm, λ = 220–275 nm, Kongche, Shenzhen, China) was used as the UV source. H2SO4 and NaOH were added to adjust the pH of the solution to the desired value and the UV–Fenton reaction was initiated by adding the catalyst and H2O2 to the TC solution. At given time intervals, 4 mL of solution was collected and filtered immediately with 0.45 μm membrane filters for measurement. The RSM based on the BBD was used to analyze the relationship between the response (TC degradation rate) and four independent variables (initial pH, H2O2 dosage, catalyst dosage, and reaction time) with the Design-Expert Software (version 8.0.6).
The absorbance of TC was measured at 375 nm via an ultraviolet-visible spectrophotometer (752, Shanghai Shunyu Instrument Co., Ltd., Shanghai, China). The H2O2 concentration was determined at 400 nm on a UV-visible spectrophotometer by a potassium titanium oxalate method []. The amount of iron-leaching concentration was determined by the atomic absorption spectrophotometer (AAS, PE, Analyst 400, Springfield, IL, USA). Total organic carbon (TOC) was measured using a TOC-L series total organic carbon analyzer (Shimadzu Corporation, Kyoto, Japan). During the TC degradation process, 20 mL of water samples were collected at regular intervals. A specific amount of 10% sodium sulfite solution was added to each sample to quench residual H2O2, and after which the samples were placed into the continuous autosampler tray for analysis.

3. Result and Discussion

3.1. Characterization of MST-TiO2/Fe3O4

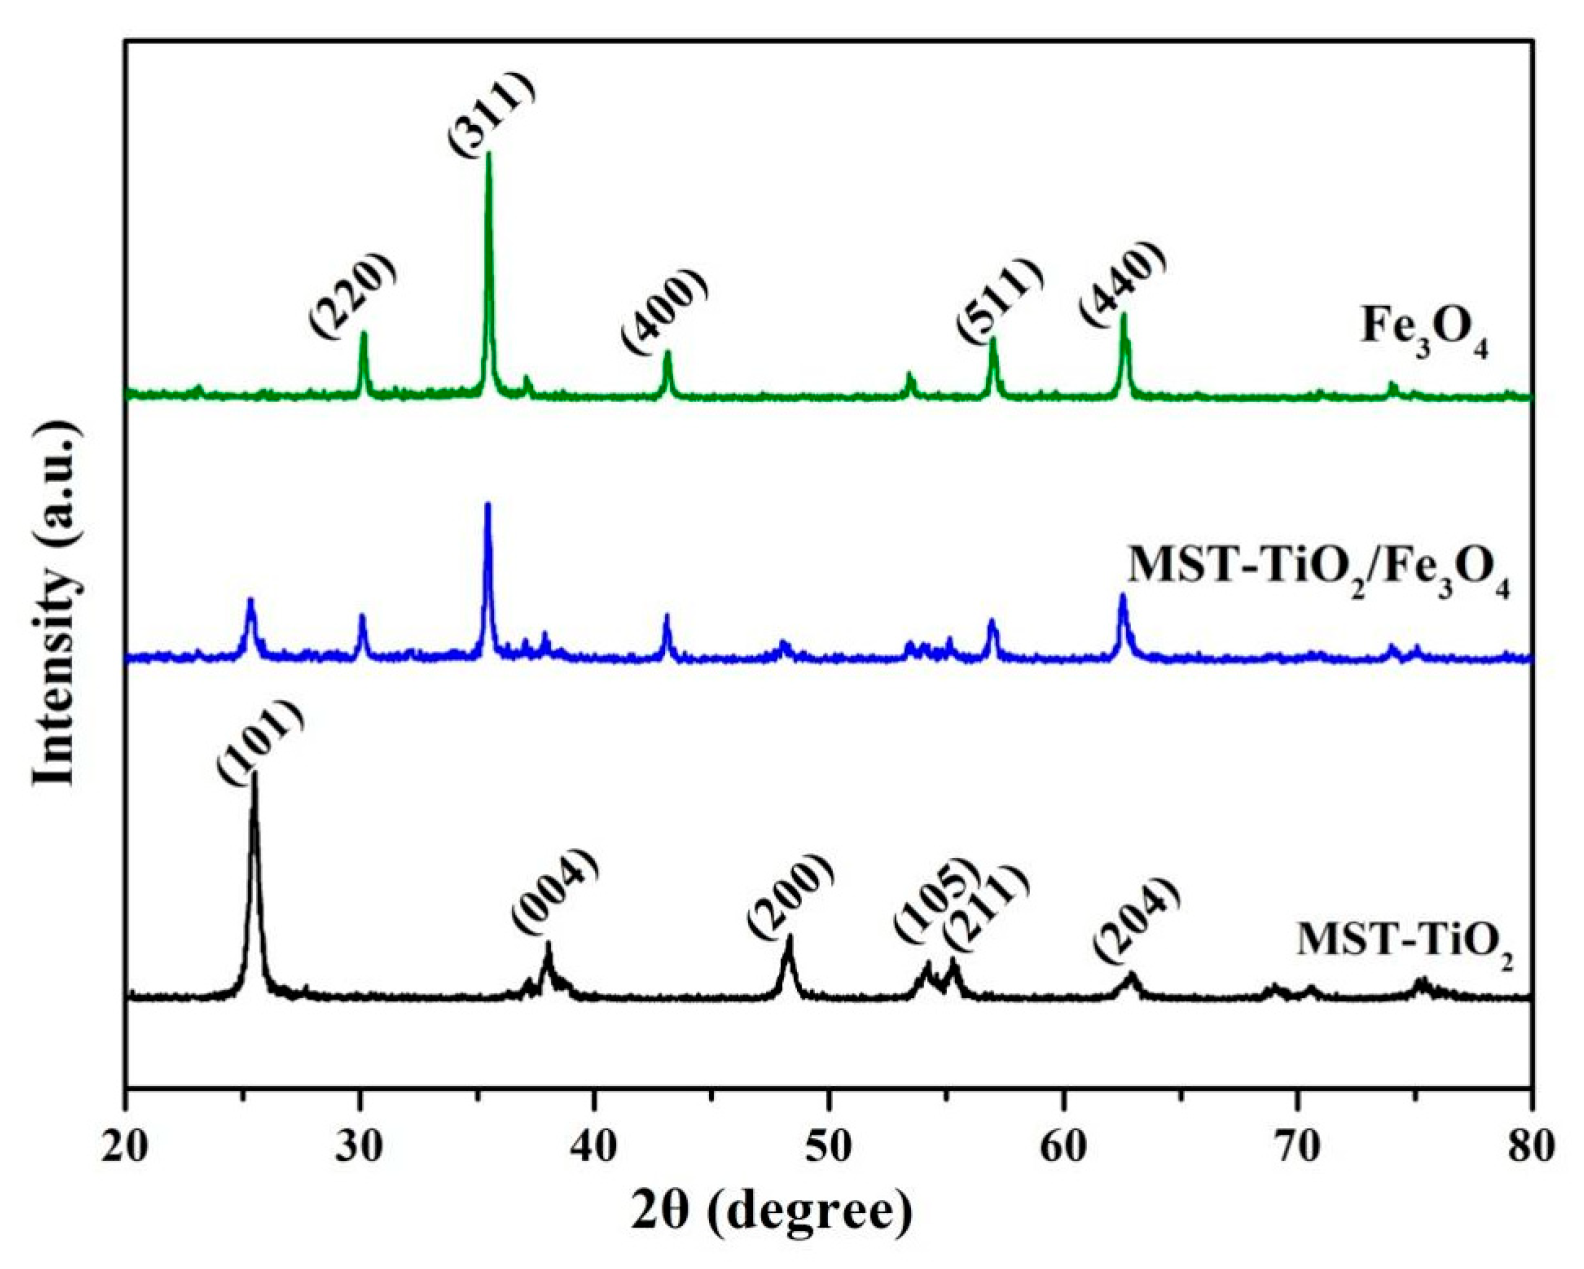
The X-ray diffraction (XRD) pattern of TiO2 shows a typical anatase phase of MST-TiO2 (PDF No. 73-1764) in Figure 1. New characteristic peaks indexed to the magnetite phase with a cubic structure of Fe3O4 (PDF No.88-0866) were revealed from the MST-TiO2/Fe3O4 sample.
Figure 1. XRD patterns of Fe3O4, TiO2, and MST-TiO2/Fe3O4.
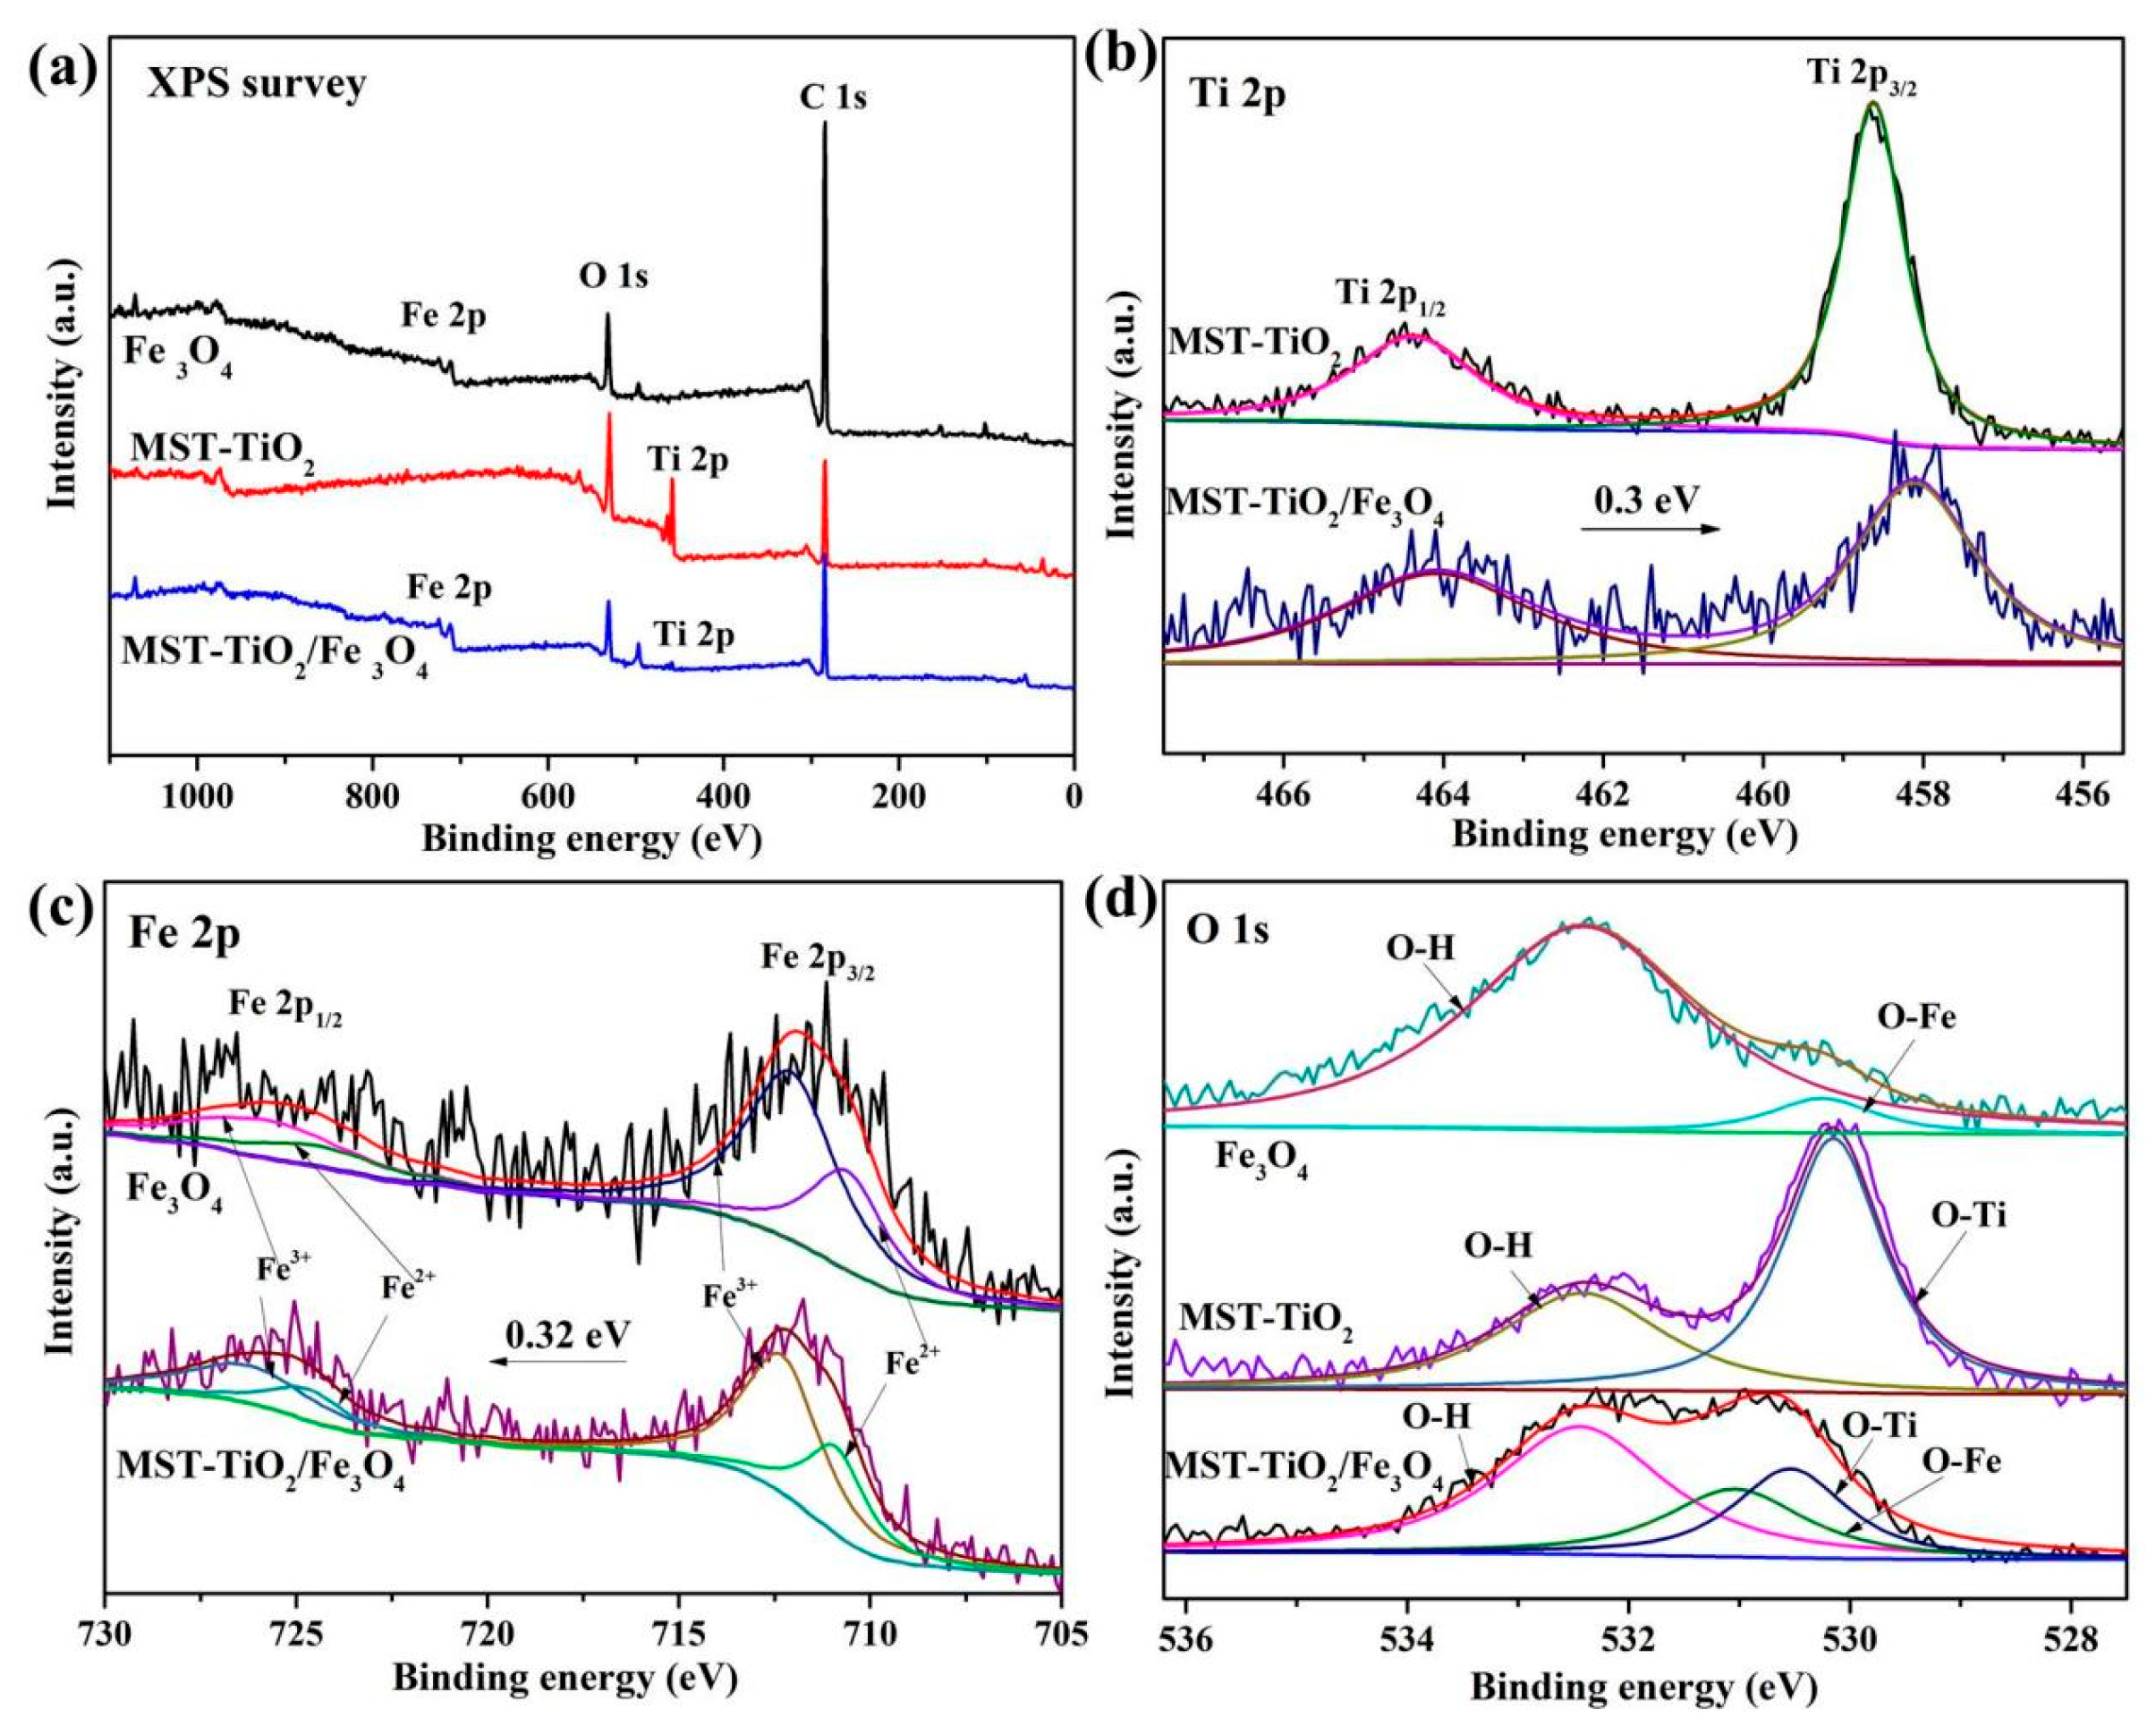
XPS characterization is performed to reveal the chemical state of the elements in the MST-TiO2/Fe3O4 sample and to identify the interaction between MST-TiO2 and Fe3O4(Figure 2). The Ti 2p, Fe 2p and O 1s envelops of MST-TiO2, Fe3O4 and MST-TiO2/Fe3O4 are shown in Figure 2b–d and their deconvolution was performed by using a Gaussian–Lorentzian peak shape after performing a Shirley background correction. From the XPS survey spectrum of MST-TiO2/Fe3O4 (Figure 2a), peaks of Fe 2p, O 1s, Ti 2p and C 1s were identified, which are in accordance with the binding energies of Fe, O, Ti and C, respectively. It should be noted that the C found in the samples resulted from the surface adventitious carbon from XPS instruments itself. In the Ti 2p XPS spectrum (Figure 2b), the two peaks at 464.2 eV and 458.4 eV of MST-TiO2 correspond to the Ti 2p 1/2 and Ti 2p 3/2, respectively, while the peaks of MST-TiO2/Fe3O4 shift 0.3 eV towards a lower binding energy. Also noticed from the Fe 2p XPS spectrum of Figure 2c is that the peaks at binding energy of 725.5 eV and 711.9 eV, which can be attributed to the Fe 2p 1/2 and Fe 2p 3/2, respectively, both consisted of Fe3+ (Fe2O3) and Fe2+ (FeO) peaks which are typical characteristics of Fe3O4 []. The Fe3+/Fe2+ ratio calculated from the peak areas is about 2:1, which is consistent with the characteristics of Fe3O4. The two peaks (Fe 2p 1/2 and 3/2) in the MST-TiO2/Fe3O4 nanocomposites have a shift of 0.32 eV towards higher binding energy. In the O1s spectra of TiO2, Fe3O4 and MST-TiO2/Fe3O4 composites (Figure 2d), the O1s spectra of TiO2 and Fe3O4 both contain lattice oxygen (O-Ti or O-Fe) and adsorbed oxygen (O-H), which are consistent with previous reports []. However, the lattice oxygen of the MST-TiO2/Fe3O4 sample shifts towards higher energy in O1s spectrum. The down-shifts in Ti 2p peaks and the up-shifts in Fe 2p and lattice oxygen of MST-TiO2/Fe3O4 can be traced to the change in the chemical environment arising from the close interaction between TiO2 and Fe3O4 [,], which demonstrates the well-established Fe-O-Ti bond of MST-TiO2/Fe3O4 []. This is because Fe3O4 enters the lattice of TiO2, which reduces the binding energy of TiO2, and this change makes TiO2 in the MST-TiO2/Fe3O4 sample easier to excite with light.
Figure 2. Survey and high-resolution XPS spectra of Fe3O4, TiO2 and MST-TiO2/Fe3O4. (a) Survey spectra; (b) Ti 2p spectra of TiO2 and MST-TiO2/Fe3O4; (c) Fe 2p spectra of Fe3O4 and MST-TiO2/Fe3O4; (d) O 1s spectra of Fe3O4, TiO2 and MST-TiO2/Fe3O4.
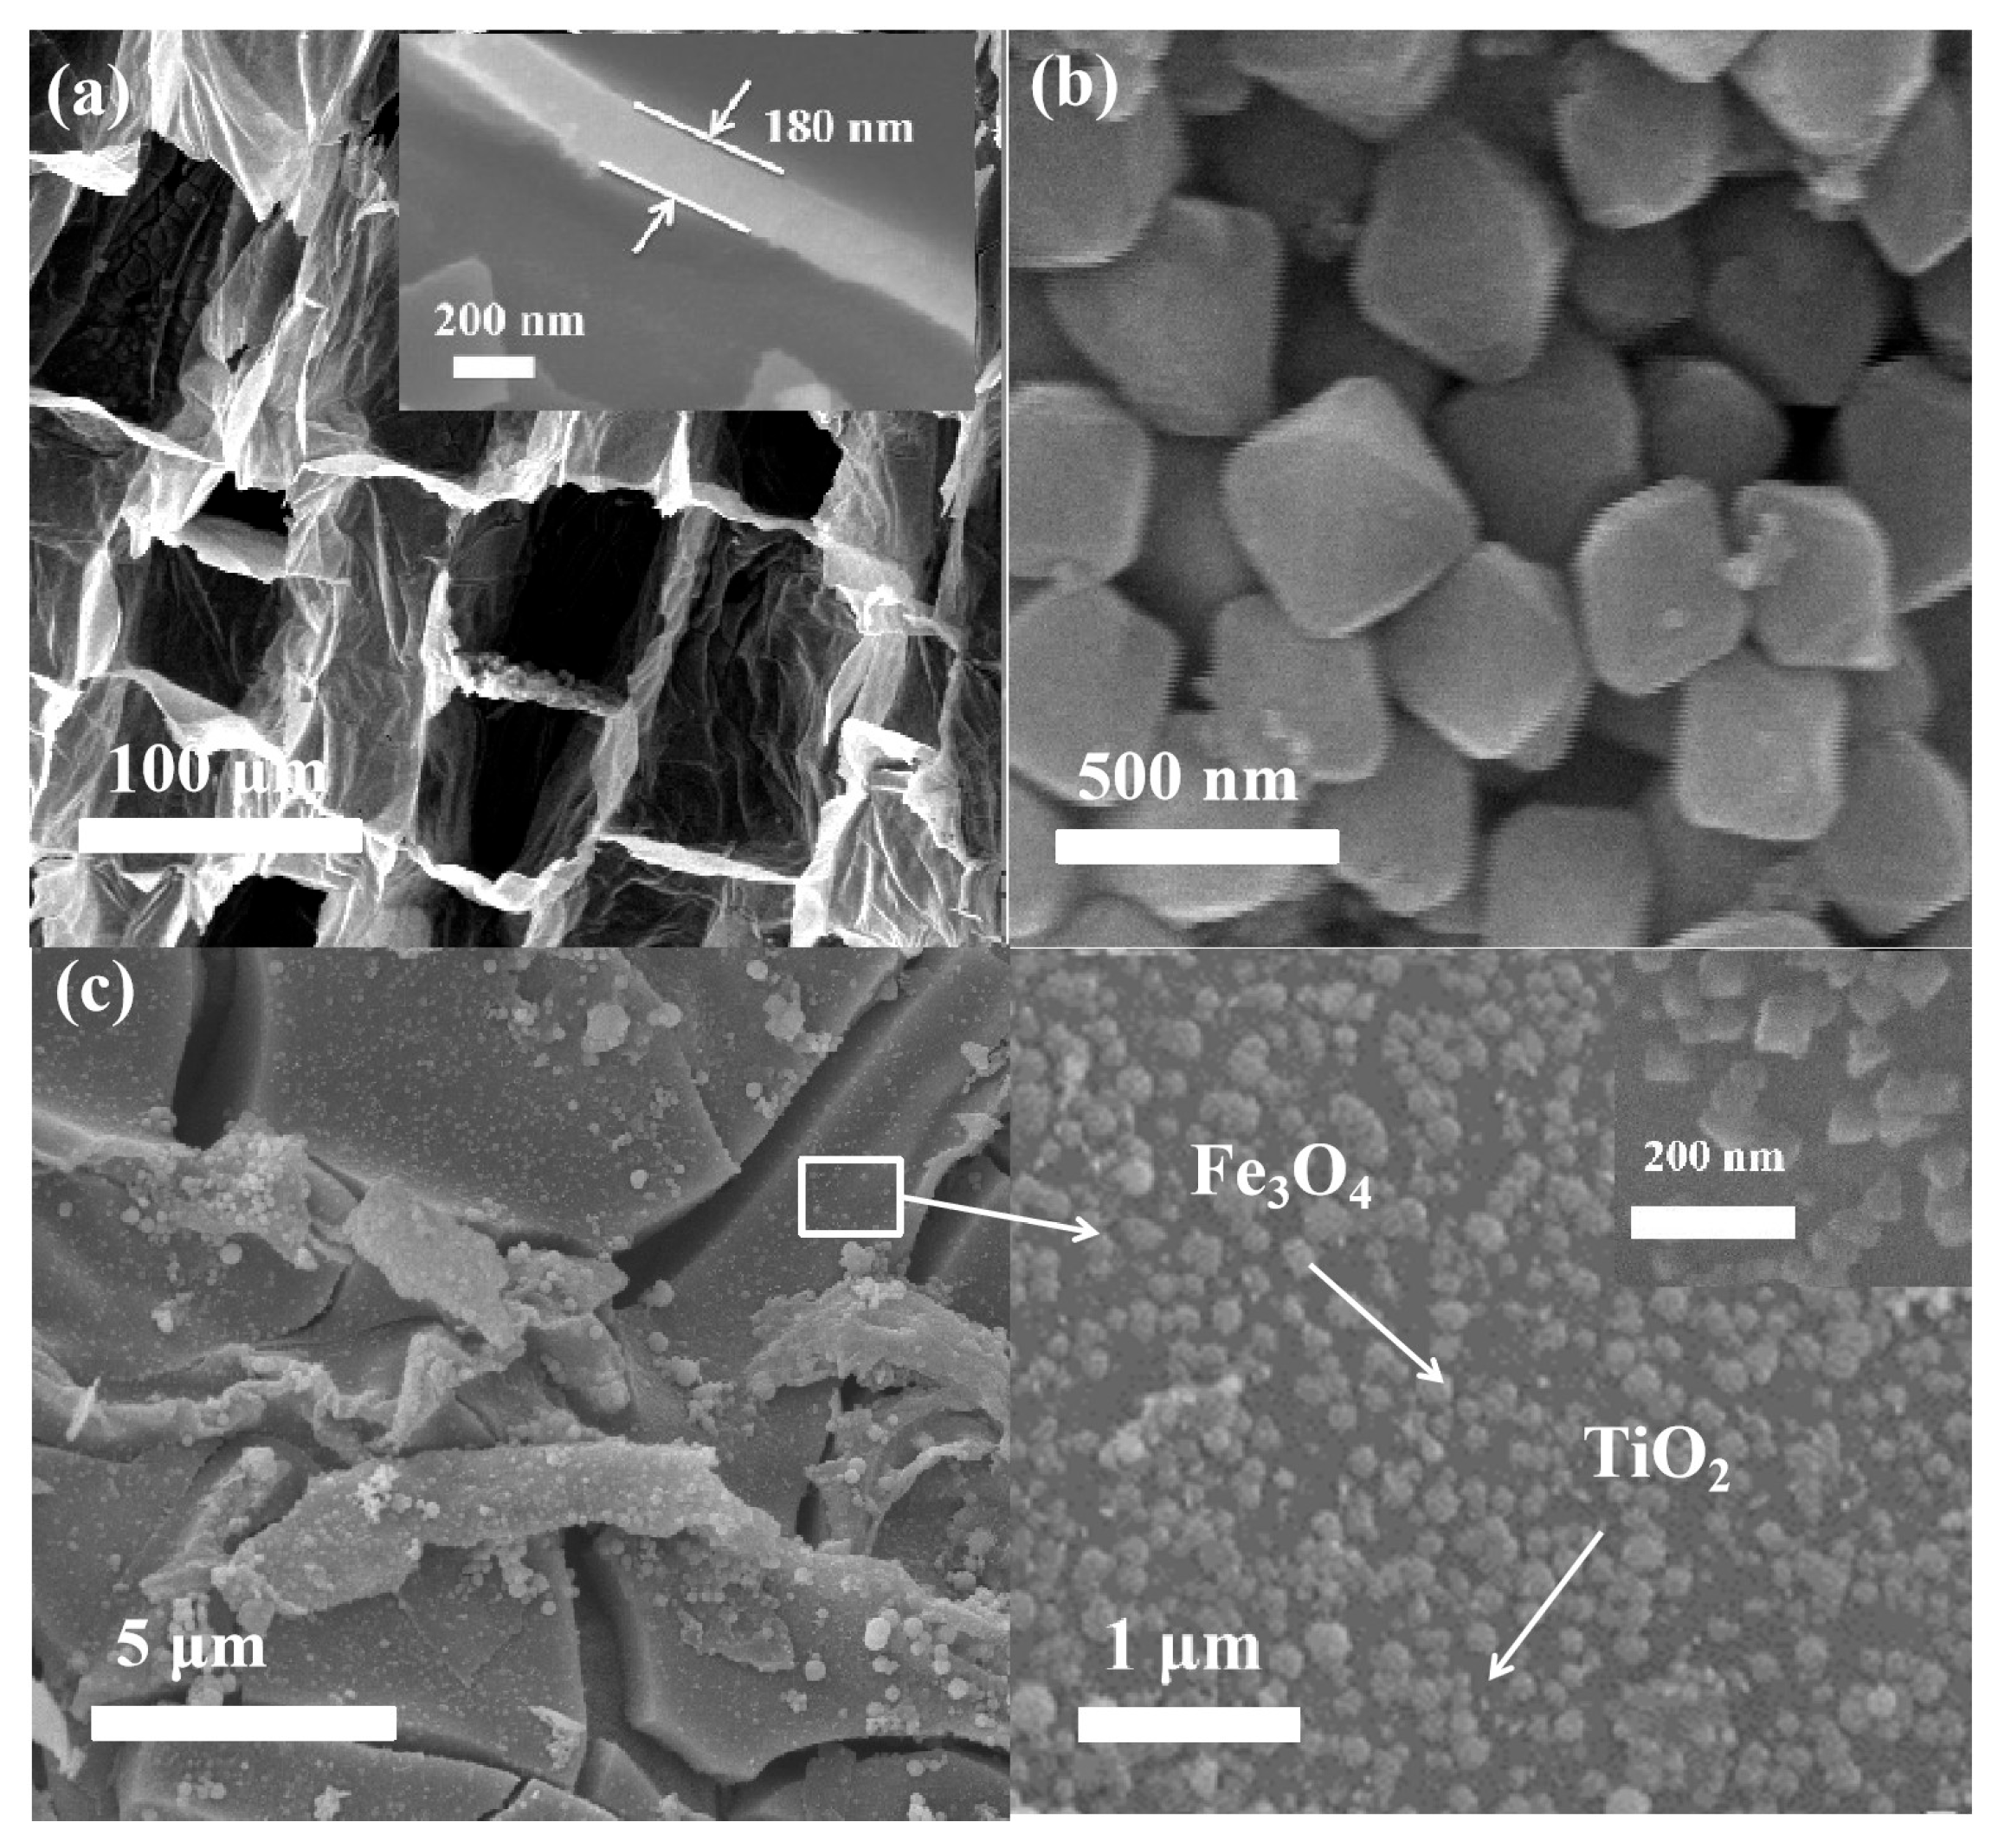
The morphology of MST-TiO2, Fe3O4 and MST-TiO2/Fe3O4 particles were revealed by SEM as shown in Figure 3. MST-TiO2 clearly displayed its honeycomb morphology and was composed of the MST-TiO2 nanosheet (Figure 3a). Pure Fe3O4 exhibited nanoparticles with a size range of 150∼250 nm, and high-resolution SEM images of MST-TiO2 reveal that the wall thickness of MST-TiO2 nanosheets is approximately 150–200 nm. (Figure 3b), in accordance with the former report. However, the pure Fe3O4 particles were agglomerated due to the magnetic attraction between the grains. The SEM image of MST-TiO2, Fe3O4 in Figure 3c shows that the smooth surface of MST-TiO2 turned rough after Fe3O4 nanoparticles were loaded on it; meanwhile, Figure 3d obviously shows that the Fe3O4 nanoparticles have good dispersity on MST-TiO2 plate. From the SEM image, we randomly selected some particles of Fe3O4 and statistically determined the average primary diameter of Fe3O4 nanoparticles to be 30∼50 nm (Figure 3d), which is much smaller than that of pure Fe3O4 nanoparticles (Figure 3b), and the image changed from nearly spherical polyhedron to cubic shape. This indicated that the assembling of Fe3O4 nanoparticles on MST-TiO2 nanosheets can inhibit the growth of Fe3O4 particles, which is conducive to the formation of smaller particles of Fe3O4 during the crystallization process and has a certain dispersion effect.
Figure 3. SEM of (a) MST-TiO2 (b), Fe3O4 (c), and MST-TiO2/Fe3O4.
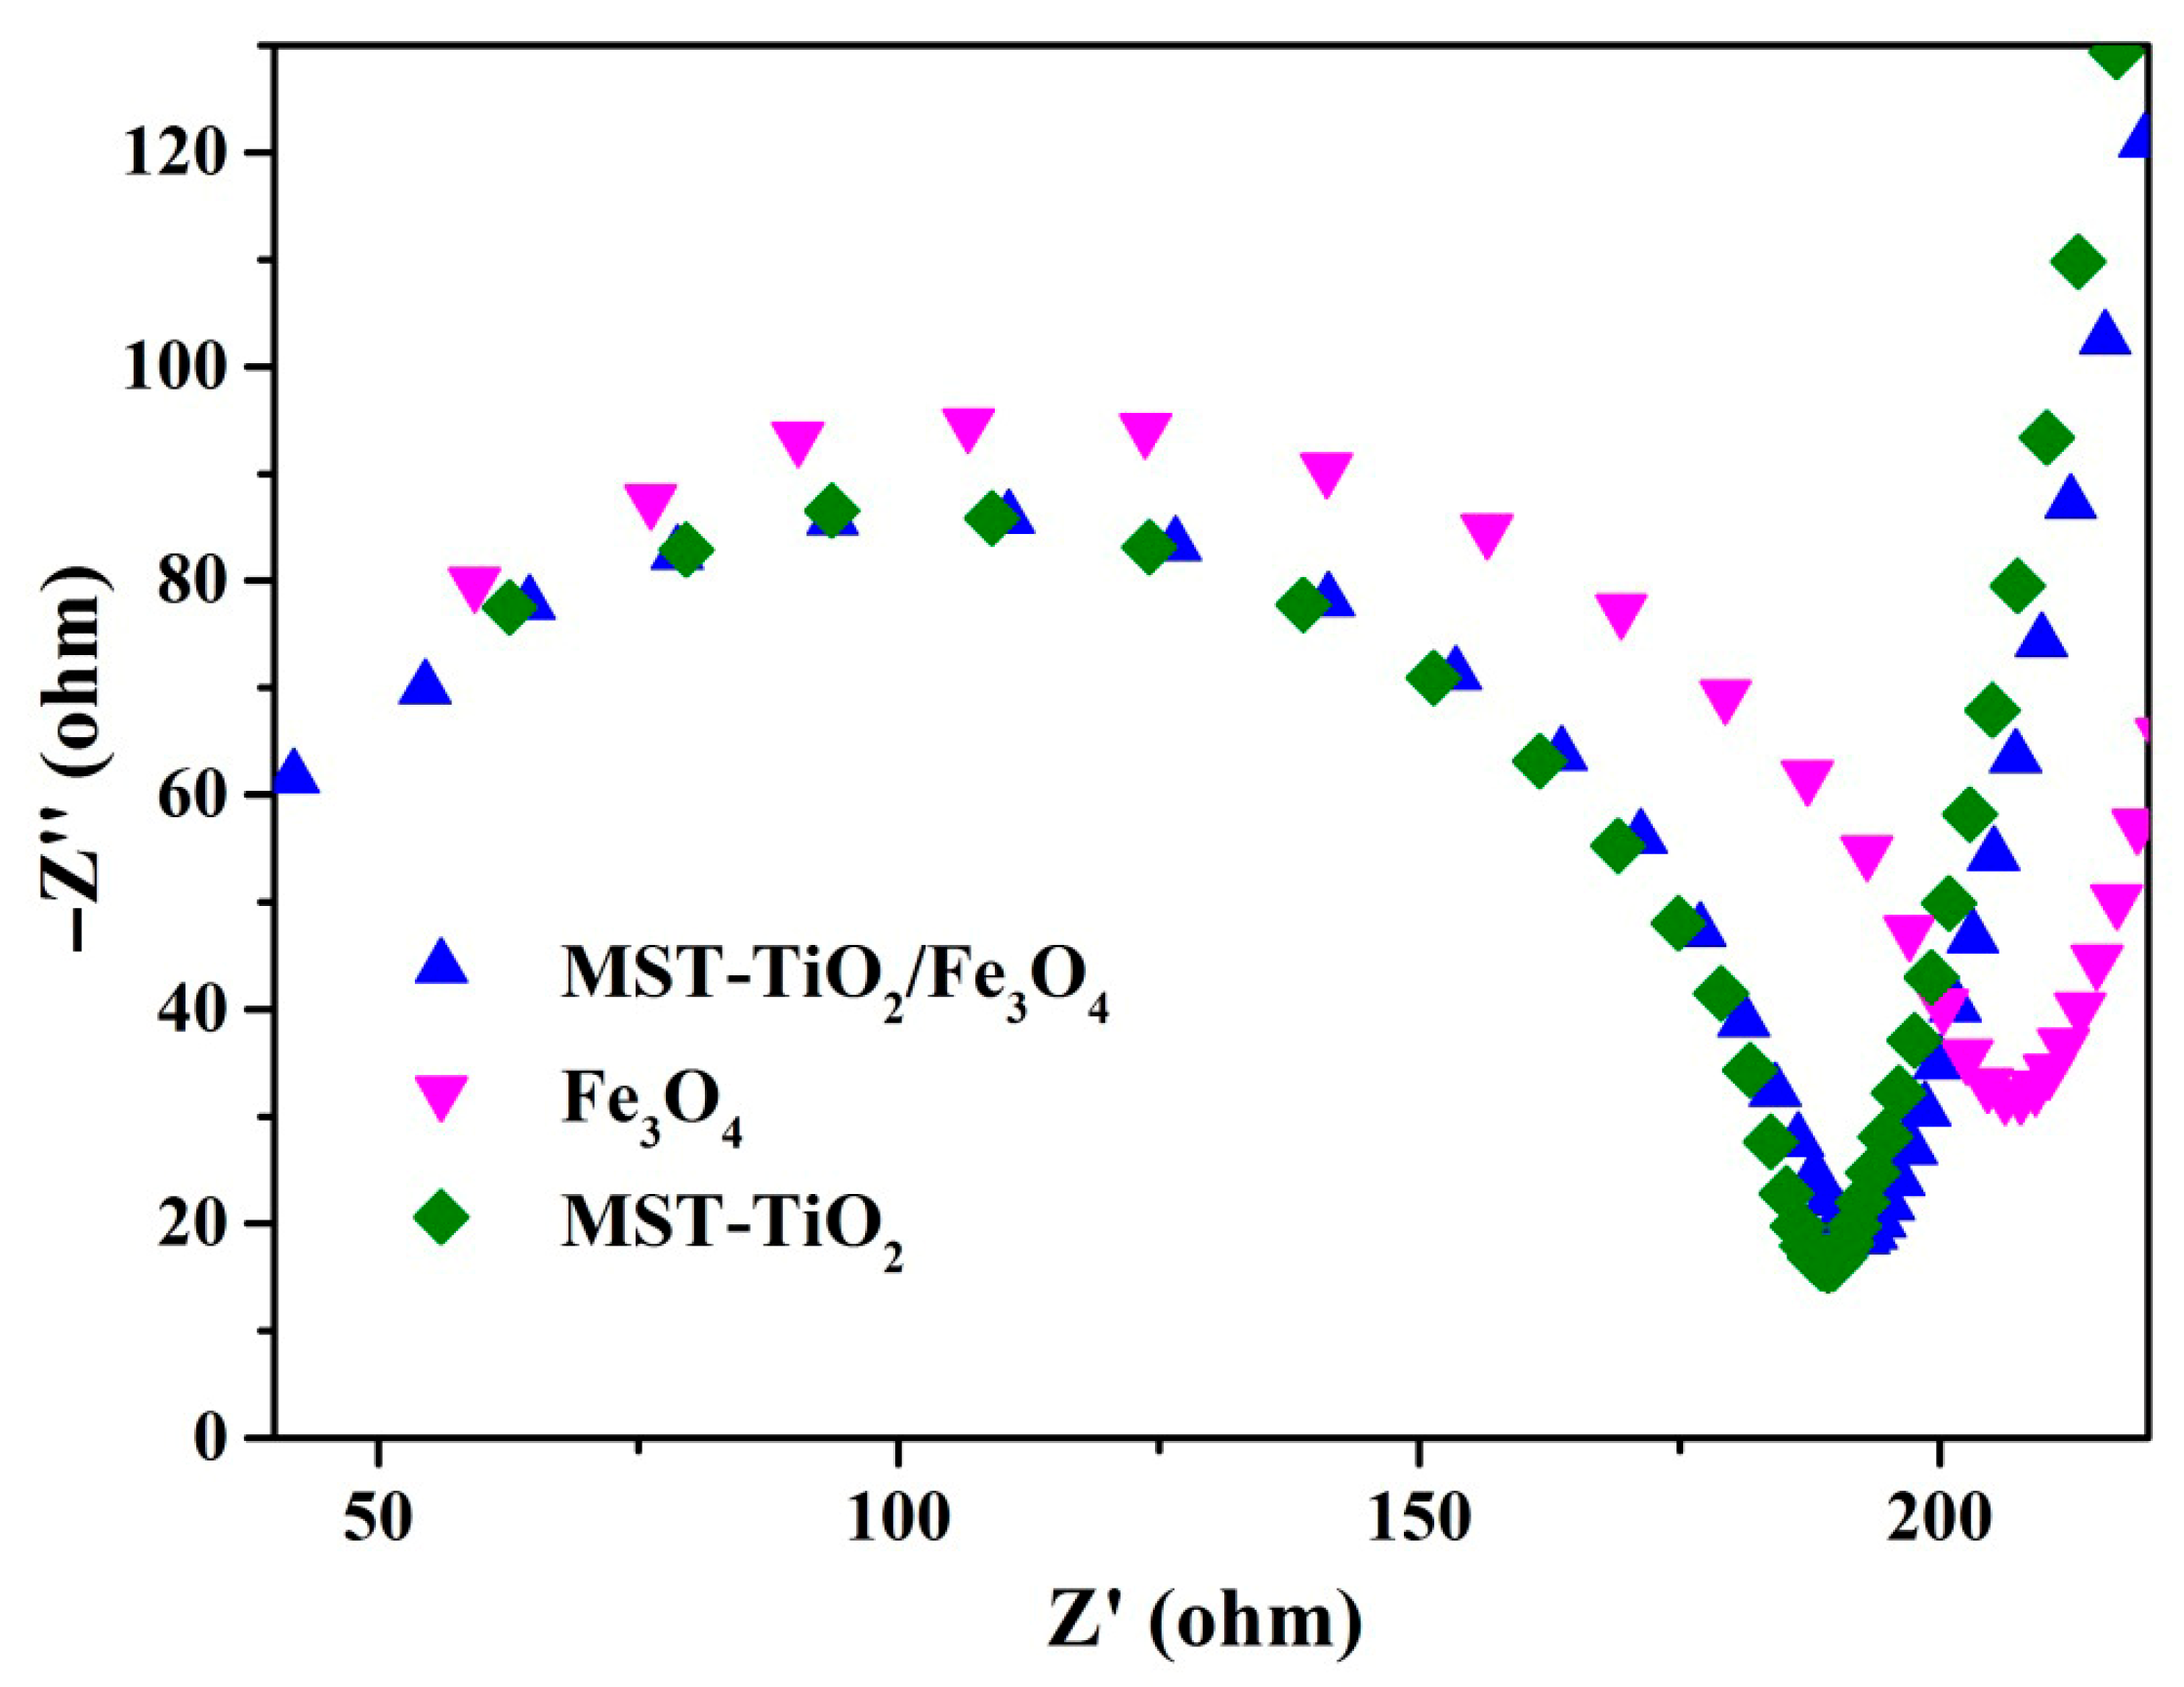
Furthermore, the electrochemical impedance spectrum (EIS) is employed to investigate the separation efficiency of the photo-excited charge carriers. A smaller impedance arc radius on the EIS Nyquist plot indicates a smaller electric resistance of the electrode [,]. Figure 4 shows the Nyquist curves of MST-TiO2, Fe3O4 and MST-TiO2/Fe3O4. The impedance arc radius for MST-TiO2 and MST-TiO2/Fe3O4 are much smaller than Fe3O4 from Figure 4. This implies a faster surface reaction rate with better charge transfer of MST-TiO2/Fe3O4. For the UV–Fenton system, it can promote the conversion between Fe3+ and Fe2+, thereby improving catalytic reaction activity.
Figure 4. The EIS plots of MST-TiO2/Fe3O4, MST-TiO2 and Fe3O4 catalysts.
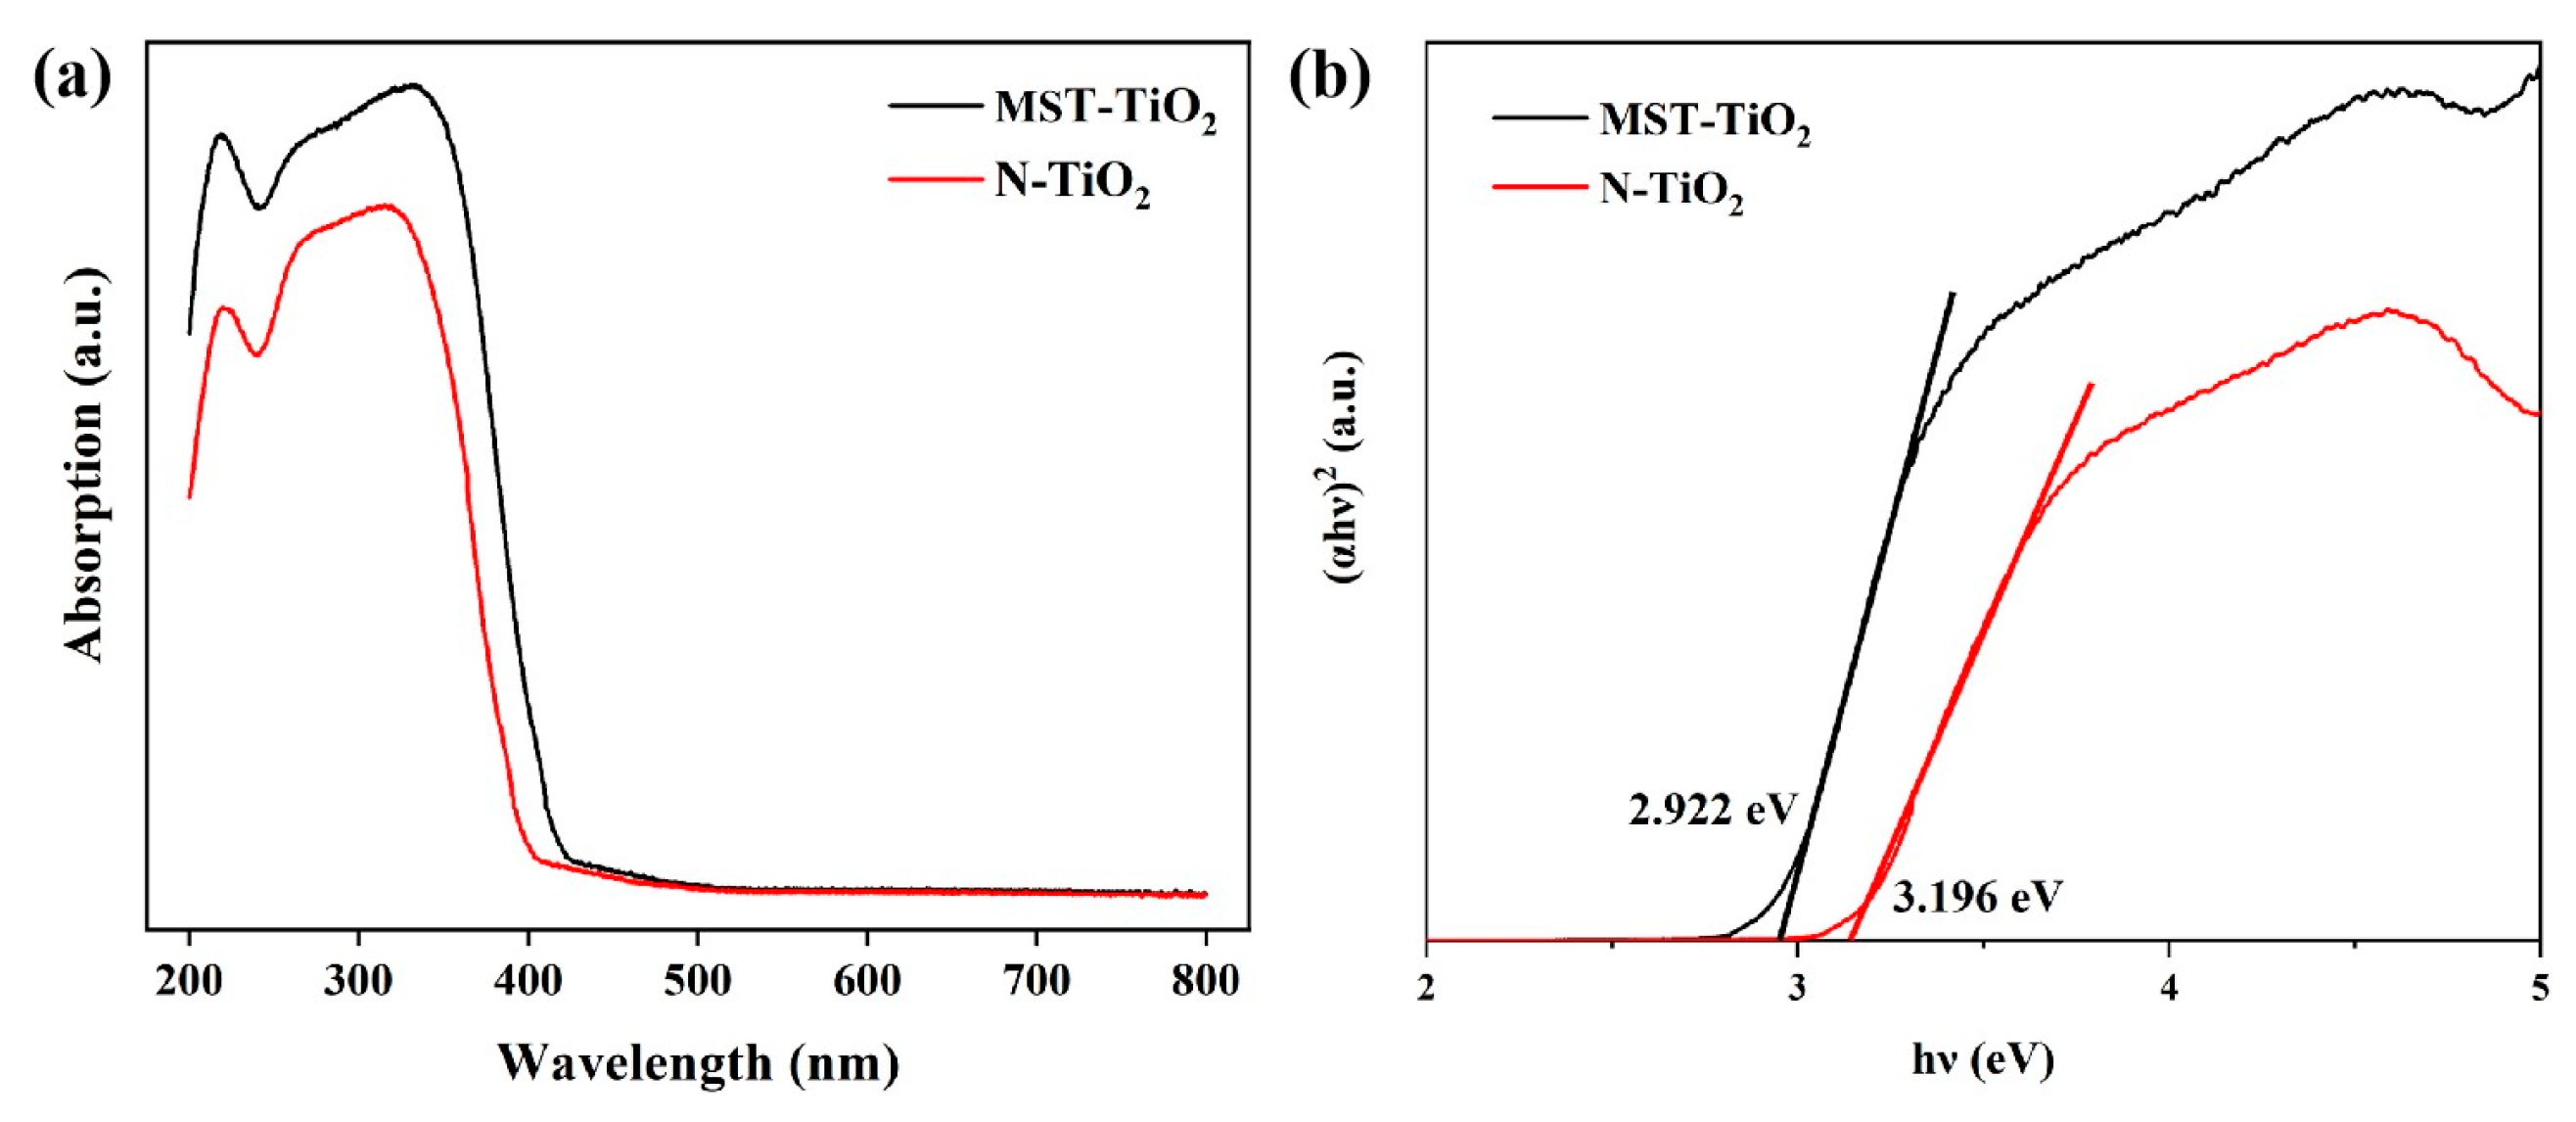
The ultraviolet and visible light absorption wavelengths of photocatalytic materials are key characteristics. Figure 5 shows the UV-vis diffuse reflectance spectra of the prepared MST-TiO2 and template-free TiO2 (N-TiO2) across the 200 nm–800 nm wavelength range. As shown in Figure 5a, MST-TiO2 and N-TiO2 exhibit remarkably similar absorption spectra, both demonstrating strong absorption in the ultraviolet region (λ < 400 nm). This is primarily attributed to the bandgap energy (3.2 eV) excitation of the anatase TiO2. The figure indicates that the absorption edge of the N-TiO2 sample is approximately 387.96 nm, while that of MST-TiO2 is red-shifted to 424.35 nm. The bandgap width of a semiconductor catalyst influences its absorption edge. As shown in Figure 5b, the Kubelka–Munk equation yields bandgap widths of 2.922 eV and 3.196 eV for MST-TiO2 and N-TiO2, respectively. The trend in bandgap width changes and aligns with that of the absorption edge. Specifically, as the bandgap width decreases, the absorption edge of the sample shifts toward the red end of the spectrum, thereby extending its visible light absorption capability. This indicates that elemental doping (e.g., C element) in the straw template effectively modifies the bandgap width of MST-TiO2 samples, enhancing their photoresponsivity.
Figure 5. UV-vis diffuse reflectance spectra of MST-TiO2 and N-TiO2 catalysts. (a) UV–vis DRS spectra, (b) Bandgap width.

3.2. UV–Fenton Catalytic Activity for the Degradation of TC

3.2.1. The Degradation Performance of TC in Different Reaction Systems

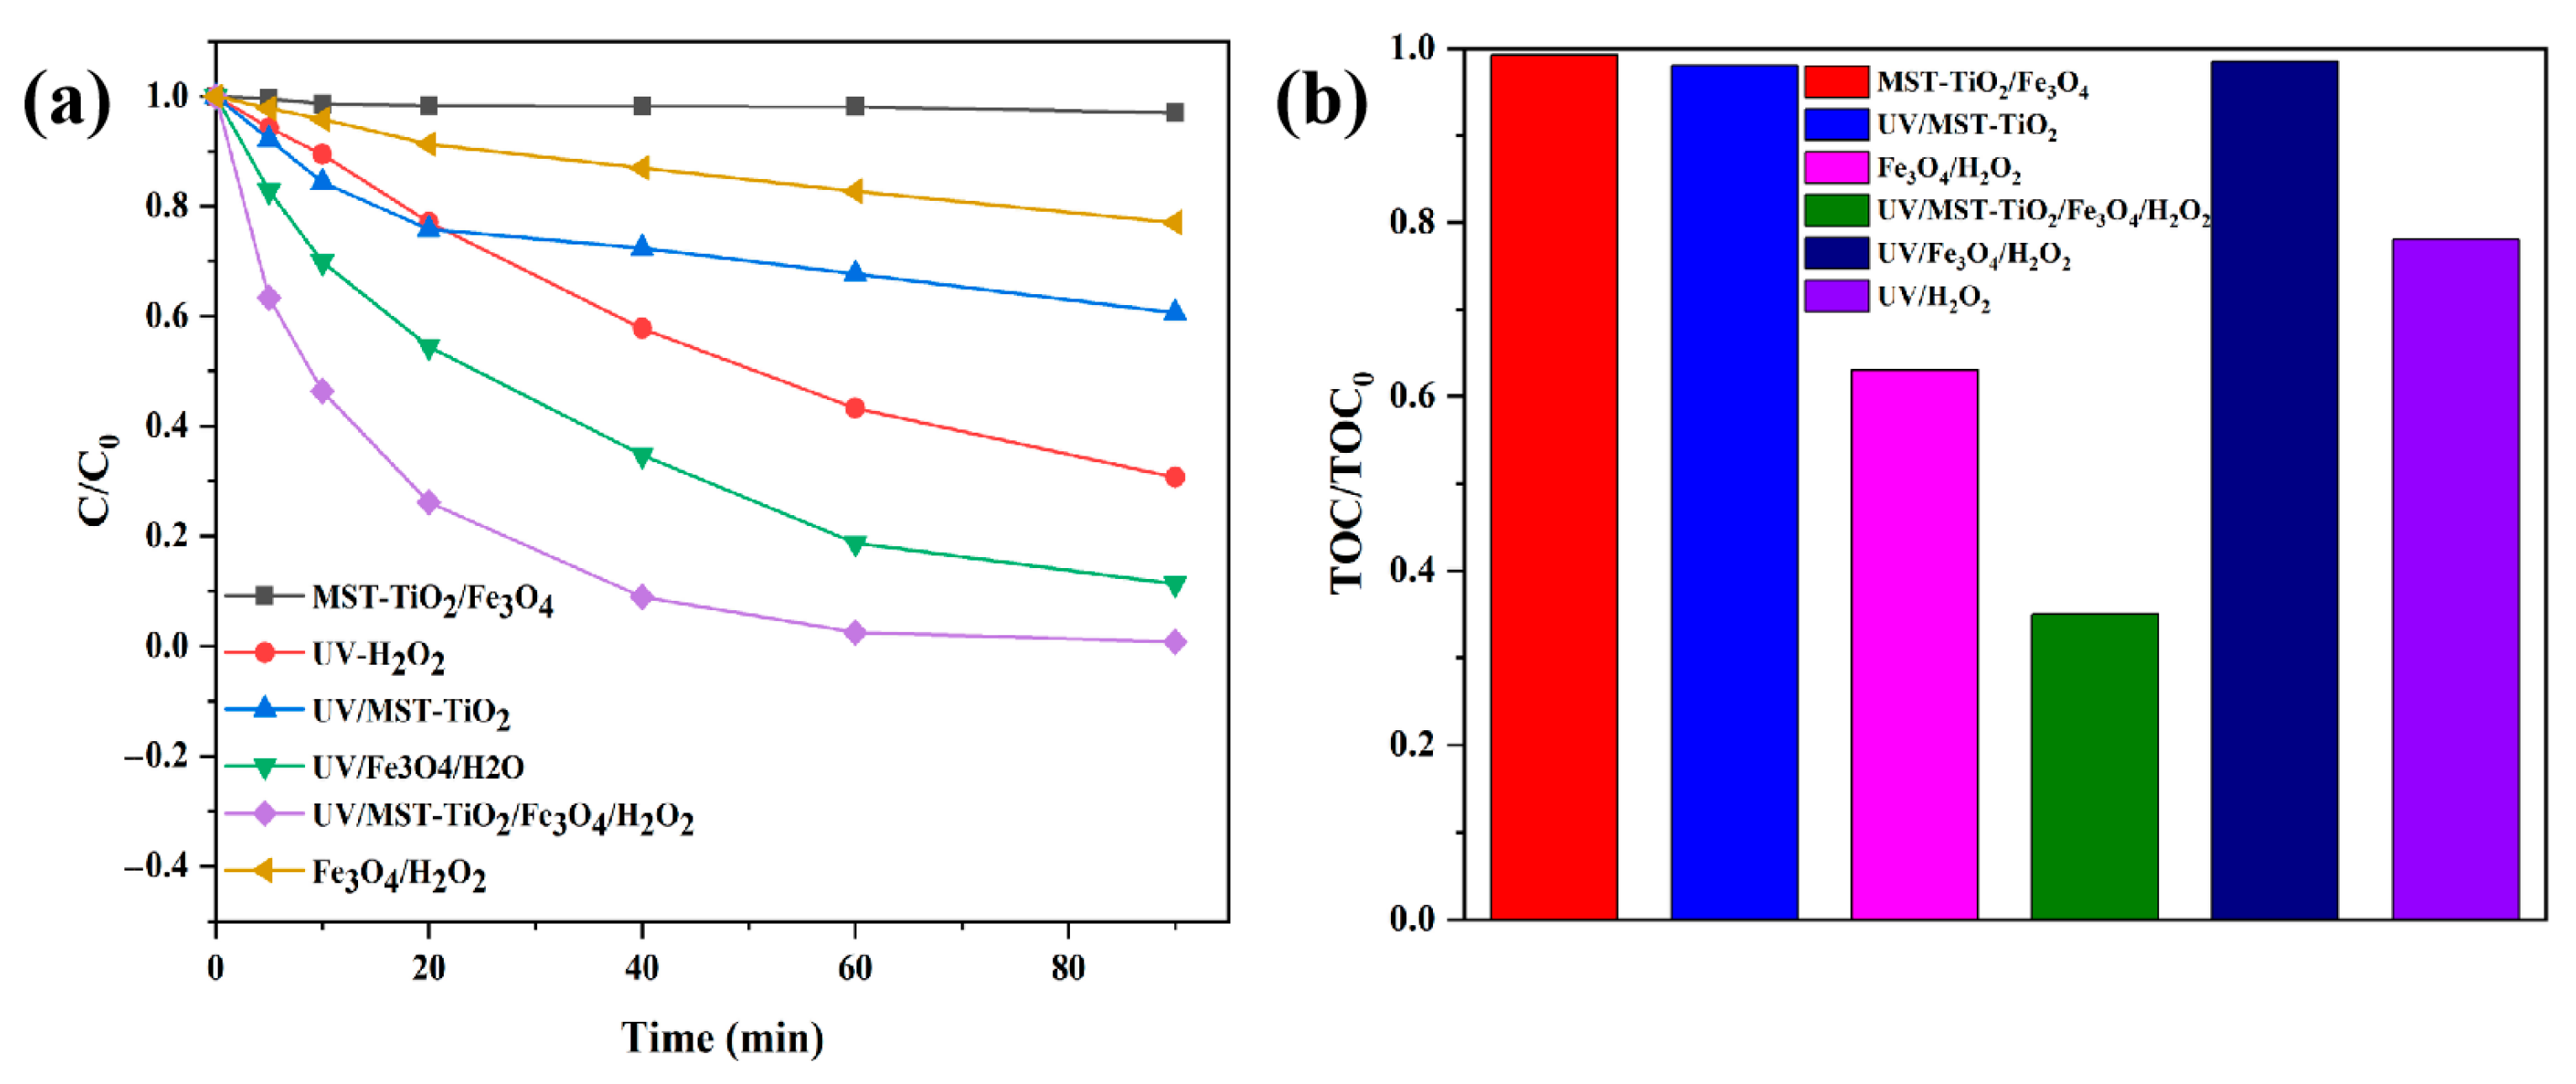
To validate the UV–Fenton catalytic activity of the samples, several advanced oxidation experiments were performed for TC degradation and mineralization under various conditions (Figure 6a,b). Under dark conditions, it appeared that approximately 5% TC (negligible TOC removal rate) could adsorb to the surface of MST-TiO2/Fe3O4 in 90 min. The degradation rate of TC in the UV/H2O2 system after 90 min was 69.34%. Additionally, in the absence of H2O2, the activity of UV/MST-TiO2 under UV light irradiation had weak ability in terms of catalytic degradation and mineralization of TC under the tested conditions. It is, however, not surprising that Fe3O4/H2O2 without UV irradiation led to a slight TC degradation of 20% after 90 min (1.8% for TOC removal rate in 2 h). Once UV–Fenton catalysts were introduced, degradation of TC obviously increased, and faster TC degradation contributed to faster ·OH production from the reaction between H2O2 and UV–Fenton catalysts. As for pure Fe3O4, approximately 89.2% degradation of TC occurred after 90 min and when 37.5% TOC removal rate in 2 h was reached. As for the UV/MST-TiO2/Fe3O4/H2O2 system, when compared with pure Fe3O4, the content of Fe3O4 was less under the same catalyst dosage, but the TC tended to be almost completely degraded after 60 min of reaction, and the mineralization rate was 63.5% after 120 min. In contrast, the removal rate of UV/Fe3O4/H2O2 system was only 79.8% after 60 min of reaction. This indicates that the MST-TiO2/Fe3O4 formed after the introduction of TiO2 can greatly enhance the catalytic activity of the UV–Fenton system.
Figure 6. Degradation effect of tetracycline under different reactions. (a) Degradation efficiency and (b) mineralization. Experimental conditions: initial pH = 7.0, [catalyst]0 = 0.3 g/L, [H2O2]0 = 10 mM, [TC]0 = 50 mg/L and T = 25 ± 1 °C.

3.2.2. H2O2 Consumption

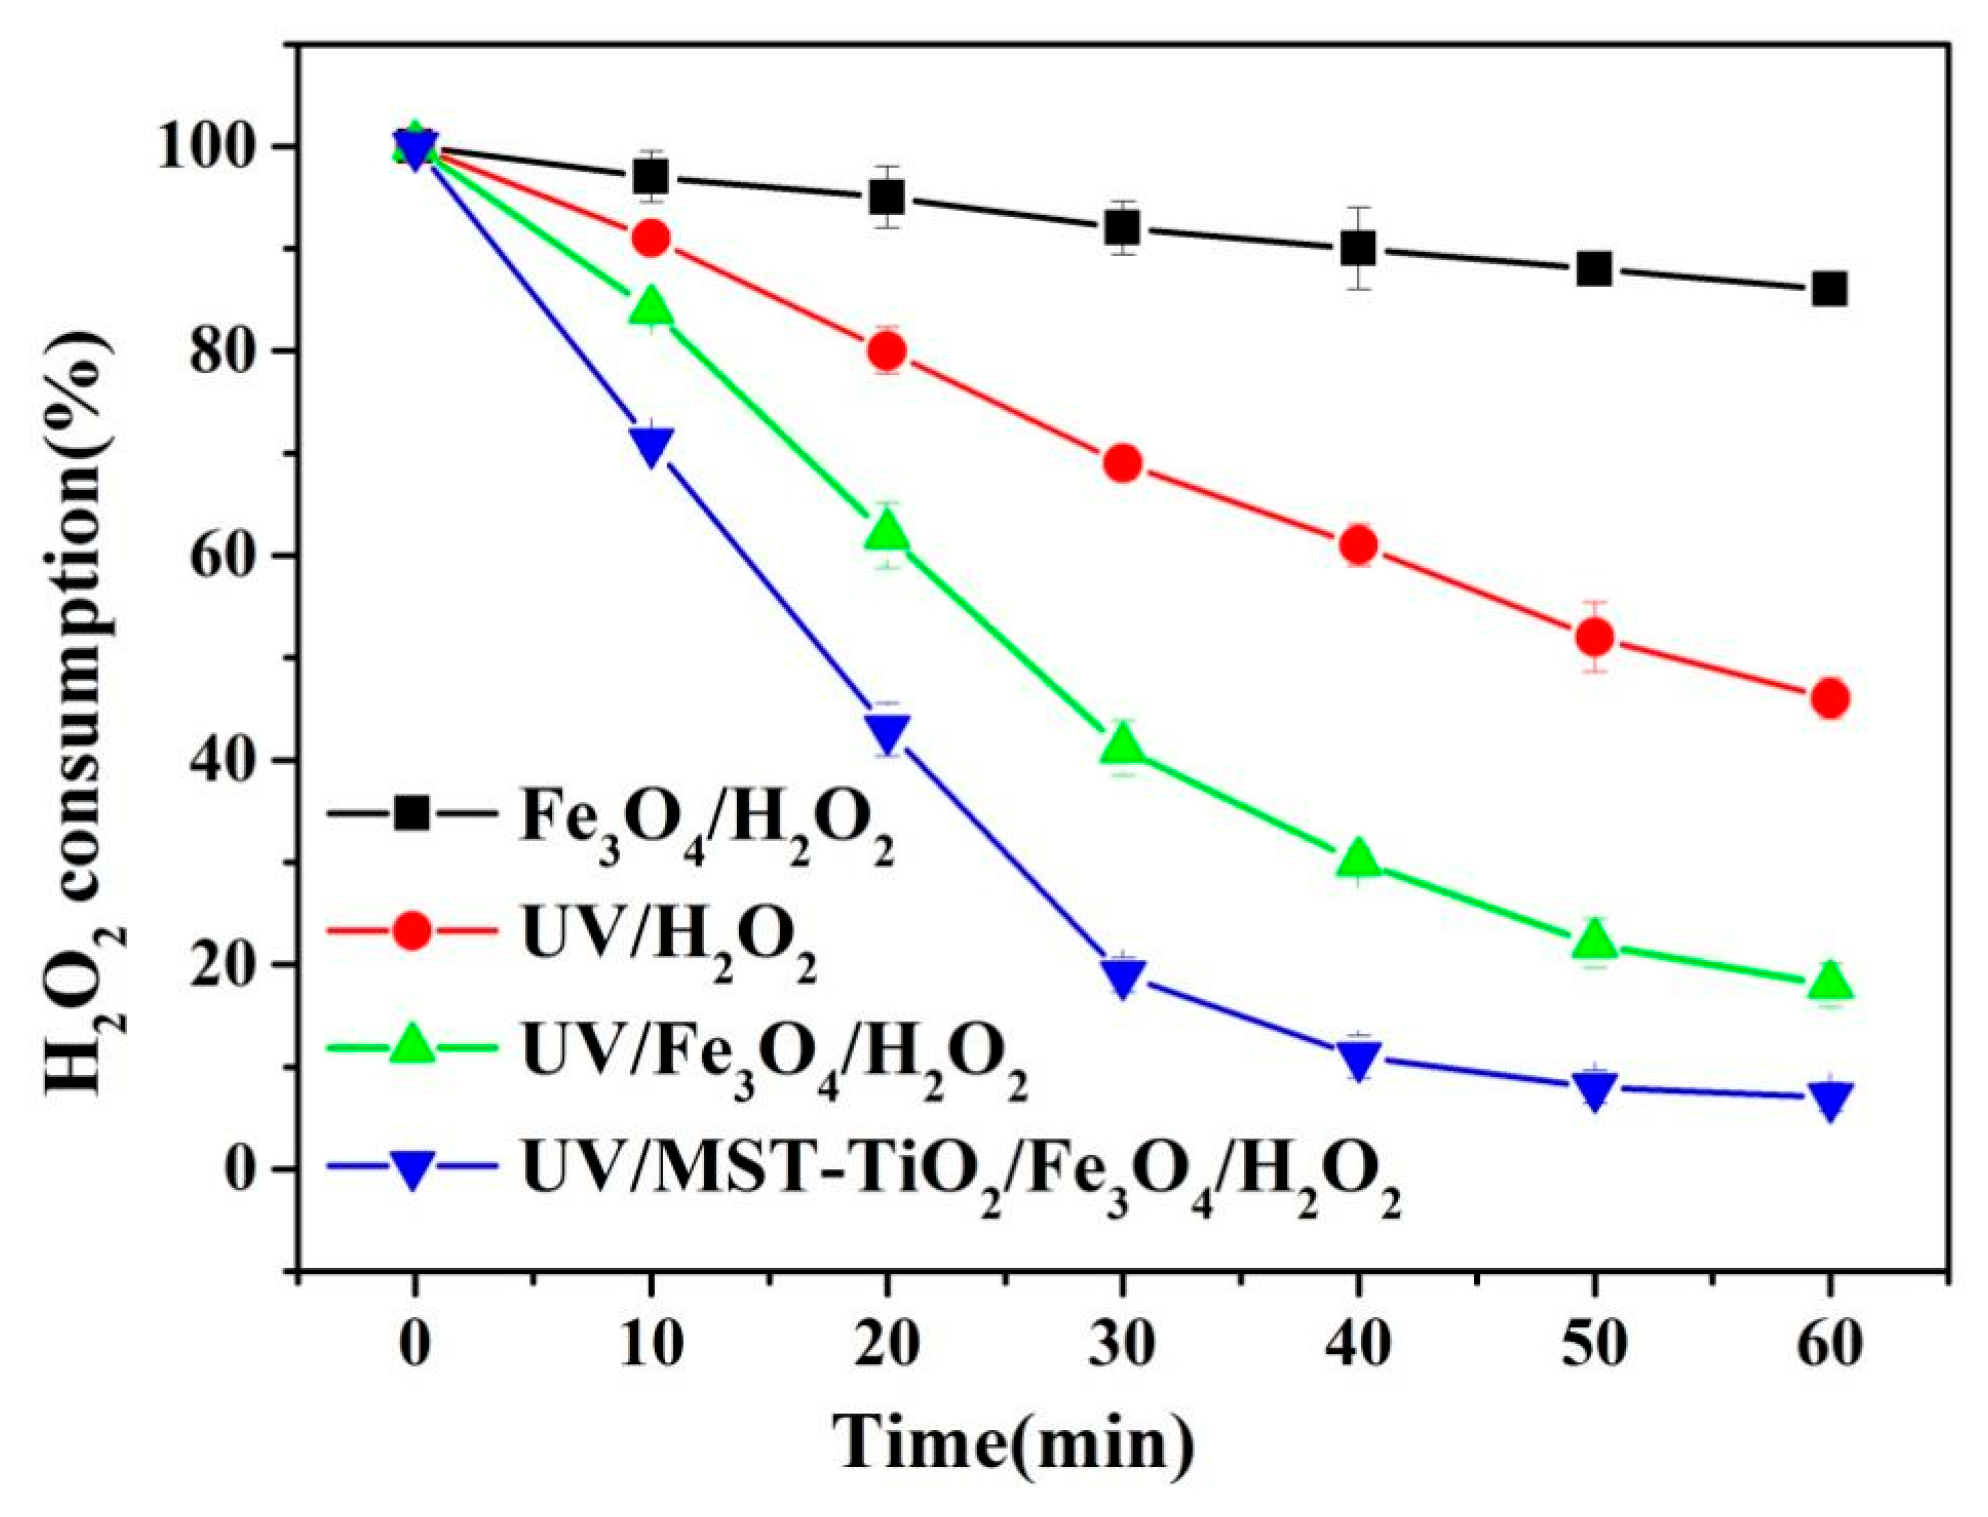
It is well known that H2O2 is the oxidant in Fenton reaction, and the study of H2O2 consumption is essential to evaluate UV–Fenton catalytic efficiency. Figure 7 depicts the consumption of H2O2 by samples as a function of reaction time under various conditions. As seen from Figure 6, the consumption of H2O2 in the multiphase Fenton system catalyzed by Fe3O4 with no light irradiation under neutral conditions is extremely low, and the decomposition rate of H2O2 at 60 min of the reaction is 14.1%. While in the UV/H2O2 system, the decomposition rate of H2O2 was slightly increased, and the decomposition rate was 54.2% at 60 min of the reaction. When Fe3O4 was introduced, the decomposition rate of H2O2 in the multiphase UV–Fenton system increased rapidly, and the decomposition rate at 60 min of the reaction increased to 82.4%. With the introduction of MST-TiO2/Fe3O4, the decomposition rate of H2O2 was further increased to 92.9%. This result is consistent with the degradation effect test of TC, and the main reason for this is that TiO2 transfers photogenerated electrons to Fe3+ on the surface of Fe3O4 to promote its conversion to Fe2+, thus indirectly accelerating the rate of Fenton reaction, which results in the increase in the decomposition rate of H2O2.
Figure 7. H2O2 consumption under different processes. Experimental conditions: initial pH = 7.0, [catalyst]0 = 0.3 g/L, [H2O2]0 = 10 mM, [TC]0 = 50 mg/L and T = 25 ± 1 °C.

3.2.3. Leaching of Fe Ions

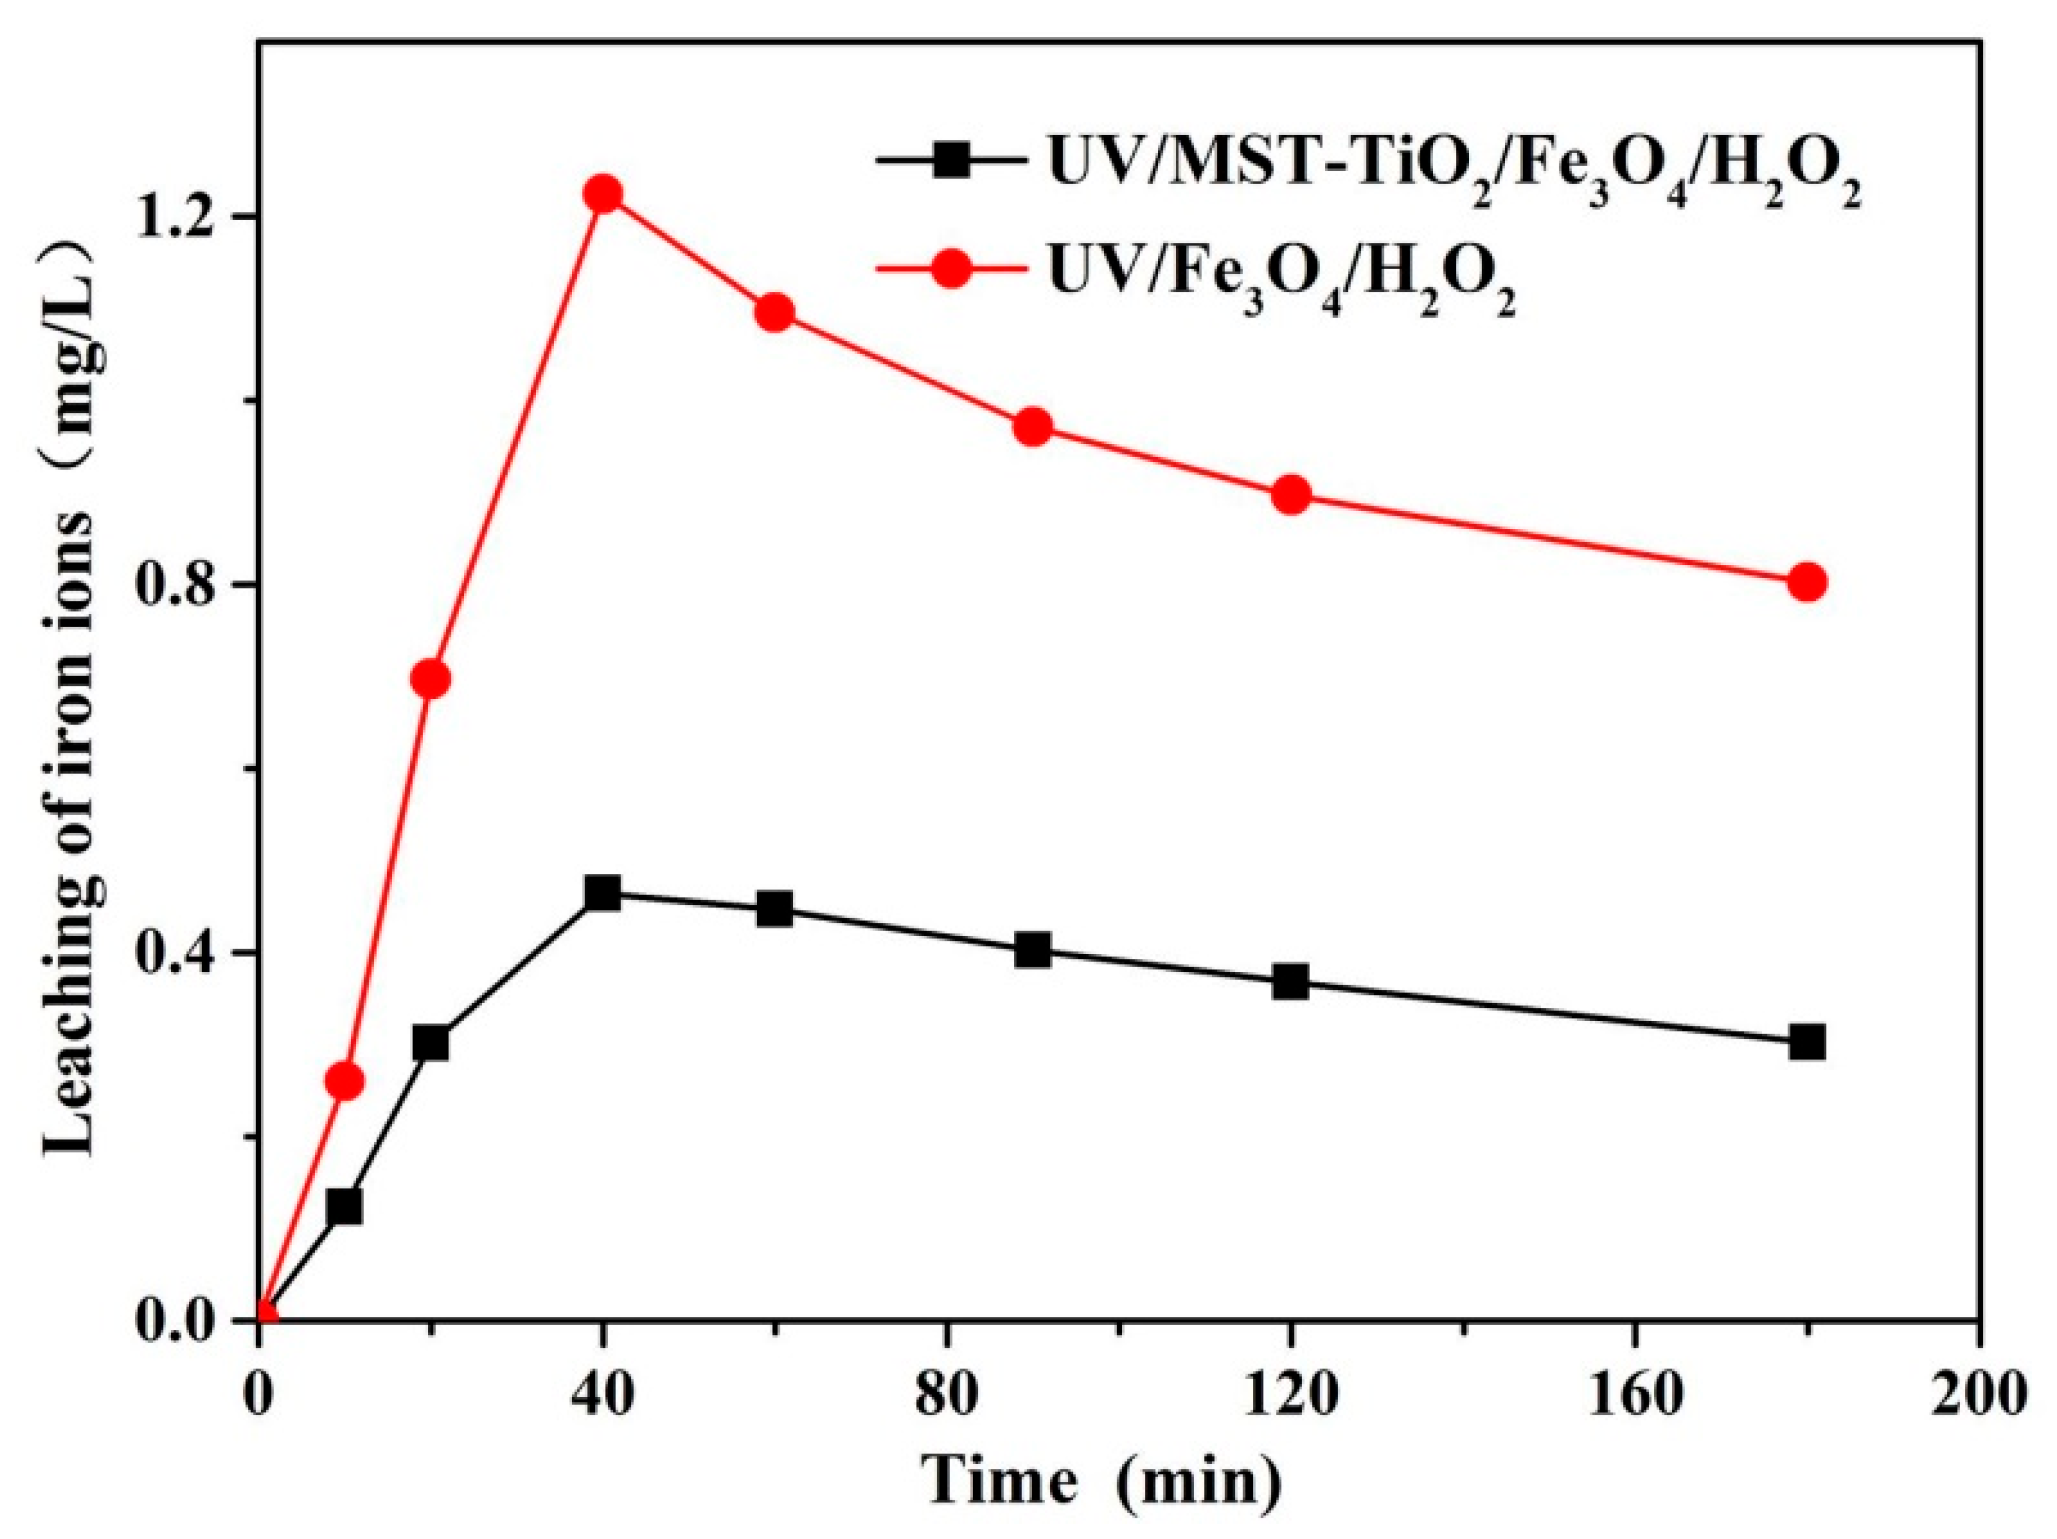
The leaching of active components is an important indicator to examine the stability of catalysts, so the changes in Fe ions in UV/MST-TiO2/Fe3O4/H2O2 and UV/Fe3O4/H2O2 systems were investigated, and the results are shown in Figure 8. As seen from Figure 8, the concentration of Fe ions in both UV/MST-TiO2/Fe3O4/H2O2 and UV/Fe3O4/H2O2 systems showed a trend of first increasing and then decreasing with an increase in reaction time. It is mainly because the Fe ions on the catalyst surface will be captured by the intermediate metabolites of TC degradation and form complexes, which will be free in the solution, thus making the concentration of leached Fe ions in the system increase. However, as the reaction time continues to increase, the complexes of intermediate metabolites and Fe ions will be gradually mineralized to CO2 and H2O, while Fe ions will be released. Therefore, the leaching amount of Fe ions showed a trend of increasing and then decreasing during the reaction. In addition, the amount of Fe ions leached in both reaction systems is relatively small, with the highest leaching amounts being 0.46 mg/L and 1.23 mg/L, respectively, whereas the amount of Fe ions required in a typical homogeneous Fenton reaction is tens to hundreds of mg per liter [,], indicating that the degradation of TC in both reaction systems is caused by non-homogeneous Fenton. In addition, the figure shows that Fe-ion concentration in the UV/MST-TiO2/Fe3O4/H2O2 system is always lower than that in the UV/Fe3O4/H2O2 system during the reaction, and the residual Fe-ion concentration in the system after 180 min was 0.3 mg/L (0.42% by weight) and 0.81 mg/L (0.48% by weight), respectively. From the results, it can be concluded that the introduction of TiO2 can improve the stability of MST-TiO2/Fe3O4 composite catalyst.
Figure 8. Fe-leaching amount of UV/MST-TiO2/Fe3O4/H2O2 and UV/Fe3O4/H2O2 in the solution. Experimental conditions: initial pH = 7.0, [catalyst]0 = 0.3 g/L, [H2O2]0 = 10 mM, [TC]0 = 50 mg/L and T = 25 ± 1 °C.

3.2.4. Effect of Single-Factor on TC Oxidation in MST-TiO2/Fe3O4-Catalyzing UV–Fenton

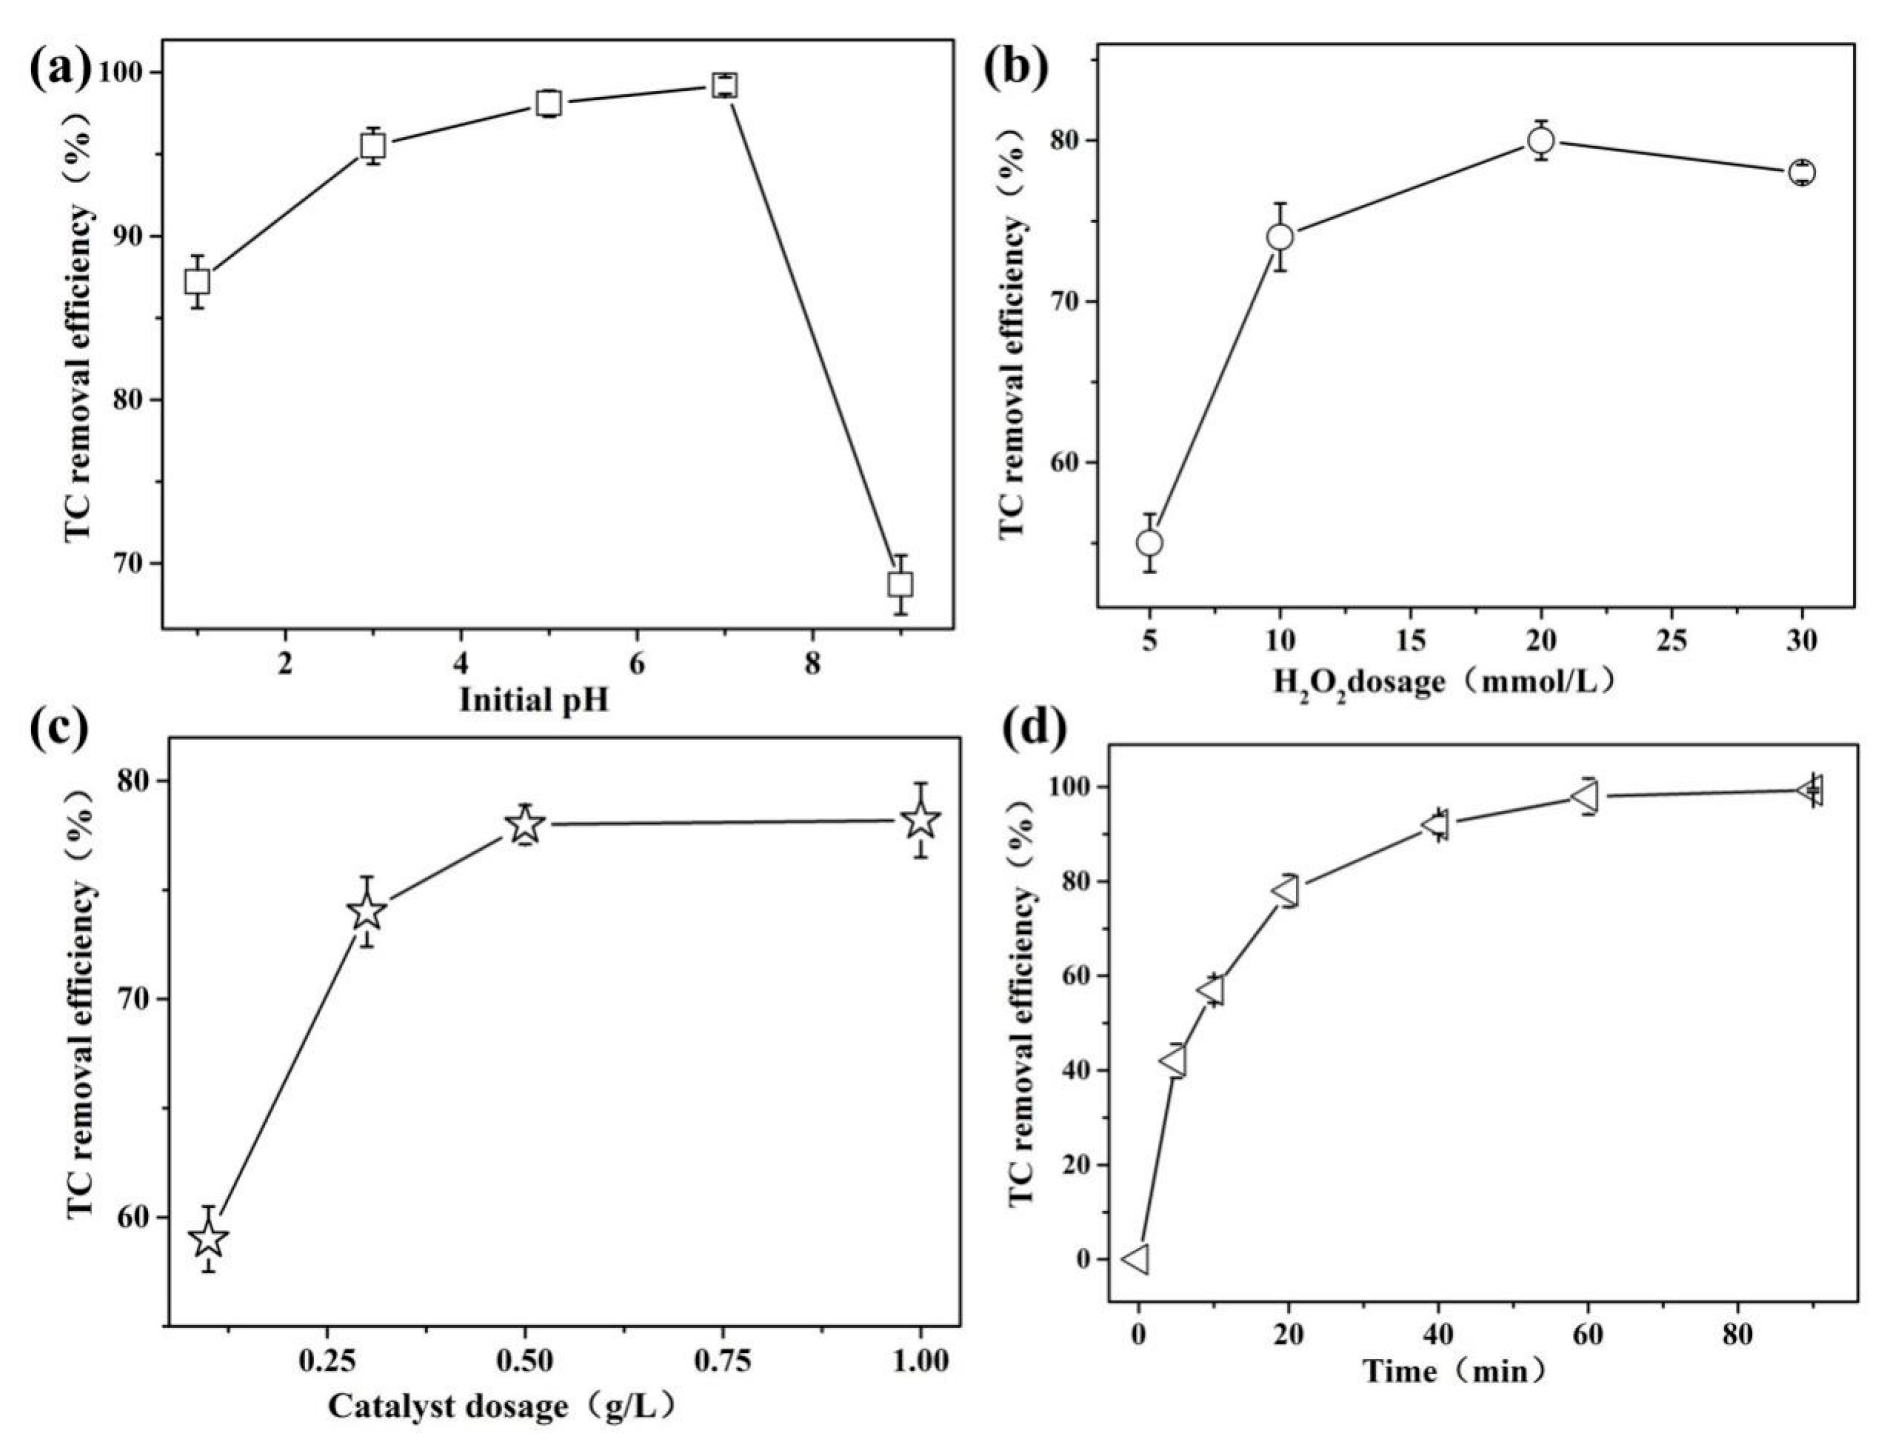
The solution pH of a Fenton reaction is a crucial factor, so the effect of initial pH from 3.0 to 9.0 on TC oxidation by MST-TiO2/Fe3O4-catalyzing UV–Fenton was studied and the results are presented in Figure 9a. At the initial pH values of 1.0, 3.0, 5.0, 7.0, and 9.0, the degradation rate of TC followed a trend of increasing and then decreasing with the increase in pH, and the removal rates were 87.2%, 95.5%, 98.1%, 99.2%, and 68.7%, respectively. Although the catalysts are effective in the pH range of 1 to 9, the most suitable pH range is from 3.0 to 7.0, with the highest degradation rate at pH 7.0 (99.2%). It can therefore be interpreted that pH affects the catalyst activity and the Fenton-like synergistic reaction mainly due to the generation of free radicals, especially •OH, and the adsorption properties of the catalyst on TC. On the one hand, the rate-limiting step in the Fenton-like system is the Fe3+/Fe2+ cycle, so it is especially important to accelerate the conversion of Fe3+ to Fe2+. When the pH is too low, there is a large amount of H+ in the solution, so the reduction of Fe3+ to Fe2+ (Equations (2) and (3)) can be inhibited. Moreover, the excess H+ is trapped by H2O2 in the system to produce stable H3O2+ (Equation (4)). In addition, •OH is scavenged by H+ and e (Equation (5)). This explains the superior oxidation capacity in the UV–Fenton system at pH 5.0 and 7.0 compared to pH 3.0. But when the pH is too high, it will affect the •OH formation in Equation (1), while Fe3+ will precipitate as hydroxides and reduce the catalytic performance, and the colloid formed will also hinder the penetration of light. On the other hand, the pH also affects the charge on the surface of TiO2 and its photoexcitation properties []. The isoelectric point of TiO2 in water is approximately 6.5 []. When the pH is low, the surface of TiO2 has a positive charge dominated by H+, and it has a negative charge dominated by OH at high pH [], and when the pH is 7.0 the TiO2 surface has a small amount of negative charge. Under medium and acidic conditions, TC is positively charged in cationic form; and TiO2, with a small amount of negative surface charge, will have a positive effect on the adsorption of TC. In contrast, under alkaline conditions, TC is negatively charged and TiO2 also has a large amount of negative charge on its surface, which is not favorable for adsorption []. Theoretically, the best adsorption performance of TiO2 on TC is achieved at pH 6.5∼7.0. The mechanism of TiO2 photocatalysis is the reaction of h+ with H2O to form •OH (Equation (4)), but this reaction is only effective when it is transported to the catalyst surface. Acidic conditions are not conducive to the reaction of h+ with H2O and reduce the transport of h+. At pH 7, the TiO2 surface is almost free of H+ and other positive charges and thus does not affect h+ transport. A small amount of OH promotes the production of •OH (Equation (5)) and does not unduly affect the production and transport of photogenerated e.
Fe2+ + H2O2 → Fe3+ + •OH + OH
Fe3+ + H2O2 → •HO2 + Fe2+ + H+
Fe 3 +   +   H 2 O   +   h ν     Fe 2 +   +   OH   +   H +
h+ + H2O → •OH + H+
h+ + OH → •OH
H2O2 + H+ → H3O2
•OH + e + H+ → H2O
Figure 9. Effect of different parameters on the removal rate of tetracycline: (a) initial pH, (b) H2O2 dosage, (c) catalyst dosage, and (d) reaction time on the removal of TC.
Figure 9b shows the effect of H2O2 dosage on the UV–Fenton reaction with MST-TiO2/Fe3O4. When the dosage of H2O2 was 5 mM, 10 mM and 20 mM, the removal rates of TC were 55.2%, 74.1% and 79.9%, respectively. In contrast, the removal rate of TC decreased slightly (77.9%) when the H2O2 dosage was increased to 30 mM. This is because within a certain dosage range, the more H2O2 is added, the more •OH is generated and the greater the oxidation efficiency. However, when the dosage of H2O2 is too high, it intensifies the side reaction of quenching •OH by H2O2 (Equations (1)–(3)), which decreases the degradation efficiency [,].
Figure 9c shows the effect of catalyst dosage on UV–Fenton reaction. It can be seen from the figure that the increase in the dosage of MST-TiO2/Fe3O4 from 0.1 g/L to 0.5 g/L can significantly improve the removal rate of TC, because the increase in catalyst dosage also increases the area of Fenton reaction, which increases the active sites on the catalyst surface and in turn increases the yield of •OH []. However, the increase in TC removal was not significant as the catalyst dosage continued to increase, because the amount of H2O2 became a limiting factor for the reaction when the catalyst concentration reached saturation. On the other hand, there are some negative effects of high doses of the catalyst, such as nanoparticle agglomeration and scattering effects on light [].
Figure 9d shows the influence of reaction time on the degradation rate of TC. The degradation of TC went through two different phases: fast degradation phase (0–20 min); slow degradation phase (20–90 min). The reaction at 60 min basically reached the maximum TC removal rate.

3.2.5. Effect of Initial TC Concentration

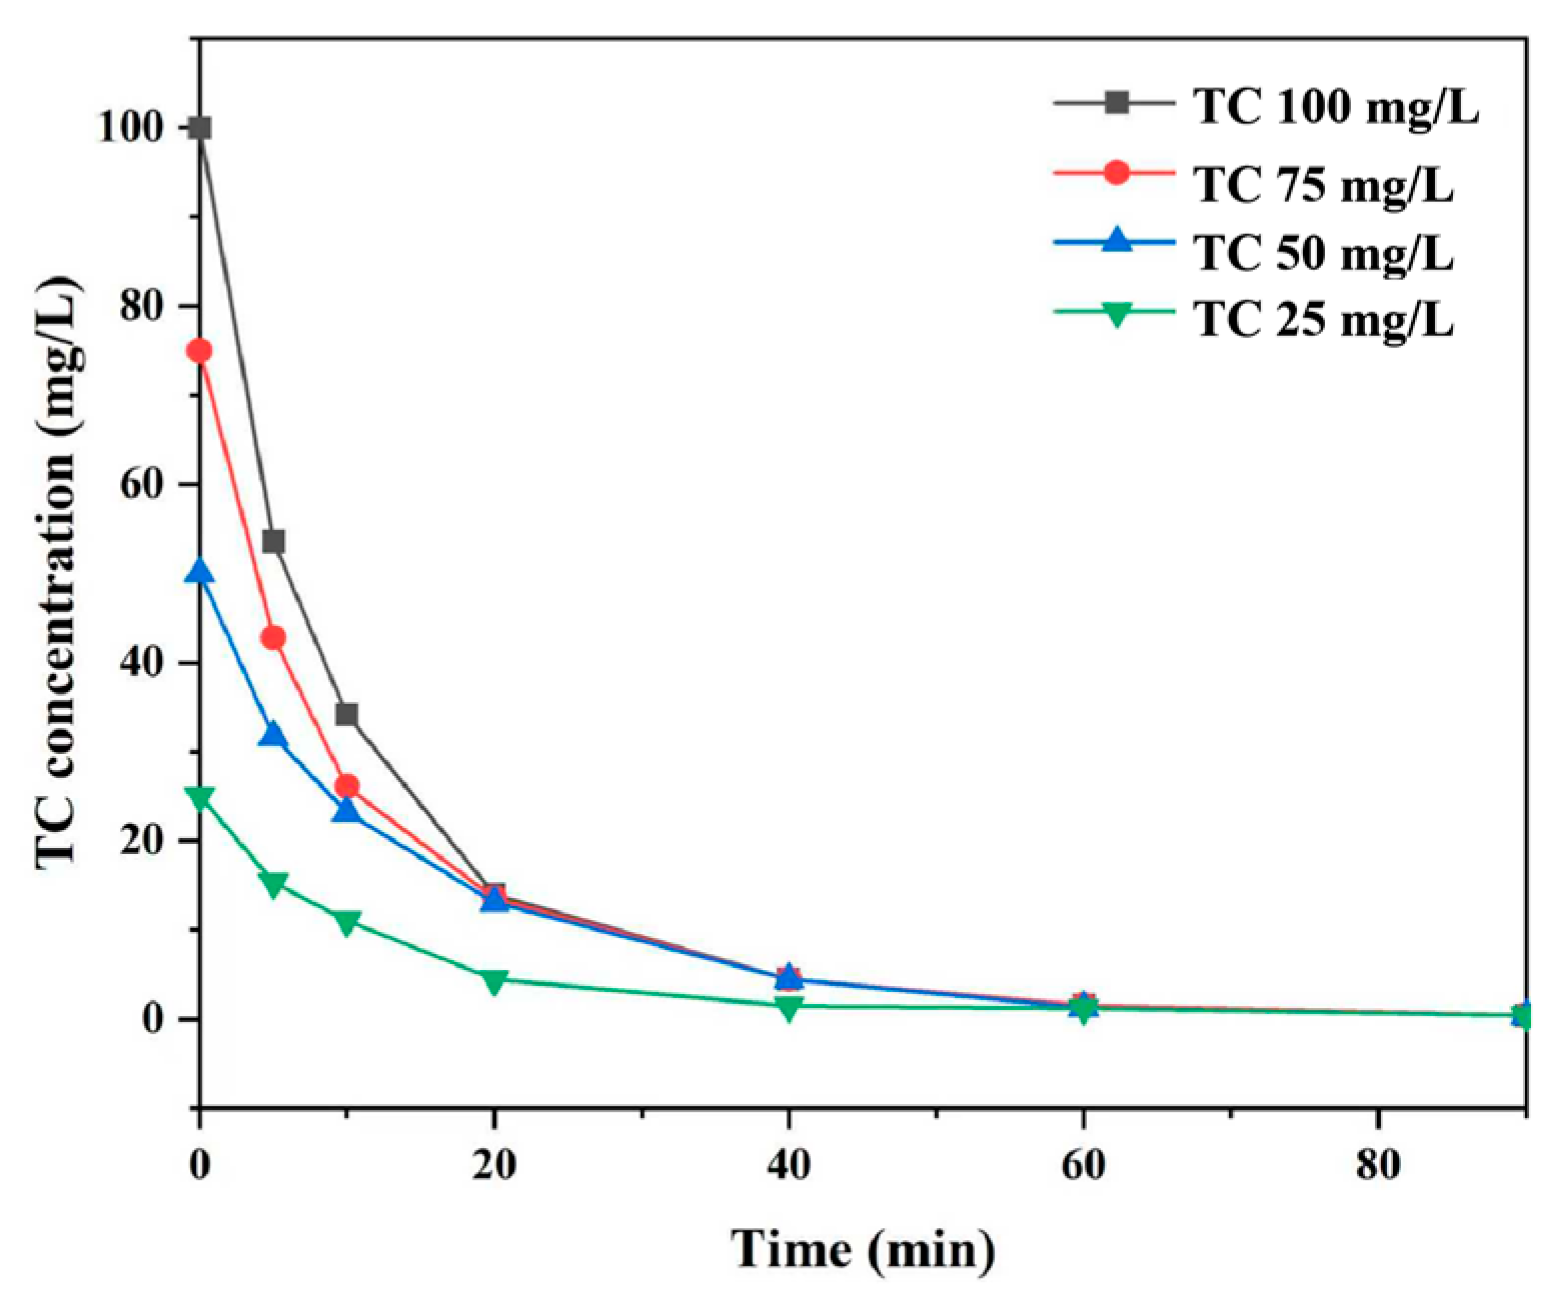
The effect of initial TC concentration on its degradation rate was investigated. As shown in Figure 10. Under identical reaction conditions, increasing the TC concentration from 25 mg/L to 100 mg/L resulted in removal rates consistently exceeding 90% after the reaction commenced.
Figure 10. Effect of initial concentration on degradation. Experimental conditions: initial pH = 7.0, [catalyst]0 = 0.3 g/L, [H2O2]0 = 10 mM and T = 25 ± 1 °C.

3.2.6. Optimization of the TC Degradation Using RSM

RSM is an accumulation of a statistical and mathematical method employed to analyze the importance of different process variables []. The Design-Expert Software (version 8.0.6) was used to analyze the simultaneous effect of initial pH, H2O2 dosage, catalyst dosage, and the reaction time in the UV–Fenton degradation process. It is also used to evaluate the interactions between the studied variables and calculate the predicted results with the experimental design [,]. Therefore, the four factors could be identified with three levels (−1, 0, +1) (Table 1) and a series of experimental runs were designed with TC degradation efficiency as the response, as shown in Table 2.
Table 1. Factor levels for the experiment.
Table 2. Experimental design and results based on response surface methodology.
Table 2 shows the obtained actual responses (i.e., TC degradation efficiency) with respect to the 27 designed experiments. After model fitting by the software, the second-order polynomial equations for the coding factors and the actual results are shown in Equations (8) and (9), respectively, as a simultaneous function of the initial pH value (A), the H2O2 dosage (B), the catalyst dosage (C), and the reaction time (D) [].
R1 = 96.51 − 9.40A + 20.41B + 2.20C + 6.72D − 1.51AB + 0.19AC + 0.25AD − 0.99BC − 0.28BD + 0.10CD − 18.70A2 − 18.70B2 − 4.59C2 − 4.57D2
R2 = −339.6266 + 61.61688A + 20.61675B + 84.44792C + 2.85553D − 0.1505AB + 0.46875AC + 8.16667 × 10⁻³ AD − 0.9925BC − 3.73333 × 10⁻³ BD + 0.034167CD − 4.67438A2 − 0.748B2 − 114.75C2 − 0.020311D2
The analysis of variance (ANOVA) was used to identify the adequacy of the model and its importance (Table 3). The results show that the model has a high F-value of 53.83 and low p-value (less than 0.0001), indicating that the model was highly statistically significant for TC degradation []. The lack of fit p-value was 0.0595 (>0.05), indicating that the lack of fit was not significant and that model was reasonably predictable. The fit of the model was verified by the determination of coefficient (R2). The closer the R2 is to 1, the stronger the model and the better it predicts the response. For TC degradation, the coefficients and adjusted coefficients were 0.9843 and 0.9660, respectively, indicating that the model response was in good agreement with the experimental values. The coefficient of variance (C.V.) for TC degradation was 4.73%, demonstrating a high degree of precision and reliability of the model with the experimental values. In addition, the value of Adeq precision reached 25.891 (>4), which revealed that the model was well-fitting and that the-signal-to-noise ratio was satisfactory. It was also found that the p-values of the linear coefficient terms A, B, C, and D are all less than 0.05, with small p-values (p < 0.001) for A, B, and D. This indicates that each of the four factors had statistically significant changes in the response value, which is consistent with the results of the single-factor test.
Table 3. Variance analysis of regression equation.
The positive and negative signs of the model coefficients of the linear coefficients indicate that the coefficients have a facilitating or inhibiting effect on the response values, and the absolute value of the coefficients of the model coefficients of the linear coefficients indicates the degree of the facilitating or inhibiting effect of the coefficients on the response values. The order of their influence on the response values is as follows: H2O2 dosage (20.41) > initial pH (9.40) > reaction time (6.72) > catalyst dosage (2.20). It is worthy noting that under the UV–Fenton system catalyzed by MST-TiO2/Fe3O4 with the experimental set parameters, H2O2 dosage can change the TC degradation effect by influencing the reaction between Fe2+ and H2O2 and the photolysis of H2O2, and then the generation of •OH, so the precise and strict control of H2O2 dosage is more important. In addition, the pH of the system not only determines the redox potential of •OH, but also affects the surface electrical and adsorption properties of the catalyst, the presence of Fe2+, and the status and number of active sites, as well as the quantity and status of each reaction material in the solution. Therefore, the control of the initial pH also makes an important change in the reaction process. Again, the promotion of the reaction time on the degradation performance of TC is due to the fact that the UV–Fenton degradation reaction occurs positively with increasing time, and this reaction process is basically irreversible and fitted as a pseudo primary reaction, while the reaction time is explored as a more important reaction parameter. However, the factor with the least degree of influence on the response values was the catalyst dosage, which is due to the fact that the different catalyst dosages in this system had little effect on the reaction results, and the catalyst played a significant catalytic role as a reaction condition without the need for a large dosage, indicating the high efficiency of the catalyst.
The p-values of quadratic terms A2, B2, C2, and D2 are all less than 0.05, indicating that they all had statistically significant effects on the changes in response value. The interaction terms AB, AC, AD, BC, BD, and CD, all had p-values greater than 0.05, which illustrated the impact of the interaction of the six sets of relationships (between the initial pH and H2O2 dosage, initial pH and catalyst dosage, initial pH and reaction time, H2O2 dosage and catalyst dosage, H2O2 dosage and reaction time, and catalyst dosage and reaction time) on the degradation rate of TC. Meanwhile, the initial pH, H2O2 dosage, catalyst dosage, and reaction time have no significant antagonistic and synergistic effects with each other, and possess a certain degree of independence, which proves the feasibility and significance of the single-factor experiment, and the model’s wider significance of use.
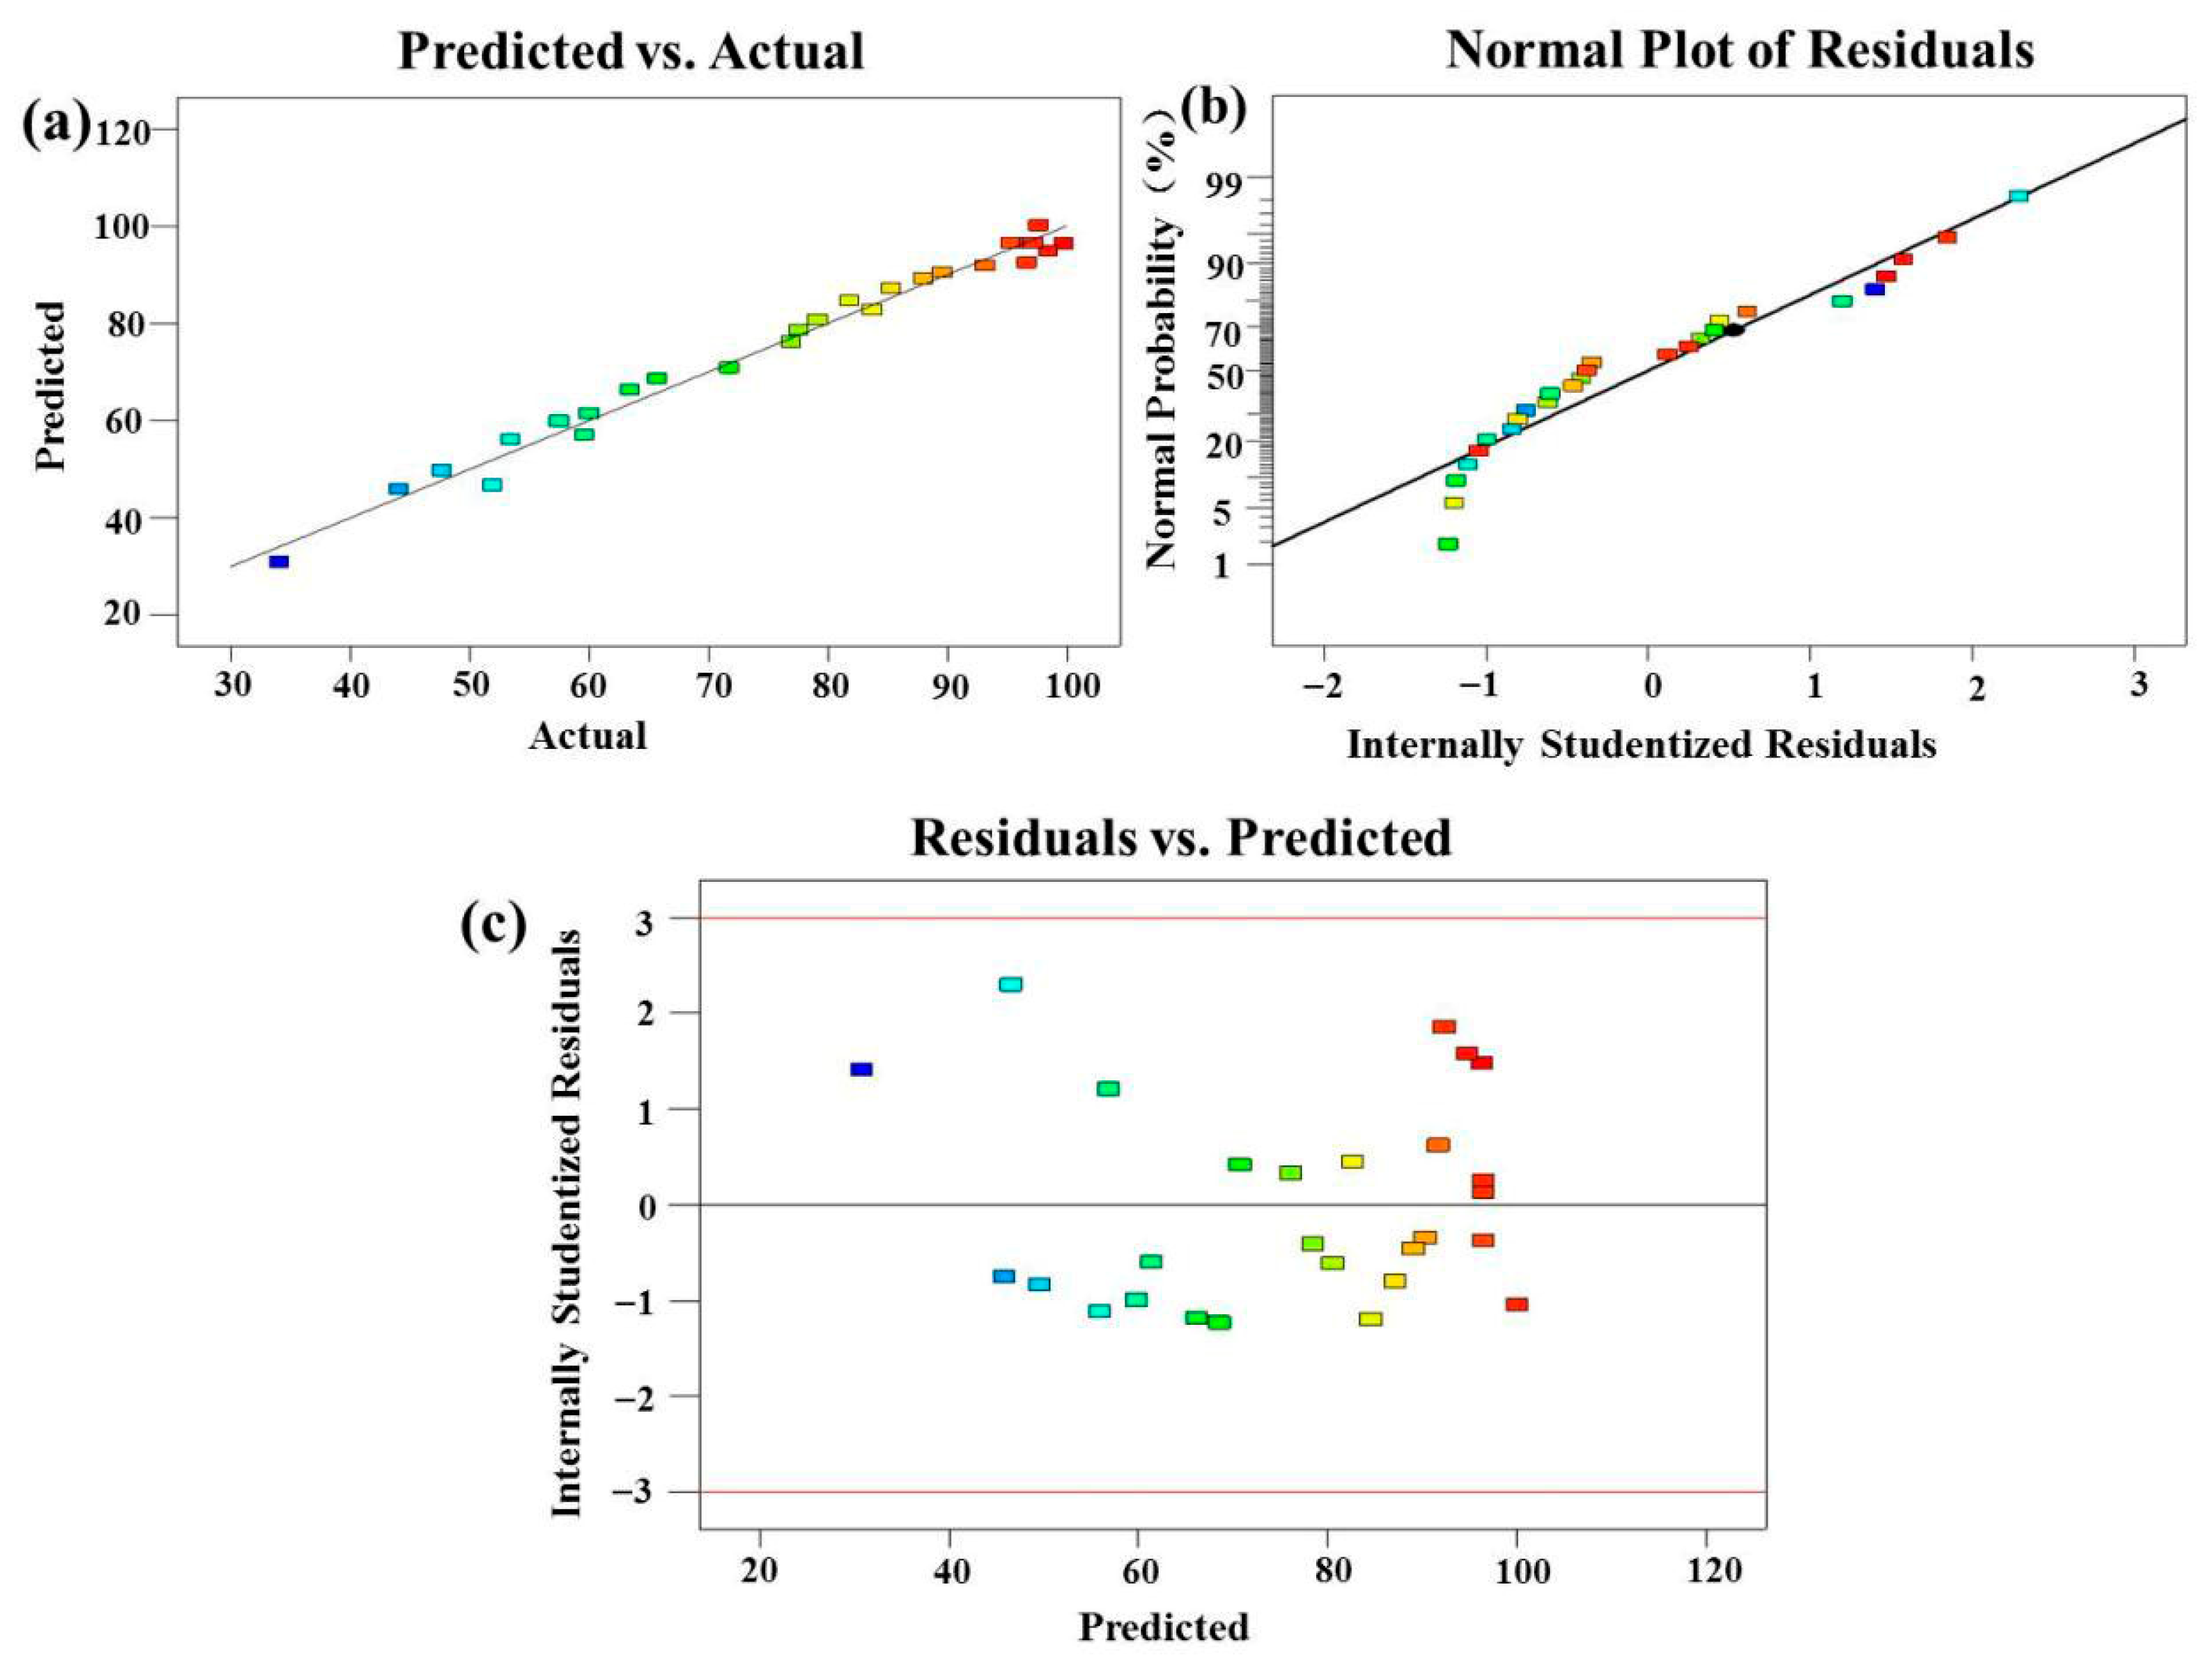
To interpret the deviation between the actual and predicted responses, the comparison curves of the actual and predicted values were plotted, and the results are shown in Figure 11a. The results show that the 27 points of data fit well with the comparison baseline, and the deviation between the predicted and actual values is small, which further proves that the regression model fits the experimental points well. Figure 11b shows the plot of the normal probability distribution of the residuals of the response surface, from which it can be seen that the residuals of all the experimental results are basically distributed in a straight line. In addition, from Figure 11c, it observed that there is no regular distribution relationship between the residuals and the predicted values, indicating that the residuals are uniformly distributed, which proves the reliability of the quadratic regression model for the degradation rate of TC.
Figure 11. Normal probability plot of degradation of TC. (a) Predicted vs. actual. (b) Normal plot residuals. (c) Residuals vs. predicted.
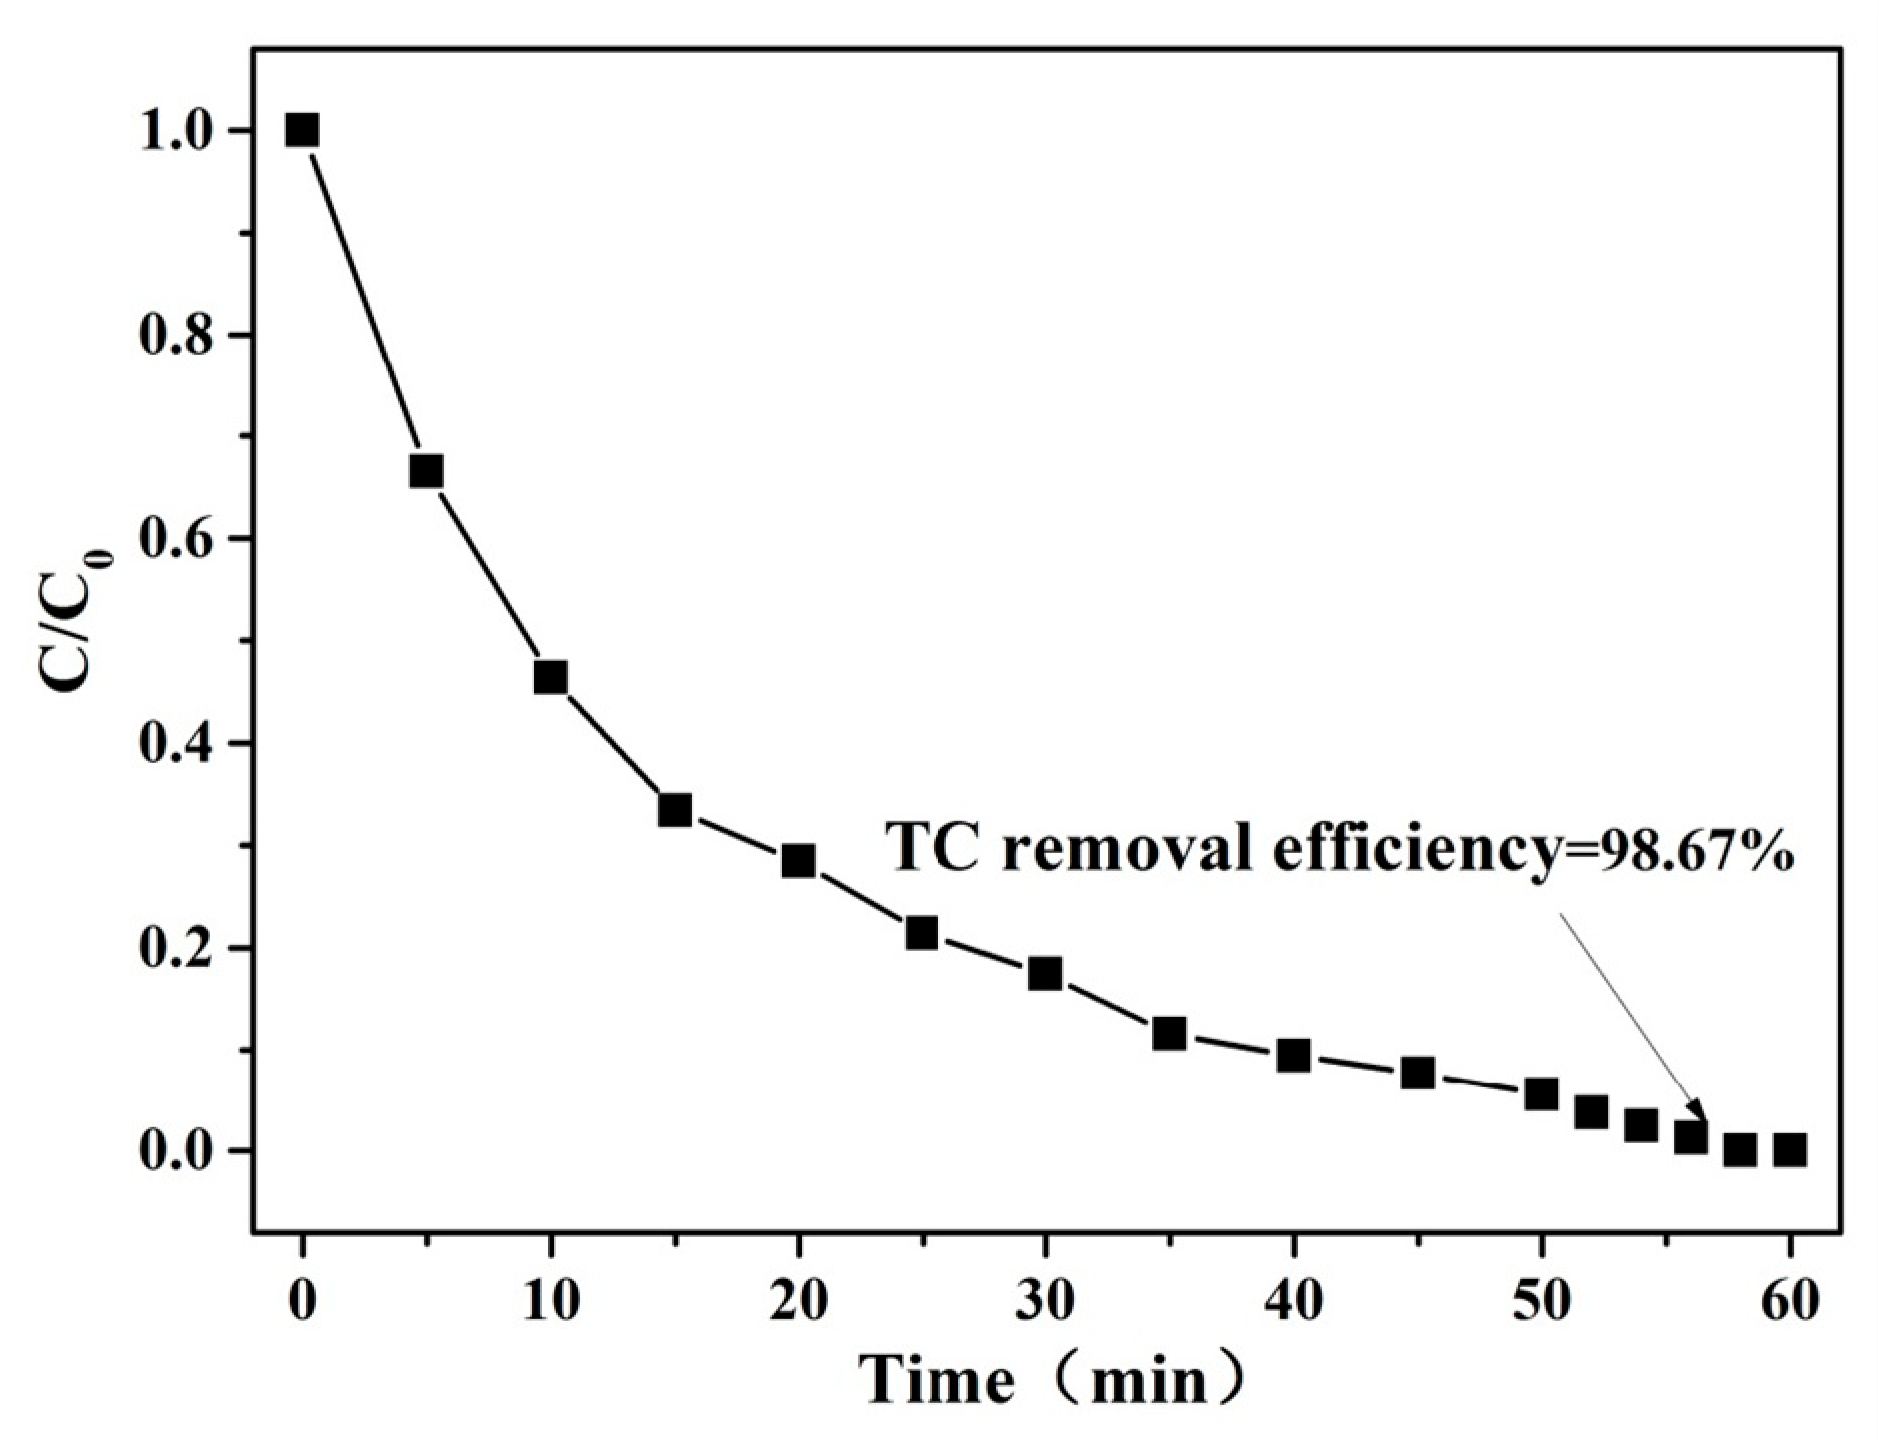
According to the experimental parameter optimization function of the Design-Expert (Version 8.0.6) software, the four parameters of initial pH, H2O2 dosage, catalyst dosage, and reaction time were optimized, and the best degradation conditions were determined with the maximum degradation rate of TC and the shortest reaction time. The optimum degradation conditions were determined as follows: the initial pH value was 6.74, the H2O2 dosage was 11.52 mmol/L, and the catalyst dosage was 0.38 g/L. The resulting reaction time was 56.63 min, and the predicted TC degradation rate was 98.13%. The experimental results are shown in Figure 12. The deviation between the experimental value (98.67%) and the predicted value (98.13%) of TC removal rate is small, and almost complete removal of TC can be achieved in 58–60 min. As observed from this study, the established regression model is more accurate in predicting the performance of UV–Fenton degradation of TC catalyzed by MST-TiO2/Fe3O4 materials, and the optimal operating conditions in the experimental range were derived.
Figure 12. TC degradation effect under optimized conditions.

3.2.7. Catalytic Mechanism

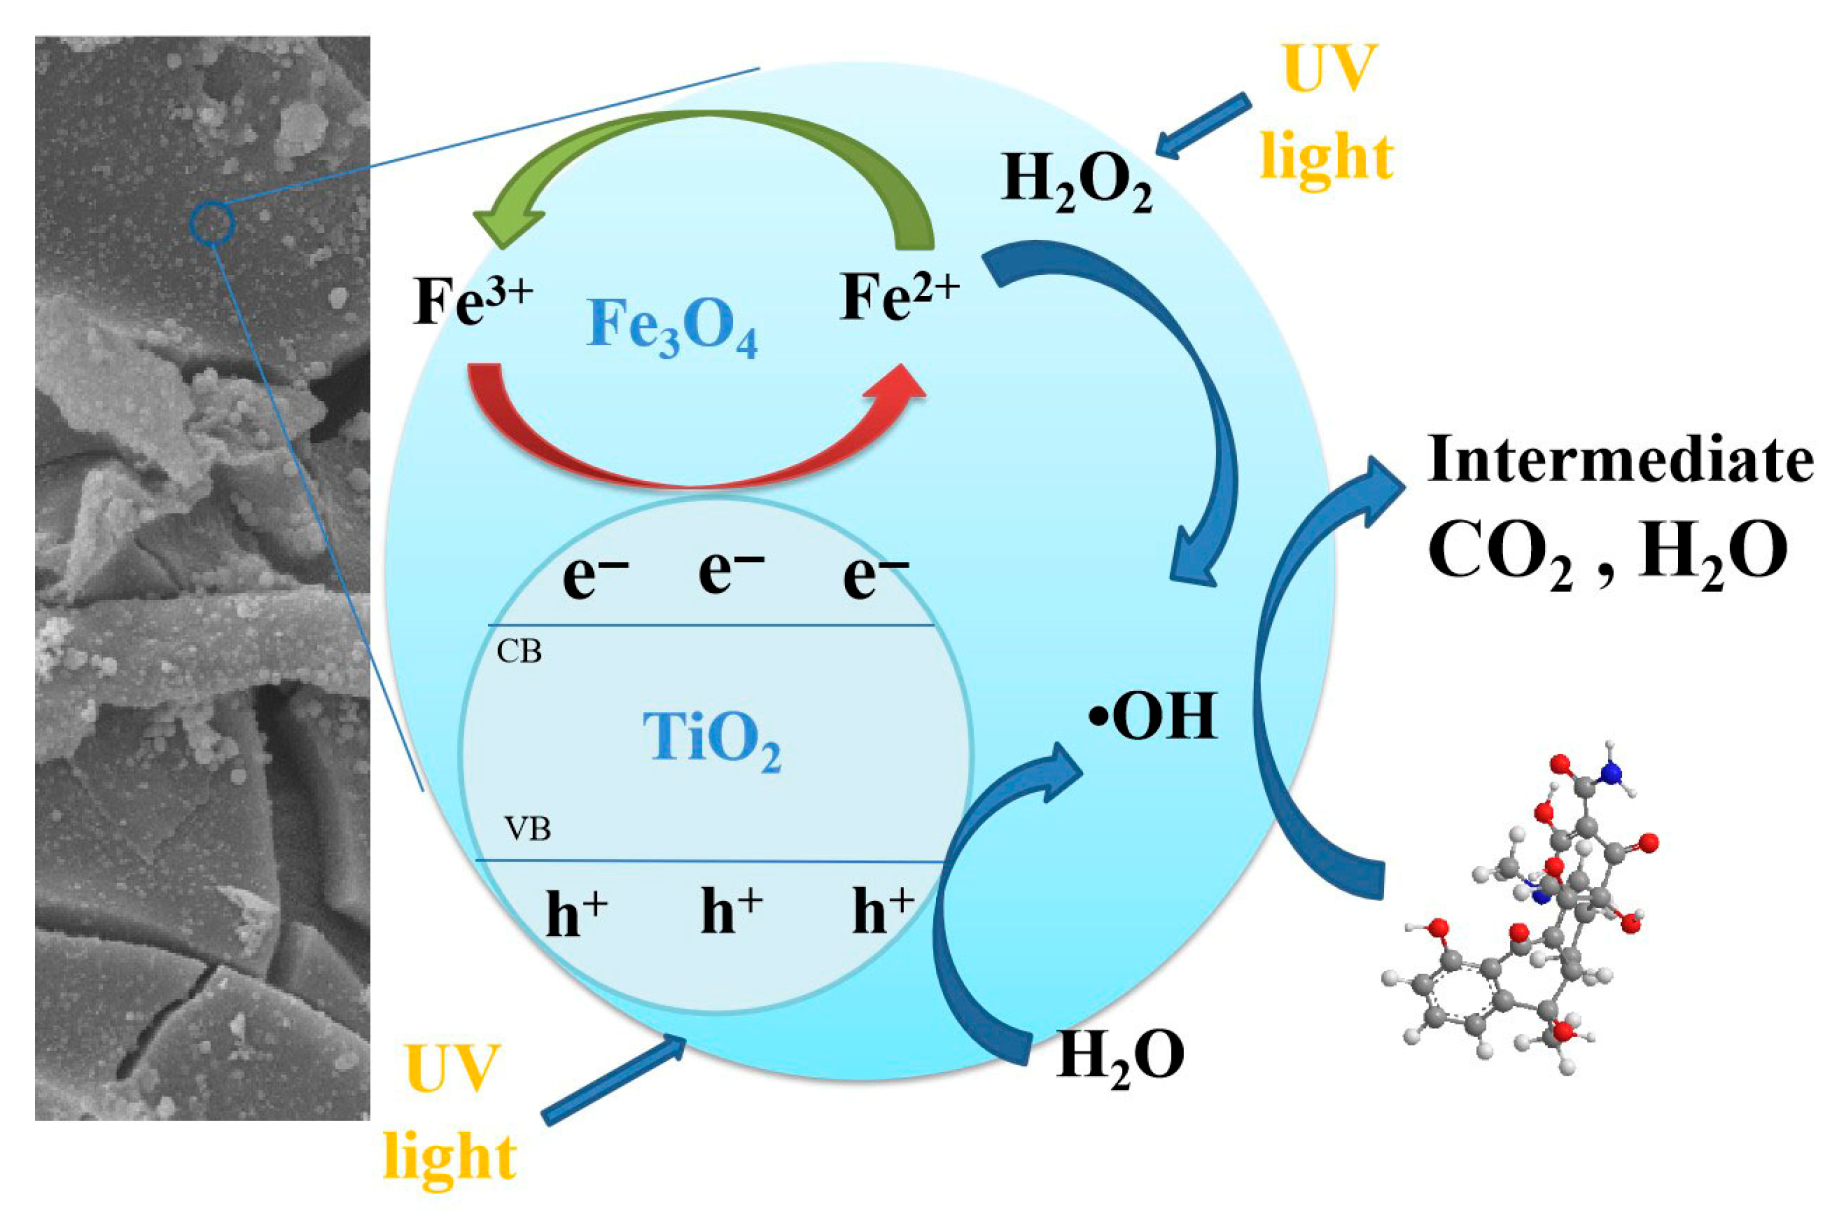
Based on the above results, the UV–Fenton system catalyzed by MST-TiO2/Fe3O4 exhibits synergistic effects between photocatalysis and UV/Fenton in the degradation of TC, with the synergistic mechanism illustrated in Figure 13. The degradation of TC in the reaction system is primarily driven by •OH radicals, with the UV–Fenton process serving as the main pathway for •OH generation (Equation (1)). Additionally, UV/H2O2 (Equation (10)) and photocatalysis (Equations (4) and (11)) also contribute to •OH production. On one hand, upon UV irradiation, electrons in the valence band of MST-TiO2 are excited to the conduction band, forming photo-generated electrons and holes in the conduction and valence bands, respectively. Photo-generated holes react with H2O to produce •OH, while photo-generated electrons react with O2 to generate O2. On the other hand, Fe3+ generated in the UV–Fenton system acts as an electron acceptor, capturing photoelectrons produced by UV-irradiated MST-TiO2. This not only suppresses recombination of photo-generated holes and electrons but also accelerates the conversion of Fe3+ to Fe2+ in the system (Equation (12)). Consequently, the oxidative capacity of the Fenton reaction is enhanced, promoting the generation of more free radicals in the system, thereby enhancing the degradation efficiency of TC (Equation (13)).
H 2 O 2   h v   OH
MST - TiO 2   h v   h +   +   e
Fe3+ + e → Fe2+
TC + •OH → Products
Figure 13. The reaction mechanism of MST-TiO2/Fe3O4.

4. Conclusions

In this study, the XRD, XPS, SEM, and EIS analysis confirmed that MST-TiO2/Fe3O4 composite catalyst was successfully synthesized by calcination followed by a hydrothermal method. Compared to pure Fe3O4, the introduction of MST-TiO2 in MST-TiO2/Fe3O4 not only prevents the agglomeration of Fe3O4 particles, but also significantly improves electron transfer ability which contributed to higher catalytic activity towards the degradation of TC in the UV–Fenton system. The RSM based on BBD was employed to model and predict the effects of initial pH, H2O2 dosage, catalyst dosage, and reaction time on TC degradation rate. The predicted degradation efficiency of 50 mg/L TC reached 98.13% and matched well with the experimental values (98.67%) under optimum conditions. Moreover, the initial pH, catalyst dosage, H2O2 dosage, and reaction time all significantly affected the catalytic efficiency of UV–Fenton degradation of TC, and the order of significance was as follows: H2O2 dosage > initial pH > reaction time > catalyst dosage. The interaction between the influencing factors had no significant effect on the degradation rate of TC. However, the initial pH has an effect on the degradation of TC by the UV/MST-TiO2/Fe3O4/H2O2 system, primarily because it determines the presence of H2O2, •OH, Fe3+/Fe2+ cycle in the system and the surface charge and photoexcitation properties of the TiO2 catalyst.

Author Contributions

Conceptualization, X.Y.; methodology, Q.J.; validation, Y.C.; data curation, Q.J.; writing—original draft preparation, X.Y.; writing—review and editing, X.Y.; supervision, X.Y.; funding acquisition, X.Y. All authors have read and agreed to the published version of the manuscript.

Funding

This research was funded by the Jilin Provincial Department of Science and Technology of China; grant number No. YDZJ202201ZYTS630.

Data Availability Statement

The original contributions presented in this study are included in the article. Further inquiries can be directed to the corresponding authors.

Conflicts of Interest

The authors declare no conflicts of interest.

References

  1. Akhter, S.; Bhat, M.A.; Ahmed, S.; Siddiqui, W.A. Antibiotic residue contamination in the aquatic environment, sources and associated potential health risks. Environ. Geochem. Health 2024, 46, 387. [Google Scholar] [CrossRef]
  2. Matheou, A.; Abousetta, A.; Pascoe, A.P.; Papakostopoulos, D.; Charalambous, L.; Panagi, S.; Panagiotou, S.; Yiallouris, A.; Filippou, C.; Johnson, E.O. Antibiotic Use in Livestock Farming: A Driver of Multidrug Resistance? Microorganisms 2025, 13, 779. [Google Scholar] [CrossRef]
  3. Wei, X.; Yi, H.; Lai, C.; Huo, X.; Ma, D.; Du, C. Synergistic effect of flower-like MnFe2O4/MoS2 on photo-Fenton oxidation remediation of tetracycline polluted water. J. Colloid Interface Sci. 2022, 608, 942–953. [Google Scholar] [CrossRef]
  4. Liu, Y.; Li, J.; Wu, L.; Wan, D.; Shi, Y.; He, Q.; Chen, J. Synergetic adsorption and Fenton-like degradation of tetracycline hydrochloride by magnetic spent bleaching earth carbon: Insights into performance and reaction mechanism. Sci. Total Environ. 2021, 761, 143956. [Google Scholar] [CrossRef]
  5. Xin, S.; Liu, G.; Ma, X.; Gong, J.; Ma, B.; Yan, Q.; Chen, Q.; Ma, D.; Zhang, G.; Gao, M.; et al. High efficiency heterogeneous Fenton-like catalyst biochar modified CuFeO2 for the degradation of tetracycline: Economical synthesis, catalytic performance and mechanism. Appl. Catal. B Environ. 2021, 280, 119386. [Google Scholar] [CrossRef]
  6. Zhuang, Y.; Yuan, S.; Liu, J.; Zhang, Y.; Du, H.; Wu, C.; Zhao, P.; Chen, H.; Pei, Y. Synergistic effect and mechanism of mass transfer and catalytic oxidation of octane degradation in yolk-shell Fe3O4@C/Fenton system. Chem. Eng. J. 2020, 379, 122262. [Google Scholar] [CrossRef]
  7. Bui, V.K.H.; Park, D.; Pham, T.N.; An, Y.; Choi, J.S.; Lee, H.U.; Kwon, O.-H.; Moon, J.-Y.; Kim, K.-T.; Lee, Y.-C. Synthesis of MgAC-Fe3O4/TiO2 hybrid nanocomposites via sol-gel chemistry for water treatment by photo-Fenton and photocatalytic reactions. Sci. Rep. 2019, 9, 11855. [Google Scholar] [CrossRef]
  8. Sun, C.; Yang, S.-T.; Gao, Z.; Yang, S.; Yilihamu, A.; Ma, Q.; Zhao, R.-S.; Xue, F. Fe3O4/TiO2/reduced graphene oxide composites as highly efficient Fenton-like catalyst for the decoloration of methylene blue. Mater. Chem. Phys. 2019, 223, 751–757. [Google Scholar] [CrossRef]
  9. Dong, D.; Wang, K.; Yi, M.; Liang, Y.; Muhammad, Y.; Wei, E.; Wei, Y.; Fujita, T. Preparation of TiO2 photocatalyst microspheres by geopolymer technology for the degradation of tetracycline. J. Clean. Prod. 2022, 339, 130734. [Google Scholar] [CrossRef]
  10. Belachew, N.; Fekadu, R.; Ayalew Abebe, A. RSM-BBD Optimization of Fenton-Like Degradation of 4-Nitrophenol Using Magnetite Impregnated Kaolin. Air Soil Water Res. 2020, 13, 117862212093212. [Google Scholar] [CrossRef]
  11. Babajani, N.; Jamshidi, S. Investigation of photocatalytic malachite green degradation by iridium doped zinc oxide nanoparticles: Application of response surface methodology. J. Alloys Compd. 2019, 782, 533–544. [Google Scholar] [CrossRef]
  12. Zhang, Y.; He, T.; Ding, S.; Li, H.; Song, W.; Ding, J.; Lu, J. Photo-fenton degradation of RhB via transition metal oxides composite catalyst Fe3O4/CuO under visible light optimized using response surface methodology. Mater. Technol. 2022, 37, 2347–2359. [Google Scholar] [CrossRef]
  13. Yu, X.; Lin, X.; Feng, W.; Li, W. Effective Removal of Tetracycline by Using Bio-Templated Synthesis of TiO2/Fe3O4 Heterojunctions as a UV–Fenton Catalyst. Catal. Lett. 2018, 149, 552–560. [Google Scholar] [CrossRef]
  14. Cai, C.; Zhang, Z.; Liu, J.; Shan, N.; Zhang, H.; Dionysiou, D.D. Visible light-assisted heterogeneous Fenton with ZnFe2O4 for the degradation of Orange II in water. Appl. Catal. B: Environ. 2016, 182, 456–468. [Google Scholar] [CrossRef]
  15. Song, T.; Gao, Y.; Hu, R.; Li, G.; Yu, X. Degradation of Methyl Orange in Aqueous Solution via Magnetic TiO2/Fe3O4 Conjugated with Persulfate. Water Air Soil Pollut. 2023, 234, 508. [Google Scholar] [CrossRef]
  16. Liu, X.; Zhang, Q.; Yu, B.; Wu, R.; Mai, J.; Wang, R.; Chen, L.; Yang, S.-T. Preparation of Fe3O4/TiO2/C Nanocomposites and Their Application in Fenton-Like Catalysis for Dye Decoloration. Catalysts 2016, 6, 146. [Google Scholar] [CrossRef]
  17. Tan, Y.; Shu, Z.; Zhou, J.; Li, T.; Wang, W.; Zhao, Z. One-step synthesis of nanostructured g-C3N4/TiO2 composite for highly enhanced visible-light photocatalytic H2 evolution. Appl. Catal. B: Environ. 2018, 230, 260–268. [Google Scholar] [CrossRef]
  18. Song, T.; Gao, Y.; Ye, J.; Ohnuki, T.; Li, J.; Yu, X. Fabrication, characterization, and performance evaluation of Bi2WO6/TiO2/Fe3O4 photocatalyst responding to visible light for enhancing bisphenol A degradation. Environ. Sci. Pollut. Res. 2023, 30, 49917–49929. [Google Scholar] [CrossRef]
  19. Guo, H.; Wang, Y.; Yao, X.; Zhang, Y.; Li, Z.; Pan, S.; Han, J.; Xu, L.; Qiao, W.; Li, J.; et al. A comprehensive insight into plasma-catalytic removal of antibiotic oxytetracycline based on graphene-TiO2-Fe3O4 nanocomposites. Chem. Eng. J. 2021, 425, 130614. [Google Scholar] [CrossRef]
  20. Xia, H.; Zhang, Z.; Liu, J.; Deng, Y.; Zhang, D.; Du, P.; Zhang, S.; Lu, X. Novel Fe-Mn-O nanosheets/wood carbon hybrid with tunable surface properties as a superior catalyst for Fenton-like oxidation. Appl. Catal. B Environ. 2019, 259, 118058. [Google Scholar] [CrossRef]
  21. Sun, J.; Zhen, W.; Xue, C. Magnetic template-assisted construction of 2D PCN/TiO2 heterostructures for efficient photocatalytic hydrogen generation. Appl. Surf. Sci. 2023, 623, 157131. [Google Scholar] [CrossRef]
  22. Tambosi, J.L.; Domenico, M.D.; Schirmer, W.N.; Jos, H.J.; Moreira, R.D.F. Treatment of paper and pulp wastewater and removal of odorous compounds by a Fenton-like process at the pilot scale. J. Chem. Technol. Biotechnol. 2010, 81, 1426–1432. [Google Scholar] [CrossRef]
  23. Martinez, N.S.S.; Fernández, J.F.; Segura, X.F.; Ferrer, A.S. Pre-oxidation of an extremely polluted industrial wastewater by the Fenton’s reagent. J. Hazard. Mater. 2003, 101, 315–322. [Google Scholar]
  24. Park, Y.; Kim, S.; Kim, J.; Khan, S.; Han, C. UV/TiO2 Photocatalysis as an Efficient Livestock Wastewater Quaternary Treatment for Antibiotics Removal. Water 2022, 14, 958. [Google Scholar] [CrossRef]
  25. Zhao, B.; Li, X.; Li, W.; Yang, L.; Li, J.; Xia, W.; Zhou, L.; Wang, F.; Zhao, C. Degradation of trichloroacetic acid by an efficient Fenton/UV/TiO2 hybrid process and investigation of synergetic effect. Chem. Eng. J. 2015, 273, 527–533. [Google Scholar] [CrossRef]
  26. Ge, M.; Hu, Z.; Wei, J.; He, Q.; He, Z. Recent advances in persulfate-assisted TiO2-based photocatalysis for wastewater treatment: Performances, mechanism and perspectives. J. Alloys Compd. 2021, 888, 161625. [Google Scholar] [CrossRef]
  27. Xu, L.; Wang, J. Magnetic nanoscaled Fe3O4/CeO2 composite as an efficient Fenton-like heterogeneous catalyst for degradation of 4-chlorophenol. Environ. Sci. Technol. 2012, 46, 10145–10153. [Google Scholar] [CrossRef]
  28. Alani, O.A.; Alani, S.O.; Ari, H.A.; Offiong, N.-A.O.; Ugya, A.Y.; Feng, W. Tetracycline degradation by efficient synergistic bio-templated CuO photocatalysis and Fenton hybrid process irradiated by visible light: Influential parameters, and mechanisms. J. Mater. Sci. Mater. Electron. 2022, 33, 25603–25618. [Google Scholar] [CrossRef]
  29. Zulfiqar, M.; Samsudin, M.F.R.; Sufian, S. Modelling and optimization of photocatalytic degradation of phenol via TiO2 nanoparticles: An insight into response surface methodology and artificial neural network. J. Photochem. Photobiol. A Chem. 2019, 384, 112039. [Google Scholar] [CrossRef]
  30. Galedari, M.; Mehdipour Ghazi, M.; Rashid Mirmasoomi, S. Photocatalytic process for the tetracycline removal under visible light: Presenting a degradation model and optimization using response surface methodology (RSM). Chem. Eng. Res. Des. 2019, 145, 323–333. [Google Scholar] [CrossRef]
Disclaimer/Publisher’s Note: The statements, opinions and data contained in all publications are solely those of the individual author(s) and contributor(s) and not of MDPI and/or the editor(s). MDPI and/or the editor(s) disclaim responsibility for any injury to people or property resulting from any ideas, methods, instructions or products referred to in the content.

Article Metrics

Citations

Article Access Statistics

Article metric data becomes available approximately 24 hours after publication online.