Abstract
Understanding the shear behavior of the interface between surrounding rock and backfill is of significant engineering importance for enhancing stope stability in cemented tailings backfill mining. However, the evolutionary mechanisms of shear properties and damage under varying mechanical conditions remain insufficiently studied. This investigation employed tailings and surrounding rock from a Guangdong tailings pond, with basic mechanical parameters determined through laboratory tests. Numerical models of the rock-backfill composite were developed using PFC2D, considering different shear rates (0.3, 0.6, and 0.9 mm/min), lateral confinement levels (0.5, 1.0, and 1.5 MPa), and roughness coefficients. The analysis compared the interface’s peak and residual shear strengths, revealed crack evolution patterns, and explored damage mechanisms using acoustic emission monitoring and energy dissipation theory. Key findings include the following: (1) Shear stress–displacement curves under all conditions exhibited three stages, ascending, shearing-off, and sliding, with distinct peak and residual strengths. (2) Increasing lateral confinement, shear rate, and roughness transformed failure from localized to global sliding, with cracks occurring at the interface and propagating into the backfill. (3) Cumulative acoustic emission events increased with all three factors, with lateral confinement showing the most substantial effect on interface energy accumulation (83% increase). These results provide theoretical support for assessing interface stability in deep backfilled stopes.
1. Introduction
Due to the continuous enhancement of mine safety production and green mining standards in China, the cut and fill mining method has gained widespread adoption in underground metal mines globally. The stability of backfill in mining areas is crucial for safe mining operations. This is particularly true for mines employing the post-empty-field backfill mining method. During the second stage of the backfill process, the removal of pillar columns from adjacent first-stage mining areas creates unstable contact surfaces between the backfill and surrounding rock []. As the backfill material settles and consolidates, a complex mechanical system forms at the interface between the backfill and surrounding rock [,], altering the stress environment of the surrounding rock. Additionally, the disparity in strength and stiffness between the backfill and surrounding rock results in differential settlement under gravity, which induces shear friction at the interface between them. Consequently, understanding the shear mechanical characteristics at the interface between the surrounding rock and backfill is pivotal for investigating the stability of filled stopes [].
To date, numerous scholars have conducted extensive research on the strength characteristics and fracture behavior of backfill-rock (B-R) composites [,,]. Wang et al. [] investigated the failure behavior of B-R under uniaxial compression, revealing a tensile–shear mixed failure mode where the failure process was predominantly governed by the backfill, while the ultimate failure was controlled by the rock. Yu et al. [] performed triaxial compression tests on B-R, demonstrating that cracking occurred both within the rock and at the rock-backfill interface, whereas the backfill itself remained relatively intact. However, in practical backfill mining operations, the shear strength produced at the interface between the backfill and the rough surrounding rock, due to the arching effect [], is also a critical factor that must be considered. Consequently, the interfacial shear failure of the surrounding-rock–backfill composite (B-R) is of paramount importance.
In response, researchers have explored interfacial shear properties from various perspectives. Lu Hongjian et al. [], combining direct shear tests with RFPA3D simulations, uncovered the evolution of acoustic emission characteristics and strength parameters (cohesion, c, and internal friction angle, φ). Manaras et al. [] quantitatively assessed the impact of factors such as curing age, cement content, and interface roughness to the c and φ values of the backfill-rock interface. Wu Wei et al. [], using direct shear tests between backfill and granite, systematically examined the effects of the binder-to-tailings ratio, curing age, and normal stress on the interface’s peak strength and residual strength and the c-φ relationship. Guo et al. [] focused on the Cemented Paste Backfill-Cemented Paste Backfill (CPB-CPB) interface, revealing the synergistic mechanisms among normal stress, curing time, and roughness. Gao Fuzhou et al. [], through direct shear tests, clarified the nonlinear influences of normal stress, backfill thickness, and joint roughness coefficient (JRC) on peak shear strength and dilatancy characteristics. Xu et al. [] found that incorporating a certain amount of fiber into CPB could enhance the peak and residual strengths of the rock–CPB interface in direct shear tests and also analyzed the coupling effect of curing temperature on the interface’s shear mechanical properties. Xiu et al. [] prepared rock–CPB interface samples with six different JRC values using engraving technology, quantified the apparent damage to the interfaces using a 3D scanning system, and subsequently established a shear strength criterion for rough rock–CPB interfaces. The team of Lu Hongjian [,] developed a mechanical model for cemented-backfill–surrounding-rock composites, analyzing the influences of confining pressure and cementation plane dip angle on shear failure modes based on ANSYS simulations. Li Sheng et al. [], based on uniaxial compression tests of composites with different thicknesses, proposed a segmented damage constitutive model for the post-peak strain softening stage, providing a new approach for theoretical modeling.
Furthermore, Zhang C et al. [] and Cao S et al. [] utilized acoustic emission, CT scanning, and energy analysis to delve into the internal fracture evolution and energy mechanisms within the composite during loading. Scholars such as Yang XX [] and Cheng C et al. [] employed PFC numerical simulation software to intensively investigate the strength instability behavior and crack evolution mechanisms of rock specimens containing voids, as well as the mechanical properties, macroscopic fracture characteristics, and energy evolution laws of surrounding-rock–backfill composites, offering fresh perspectives for understanding the complex mechanical behavior of these composites. In summary, investigating the crack propagation and energy evolution laws in surrounding-rock–backfill composites is crucial for understanding their damage evolution mechanisms.
In conclusion, although existing studies [,,,] have described and explained the shear behavior at the interface of surrounding-rock–backfill composites, a fundamental understanding of the composite interface remains incomplete. Under realistic mining dynamic disturbance environments, the interface is often subjected to dynamically varying shear loads, and its mechanical response and damage accumulation are strongly dependent on the loading rate. Currently, there is a lack of systematic research on how the key factor of “shear rate” influences the complete mechanical behavior from peak strength to residual strength, dynamic crack propagation laws, and the energy dissipation mechanisms at the interface. Therefore, building upon existing research, this paper focuses specifically on the coupling effects of shear rate, lateral constraint, and roughness coefficient. Based on the numerical simulation software PFC2D, a model of the surrounding-rock–backfill composite is constructed. Subsequently, the influences of lateral constraint, interface roughness, and shear rate on its shear mechanical properties are studied. Acoustic emission monitoring is employed to track the entire shear process from initiation to slip at the interface, and the shear damage mechanism is revealed based on energy evolution analysis. The workflow of the study presented in this paper is shown in Figure 1.
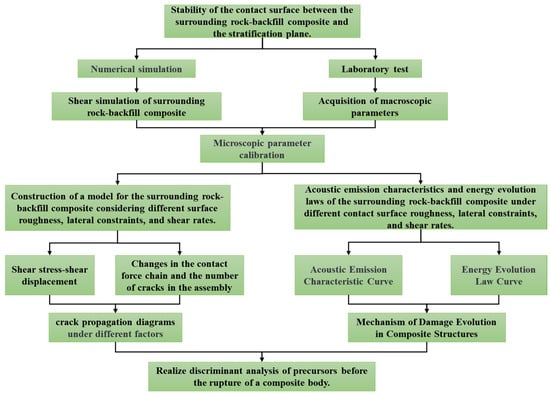
Figure 1.
Flowchart.
2. Construction of Surrounding-Rock–Backfill Combination Model
2.1. Roughness Coefficient of Contact Surface
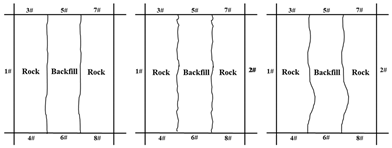
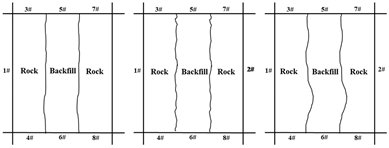
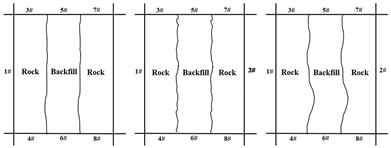
Nick Barton proposed the Barton joint model in 1973 []. The Barton joint model is an empirical model used to describe shear strength characteristics of joints (fractures or structural planes) in rock mechanics. The model evaluates joint strength of rough rocks by introducing the joint roughness coefficient (JRC). In order to determine the JRC value of a target profile, the Barton model provides 10 joint planes with different JRC values. (JRC ranges from 0 to 20, where 0 represents the smoothest and 20 represents the roughest.) According to our field investigation, three joint planes, 1, 5, and 7, in the Barton joint model could truly reflect the true contact states of the contact surfaces on both sides of the surrounding rock and backfill body, as shown in Table 1. The JRC was calculated by using the formula suggested by Tse, R et al. [], as shown in Equation (1):
which was calculated with the following formula:
where is the root mean square of the first derivative of the slope of the rock joint profile line; L is the projection length of the joint profile line in the x direction; Δx is the sample space along the x direction; Δx = 0.02 mm is used for calculation; M is the total number of elements in the sample space; and is the height difference between two adjacent sampling points on the profile line in the y direction.

Table 1.
Contact surface profile line.
2.2. Simulation Scheme
In this paper, a rock-backfill combination model with different roughness values, lateral constraints, and shear rates was constructed; the roughness values were selected from three Barton joint models numbered 1, 5, and 7, the shear rates were set as 0.3 mm/min, 0.6 mm/min, and 0.9 mm/min, and the lateral constraints were set as 0.5 MPa, 1.0 MPa, and 1.5 MPa. The specific simulation scheme is shown in Table 2.

Table 2.
Simulation scheme.
2.3. Constitutive Model Selection
This study focuses on the mechanical properties of composites under varying filling times, necessitating the weakening of interlayer and contact surfaces to mitigate stress concentration and slippage interference in these areas. The rock-backfill composite model comprises two components: rock and backfill. The parallel bond model (PBM) is utilized between both rock and backfill particles. This model enhances the bonding functionality of the linear contact model (linear), converting contact points into planes of a specified size, thus reflecting the cementation properties of the material. The schematic diagram is shown in Figure 2a, where the spring passing through the contact point represents stiffness defined by Kn (normal) and Ks (tangential), which is responsible for force transmission. A set of cylindrical elements (or a short beam) covering the contact point can form within the range defined by gs (gap size of parallel bonding), which is responsible for transmitting both force and momentum while possessing tensile and shear strength. The strength envelope defines the failure criteria of the parallel bonding model under different stress states, serving as the “criterion” for material failure. It determines the stress conditions under which the model fails, thereby enabling the judgment of the failure mode and macroscopic strength of the composite. In the figure, the horizontal and vertical axes represent the tangential and normal forces borne by the parallel bond, respectively. The intercept of the envelope on the tensile side represents the maximum tensile stress that the bonded interface can withstand. If the tensile stress generated by the normal force exceeds this value, the bonded interface will fracture due to tension. The intercept of the envelope on the tangential force axis represents the maximum tangential force that the bonded interface can withstand under pure shear conditions. If the shear force exceeds this value, the bonded interface will fracture due to shear. The slope of the diagonal line in the figure is determined by the internal friction angle of the parallel bond, which describes how the shear resistance of the bond increases with rising normal pressure under compression. This aligns with the principles of the Mohr–Coulomb criterion. The strength envelope determines the failure criteria of the parallel bond model under various stress states, serving as the criterion for material failure and predicting the failure mode and macroscopic strength of the composite under different stress conditions. The stress expression for the PBM strength envelope, depicted in Figure 2b, is as follows:
where denotes the normal parallel bonding force; denotes the tangential parallel bonding force; denotes the bending moment on the contact plane; denotes the particle radius; denotes the cross-sectional area; denotes the moment contribution coefficient; and denotes the moment of inertia. When , tensile failure occurs, resulting in tensile cracks; when , shear failure occurs, resulting in shear cracks.

Figure 2.
Schematic diagrams of the principles of two models.
Utilizing the smooth joint model depicted in Figure 2c, we simulated the interfaces between fill materials and the contact surfaces between surrounding rock and fill materials. This model allows for the incorporation of frictional sliding joints or cohesive joints at the contact points between particles on both sides of the joint. It facilitates the sliding, separation, and closure of particles at the interface. By establishing bonds between particles, it simultaneously transmits normal forces, tangential forces, and moments. This not only captures the dynamic processes of crack initiation and propagation but also simulates crack propagation modes (tensile cracks and shear cracks) in compressed composites. It more accurately represents the mechanical behavior of mineral particles within rock connected by cementitious materials. Additionally, it allows for the weakening of interfaces and contact surfaces by adjusting the model’s mesoscopic parameters.
2.4. Mesoscopic Parameter Calibration
To maintain consistency with the macroscopic behavior, such as the stress–strain curve obtained from laboratory tests, it is necessary to calibrate the mesoscopic parameters of the model so that the simulation results reflect the true rock mechanical behavior. The lithology of the surrounding rock used in this paper is granite, with mechanical parameters as shown in Table 3. The filling material used in the test is iron tailings, and its particle size distribution characteristics are detailed in Table 4. The mesoscopic parameter normal-to-tangential stiffness ratio (kn/ks) in the parallel bond model is calculated from the material’s Poisson’s ratio (v). The mesoscopic parameters tensile strength (pb_ten) and cohesion (pb_coh) are the dominant factors controlling the peak strength, while the mesoscopic parameter effective modulus (pb_emod) is positively correlated with the macroscopic elastic modulus.

Table 3.
Basic mechanical parameters of granite.

Table 4.
Chemical composition table of tail sand.
Based on the macroscopic parameters obtained from laboratory experiments, uniaxial compression simulations were conducted on the composite. The “trial and error” method was employed to continually adjust and obtain accurate mesoscopic parameters, as shown in Table 5. Subsequently, the calculated macroscopic mechanical parameters of the material were compared with those obtained from laboratory experiments, as presented in Table 6. It can be observed from the table that the experimental results are generally similar to the numerical results, indicating that the mesoscopic parameters were set reasonably.

Table 5.
Microscopic parameter table of the combination.

Table 6.
Comparison between experimental results and numerical results.
2.5. Establishment of Surrounding-Rock–Backfill Combination Model
A model of a rock-backfill combination with a length of 50 mm and height of 100 mm was established by PFC2D software. The particle size range of rock particles was 0.45~0.655 mm, and the particle size range of fill particles was 0.3~0.5 mm. Then, suspended particles were eliminated from the model, and the model was balanced by servo system. Then, joint curves were imported by the geometry import command and verified to be consistent with model coordinates. Then, the parallel bonding contact model was used to describe the relationship between the surrounding rock particles and the surrounding rock particles, and between the filler particles and the filler particles of the model, and the calibrated micro-parameters were set, including effective modulus, stiffness ratio, and bonding strength. Finally, the surrounding rock particles and the filler particles were grouped by defining the contact-group function, and smooth joint contact was added to the contact surface between the surrounding rock particles and the filler particles (Smooth-joint). Through cyclic iteration, different groups of particles were screened to obtain the contact surface between the surrounding rock and filling body, as shown in Figure 3.
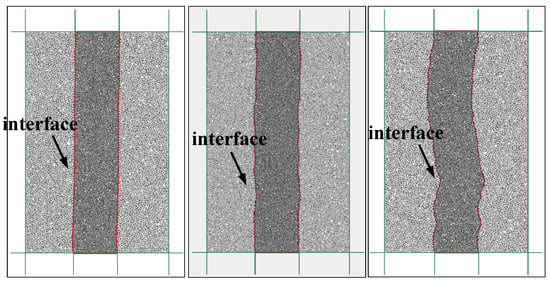
Figure 3.
Surrounding rock-filling contact surface.
The loading diagram of the assembly is shown in Figure 4, where V represents the loading rate and F represents the lateral constraint. After the composite model was formed, lateral constraints were applied to the first and second walls of the model, then preload was unloaded, other walls were kept static, and shear loads with a rate of 0.3 mm/min were applied to the fifth and sixth walls of the model. The program was written in the language FISH to record the changes in stress, strain, and microcracks during the whole loading process. At the same time, a crack propagation program was invoked, and the calculation was stopped when the stress dropped to 70% of the peak stress.
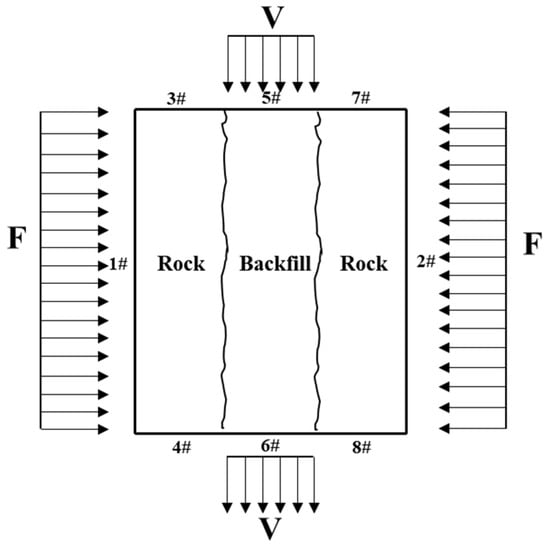
Figure 4.
Schematic diagram of assembly loading.
3. Shear Simulation Test of Surrounding-Rock–Backfill Combination
3.1. Effect of Lateral Restraint on Shear Properties of Composite Bodies
3.1.1. Shear-Stress–Shear-Displacement Relation
When a shear rate of 0.6 mm/min is applied to the contact surface of the composite material, with a roughness coefficient (JRC) of 5, Figure 5 presents the shear-stress–shear-displacement curves under various lateral constraints. All shear-stress–shear-displacement curves under the three lateral constraints exhibit a climbing stage, a gnawing stage, and a sliding stage, characterized by distinct peak and residual strengths. At the initial shear stage, the shear stress increases continuously under shear action, and the shear stress increases linearly with the shear displacement until it reaches the peak strength. In the sliding stage, all the convex particles on the contact surface are overcome, the shear stress tends to be stable, corresponding to the residual strength, and the contact surface slides stably.
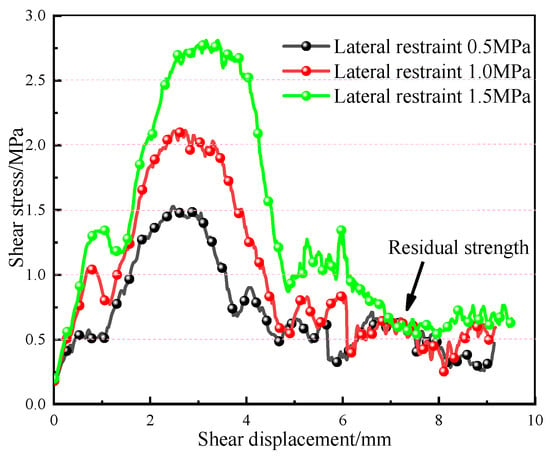
Figure 5.
Shear-stress–shear-displacement curves of composite bodies under different lateral constraints.
With the increase in lateral constraint, peak shear strength, peak shear displacement, and residual strength increase, and it is found that the post-peak shear stress of the rock-backfill combination rises and falls repeatedly, which is due to the local uneven roughness and fluctuation angle of the contact surface, resulting in uneven stress in the shear process, resulting in shear stress fluctuation.
3.1.2. Strength Analysis
When the roughness coefficient JRC is 5, the fitting curve of the peak shear strength of the composite body under different lateral constraints is shown in Figure 6. It can be seen from the figure that the peak shear strength of the composite body increases with the increase in lateral constraints; with the increase in shear rate, the peak shear strength also increases gradually. The fitting curve in Figure 6 conforms to the Mohr–Coulomb criterion, as shown in Equation (5):
where is the peak shear strength of the contact surface; is the lateral constraint perpendicular to the contact surface; is the internal friction angle of the contact surface; and is the cohesion of the contact surface.
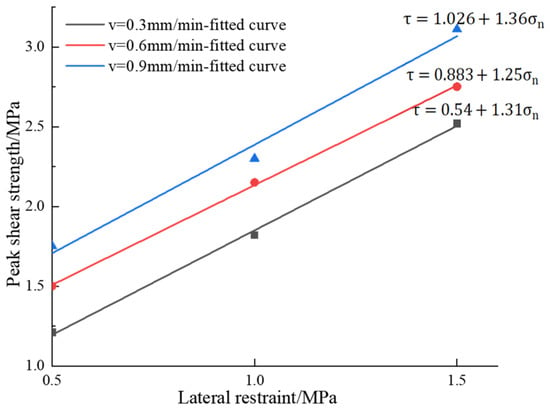
Figure 6.
Variations of curves of peak shear strength of composite body under different lateral constraints.
The fitting results of peak shear strength under different lateral constraint conditions are shown in Table 7, where the cohesion of the contact surface is the intercept of the fitting curve in Figure 6, and the friction angle of the contact surface of the surrounding-rock–backfill body is the tangent value of the slope of the fitting curve. It can be seen from the table analysis that the correlation coefficient R2 fits the lateral constraint and peak shear strength is greater than 0.9, indicating that lateral constraint and peak shear strength conform to a linear relationship. With the increase in shear rate, the cohesion of the interface between the surrounding rock and filling increases significantly, which is due to the fact that the cementation between particles shows stronger viscous resistance with an increase in shear rate, so the cohesion increases significantly, while the internal friction angle is almost unchanged, indicating that the friction of sliding between particles is less affected by shear rate.

Table 7.
Mechanical parameters of shear strength of contact surface of surrounding-rock–backfill combination.
3.1.3. Contact Force Chain Analysis
When a shear rate of 0.6 mm/min is applied to the contact surface and the roughness coefficient JRC is 5, the contact force chain of the assembly under different lateral constraints is shown in Figure 7. It can be seen from the figure that, when the load reaches 40% of the peak shear stress, the downward movement of wall (#5) leads to an obvious concentration of stress at the top of the filling body, and the contact force chain network gradually becomes more dense with the increase in lateral constraint. At this time, there is close contact between particles of the combination body, so the force chain network covers the whole model area and presents a state of convergence towards the contact surface. The direction of the main stress tends to be consistent with the shear direction, with obvious directivity. When the load reaches 60% of the peak shear stress, friction slip occurs in the local bulge of the contact surface under shear action, causing a small number of high-strength force chain fractures, but an increase in lateral constraints leads to the enhancement of the intermeshing action between particles on the contact surface, inhibiting the fracture of part of the strong force chain, and the tendency of the force chain to gather to the contact surface becomes more obvious. Meanwhile, the force chain network in the filling body appears to experience local thinning, but the whole force chain remains stable. When the shear stress reaches 80% of the peak shear stress, many positions of the contact surface are staggered due to the sliding of convex particles, and the force chain presents characteristics of regional strengthening. The internal force chain of the filling body is distributed unevenly, and the external residual force chain still continues the trend of converging to the contact surface. Finally, the structural bearing capacity is lost due to complete slip of the shear band, and the combination body becomes unstable.
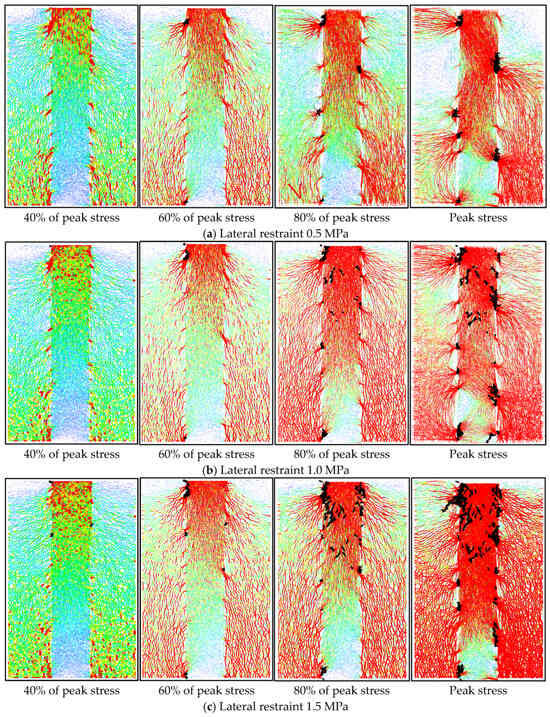
Figure 7.
Combined force chain and crack distribution diagram under different lateral constraints.
As shown in Figure 7, the black parts of the figure are the monitored cracks. Under different lateral constraints, cracks in the assembly occur at the interface between the surrounding rock and the backfill, and the crack distribution and number of cracks in the assembly are obviously different with shear. When the lateral constraint is 0.5 MPa, cracks only propagate along the interface, and no crack damage occurs in the backfill; when the lateral constraint is 1.0 MPa, some cracks in the interface propagate to the interior of the backfill. When the lateral restraint is 1.5 MPa, a large number of cracks propagate to the filler and the number of cracks increases significantly.
When the roughness coefficient JRC is 5 and the shear rate is 0.6 mm/min, the number of cracks in the composite body under different lateral constraints varies, as shown in Figure 8. The number of cracks in the composite body under different lateral constraints varies, similarly to the shear process, and the cracks are mainly tensile cracks, accompanied by a small number of shear cracks. With the shear rate proceeding, the proportion of tensile cracks increases, local micro-cracks appear on the interface, some bond fractures occur, and micro-cracks initiate rapidly at the interface of the assembly. The number of cracks increases steadily until the shear stress reaches the peak value, at which time the cracks penetrate through the interface to form a macro-slip surface and the shear stress drops suddenly. In the post-peak stage, the assembly fails, and the total number of cracks increases sharply.
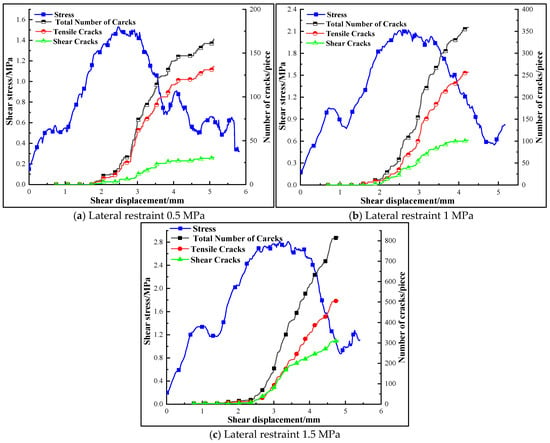
Figure 8.
Variations of curves of number of cracks in composite body under different lateral constraints.
When the lateral constraint is 0.5 MPa, the friction against the contact surface is weak, the friction degree is low, and cracks are generated and propagated in the contact surface, but the number of cracks is small. When the lateral constraint is 1.0 MPa, the degree of friction damage in the contact surface increases, the cracks propagate to the interior of the filler, and the number of tensile cracks and shear cracks increases. When the lateral constraint is 1.5 MPa, the degree of fractures caused by friction damage to the contact surface further intensifies, a large number of cracks propagate to the interior of the filler, and the number of cracks increases greatly. The evolution of the number of cracks in the rock filling composite body with lateral restraint is not simple a linear increase; the total crack number increases 114% from an increase in confining pressure to 1.0 MPa, while the total crack number increases 120% from an increase in lateral restraint to 1.5 MPa.
3.1.4. Shear Failure Mode
When the roughness coefficient JRC is 5 and shear rate is 0.6 mm/min, macroscopic fracture of the composite body under different lateral constraints reaches peak shear stress as shown in Figure 9. It can be seen from the figure that the fracture degree of the contact surface of the composite body becomes more and more obvious with the increase in lateral constraints. When the lateral constraint is 0.5 MPa, the friction resistance of the contact surface is small, and the adhesion force between particles is easy to overcome, so there is almost no damage when the contact surface slides, and shear failure mainly occurs along the contact surface between the backfill and the surrounding rock, showing slip failure. When the lateral constraint is 1.0 MPa, the contact surface’s bite action is enhanced and the friction strength is improved; because the friction strength does not exceed the surrounding rock strength, the surrounding rock does not appear to be damaged when the contact surface slides, but there are cracks on the contact surface that extend to the interior of the filling body. When the lateral constraint is 1.5 MPa, the degree of wear of, and fractures in, the contact surface is further intensified, and a large number of cracks extend to and penetrate the interior of the filling body.
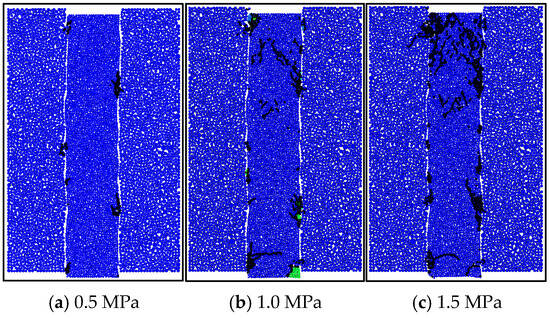
Figure 9.
Macroscopic fracture diagram of peak shear stress of composite body under different lateral constraints.
3.2. Shear Characteristics of Composite Bodies Under Different Shear Rates
3.2.1. Shear-Stress–Shear-Displacement Relation
When the lateral constraint of 1 MPa is applied to the contact surface and the roughness coefficient JRC is 5, the shear-stress–shear-displacement curves of the composite model under different shear rates are shown in Figure 10. It can be seen from the figure that the shear-stress–shear-displacement curves of the contact surface under three shear rates all have a climbing stage, gnawing stage, and sliding stage, and have obvious peak strengths and residual strengths. In the initial shear stage, the shear stress on the contact surface of the composite increases continuously under shear action, and the shear stress increases linearly with the increase in shear displacement until it reaches the peak strength; with the shear stress increasing, some particles on the contact surface are gnawed off after reaching the peak shear strength, and the shear stress decreases sharply; in the slip stage, the particles on the whole convex body of the contact surface are overcome, the slip is completely connected, stable slip occurs, the shear stress tends to be stable, and the residual strength corresponds to this.
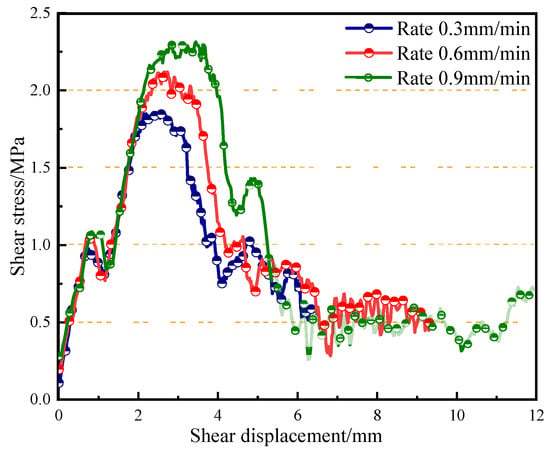
Figure 10.
Shear-stress–shear-displacement curves of composite under different shear rates.
With an increase in shear rate, the peak strength and peak displacement of the contact surface of the composite increase, and the residual stress does not noticeably change, which is due to the increase in damping force between particles at high shear rates, thus delaying particle failure, resulting in an increase in peak displacement and peak strength; the residual strength mainly depends on the friction and mechanical meshing between particles and is insensitive to shear rate, so the residual stress does not change noticeably.
3.2.2. Strength Analysis
The various fitting curves of peak shear strength in composite interfaces under different shear rates are shown in Figure 11. It can be seen from the figure that the greater the roughness, the greater the peak shear strength of the composite interface.
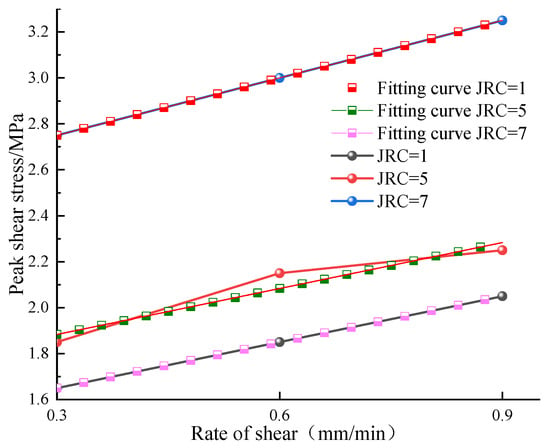
Figure 11.
Peak shear strength diagram of composite under different shear rates.
The fitting results of peak shear strength versus shear rate are shown in Table 8. It can be seen from the table that the correlation coefficient, R2, of the shear rate and shear strength is greater than 0.9, indicating that shear rate and peak shear strength conform to linear relationship. It can be seen from the fitting curve in Figure 11 that, when the roughness coefficient JRC of the contact surface of the combination is 1 or 5, the slope of the shear strength fitting curve of the combination under different shear rates is the same.

Table 8.
Mechanical parameters of peak shear strength of surrounding rock-filling combination interface.
3.2.3. Contact Force Chain Analysis
When the lateral constraint is 1.0 MPa and the roughness coefficient JRC is 5, the contact force chain of the assembly under different shear rates is shown in Figure 12. It can be seen from the figure that when the peak shear stress reaches 40%, the downward movement of the wall (#5) causes obvious stress concentration at the top of the filling body, and the contact force chain network gradually becomes dense with the increase in shear rate. When the peak shear stress reaches 60%, the force chain network presents characteristics of convergence to the contact surface, and with an increase in shear rate, the convergence degree of the force chain increases. When the shear stress reaches 80% of the peak value, the stress chain breaks and reorganizes frequently, and the strong chain (red chain) appears locally. When the shear stress reaches the peak value, the whole contact surface slides and forms a macroscopic shear band, and the force chain network shows obvious differences on both sides of the contact surface: the internal force chain distribution of the filling body is uneven, and the residual force chain outside the filling body still continues the trend of gathering to the contact surface. Finally the structural bearing capacity is lost due to complete slip of the shear band, and the combination body becomes unstable and is destroyed.
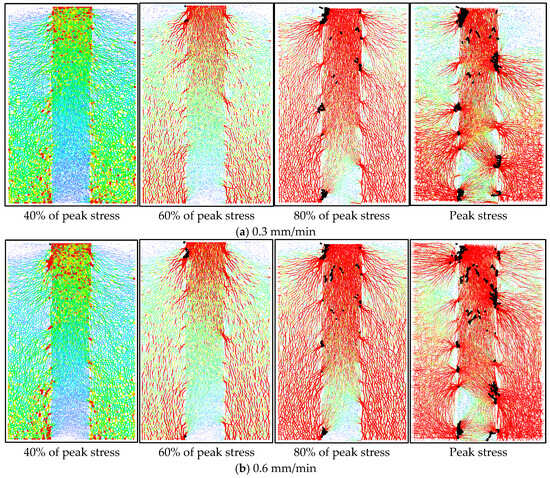
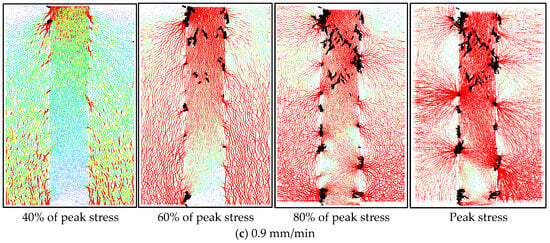
Figure 12.
Contact force chain diagram of assembly under different shear rates.
The crack propagation characteristics of the composite under three shear rates are similar; shear crack initiation occurs in the upper region of the surrounding–filling interface, and then gradually propagates to the interior of the filling body, and the degree of crack propagation increases with the increase in shear rate.
At a lateral constraint of 1.0 MPa and a roughness coefficient (JRC) of 5, Figure 13 illustrates the crack count in the composite material across various shear rates. The figure reveals that both tensile and shear cracks are present in the composite, with tensile cracks predominating. As the shear rate increases, both types of cracks exhibit an upward trend. This trend occurs because rapid shear loading intensifies the instantaneous meshing and fracture damage of the convex contact surface, leading to an increase in microcracks.
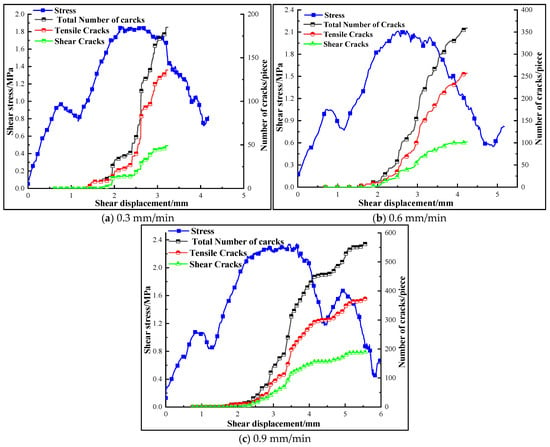
Figure 13.
Variations in curves of number of cracks in composite body under different shear rates.
3.2.4. Shear Failure Mode
Macro-fractures resulting from the peak shear stress on the composite body at different shear rates when JRC is 5 and lateral constraint is 1.0 MPa are shown in Figure 14. It can be seen from the figure that shear slip failure occurs along the contact surface of composite body at different shear rates, and the failure degree increases with the increase in shear rate. When shear rate is 0.3 mm/min, almost no cracks occur in the filling body and surrounding rock, the composite body is dominated by contact surface slip failure, and almost no damage occurs on the contact surface. When the shear rate is 0.6 mm/min, the fracture at the contact surface develops along the relatively weak filling body due to the increase in the shear rate, and internal damage to the filling body occurs; when the shear rate is 0.9 mm/min, a large number of cracks appear on the contact surface, the upper part of the filling body becomes obviously fractured, penetrating cracks appear, and the degree of damage to the internal filling body is further aggravated and obvious damage occurs.
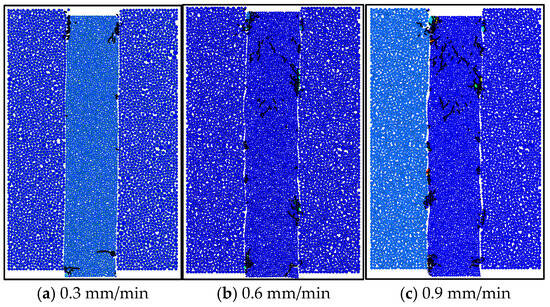
Figure 14.
Macroscopic fracture diagram of peak shear stress of composite under different shear rates.
3.3. Shear Characteristics of Composite Bodies Under Different Contact Surface Roughness
3.3.1. Shear-Stress–Shear-Displacement Relation
When the shear rate is 0.6 mm/min and the lateral constraint is 1.0 MPa, the shear-stress–shear-displacement curves of contact surface combination models with different roughness values are shown in Figure 15. The shear-stress–displacement curves of contact surface combination models with different roughness are similar, showing three stages, a climbing stage, gnawing stage, and stable slip stage, with an obvious peak strength and residual strength. At the initial stage of shear, the rough protrusions on the contact surface play an interlocking role and provide temporary shear resistance. The shear stress of the contact surface combination with different roughness coefficients increases continuously under shear action, and the shear stress increases approximately linearly with the increase in shear displacement until it reaches the peak shear strength, at which point the contact surface is completely penetrated. At last, the composite enters into the stable slip stage; all the bumps on the contact surface are overcome, the shear stress tends to be stable, corresponding to the residual strength of the contact surface of the combination, and the contact surface slides stably at this time.
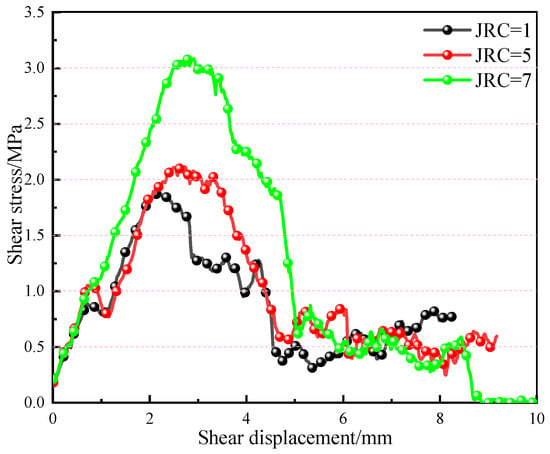
Figure 15.
Shear-stress–shear-displacement curves of composite bodies under different roughness values.
With an increase in roughness of the contact surface, the peak stress of the assembly increases gradually, which is because the higher the roughness, the higher the shear stress which must be overcome; at the same time, a local bulge forces the contact surface to rise, expanding the volume of the assembly and increasing the normal constraint force which must be overcome, thus further delaying the occurrence of the overall slip of the contact surface, hence the peak shear stress and peak shear displacement increase.
3.3.2. Strength Analysis
In order to more directly represent the change in shear strength of the composite body with contact surfaces with different levels of roughness, the curve of the peak shear strength of the composite body changing with the roughness of the contact surface is plotted, as shown in Figure 16. When the lateral constraint is 0.5 MPa, 1.0 MPa, and 1.5 MPa, the increase in the value of the peak shear strength when the roughness coefficient increases from 1 to 5 is smaller than that when the roughness coefficient increases from 5 to 7. This is because when the roughness coefficient, JRC, is less than 5, the local protrusion of the contact surface is small, and the shear stress required to overcome the local protrusion is small; when the roughness coefficient, JRC, is 7, the local protrusion of the contact surface is large, forming a structure with enhanced bite action, which significantly increases the difficulty of shear failure, resulting in a large increase in peak shear stress.
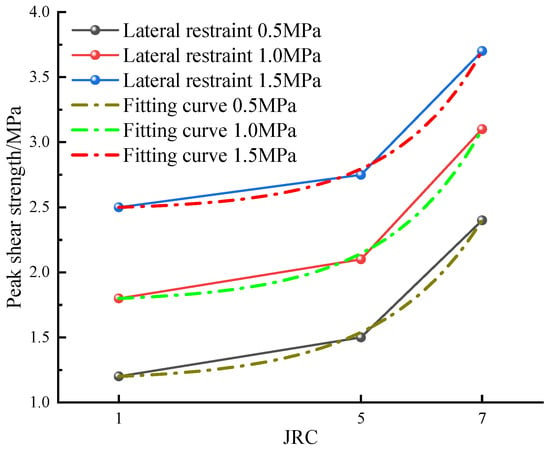
Figure 16.
Peak shear strength curves of contact surface combinations with different roughness.
Fitting the peak shear strength of the contact surface under different roughness coefficients, it was found that it conforms to the fitting equation shown in Table 9. The estimation method for this fitting equation involves finding a set of parameters (y0, A, and t) that minimizes the sum of squared residuals (SSR). Therefore, the objective function to be minimized is as follows:

Table 9.
Fitting relationship between contact surface roughness and shear strength.
The process was then implemented using Origin software’s nonlinear fitting function. The correlation coefficient, R2, of the fit between roughness and shear strength was greater than 0.9, indicating that the fitting effect of roughness and peak shear strength of the contact surface was good. It can be seen from the fitting graph in Figure 16 that the slope of the fitting curve of the peak shear strength of the composite body under different lateral constraints increases gradually with roughness, indicating that the peak shear strength increases significantly with the increase in roughness.
3.3.3. Contact Force Chain Analysis
When the lateral constraint is 1.0 MPa and the shear rate is 0.6 mm/min, the contact force chain of the composite body under different levels of contact surface roughness is shown in Figure 17. It can be seen from the figure that when the load reaches 40% of the peak shear stress, the top of the filling body presents significant stress concentration phenomena, and the contact force chain network gradually becomes dense with the increase in the contact surface roughness. At this time, there is close contact between particles of the composite body, so the force chain network covers the whole model area. When the load reaches 60% of the peak shear stress, the force chain tends to converge to the contact surface. When the roughness coefficient of the contact surface is 1, the local particles slip under shear action, causing a small amount of high-strength force chain fractures. With an increase in the roughness of the contact surface, the meshing action between the particles on the contact surface increases, and the degree of force chain fractures is suppressed. When the shear stress reaches 80% of the peak shear stress, part of the low-strength force chain is broken due to particle slip, but the force chain network with JRC = 7 is still intact. When the shear stress reaches the peak, the particles slip through the whole contact surface to form macroscopic shear bands, and the force chain network shows obvious differences on both sides of the contact surface: the distribution of the internal force chain is not uniform, and the external residual force chain still continues the trend of converging to the contact surface. From the crack distribution, it can be seen that the greater the roughness, the greater the degree of damage to the contact surface. Finally, the complete slip of the shear band leads to the loss of structural bearing capacity, and the failure of the composite occurs due to instability.
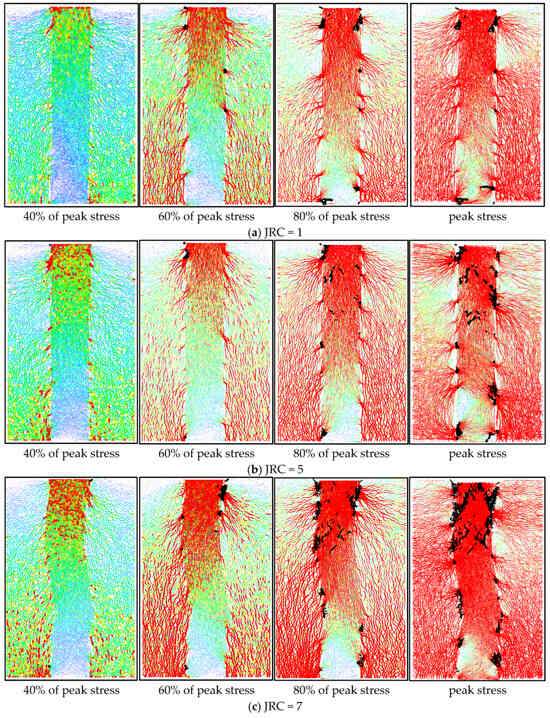
Figure 17.
Contact force chain diagrams of assembly under different roughness values.
Model failure mainly occurs in the contact surface, i.e., the black parts of the figure are the monitored cracks. When JRC is 1, cracks preferentially occur at the contact surface between the surrounding rock and filling body. Due to the low roughness and weak interaction of convex particles on the contact surface, the degree of damage to the contact surface is relatively low during sliding; meanwhile, shear stress is almost not transmitted to the interior of the surrounding rock and filling body through the local convex shape of the structure, so no cracks occur. When JRC = 5, roughness enhances the interlocking action of contact surface, obvious damage appears on contact surface during sliding, shear stress is transmitted to the interior of the filling body through local bulging, cracks appear in the filling body, and the number of cracks in the combination body increases.
When the lateral constraint is 1.0 MPa and the shear rate is 0.6 mm/min, the variation in crack number under different levels of contact surface roughness is shown in Figure 18. It can be seen from the figure that the cracks in the combination with different contact surface roughness coefficients are composed of tensile cracks and shear cracks, among which tensile cracks are dominant. With an increase in roughness, the total number of cracks increases from 100 to 1200, which indicates that the complexity of the crack network increases significantly because the rougher the contact surface (JRC = 7), the stronger the interaction between convex particles and the harder it is for the interaction to be sheared, resulting in an increase in damage to the contact surface and an increase in the total number of cracks.
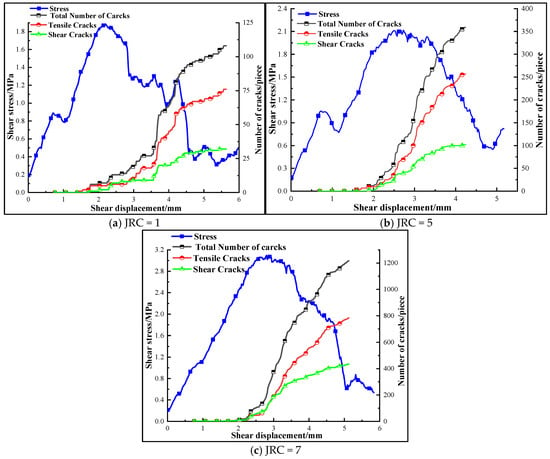
Figure 18.
Variations in curves of crack number in composite body under different roughness coefficients.
3.3.4. Shear Failure Mode
When the lateral restraint is 1.0 MPa and the shear rate is 0.6 mm/min, the macroscopic fracture mode of the assembly contact surface with different roughness values reaches the peak shear stress, as shown in Figure 19. It can be seen from the figure that, at the contact surface of assemblies with different roughness values, shear slip failures occur along the contact surface, and the degree of failure increases with the increase in the contact surface roughness. When JRC = 1, almost no cracks appear in the backfill and surrounding rock, the failure of the composite is dominated by the slip of the contact surface, and almost no damage occurs at the contact surface. When JRC = 7, a lot of cracks appear on the interface, and obvious cracks appear on the upper part of the filling body, which indicates that obvious damage occurs in the filling body in order to overcome the rough interface bulge.
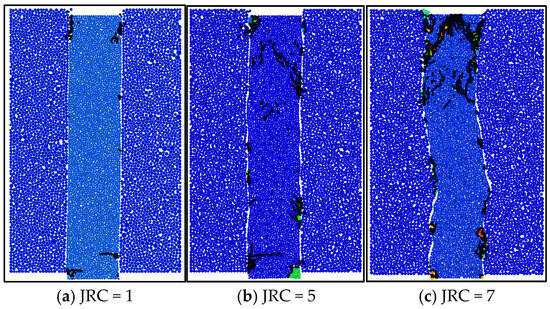
Figure 19.
Macroscopic fracture diagram of peak shear stress of composite body under different roughness values.
4. Acoustic Emission Characteristics and Energy Evolution of Surrounding-Rock–Backfill Interface
4.1. Effect of Different Lateral Constraints
4.1.1. Shear Acoustic Emission Characteristics of Contact Surfaces
Based on the correlation between microcrack evolution and acoustic emission (AE) characteristics, a simulation method of AE for failure process of filling assembly was established by using PFC2D numerical simulation software. The detailed flow is as follows: firstly, the total number of microcracks in the loading process was recorded in real time by using fracture files generated by PFC; combined with the definition of AE, “AE event number per unit time”, the crack generation rate was equivalent to the AE event number, and energy release was monitored synchronously.
The AE event variation curves of the assembly under different lateral constraints, with a shear rate of 0.6 mm/min is applied to the contact surface and a roughness coefficient, JRC, of 5, are shown in Figure 20. It can be seen from the figure that AE events under different lateral constraints first increase and then decrease during the shear process. At the initial stage of shear stress application, the assembly enters the climbing stage, in which AE events gradually increase from zero and show an upward trend with the increase in lateral constraint, which is due to the increase in the number of bond fractures between particles on the contact surface due to greater lateral constraint and stronger occluding action. The peak values of AE events appear near the peak shear stress of the interface and decrease noticeably after the peak shear stress. This is due to the stable sliding of the interface after the peak shear strength is reached, and the number of bond failures between particles decreases.
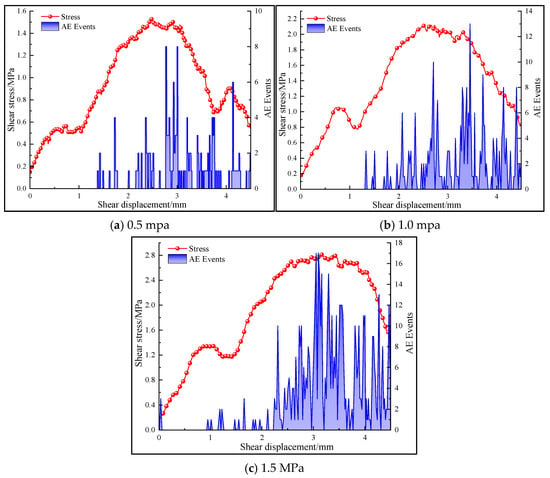
Figure 20.
AE event curves during shear process for contact surface under different lateral constraints.
With the increase in lateral constraint, the total number of AE events increases because the increase in lateral constraint inhibits the friction of sliding between particles on the contact surface, resulting in the initiation and propagation of a large number of micro-cracks, resulting in more AE events. Compared with 0.5 MPa and 1.0 MPa lateral constraints, AE events before peak stress rise continuously to a higher level after peak stress and decay slowly after peak stress under 1.5 MPa lateral constraints, which is due to residual friction slip of particles at the contact surface under high lateral constraints. AE events of composite bodies under different lateral constraints rise and fall repeatedly in all stages, which is caused by the uneven roughness of the contact surface during shear process.
4.1.2. Energy Evolution Law
When a shear rate of 0.6 mm/min is applied to the contact surface of the assembly and the roughness coefficient, JRC, is 5, the energy variation curves of the contact surface under different lateral constraints are shown in Figure 21. It can be seen from the figure that the total energy and dissipated energy in the assembly gradually increase with the increase in lateral constraints. When the lateral constraints increase from 0.5 MPa to 1.5 MPa, the total energy increases by 83%, which is due to the higher resistance that the particles need to overcome when the lateral constraints increase. At the initial stage of shear, the strain energy and cementation energy cumulated and increased with the increase in lateral constraint, and the strain energy and cementation energy cumulated and decreased with the increase in lateral constraint. At this stage, the bonds between particles were not broken completely, the applied shear energy was transformed into strain energy and cementation energy and stored between the unbroken bonds of particles, at the same time, the fracture of partial bonds of particles leads to the initiation of microcracks, which leads to an increase in friction dissipation energy between particles on the contact surface and a rapid rise in the dissipation energy curve.
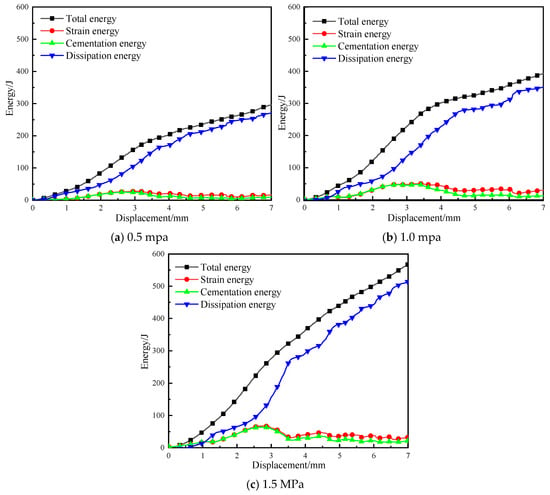
Figure 21.
Curves of energy variations in shear process of contact surface under different lateral constraints.
4.2. Effects of Different Shear Rates
4.2.1. Shear Acoustic Emission Characteristics of Contact Surfaces
When a lateral constraint of 1.0 MPa is applied to the contact surface and the roughness coefficient JRC is 5, the AE event curves of the contact surface under different shear rates are shown in Figure 22. It can be seen from the figure that AE events gradually increase from zero at the initial stage of shear stress application and show an upward trend with the increase in shear rate, which is due to the stress concentration of local particles on the contact surface caused by rapid shear, thus promoting the initiation and propagation of micro-cracks at multiple positions on the contact surface at the same time. The higher the shear rate, the earlier that AE events occur. As the shear continues, convex particles on the contact surface gradually slip and reach the peak shear stress. This is accompanied by the appearance of the peak value of the AE event, and there is an obvious downward trend after the peak shear stress. AE events occur on the contact surface of the combination under different shear rates. Stress rises and falls repeatedly at all stages, which is caused by the uneven rough convex surface of the contact surface during the shear process.
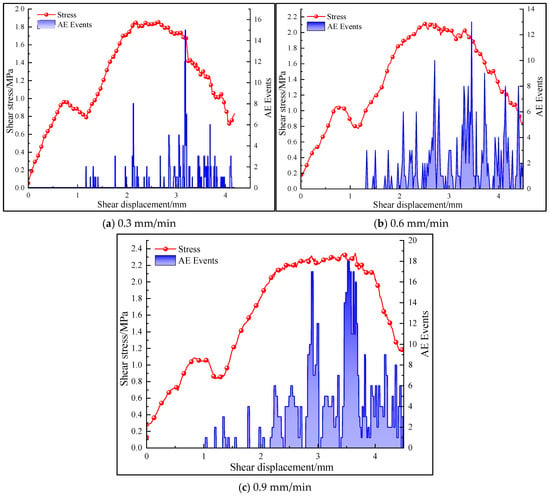
Figure 22.
AE event curves of shear process on contact surface under different shear rates.
AE events on the contact surface first increase and then decrease under three different shear rates, and the total number of AE events increases with the increase in shear rate. When the shear rate is 0.3 mm/min (Figure 22a), the total number of AE events in the whole shear process is small and the distribution is scattered. This is because the particles at the contact surface have enough time to redistribute the stress through slow slip when the shear rate is low, which significantly reduces the local concentration of stress. The number of cracks at the contact surface is small and cracks occur slowly, resulting in the dispersion of AE events. At shear rates of 0.6 and 0.9 mm/min (Figure 22b,c), the total number of AE events increases gradually and the distribution becomes denser with increasing shear rate, reaching its peak at the peak of shear stress–strain curve.
4.2.2. Energy Evolution Law
When a 1.0 MPa lateral constraint is applied to the contact surface and the roughness coefficient JRC is 5, the energy variation curves of the contact surface of the assembly under different shear rates are shown in Figure 23. It can be seen from the figure that the total energy and dissipated energy in the contact surface of the assembly increase with the increase in shear rate, and the total energy increases by 60%. The total energy curves all show a “slow increase (elastic energy storage)-rapid increase (damage accumulation)-stable (residual dissipation)” stage. In the early stage of shear, the accumulation of strain energy and cementation energy is at a very low level. At this time, energy dissipation occurs mainly through the friction between particles at the contact surface, and not much energy is dissipated. As the shear continues, the strain energy and cementation energy of the assembly increase cumulatively, and this cumulative amount increases with the increase in shear rate. In addition, the increase in shear rate increases the friction of the contact surface, which intensifies the initiation and propagation of microcracks. These processes need to overcome frictional resistance and consume energy, resulting in an increase in the total amount of dissipated energy.
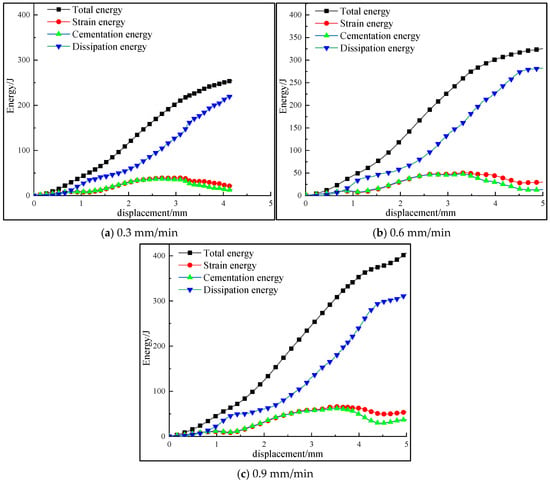
Figure 23.
Energy curves of contact surface during shear process at different shear rates.
4.3. Influence of Different Undulations of Surrounding Rock
4.3.1. Shear Acoustic Emission Characteristics of Contact Surfaces
When the lateral constraint of 1.0 MPa and shear rate of 0.9 mm/min are applied to the contact surface, the AE event change curves during the shear process with contact surfaces with different levels of roughness are shown in Figure 24. It can be seen from the figure that AE events on the contact surface gradually increase from zero at the initial stage of shear stress loading and show an upward trend with the increase in the roughness coefficient of the contact surface, which is due to the stronger mechanical interaction between particles on the contact surface, which leads to more bond fractures on the contact surface. This trend is the same as that of lateral constraint, but the total number of AE events on the contact surface with different roughness values is much larger than that of lateral constraint. With the shear continuing, local particles slip on the contact surface. The peak shear strength of the contact surface is accompanied by the appearance of the AE event peak, and there is an obvious downward trend after the peak shear stress.
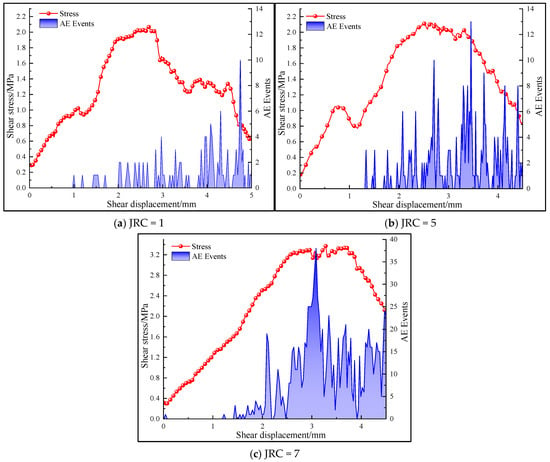
Figure 24.
AE event curves during shear process for contact surfaces with different roughness values.
AE events occur differently on contact surfaces with different roughness coefficients: when JRC is 1, the friction resistance of the contact surface is small, and the contact surface micro-convex body leads to a weak bite strength, so the total number of AE events is small. At the same time, the peak value of AE events occurs after the peak shear stress because the roughness of the interface is small, and the particles transfer stress mainly through sliding rather than meshing, resulting in lower microcrack initiation. Although the shear stress begins to decrease after the peak shear strength, there are still incomplete bonds in the local bumps of the interface, and these bumps experience delayed fracture due to stress concentration due to the subsequent shear, thus AE events continue to occur and reach their peak value. When JRC is 5 and 7, the roughness of the contact surface is higher, and the total number of AE events increases, showing an upward trend.
4.3.2. Energy Evolution Law
When the shear rate is 0.9 mm/min and the lateral constraint is 1.0 MPa, the energy variation curves of contact surfaces with different roughness coefficients during shear are shown in Figure 25. It can be seen from the figure that the energy evolution processes of the contact surfaces are similar under different levels of roughness. In the initial stage of shear, a small amount of bonds between particles in the contact surface are destroyed, and the number of micro-cracks caused by local particle slip on the contact surface is small, so energy is stored in the form of strain energy and bonding energy, and their accumulated amount is small. In this stage, the dissipation of friction energy between particles on the contact surface dominates, and the dissipation energy curve rises. The strain energy and bonding energy of the composite increase cumulatively with the increase in the roughness coefficient of the contact surface, and the dissipation energy curve increases continuously with the increase in the roughness coefficient of the contact surface. At this time, the dissipation energy comes from particle friction and bond fractures between the contact surfaces, and residual friction dominates after cracks penetrate the contact surface.
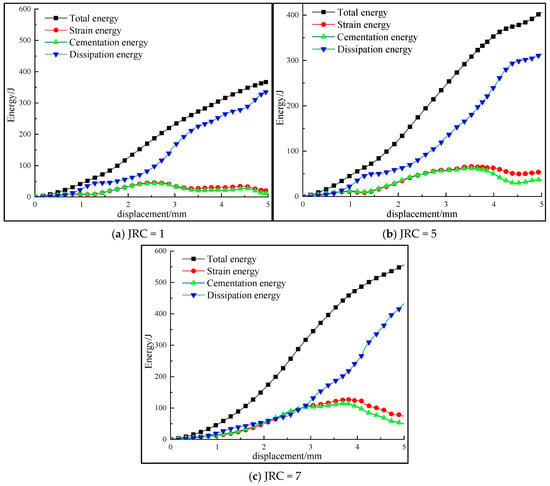
Figure 25.
Curves of energy variation during shear process for contact surfaces with different roughness coefficients.
All kinds of energies increase with the increase in roughness coefficient, and the total energy increases by 57%. When JRC is 7, the contact surface of the assembly still maintains a high energy dissipation level, which is due to the severe friction between meshing micro-protrusions at the contact surface and continuous energy dissipation even if the sliding of surfaces causes penetration of the contact surface.
5. Conclusions
Based on a PFC2D model calibrated at the meso-scale, this study systematically investigates the influence of lateral confinement, shear rate, and interface roughness on the shear behavior of the surrounding-rock–backfill interface. The main conclusions are as follows:
- (1)
- The interface shear process exhibits three typical characteristic stages of “ascent–shearing–slip.” Interface roughness is the determining factor controlling both the peak and residual strength, as well as the failure mode; lateral confinement primarily enhances strength by increasing the normal stress, while the influence of shear rate is relatively minor, manifesting as a slight strengthening effect on strength.
- (2)
- The evolution of the force chain network intuitively reveals the formation process of the shear band. Crack initiation and propagation begin at stress concentration points along the interface, eventually coalescing to form a macroscopic shear band. An increase in roughness significantly aggravates stress concentration and crack propagation near the interface, leading to more severe damage.
- (3)
- Acoustic emission (AE) and energy analysis provide effective indicators for assessing interface damage. A sharp increase in AE events can serve as a precursor warning signal for macroscopic failure of the interface. Energy evolution analysis indicates that the combination of high lateral confinement and high interface roughness can provide more stable frictional energy dissipation during the post-peak slip stage, which is of great significance for stability control in deep mining.
In summary, for practical engineering purposes, prioritizing rock interfaces with higher roughness and applying appropriate lateral confinement is an effective strategy for enhancing the shear resistance and long-term stability of backfill interfaces.
Although the PFC2D software employed in this study offers high computational efficiency, most practical engineering problems are three-dimensional. The failure to fully consider the characteristics of crack propagation and energy evolution in three-dimensional space means that subsequent research should focus on developing three-dimensional models and taking into account the time-varying properties of backfill to more realistically reflect field conditions. Additionally, the backfill in the model was treated as a homogeneous material, without considering the process of actual hydration damage. Future research will focus on 3D modeling and the long-term mechanical behavior of contact interfaces under fluid–solid coupling conditions.
6. Discussion
Through PFC simulations, this study elucidates the combined effects of lateral confinement, shear rate, and interface roughness on the shear behavior of the surrounding rock–backfill interface. The results not only align well with existing macroscopic experimental phenomena but also reveal the underlying physical mechanisms at the meso-scale.
First, the three-stage characteristic of the shear-stress–shear-displacement curve—namely “ascent”, “shearing”, and “slip”—observed in this study is consistent with the phenomena reported by Lu Hongjian et al. [] and Xiu et al. [] in physical direct shear tests. Furthermore, our meso-scale analysis provides deeper insights: The “ascent” stage is primarily governed by elastic deformation and frictional sliding of the granular system at the interface, during which the force chain network progressively adjusts and concentrates toward the interface. The “shearing” stage corresponds to macroscopic failure of bonds, accompanied by a sharp increase in acoustic emission (AE) events and rapid release of strain energy—a stage that aligns with the phase where interfacial cohesion (c-value) plays a dominant role, as described by Manaras et al. []. Finally, in the “slip” stage, the fluctuating residual strength is mainly sustained by friction between unbonded asperities, which corroborates the conclusion of Gao Fuzhou et al. [] regarding the influence of the joint roughness coefficient (JRC) on dilatancy behavior.
Second, the analysis of the entire shear process based on dissipation energy theory offers an energy-based perspective for understanding interface damage. In the initial shear stage, externally input energy is mainly transformed into reversible strain energy; near the peak strength, the energy conversion pattern undergoes a fundamental shift, whereby stored strain energy is released abruptly to drive bond breakage (bond breakage energy) and particle sliding (frictional dissipation energy). This critical point of energy conversion coincides strongly with a steep rise in AE activity, confirming that AE events are direct manifestations of energy dissipation and damage accumulation—a finding consistent with Zhang C et al. [], who used AE to monitor damage evolution. It is particularly noteworthy that under conditions of high lateral confinement and high interface roughness, the system maintains a relatively high level of frictional dissipation energy even during the residual slip stage. This indicates that under such combinations, the interface can continue to dissipate energy through persistent frictional interaction after macroscopic slip occurs, thereby providing stable residual shear resistance. This insight is of great importance for assessing the long-term stability of stopes in deep high-stress environments.
The simulations visually demonstrate that roughness (JRC) is the most critical factor influencing the evolution of these three stages and the ratio of peak to residual strength, as it directly determines the scale and distribution of interfacial “asperities”, thereby controlling the transition of the failure mode from “frictional sliding” to “shearing through asperities.” These findings usefully complement and contrast with those of Guo et al. [] and Xu et al. []. In addition, the strengthening effect of shear rate on peak strength observed in this study may be attributed to the insufficient time available for stress redistribution within the granular system at higher rates, necessitating a higher load to trigger instability. This provides a meso-scale explanation for the mechanical response of interfaces under dynamic disturbance. In contrast to studies focusing on individual factors, this study systematically reveals the coupling effects of the three factors and clarifies their order of influence (roughness > lateral confinement > shear rate). Such a multi-factor coupled analysis makes the conclusions more relevant to complex engineering practice and lays a foundation for developing more accurate interfacial constitutive models in the future.
Author Contributions
P.W.: software, funding acquisition, writing—review and editing; H.H.: data curation, software; H.L.: software, writing—original draft; S.W.: methodology, writing—review and editing; T.Y.: software, funding acquisition. All authors have read and agreed to the published version of the manuscript.
Funding
This work was conducted with support from the The National Natural Science Foundation of China (Grant no. 42402266, 12402482), Natural Science Foundation of Jiangsu Province (BK20230335).
Data Availability Statement
The data used to support the findings of this study are available upon request.
Conflicts of Interest
The authors declare no conflict of interest.
References
- Xue, G.; Yilmaz, E.; Wang, Y. Progress and prospects of mining with backfill in metal mines in China. Int. J. Miner. Metall. Mater. 2023, 30, 1455–1473. [Google Scholar] [CrossRef]
- Zhao, X.; Fourie, A.; Qi, C.C. Mechanics and safety issues in tailing-based backfill: A review. Int. J. Miner. Metall. Mater. 2020, 27, 1165–1178. [Google Scholar] [CrossRef]
- Hai, L.; Bao, R.T.; Tan, S.L.; Fang, X.L. Experimental study on the mechanical properties of layered tailing sand cemented backfill and optimization. Gold Sci. Technol. 2023, 31, 763–772. [Google Scholar]
- Liu, G.; Li, L.; Yang, X.; Guo, L. A numerical analysis of the stress distribution in backfilled stopes considering nonplanar interfaces between the backfill and rock walls. Int. J. Geotech. Eng. 2016, 10, 271–282. [Google Scholar] [CrossRef]
- Fang, K.; Fall, M. Insight into the mode I and mode II fracture toughness of the cemented backfill-rock interface: Effect of time, temperature and sulphate. Constr. Build. Mater. 2020, 262, 120860. [Google Scholar] [CrossRef]
- Wu, W.; Xu, W.; Zuo, J. Effect of inclined interface angle on shear strength and deformation response of cemented paste backfill-rock under triaxial compression. Constr. Build. Mater. 2021, 279, 122478. [Google Scholar] [CrossRef]
- Yang, L.; Hou, C.; Zhu, W.; Li, L. Effect of roughness on shear behavior of interface between cemented paste backfill and rock. Constr. Build. Mater. 2024, 411, 134312. [Google Scholar] [CrossRef]
- Wang, Y.; Lu, H.; Wu, J. Experimental investigation on strength and failure characteristics of cemented paste backfill-rock composite under uniaxial compression. Constr. Build. Mater. 2021, 304, 124629. [Google Scholar] [CrossRef]
- Yu, X.; Kemeny, J.; Li, J.; Song, W.; Tan, Y. 3D Observations of Fracturing in Rock-Backfill Composite Specimens Under Triaxial Loading. Rock Mech. Rock Eng. 2021, 54, 6009–6022. [Google Scholar] [CrossRef]
- Jahanbakhshzadeh, A.; Aubertin, M.; Li, L. Analysis of the Stress Distribution in Inclined Backfilled Stopes Using Closed-form Solutions and Numerical Simulations. Geotech. Geol. Eng. 2018, 36, 1011–1036. [Google Scholar] [CrossRef]
- Lu, H.J.; Mou, C.; Wu, J. Shear mechanical properties and parameter analysis of backfill-boundary medium combination. Met. Mine 2024, 28, 1–18. [Google Scholar]
- Manaras, S. Investigations of Backfill-Rock Mass Interface Failure Mechanisms. Master’s Thesis, Queen’s University, Kingston, ON, Cananda, 2009. [Google Scholar]
- Wu, W.; Liu, G.S.; Guo, L.J.; Fan, C.; Zhang, Z.; Zhang, X. Experimental investigation on interface mechanical properties between cemented paste backfill and rock based on direct shear tests. China Min. Mag. 2019, 28, 116–122. [Google Scholar]
- Guo, S.; Fall, M.; Haruna, S. Interface shear behavior of cementing underground mine backfill. Int. J. Geomech. 2020, 20, 04020230. [Google Scholar] [CrossRef]
- Gao, F.Z.; Zhang, J.Y.; Luo, X.L.; Zhai, K.X.; Zhang, L.; Huang, R.; Wu, X.F. Study on shear mechanical properties and empirical formula of infilled rock joints. J. Geotech. Eng. 2025, 47, 608–617. [Google Scholar]
- Xu, X.; An, N.; Fang, K. Experimental investigation into the temperature effect on the shear behavior of the fiber-reinforced interface between rock and cemented paste backfill. Constr. Build. Mater. 2022, 356, 129280. [Google Scholar] [CrossRef]
- Xiu, Z.; Meng, F.; Wang, F.; Wang, S.; Ji, Y.; Hou, Q. Shear Behavior and Damage Evolution of the Interface Between Rough Rock and Cemented Tailings Backfill. Theor. Appl. Fract. Mech. 2023, 125, 103887. [Google Scholar] [CrossRef]
- Lu, H.J.; Wu, X.J.; Cai, X.S.; Wang, Y.R. Shear strength and failure characteristics of cemented backfill-rock combination. Met. Mine 2023, 97–103. [Google Scholar] [CrossRef]
- Lu, H.J.; Wu, X.J.; Wu, J. Stability evaluation of cemented backfill based on interface characteristics and excavating-filling sequences. Met. Mine 2023, 1–7. [Google Scholar] [CrossRef]
- Li, S.; Xiong, Z.M.; Liu, Y.M.; Li, Z.H. Mechanical property and damage constitution of different thickness of backfill-surrounding rock combination. Sci. Technol. Eng. 2022, 33, 14841–14851. [Google Scholar]
- Zhang, C.; Fu, J.; Song, W.; Kang, M.; Li, T.; Wang, N. Analysis on mechanical behavior and failure characteristics of layered cemented paste backfill (LCPB) under triaxial compression. Constr. Build. Mater. 2022, 324, 126631. [Google Scholar] [CrossRef]
- Cao, S.; Yilmaz, E.; Song, W.; Xue, G. Assessment of Acoustic Emission and Triaxial Mechanical Properties of Rock-Cemented Tailings Matrix Composites. Adv. Mater. Sci. Eng. 2019, 2019, 6742392. [Google Scholar] [CrossRef]
- Yang, X.X.; Jing, H.W.; Tang, C.A.; Yang, S.Q. Effect of parallel joint interaction on mechanical behavior of jointed rock mass models. Int. J. Rock Mech. Min. Sci. 2017, 92, 40–53. [Google Scholar] [CrossRef]
- Cheng, C.; Chen, X.; Zhang, S. Multi-peak deformation behavior of jointed rock mass under uniaxial compression: Insight from particle flow modeling. Eng. Geol. 2016, 213, 25–45. [Google Scholar] [CrossRef]
- Cai, M.; Feng, Z.; Guo, Q.; Yin, X.; Ma, M.; Xi, X. Roughness characterization and shearing dislocation failure for rock-backfill interface. Int. J. Miner. Metall. Mater. 2024, 31, 1167–1176. [Google Scholar] [CrossRef]
- Fu, J.; Zhang, B.W.; Tan, Y.; Wang, J.; Song, W. Study on creep characteristics and damage evolution of surrounding rock and filling body (SR-FB) composite specimens. J. Mater. Res. Technol. 2023, 23, 5382–5399. [Google Scholar] [CrossRef]
- Zhu, A.; Liu, J.; Wu, Z.; Wang, L.; Liu, H.; Xiao, F.; Deng, C. Energy dissipation and damage evolution characteristics of salt rock under uniaxial cyclic loading and unloading tension. Adv. Civ. Eng. 2021, 2021, 6627959. [Google Scholar] [CrossRef]
- Yu, H.; Liu, S.W.; Jia, H.S.; Wang, S. Mechanical response and energy dissipation mechanism of closed single fractured sandstone under different confining pressures. J. Min. Saf. Eng. 2020, 37, 385–393. [Google Scholar]
- Barton, N.R.; Choubey, V. The shear strength of rock joints in theory and practice. Rock Mech. 1977, 10, 1–54. [Google Scholar] [CrossRef]
- Tse, R. Estimating joint roughness coefficients. Int. J. Rock Mech. Min. Sci. Geomech. Abstr. 1979, 16, 303–307. [Google Scholar] [CrossRef]
Disclaimer/Publisher’s Note: The statements, opinions and data contained in all publications are solely those of the individual author(s) and contributor(s) and not of MDPI and/or the editor(s). MDPI and/or the editor(s) disclaim responsibility for any injury to people or property resulting from any ideas, methods, instructions or products referred to in the content. |
© 2025 by the authors. Licensee MDPI, Basel, Switzerland. This article is an open access article distributed under the terms and conditions of the Creative Commons Attribution (CC BY) license (https://creativecommons.org/licenses/by/4.0/).
