Abstract
The downstream process of monoclonal antibodies (mAbs) is expensive and significantly contributes to overall manufacturing costs. One primary reason is the extensive consumption of water and chemicals required for preparing large volumes of various buffers, essential for multiple chromatography and filtration steps. Reducing the water consumption in biopharmaceutical processes is critical to drive down costs and improve sustainability, which can be achieved through the introduction of buffer recycling. In this study, we implemented buffer recycling in an integrated two-step mAb downstream process consisting of a Protein A capture step in a periodic counter-current (PCC) set-up, followed by a mixed-mode polishing step in flowthrough mode. Buffer recycling was implemented during the cleaning-in-place (CIP) phases of the integrated steps, where the CIP buffer from the polishing column was recovered and reused counter-currently in the CIP phase of the capture column. Compared to the reference process without buffer recycling, this approach resulted in 29% savings in CIP buffer, while maintaining product purity within 0.66% and yield within 1.68% of the reference process. These minor differences confirm that buffer recycling can be implemented without compromising product quality. Through buffer recycling, we see significant potential to improve process sustainability in biomanufacturing by conserving water and reducing chemical waste.
1. Introduction
Monoclonal antibodies (mAbs) are one of the leading modalities of the biopharmaceutical industry with an expected market increase from USD 210 billion in 2024 to USD 495 billion by 2030 [,]. The downstream process (DSP) is especially energy- and water-intensive and accounts for 80% of the total manufacturing costs [,,]. A high degree of input material is required for the production of active pharmaceutical ingredients, quantified by the process mass intensity (PMI, required amount of material required for a defined amount of product in kg/kg). For mAbs, PMI values as high as 7000 kg/kg have been reported [,]. The environmental footprint is another concern, with reported carbon emissions reaching 22.7 tons CO2-equivalent per kilogram of mAbs produced [,].
The high costs in mAb DSP are heavily carried by the protein A resin used for mAb capture, which is roughly 50% higher than traditional non-proteinaceous ligands [,,]. Another significant cost driver is the large water consumption, which can constitute up to 95% of all components used in DSP, with reported water requirements of 3000–7000 kg per kg of active pharmaceutical ingredient (API) produced [,,]. Biopharmaceutical DSPs require water of high quality, which is produced by costly and resource-demanding processes like distillation or membrane-based operations. During the DSP, high quality water is used for various purposes, including cleaning of equipment and preparing buffers in large volumes necessary for operating chromatography or filtration steps, and contributes significantly to the process’s environmental footprint [,,]. In a typical mAb process, more than 15 unique buffers are required with a total consumption of 1100–2000 L of buffer per kg of product [].
Buffer supply in biopharmaceutical processes is a highly labor-intensive step that is demanding on infrastructure and resources, accounting for approx. 20% of overall manufacturing costs [,]. Considering the anticipated biopharmaceutical market growth, the large water consumption will presumably become problematic with increasing buffer demands, especially given the global commitment to sustainable development []. There are various contributions showcasing the possibility of reducing the water consumption in mAb downstream processing. The transition from batch to continuous operation reduces buffer consumption by increasing productivity and maximizing capacity utilization, as well as facilitating in-line conditioning with buffers [,,,]. Furthermore, the replacement of stainless-steel tanks with single-use equipment, reduces the need for cleaning-in-place (CIP) operations [,,,]. In our previous work, we implemented a buffer management system that prepares buffer on demand, in a fully automated fashion, reducing both buffer waste and the physical space required for buffer preparation [].
Moreover, buffer consumption can be reduced by means of implementing buffer recycling during chromatography. In our previous publication, we described the recycling of an equilibration buffer during Protein A capture chromatography for mAb purification. Here, the equilibration buffer consumption was reduced by almost 50%, corresponding to more than 10% of the total buffer consumption during the Protein A step, without compromising product yield or quality [].
Special considerations for implementing buffer recycling within biopharmaceutical downstream processing are the choice of buffer that should be recycled and the destination of the recycled buffer. Regarding the destination, it must be ensured that no additional impurities from a preceding unit operation are introduced further downstream in the process []. Regarding buffer selection, as discussed in our previous publication [], wash and regeneration buffers may be unsuitable to recycle due to the risk of impurity accumulation. In addition to the equilibration buffer, the CIP buffer represents a promising option for recycling. It can potentially be reused in the same unit operation or in a preceding unit operation via counter-current recycling, as the impurities present in the used CIP buffer are already present in the preceding process steps [,].
In this work, we applied the concept of buffer recycling within an integrated DSP for mAb purification, consisting of a 3-column Protein A periodic counter-current (PCC) capture step followed by a mixed-mode (MM) polishing chromatography step in flowthrough mode. Building upon the methodology presented in Isaksson et al., 2025 [], this paper extends the concept by (1) investigating a different buffer type, CIP buffer instead of equilibration buffer, (2) implementing buffer recycling without any hold-up tank in an integrated multi-step process rather than a single unit operation, and (3) introducing counter-current buffer recycling, where CIP buffer recovered from the polishing step is reused in the capture step. To assess and evaluate the current implementation of CIP recycling, the DSP was performed with and without CIP recycling, and evaluated based on product yield and quality, as well as impurity profile.
2. Material and Methods
2.1. Biological Material
The mAb used in this work is Trastuzumab, which was produced in a previous study by cultivating a Chinese hamster ovary cell line in a perfusion bioreactor, followed by tangential flow filtration for clarification []. The supernatant was stored at −20˚C and before application, the supernatant was thawed and filtered through a PES, 0.2 µm Spectrum MidiKros hollow fiber module from Repligen (Waltham, MA, USA). The mAb titer of the filtrate was 0.7 g/L.
2.2. Buffers
For the Protein A capture step, the equilibration and wash 1 buffer was 20 mM Na-phosphate, 150 mM NaCl, pH 7.4. Wash buffer 2 was 50 mM Na-acetate, pH 6.0. The elution and regeneration buffer consisted of 50 mM Na-acetate, pH 3.5, and the CIP buffer was 1 M NaOH.
Between the capture and polishing steps, in-line conditioning of the capture eluate was performed with a conditioning buffer consisting of 50 mM Na-phosphate, 240 mM NaCl, pH 10.6, that was mixed in a ratio of 1:1 in order to adjust the pH from approx. 3.5 to 6.2 and the NaCl concentration to 120 mM.
For the MM polishing step, the equilibration buffer was 25 mM Na-acetate, 25 mM Na-phosphate, 120 mM NaCl, pH 6.2; the strip buffer was 0.1 M Hac, pH 3.0; and the CIP buffer was 1 M NaOH.
The running buffer during size-exclusion high-performance liquid chromatography (SE-HPLC) analysis was 20 mM Na-Phosphate, 150 mM NaCl, pH 7.4.
2.3. Downstream Process
The DSP consisted of a 3-column Protein A PCC capture step integrated with an MM polishing chromatography step in flowthrough mode, see Figure 1.
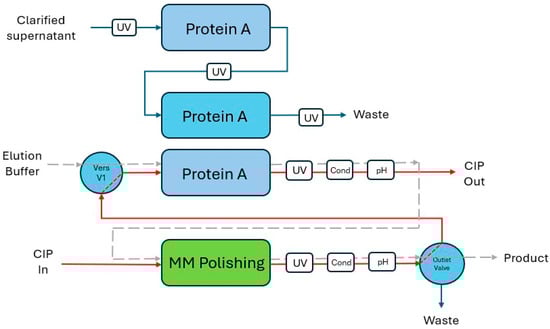
Figure 1.
Schematic illustration of the integration of the protein A capture and mixed-mode polishing steps. Red lines depict flow path of CIP buffer recycling. Grey dashed lines depict flow path during product elution.
This purification protocol was based on previous work from Cytiva (Uppsala, Sweden) and was also investigated in a fully autonomous and continuous mAb downstream process study [,].
2.3.1. Protein A Chromatography
The Protein A capture PCC step was operated on an ÄKTA pcc 75 chromatography system, which was equipped with three 5 mL HiTrap™ MabSelect PrismA™ columns (both system and columns: Cytiva, Uppsala, Sweden). The PCC purification cycle consisted of 10 column volumes (CV) product load (i.e., 50 mL supernatant), 6 CV wash 1, 1 CV wash 2, elution with UV-based pooling (start = 20 mAU; finish = until polishing pooling was completed), 1 CV regeneration, 3 CV CIP, and 5 CV equilibration. The wash 1 phase during the 3-column PCC capture was divided into an interconnected wash of 3 CV, and a batch wash phase of 3 CV.
Flow rates for loading and elution were 0.5 CV/min, for CIP 0.3 CV/min, and for all remaining phases 1 CV/min. Since the PCC capture and polishing chromatography steps were directly integrated, the capture elution flow rate and the conditioning flow rate had to match the load flow rate of the polishing step, which was 1 CV/min combined.
2.3.2. Mixed-Mode Polishing Chromatography
After in-line conditioning through a 3-way port, the conditioned mAb pool was loaded onto the 5 mL HiTrap™ Capto™ Adhere MM column, which was set up on an ÄKTA pure 150 chromatography system (both column and system: Cytiva, Uppsala, Sweden). The MM polishing step was run in flowthrough mode, meaning that capture and polishing columns were eluted simultaneously. The loading phase of the conditioned pool continued until the product was pooled at the ÄKTA pure outlet valve. The pooling was UV-based, and starting at 20 mAU, and ending when 7.5% of the polishing peak maximum height was reached. Following product loading and collection, the ÄKTA pcc system flushed the product flow path between the systems with 10 mL capture elution buffer at a flow rate of 20 mL/min. The remaining phases of the polishing protocol consisted of 4 CV strip, 3 CV CIP, and 5 CV equilibration.
Flow rates used during polishing were 1 CV/min for loading, strip, and equilibration. For CIP, a flow rate of 0.5 CV/min was applied.
2.4. Experiments
In this study, counter-current recycling of CIP buffer from the MM polishing step to the preceding 3-column Protein A PCC capture step was introduced and evaluated. A detailed process diagram can be found in Supplementary Materials (Figure S1).
Two separate experiments were performed, where each experiment consisted of a start-up phase, two full PCC cycles, and a shut-down phase. All eluted capture pools were processed by the integrated polishing step. For details on the start-up, PCC cycles, and shut-down phases, please refer to our previous publication [].
In the first experiment, the integrated purification process was operated without CIP buffer recycling (base case); thus, the capture and polishing systems performed their CIP phases individually. The second experiment was operated with integrated and counter-current recycling of CIP buffer, consisting of a single integrated CIP phase.
2.5. Implementation of CIP Buffer Recycling in the Integrated Purification Process
To enable CIP buffer recycling from the polishing step to the capture step, the ÄKTA pcc standard configuration was altered. A versatile valve (Vers V1) was introduced between the pump wash valve and the column valve of the ÄKTA pcc system. Tubing from the outlet valve of the ÄKTA pure was connected to Vers V1, creating a flow path for buffer recycling between the systems. Figure 1 shows a simplified illustration of the process diagram (Figure S1) of the integrated process set-up.
In contrast to the base case, the second experiment incorporated a single integrated CIP phase. Figure 2 represents the process phases with and without CIP recycling in a Gantt chart.
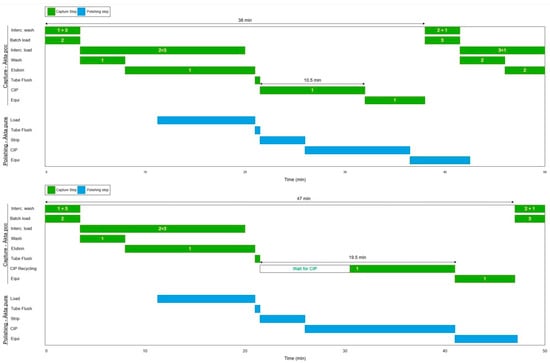
Figure 2.
Gantt chart of the process phases for capture (green) and polishing (blue) units. Top: Base case. Bottom: CIP recycling run. Durations for PCC cycles and CIP phases are indicated.
The CIP recycling phase followed the capture and polishing elution, flushing of the product flow path between systems, and the polishing strip phase. At the start of the integrated CIP phase, the ÄKTA pcc Vers V1 was positioned to receive recycled buffer. The CIP phase on the polishing column commenced with the ÄKTA pure outlet valve directed to waste. Conductivity was monitored in-line before the outlet valve. Once the conductivity reached 85 mS/cm (approx. half of CIP solution’s conductivity), a threshold selected to minimize buffer loss while ensuring sufficiently basic conditions for effective cleaning, the outlet valve position was switched to recycle the CIP buffer to the ÄKTA pcc system. The switch time accounted for the delay volume between the conductivity sensor to the outlet valve. During the integrated CIP phase, two different volumes were tracked. The total CIP buffer volume used in the phase, and the CIP buffer volume that was directed to the ÄKTA pcc system, i.e., recycled CIP buffer volume. The respective pH signals after polishing and capture were monitored as well and showed a slight difference in pH during the respective CIP phases (12.6 and 12.1 for polishing and capture, respectively). This discrepancy may be attributed to dilution effects or sensor-specific variability, such as drift or differences in calibration. The integrated CIP phase was stopped when the recycled CIP buffer volume reached 15 mL (=3 CV). Afterwards, both systems continued with their respective equilibration phases.
2.6. Software and Process Integration with Orbit
For the automation and control of the integrated chromatographic purification process including buffer recycling, the in-house developed research software Orbit (Lund University, Lund, Sweden) was utilized. Orbit is a script-based software written in Python, enabling control and communication between various ÄKTA systems for advanced downstream processing with customized flow paths and control features. Orbit has been employed in multiple studies to automate and control various applications, operating in real-time, where process events are triggered by time or specific conditions [,,,].
2.7. Sample Analysis
CIP and product samples were collected during both experiments (see Table S1). The pH of the CIP samples was adjusted to pH 5–7 with HCl and the resulting sample dilution was documented.
The green- and purple-colored samples in Table S1 were analyzed using SE-HPLC on a BioSep-SEC-S 3000 column from Phenomenex (Torrance, CA, USA). The analysis was conducted on an Agilent 1260 Infinity II HPLC system (Santa Clara, CA, USA) with an autosampler and a diode array detector. Each sample (20 µL) was injected, and the running buffer was pumped through the column at 0.8 mL/min for 20 min, with UV detection at 280 nm. The Agilent raw data was imported into Python, where the antibody content was calculated based on the peak area at 280 nm, assuming an antibody molecular weight of 150,000 Da and an extinction coefficient of 1.4 L g−1 cm−1.
3. Results and Discussion
3.1. CIP Buffer Recycling in an Integrated mAb Downstream Process
Using the integrated two-step purification process, two different experiments were conducted: the base case without CIP buffer recycling and the recycling run with CIP buffer recycling. Figure S2 shows the chromatograms from both runs. In both chromatograms the parallel elution during capture and polishing is visible by the blue polishing peak following the red capture elution peak. When the product was collected after the capture step, the blue polishing product peak was consequently missing, since the material was removed for analysis and not further processed in the polishing step (see Table S1).
The base case included two independent CIP phases for the capture and polishing columns, each lasting 3 CV, resulting in a total consumption of 30 mL CIP buffer per recovery cycle. In contrast, the CIP recycling experiment reutilized the CIP from the polishing system and extended the CIP phase so that the duration of the capture column CIP was also kept at 3 CV. On average, a total CIP volume of 21.3 mL (4.3 CV) was consumed per recovery cycle, leading to a 29% savings in CIP buffer.
For the economic evaluation of the presented counter-current CIP buffer recycling, we would like to refer to our previous work, in which we presented a fully continuous and autonomous lab-scale mAb downstream process that was operated for 5 days and 10 h []. Similarly to the physical set-up of this study, protein A capture and MM flowthrough chromatography were integrated and operated sequentially. In total, 4.25 L of CIP buffers were consumed in that work. Applying the CIP buffer savings achieved in this study on the previous work, a buffer volume of 1.23 L could have been saved.
While the direct chemical cost savings, estimated at approx. USD 0.015 for 1.23 L of 1 M NaOH (based on a price of USD 0.30/kg as of July 2025 []) are modest at lab scale; other factors contribute to the economic and environmental impact. Hence, at industrial scale, buffer preparation and disposal involve significant labor, energy, wastewater treatment costs, as well as floor space, which are significant and not captured in the raw material price alone. Furthermore, buffer recycling reduces water usage, which is a critical sustainability metric.
Moreover, buffer recycling reduces the volume of hazardous waste requiring neutralization and disposal, contributing to lower environmental footprint and regulatory burden. These benefits are even more prominent in large-scale operations, where thousands of liters of buffer are used daily. While scale-up introduces challenges such as buffer routing, contamination control, and validation, the simplicity of the counter-current reuse strategy makes it a promising candidate for industrial implementation with minimal infrastructure changes.
After the integrated CIP phase, the polishing system’s tubing, units, and columns were filled with CIP buffer. In the current process, this CIP buffer was discarded. However, it could be recycled, potentially achieving up to 50% in CIP buffer savings. This can be accomplished by initiating the equilibration phase on the polishing system during the CIP recycling phase, thereby pushing the CIP buffer held up in the polishing system (columns and tubing) to the capture columns. Implementing this would require additional control to ensure that both the polishing and capture columns are subjected to the CIP buffer conditions for the necessary duration.
Figure 3 shows the chromatograms from the two experiments corresponding to the product recovery of the third column in the first PCC cycle.
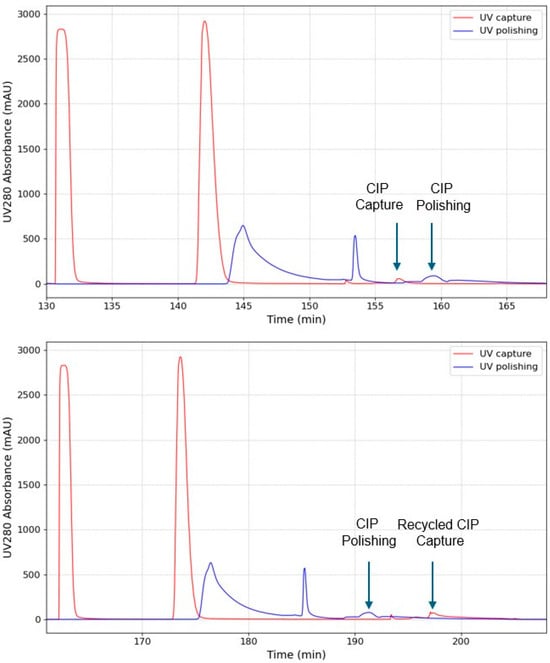
Figure 3.
Extracted chromatograms of the two experiments with individual CIP phases (Top) and with CIP Recycling (bottom). The time range correspond to interconnected wash until equilibration phases of the 3rd column in the 1st PCC cycle. The arrows indicate the peaks eluting during CIP phases.
By comparing the two chromatograms, some differences can be seen. In the base case, the CIP capture peak is followed by the CIP polishing peak. This pattern is reversed in the second experiment, where the polishing CIP peak appears before the capture CIP peak in time, illustrating the integrated CIP phase. The process time is prolonged from 38 to 47 min, which is also illustrated in the process Gantt chart (Figure 2). This is because, instead of performing individual CIPs in parallel, the capture system waits for the CIP from the polishing system during CIP recycling for approx. 9 min. However, process redesign or operational optimization during the implementation of CIP recycling could eliminate this delay. For example, introducing a hold-up tank between the units could eliminate delays by enabling buffer collection during the previous cycle and reuse in the subsequent cycle, thereby removing wait times for the capture column to receive CIP buffer. However, adding a hold-up tank has the drawback of additional equipment requirements, such as cleaning equipment, and the need for more complex control strategies. While buffer recycling can positively impact the environment and reduce manufacturing costs, a deeper analysis is needed to determine the effect on process operability, reduced productivity, and the overall process economics.
3.2. SEC Analysis of Collected Samples
During the two experiments, CIP and product samples were collected and analyzed by SE-HPLC. Samples of the same color (green and purple) were compared between both experiments (see Table S1).
CIP samples from both experiments were analyzed to compare impurity profiles. In Figure 4 the individual CIP samples from the base case are compared to the recycled CIP samples.
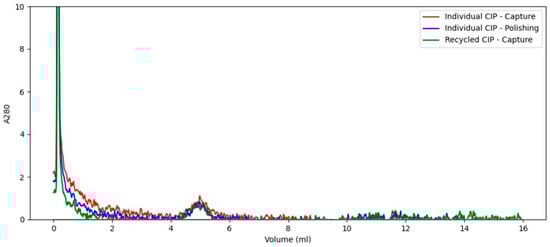
Figure 4.
SE-HPLC chromatogram of individual and recycled CIP samples. The UV spike in the beginning of the analysis originate from a pressure pulse when injecting the sample via the autosampler.
Figure 4 shows that all analyzed CIP samples have similar SE-HPLC profiles, with a single small peak at approximately 5 min, indicating that the same impurities were removed in all CIP phases. The individual CIPs after capture and polishing showed no difference from the recycled CIPs, suggesting no accumulation of impurities during CIP recycling. Impurities present in the recycled CIPs were co-eluted with the product in the previous capture elution phase and bound to the polishing resin operated in flowthrough. Presumably, those impurities did not re-adsorb to the capture column under alkaline conditions during CIP recycling. However, this assumption requires experimental validation under real-world process conditions.
Product samples after capture (green) and after polishing (purple) from both experiments (see Table S1) were analyzed to assess the impact of CIP recycling on product yield and quality. Figure S3 shows a high degree of similarity between the UV280 profiles of the product samples, with their respective peaks nearly perfectly superimposing, indicating no significant effect of CIP recycling on product quality or yield. Additionally, key performance indicators (KPIs) in Table 1 are compared between the base case and CIP recycling run. There are no significant differences in aggregate content (0.2–0.65%), purity (0.39–0.66%), or yield (0.15–1.68%) between the runs, further supporting that CIP recycling does not compromise product yield and quality. Looking at the yield after MM polishing in Table 1, it is considerably low for both experiments with 60.79–60.94%, which is presumably due to the low product load. Recommended sample loads are 50–250 mg/mL resin [], which is well above the applied sample load in this study of 6–7 mg/mL resin.

Table 1.
Calculations of aggregate content, purity and yield after capture and polishing for both experiments based on SE-HPLC chromatograms.
For a more comprehensive evaluation of product quality, future studies should assess the effect of CIP recycling on additional critical impurities, including host-cell proteins, host-cell DNA, endotoxins, and residual NaOH. Notably, the present study did not evaluate the impact of the integrated CIP strategy on subsequent column performance or product quality attributes. Specifically, no comparative assessment was performed on product recovery, impurity clearance, or critical quality attributes following reuse of columns cleaned by either the base case or integrated CIP approach. Likewise, the effect of the modified CIP procedure on Protein A resin properties, such as dynamic binding capacity, ligand integrity, or lifetime, was not investigated. These aspects represent important considerations for long-term implementation.
4. Conclusions
Buffer recycling is a promising concept to reduce water and chemical consumption, thereby lowering the environmental footprint and manufacturing costs in biomanufacturing. This study is an extension of our previous work [], where we investigated buffer recycling within the same unit operation by recycling equilibration buffer during protein A capture chromatography.
In this work, we successfully introduced CIP buffer recycling in a two-step integrated mAb chromatography process by recovering the CIP buffer used to clean the polishing column followed by counter-current reuse upstream during the capture column CIP phase. This approach yielded an average CIP buffer saving of 29%, with the potential to optimize savings up to 50%. The results from the SE-HPLC analyses of CIP and product samples showed that the implementation of buffer recycling did not result in an accumulation of impurities in recycled CIP buffer or significant changes in yield, purity, or product quality. This showcases the potential of buffer recycling to improve process sustainability in biomanufacturing by reducing water usage and chemical waste. The buffer recycling methodology presented serves as an initial proof of concept for CIP recycling within an integrated mAb DSP. It further demonstrates the feasibility of broader implementation across alternative process configurations, including integration between standard platform polishing steps such as anion and cation exchange chromatography. Although the initial evaluation showed that a significant buffer volume can be saved without compromising KPIs, there is a compromise on productivity, since the capture column had to wait for the polishing step to complete its strip phase before recycling could occur. Moreover, the risk of a potential recycling of impurities from the polishing towards the capture column exists; however, we assume that those impurities do not bind under alkaline CIP conditions, which needs to be verified experimentally. Importantly, the economic feasibility of CIP recycling hinges on its safety, since the cost savings from reduced buffer use only outweigh the financial impact of a single batch loss after a very high number of successful recycling cycles. Therefore, ensuring the quality and effectiveness of recycled CIP buffer is not only a technical requirement but a prerequisite for the viability of this approach.
Generally, a more rigorous evaluation on a case-by-case basis is needed, based on the requirements of a particular process, to assess the usefulness of such CIP recycling concepts.
Future studies could extend this investigation to a full downstream process by incorporating longer continuous operations with 20 or more PCC cycles. Such work should include comprehensive impurity profiling, covering host-cell proteins, host-cell DNA, endotoxins, and residual NaOH. In addition, a longer study would allow a deeper assessment of how CIP recycling influences resin performance, lifetime, and product quality attributes over time. Another opportunity is to apply the counter-current buffer recycling strategy to alternative process configurations to evaluate its versatility. Additionally, exploring the use of different buffer types could provide insights into the robustness and adaptability of the approach.
Supplementary Materials
The following supporting information can be downloaded at: https://www.mdpi.com/article/10.3390/pr13113563/s1, Figure S1: Detailed process diagram of integrated capture on Äkta pcc with polishing on Äkta pure systems. Figure S2: Chromatograms for the two integrated purification experiments (Top: No Cip Recycling (base case); Bottom: With CIP Recycling). Red and blue peaks indicate the UV280 signals after the capture and polishing columns, respectively. Figure S3: SE-HPLC chromatograms of product samples with and without recycled CIP, after capture (top) and after polishing (bottom). The UV spikes in the beginning of the analysis originate from a pressure pulse when injecting the sample via the autosampler. Table S1: Sampling scheme for base case and CIP recycling experiments. The green and purple colored samples were analyzed and results compared.
Author Contributions
J.K.L.: Writing—review and editing, Writing—original draft, Visualization, Validation, Software, Methodology, Investigation, Formal analysis, Data curation, Conceptualization. M.I.: Writing—review and editing, Validation, Software, Methodology, Investigation, Formal analysis, Data curation, Conceptualization. B.N.: Writing—review and editing, Supervision, Resources, Project administration, Funding acquisition, Conceptualization. All authors have read and agreed to the published version of the manuscript.
Funding
This project has received funding from the Swedish Agency of Innovation Vinnova through the project AutoADD (Grant No.: 2022-01477) and project BMS3 (Grant No.: 2024-01525) and Competence Centre for Advanced BioProduction by Continuous Processing, AdBIOPRO (Grant No.: 2016-05181).
Data Availability Statement
The raw data supporting the conclusions of this article will be made available by the authors on request.
Conflicts of Interest
The authors declare that they have no known competing financial interests or personal relationships that could have appeared to influence the work reported in this paper.
References
- Alejandra, W.-P.; Irene, J.-P.M.; Antonio, G.-S.F.; Patricia, R.-G.R.; Elizabeth, T.-A.; Aleman-Aguilar, J.P.; Rebeca, G.-V. Production of monoclonal antibodies for therapeutic purposes: A review. Int. Immunopharmacol. 2023, 120, 110376. [Google Scholar] [CrossRef]
- Monoclonal Antibodies Market Size & Share Report. 2030. Available online: https://www.grandviewresearch.com/industry-analysis/monoclonal-antibodies-market (accessed on 19 August 2025).
- Pandey, K.; Pandey, M.; Kumar, V.; Aggarwal, U.; Singhal, B. Bioprocessing 4.0 in biomanufacturing: Paving the way for sustainable bioeconomy. Syst. Microbiol. Biomanuf. 2024, 4, 407–424. [Google Scholar] [CrossRef]
- Liang, C.; Gracida-Alvarez, U.R.; Hawkins, T.R.; Dunn, J.B. Life-Cycle Assessment of Biochemicals with Clear Near-Term Market Potential. ACS Sustain. Chem. Eng. 2023, 11, 2773–2783. [Google Scholar] [CrossRef]
- Demling, P.; Rosenthal, K.; Grünberger, A. Window of sustainable bioprocess operation: Towards merging environmental sustainability assessment and process operation at early-stage bioprocess development. Curr. Opin. Biotechnol. 2025, 93, 103292. [Google Scholar] [CrossRef]
- Madabhushi, S.R.; Gavin, J.; Xu, S.; Cutler, C.; Chmielowski, R.; Rayfield, W.; Tugcu, N.; Chen, H. Quantitative assessment of environmental impact of biologics manufacturing using process mass intensity analysis. Biotechnol. Prog. 2018, 34, 1566–1573. [Google Scholar] [CrossRef] [PubMed]
- Jungbauer, A.; Satzer, P.; Duerauer, A.; Azevedo, A.; Aires-Barros, R.; Nilsson, B.; Farid, S.; Goldrick, S.; Ottens, M.; Sponchioni, M.; et al. Continuous downstream processing. Sep. Purif. Technol. 2024, 338, 126439. [Google Scholar] [CrossRef]
- Partopour, B.; Pollard, D. Advancing biopharmaceutical manufacturing: Economic and sustainability assessment of end-to-end continuous production of monoclonal antibodies. Trends Biotechnol. 2025, 43, 462–475. [Google Scholar] [CrossRef]
- Budzinski, K.; Constable, D.; D’Aquila, D.; Smith, P.; Madabhushi, S.R.; Whiting, A.; Costelloe, T.; Collins, M. Streamlined life cycle assessment of single use technologies in biopharmaceutical manufacture. New Biotechnol. 2022, 68, 28–36. [Google Scholar] [CrossRef]
- Ghose, S.; Hubbard, B.; Cramer, S.M. Binding capacity differences for antibodies and Fc-fusion proteins on protein A chromatographic materials. Biotechnol. Bioeng. 2007, 96, 768–779. [Google Scholar] [CrossRef] [PubMed]
- Follman, D.K.; Fahrner, R.L. Factorial screening of antibody purification processes using three chromatography steps without protein A. J. Chromatogr. A 2004, 1024, 79–85. [Google Scholar] [CrossRef]
- Neves, C.P.G.; Coffman, J.L.; Farid, S.S. Evaluating end-to-end continuous antibody manufacture with column-free capture alternatives from economic, environmental, and robustness perspectives. Biotechnol. Prog. 2024, 40, e3427. [Google Scholar] [CrossRef]
- Grote, F.; Ditz, R.; Strube, J. Downstream of downstream processing: Development of recycling strategies for biopharmaceutical processes. J. Chem. Technol. Biotechnol. 2012, 87, 481–497. [Google Scholar] [CrossRef]
- Ho, S.V.; McLaughlin, J.M.; Cue, B.W.; Dunn, P.J. Environmental considerations in biologics manufacturing. Green Chem. 2010, 12, 755–766. [Google Scholar] [CrossRef]
- Cataldo, A.L.; Sissolak, B.; Metzger, K.; Budzinski, K.; Shirokizawa, O.; Luchner, M.; Jungbauer, A.; Satzer, P. Water related impact of energy: Cost and carbon footprint analysis of water for biopharmaceuticals from tap to waste. Chem. Eng. Sci. X 2020, 8, 100083. [Google Scholar] [CrossRef]
- Satzer, P. A risk-aware assessment for buffer recycling across unit operations for monoclonal antibody purification and its potential. Biochem. Eng. J. 2024, 201, 109140. [Google Scholar] [CrossRef]
- Gibson, K.; Oliveira, J.C.; Ring, D. Evaluation of the Impact of Buffer Management Strategies on Biopharmaceutical Manufacturing Process Mass Intensity. Processes 2023, 11, 2242. [Google Scholar] [CrossRef]
- Gibson, K.; Oliveira, J.C.; Ring, D. Optimisation of biopharmaceutical buffer management to maximise the benefits of inline preparation systems. Results Eng. 2025, 25, 104080. [Google Scholar] [CrossRef]
- Ding, C.; Ardeshna, H.; Gillespie, C.; Ierapetritou, M. Process design of a fully integrated continuous biopharmaceutical process using economic and ecological impact assessment. Biotechnol. Bioeng. 2022, 119, 3567–3583. [Google Scholar] [CrossRef]
- THE 17 GOALS | Sustainable Development. Available online: https://sdgs.un.org/goals (accessed on 14 April 2025).
- Konstantinov, K.B.; Cooney, C.L. White Paper on Continuous Bioprocessing May 20–21 2014 Continuous Manufacturing Symposium. J. Pharm. Sci. 2015, 104, 813–820. [Google Scholar] [CrossRef]
- Jungbauer, A. Continuous downstream processing of biopharmaceuticals. Trends Biotechnol. 2013, 31, 479–492. [Google Scholar] [CrossRef]
- Klutz, S.; Magnus, J.; Lobedann, M.; Schwan, P.; Maiser, B.; Niklas, J.; Temming, M.; Schembecker, G. Developing the biofacility of the future based on continuous processing and single-use technology. J. Biotechnol. 2015, 213, 120–130. [Google Scholar] [CrossRef]
- Gjoka, X.; Gantier, R.; Schofield, M. Transfer of a three step mAb chromatography process from batch to continuous: Optimizing productivity to minimize consumable requirements. J. Biotechnol. 2017, 242, 11–18. [Google Scholar] [CrossRef]
- Sarkis, M.; Fyfe, A.T.; Kontoravdi, C.; Papathanasiou, M.M. Towards a Net Zero, socially sustainable and eco-efficient biopharma industry: How far are we? Curr. Opin. Chem. Eng. 2024, 44, 101027. [Google Scholar] [CrossRef]
- Lopes, A.G. Single-use in the biopharmaceutical industry: A review of current technology impact, challenges and limitations. Food Bioprod. Process. 2015, 93, 98–114. [Google Scholar] [CrossRef]
- Frank, G.T. Transformation of biomanufacturing by single-use systems and technology. Curr. Opin. Chem. Eng. 2018, 22, 62–70. [Google Scholar] [CrossRef]
- Isaksson, M.; Gomis-Fons, J.; Andersson, N.; Nilsson, B. An automated buffer management system for small-scale continuous downstream bioprocessing. J. Chromatogr. A 2023, 1695, 463942. [Google Scholar] [CrossRef]
- Isaksson, M.; Andersson, N.; Nilsson, B. Improving the sustainability of biopharmaceutical downstream processing through buffer recycling. J. Chromatogr. A 2025, 1740, 465545. [Google Scholar] [CrossRef] [PubMed]
- Schwarz, H.; Gomis-Fons, J.; Isaksson, M.; Scheffel, J.; Andersson, N.; Andersson, A.; Castan, A.; Solbrand, A.; Hober, S.; Nilsson, B.; et al. Integrated continuous biomanufacturing on pilot scale for acid-sensitive monoclonal antibodies. Biotechnol. Bioeng. 2022, 119, 2152–2166. [Google Scholar] [CrossRef]
- Cytiva. Optimization of a Two-Step Purification Method for Bispecific Antibodies. Available online: https://www.cytivalifesciences.com/en/us/insights/bispecific-antibodies-purification-in-two-steps?srsltid=AfmBOoq6wwqeSCCYZSA_DnUyN9DEpIDRhEbX6IOSju-Cd2IZytX65ag0 (accessed on 9 September 2024).
- Isaksson, M.; Espinoza, D.; Lorek, J.K.; Sondell, M.; Nilsson, B. Autonomous operation and quality monitoring of a continuous antibody downstream process. J. Chromatogr. A 2025, 1757, 466157. [Google Scholar] [CrossRef]
- Gomis-Fons, J.; Löfgren, A.; Andersson, N.; Nilsson, B.; Berghard, L.; Wood, S. Integration of a complete downstream process for the automated lab-scale production of a recombinant protein. J. Biotechnol. 2019, 301, 45–51. [Google Scholar] [CrossRef]
- Andersson, N.; Löfgren, A.; Olofsson, M.; Sellberg, A.; Nilsson, B.; Tiainen, P. Design and control of integrated chromatography column sequences. Biotechnol. Prog. 2017, 33, 923–930. [Google Scholar] [CrossRef] [PubMed]
- Andersson, N.; Fons, J.G.; Isaksson, M.; Tallvod, S.; Espinoza, D.; Sjökvist, L.; Andersson, G.Z.; Nilsson, B. Methodology for fast development of digital solutions in integrated continuous downstream processing. Biotechnol. Bioeng. 2023, 121, 2378–2387. [Google Scholar] [CrossRef] [PubMed]
- Sodium Hydroxide Price Index-Businessanalytiq. Available online: https://businessanalytiq.com/procurementanalytics/index/sodium-hydroxide-price-index/ (accessed on 28 July 2025).
- HiTrapTM CaptoTM Adhere Columns | Cytiva. Available online: https://www.cytivalifesciences.com/en/us/shop/chromatography/prepacked-columns/multimodal/hitrap-capto-adhere-p-00468 (accessed on 19 August 2025).
Disclaimer/Publisher’s Note: The statements, opinions and data contained in all publications are solely those of the individual author(s) and contributor(s) and not of MDPI and/or the editor(s). MDPI and/or the editor(s) disclaim responsibility for any injury to people or property resulting from any ideas, methods, instructions or products referred to in the content. |
© 2025 by the authors. Licensee MDPI, Basel, Switzerland. This article is an open access article distributed under the terms and conditions of the Creative Commons Attribution (CC BY) license (https://creativecommons.org/licenses/by/4.0/).