Article

Intelligent ANN-Based Controller for Decentralized Power Grids’ Load Frequency Control

1
Department of Electrical Engineering, National Institute of Technology, Patna 800005, Bihar, India
2
Department of Electronics and Communication Engineering, University College of Engineering and Technology, Hazaribag 825319, Jharkhand, India
*
Author to whom correspondence should be addressed.
Processes 2025, 13(11), 3562; https://doi.org/10.3390/pr13113562
Submission received: 10 September 2025 / Revised: 24 October 2025 / Accepted: 29 October 2025 / Published: 5 November 2025

Abstract

In this study, the authors demonstrate the development and evaluation of an optimal frequency control controller for an interlinked two-area power system that incorporates Renewable Energy Sources (RESs). In decentralized power grids, the Load Frequency Control (LFC) system allows scheduled tie-line power as well as system frequency to be reimposed to their nominal values. Designing an advanced controller might enhance the functionality of the LFC mechanism. This article illustrates the possible impacts of converter capacitors using the new High-Voltage Direct Current (HVDC) tie-line model as well as the Inertia Emulation Technique (IET). This paper suggests a new adaptive control procedure for the expected LFC mechanism: an ANN-based (PIλ + PIλf) controller. The authors evaluate which control parameters are most effective using a modified version of the Quasi-Opposition-learning-based Reptile Search Algorithm (QORSA) method. Software called MATLAB/Simulink-2015 is used to create this arrangement. The use of established techniques for handling step as well as random load disturbances has enabled an evaluation of the suggested LFC architecture’s efficacy. An IET-based HVDC tie-line reduces overshoot by 100% in Areas 1 and 2 (Area 1 frequency deviation, i.e., ∆f1, as well as Area 2 frequency deviation, i.e., ∆f2). When considering SLD, the suggested controller outperforms the most widely used alternative settings. The IEEE-39 bus system has been changed by the addition of RESs. The IEEE-39 bus system is composed of three control areas. It is confirmed how the IEEE-39 bus system reacts to changes in frequency in Areas 1, 2, and 3. It is illustrated how to use the suggested controller in the modified IEEE-39 bus system, accompanied by real-time load variations. Recent research indicates that the suggested control method is better and more efficient due to its 100% decrease in overshoot in Areas 1 and 2 and quick response time.

1. Introduction

1.1. General Background

Contemporary electrical power system infrastructure is composed of several interconnected generating power units. One of the many factors that might result in inefficient power system operations is an imbalance between total generation as well as load demand. One challenging issue that load frequency control may help with is maintaining the prescribed levels of tie-line power as well as system frequency during both regular and irregular operating conditions. The latter problem is a significant barrier in the context of LFC and has yet to be resolved [1,2]. Recent decades have seen the publication of numerous research studies on unified LFC power networks, which supply electricity to numerous areas.

1.2. Literature Review

The literature [3] has highlighted the traditional methods used and the future challenges for frequency regulation studies. In [4], the authors discuss the frequency regulation of multi-area power plants using the LFC mechanism. The study addressed important areas of research on LFC issues in restructured power systems [5]. In a literature survey report, the present concepts and potentials of the power system, including distributed generation, were detailed [6,7]. With the help of an improved Opposition-based Sea-Horse Optimization (OSHO) technique, the FODs of optimization approaches are demonstrated and contrasted with a number of contemporary optimization procedures [8]. In the publication, LFC was analyzed using a PID controller [9]. In hybrid renewable power systems, a robust PID controller has been developed to enhance frequency deviations [10]. In the study, LFC was evaluated using a modified TID controller [11]. Arya Y. [12] controls the frequency used in modern fuzzy fractional-order FOPI-FOPDN controllers. Using a TDF-TIDF controller enhanced the load frequency controller’s performance [13]. The FOPI-FOPIDN’s parameters are improved by the use of ADIWACO, a variation of Particle Swarm Optimization (PSO) seen in the literature [14]. FO-hPID-fuzzy PID controllers and the hPSO-MSC algorithm have been applied in LFC investigations [15]. The Tri-parametric Fractional Controller (TFC) successfully tackles important issues in dual-area thermal power systems, such as cybersecurity risks as well as network latency [16]. In order to investigate the idea of LFC, research [17,18,19,20] has employed a power system that integrated conventional as well as renewable energy sources. An investigation into creating a fuzzy-logic-based controller was conducted [21,22]. The ANN-based controller was used to evaluate LFC [23,24]. Another paper examined low-SAR design [25]. This review is summarized in Table 1.

1.3. Motivation and Research Gap

The assessment pointed out a number of research gaps that need more investigation, e.g., controlling ANN-based controllers with a large number of parameters is quite difficult. Modern situations could be too much for ANN-based PI controllers alone, underscoring the necessity for effective combinations. The control methods examined in the referenced publications have limited their broader applicability because of their exclusive focus on traditional two-area systems. Metaheuristic algorithms used in these studies often fail to find globally optimal answers. These gaps underscore the need for further comprehensive studies to surpass the limitations of ANNs, develop trustworthy controller integrations, and expand studies to encompass a range of system configurations.
Recent advancements in LFC employing fractional-order, fuzzy, and classical PID controllers are prominently highlighted in the literature review. Artificial neural network controllers are efficient in managing multi-area power systems’ nonlinearities. PIλ as well as PIλf controllers have advantages over integer-order controllers, such as reduced overshoot, enhanced transient response, and flexibility. A comparison of the suggested QORSA framework with metaheuristic optimization techniques (such as WOA, VPL, and salp swarm) emphasizes the latter’s better robustness and convergence. Our study introduces a parallel ANN-based (PIλ + PIλf) controller optimized via QORSA. Unlike previous work, this controller simultaneously leverages adaptive learning, fractional-order dynamics, and quasi-oppositional optimization to achieve faster response, improved stability, and superior performance in various deregulated power system scenarios, including PBT, BBT, CVT, and high RES penetration conditions.

1.4. Contributions

The preferred controller for a decentralized multi-source, two-area thermal power plants, hydro power plants, and gas power plants is ANN-based (PIλ + PIλf), and researchers are investigating it. The operation of an IET-based HVDC-linked power system is also examined through a few case studies. The proposed ANN-based adaptive fractional-order (PIλ + PIλf) controller, optimized using the Quasi-Oppositional Reptile Search Algorithm (QORSA), contributes not only to the improvement of Load Frequency Control (LFC) performance but also to the advancement of resilient and intelligent control strategies required for future renewable-dominated decentralized grids. Specifically:
  • The proposed method enhances frequency stability under the intermittent and stochastic behavior of Renewable Energy Sources (RESs), such as wind and solar, which lack inherent inertia.
  • By incorporating the Inertia Emulation Technique (IET) within the HVDC tie-line framework, the study offers a practical pathway to synthetic inertia integration, a crucial requirement in low-inertia renewable power systems.
  • The intelligent ANN structure enables adaptive self-tuning of controller parameters, reducing reliance on manual retuning and improving autonomy and resilience in large-scale smart grids.
  • The multi-area, multi-source configuration (thermal–hydro–gas–RES integrated IEEE-39 bus system) demonstrates the controller’s ability to maintain dynamic stability and power-sharing coordination in decentralized, deregulated energy markets.

1.5. Limitations and Possible Extensions of the Proposed Method

ANN-based (PIλ + PIλf) LFC controllers with IET, HVDC modeling, and QORSA have drawbacks, including computational complexity, reliance on massive datasets for training, the possibility of overfitting, and the requirement for reliable training to manage erratic power system situations, such as cyberattacks and the integration of renewable energy sources. Nonlinear dynamics, renewable intermittency, and communication delays challenge the real-world deployment of a controller and can cause instability, lower performance, and the need for adaptive or resilient control solutions. Nonlinearities, such as the fluctuating behavior of loads, necessitate more intricate modeling than what is possible with linear assumptions. Due to the latency caused by communication delays, exact real-time control is difficult and may result in oscillations or instability. The controller must efficiently integrate these varied inputs and manage grid stability due to the intermittent nature of renewable energy sources like solar as well as wind power, frequently with the aid of energy storage devices. The future holds the potential to create more sophisticated, robust, and self-tuning ANN architectures; integrate deep learning to better manage system complexity; use hybrid approaches with energy storage and microgrid technologies; and strengthen their resistance to cyberattacks using cutting-edge training techniques.

1.6. Paper Organization

The remaining portions of the article are structured as follows: the tested system is discussed. The next section provides a thorough discussion of the optimization algorithm, controller structure, as well as underlying theory. The findings and discussion parts provide the inquiry cases, corresponding results, supporting information, as well as mathematical analysis. An example of the general conclusions is provided in the last section.

2. Examined System

2.1. Experimental System Modeling

The viability of building a thermal power plant, a hydro power plant, or a gas power plant that would provide electricity to two different regions in a decentralized energy market is examined in this study. At 4000 megawatts, Area 2 has twice the power generation capability of Area 1. Area 1 can handle 2000 MW. There are 2 Generation Companies (GENCOs) as well as two Distribution Companies (DISCOs) in each area. Both of these (GENCO 1 as well as GENCO 3) rely on the thermal and gas power plants as their main source of power. A hydroelectric facility (GENCO 4) and a thermal power plant (GENCO 2) produce the energy for the first two power sectors. To establish contracts or relationships between GENCOs as well as DISCOs, the Independent System Operator (ISO) uses a bidding process. This is accomplished through a process called competitive bidding. These stations are connected using a parallel AC-HVDC tie-line system. Figure 1 [24] displays the schematic structure of the system that is being explained.
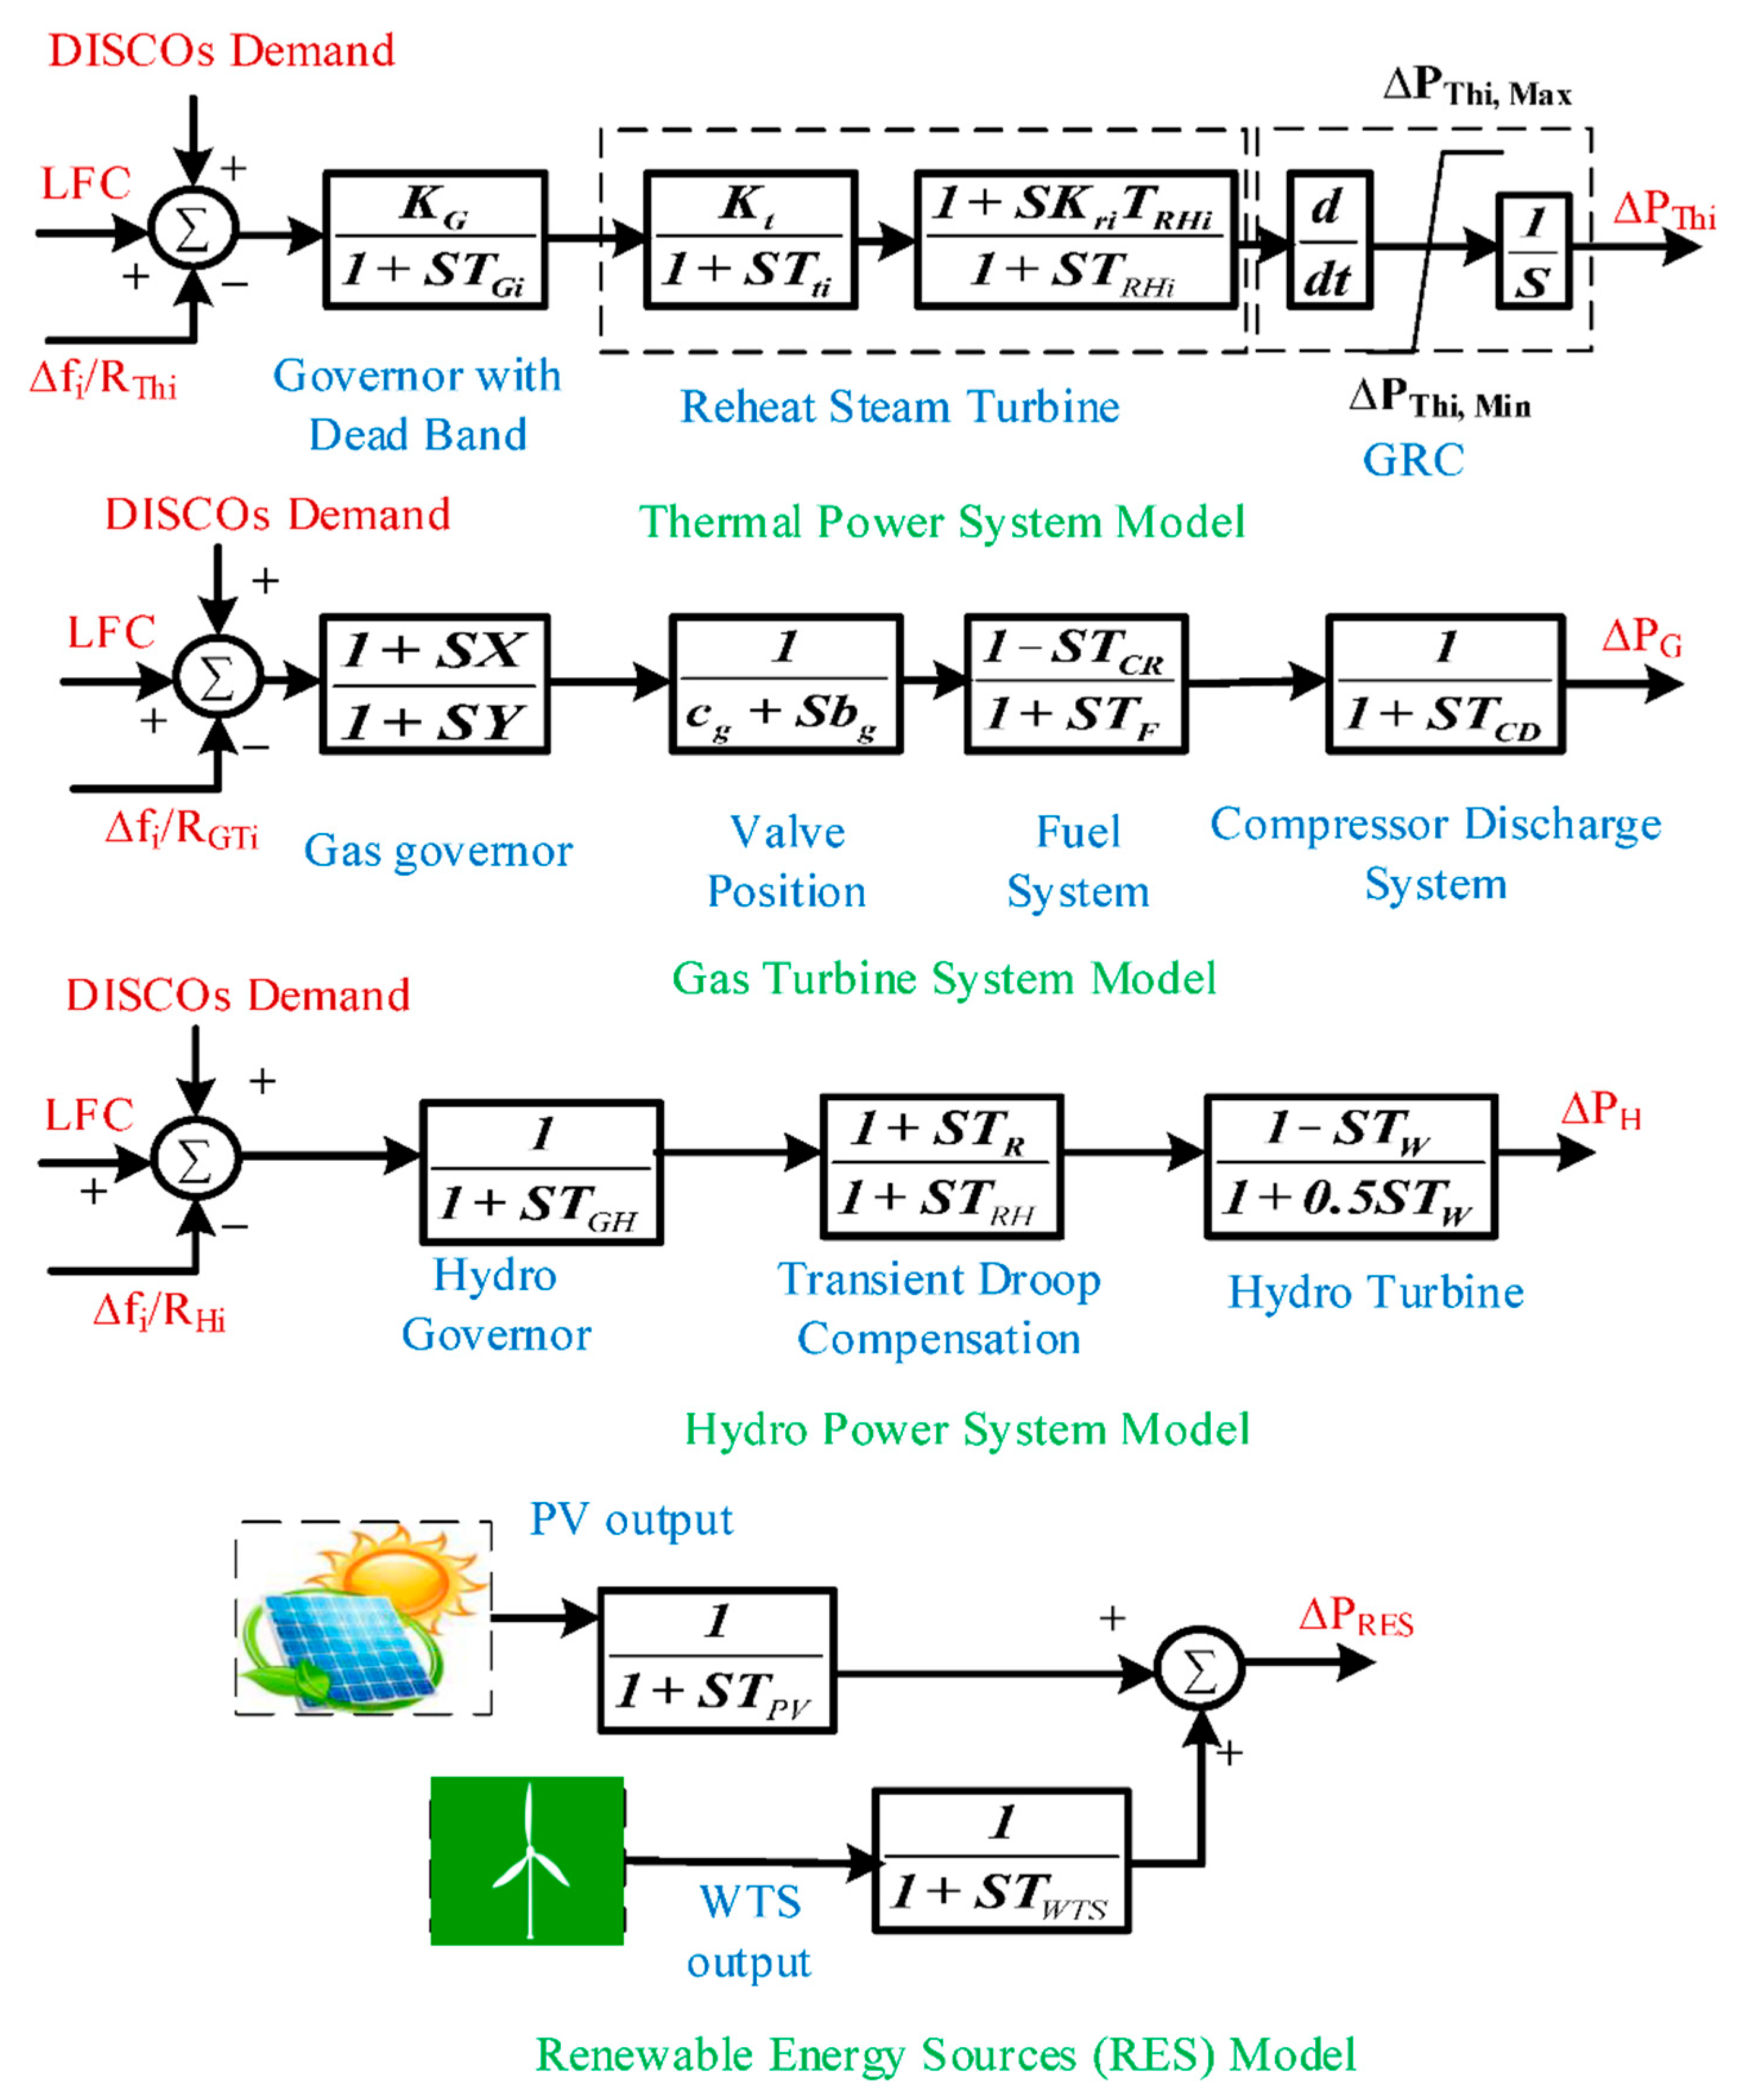
Figure 2 [24] and Figure 3 illustrate two mathematical models of the interlinked system and individual GENCOs, respectively, to illustrate the concepts in this study. In order to limit the rate of power output, thermal power systems are increasingly using Generation Rate Constraint (GRC) nonlinearity. The ANN-based (PIλ + PIλf) controller is employed to maintain stability over time. A modified IET-based HVDC tie-line model is used for simulation experiments in order to better comprehend the substantial influence on the system’s dynamic behavior.

2.2. Performance Index as Well as Objective Function

The governor can control frequency as well as tie-line power exchange when the active power generated and consumed are out of balance. After the power imbalance has been corrected at the producing level by establishing a new balancing point, a secondary LFC controller restores the tie-line power as well as frequency. By altering the strategy’s control parameters, the QORSA increases the LFC’s efficacy. The optimization method uses these Objective Functions (OFs) to determine the optimal controller settings.
O F I A E = 0 t   Δ f i + Δ P t i e , i j d t O F I S E = 0 t   Δ f i 2 + Δ P t i e , i j 2 d t O F I T A E = 0 t   Δ f i + Δ P t i e , i j × t s d t O F I T S E = 0 t Δ f i 2 + Δ P t i e , i j 2 × t s d t  
where i and j are the area numbers.

3. IET-Based AC-HVDC Tie-Line Modeling

3.1. Model Investigation of the AC-HVDC Tie-Line Utilizing IET

The inherent inertia of synchronous generators is frequently absent from RESs, especially wind and solar, which causes frequency variations to occur more quickly and significantly following disturbances. IETs simulate the inertial response of synchronous machines by regulating power converters or utilizing Energy Storage Systems (ESSs) to introduce virtual inertia into the system. By doing this, the Rate of Change of Frequency (RoCoF) is slowed down, and other control systems have more time to react. IETs can enhance the system’s transient reaction to disruptions, like load variations or generator trips, by simulating inertia, which will result in a more stable and dependable functioning. The shift to a cleaner energy mix can be facilitated by power systems accommodating increasing levels of RES penetration without sacrificing frequency stability through efficient inertia emulation. Parallel AC-HVDC transmission line topology has grown in popularity during the last few decades. This strategy lowers losses while boosting transfer capacity. This is a significant conclusion, as the LFC study’s main goal is a minimal tie-line power exchange. LFC is affected by AC-HVDC tie wires connected in parallel. The model lacks parameter computations and numerical expressions. Consequently, it employs the proper mathematical terminology to investigate an accurate HVDC model. This procedure is the same as the one utilized to create AC-HVDC models with the IET. Synchronization coefficients must be established to create an AC-HVDC tie line.

3.2. Compute the Associated Tie-Line Synchronization Coefficients

Two separate capacity areas are defined by the test system: one with a 2000 MW capacity and the other with a 4000 MW capacity. Figure 1 shows the parallel AC-HVDC tie-line system’s ends. The capacity of the AC and HVDC connect lines to transmit up to 200 MW and 600 MW of energy, respectively, is assumed. To demonstrate HVDC power electronic converters, the voltage sources E1 < θ1 and E2 < θ2 are connected in series with the reactances X1 and X2. The bus voltages for the first and the second areas are denoted by the symbols V1 < θ1 and V2 < θ2, respectively. Figure 4 uses these components to illustrate an electrical equivalent circuit. Power flow over both AC and HVDC tie-lines must be linearized using Equations (2) and (3).
Δ P t i e , A C = 2 π T t i e , A C s ( Δ f 1 Δ f 2 )
Δ P t i e , D C = 2 π T t i e , D C s ( Δ f 1 Δ f 2 )
For AC and HVDC, the matching coefficients for tie-line synchronization are Ttie,AC and Ttie,DC.
T t i e ˙ , A C = P A C , m a x P rated c o s ( δ 1 δ 2 )
T tie , D C = T D C 1 × T D C 2 T D C 1 + T D C 2
where
T D C 1 = P D C , m a x P rated , 1 c o s ( δ 1 θ 1 ) , T D C 2 = P D C , m a x P r a t i d , 2 c o s ( δ 2 θ 2 )
To determine the synchronization coefficient, a 50% loaded AC tie-line is assumed.
s i n ( δ 1 δ 2 ) = P tie , A C P A C , max = 100 200 = 0.5 ; ( δ 1 δ 2 ) = 30
T tie , A C = 0.0867
The coefficient for the fifty percent loaded HVDC tie-line synchronization, for instance, was calculated as follows:
s i n ( δ 1 θ 1 ) = s i n ( δ 2 θ 2 ) = P t i e , D C P D C , m a x = 300 600 = 0.5
Since the claimed capabilities of the two areas are equal,
TDC1 = 0.2598; TDC2 = 0.1299
T t i e ˙ , D C = T D C 1 × T D C 2 T D C 1 + T D C 2 = 0.0866
Coefficients for HVDC tie-line synchronization can be computed for various loading conditions.

3.3. Using HVDC Tie-Lines with the IET

The HVDC converters’ DC capacitors allow for frequency variations. For LFC, this article depicts one type of strategy. The charging equation may be demonstrated to work with a DC capacitor (CDC) that has a rated capacity of SDC and an operating voltage of VDC.
n C D C V D C d d t Δ V D C = P i n P out   = P tie ,   D C
This is the linearized expression (8) per unit:
( n C D C S D C ) V D C d d t Δ V D C = Δ P tie , D C
The swing Equation (10) for the synchronous machine is used rather than the capacitor charging equation.
( 2 H f o ) d d t ( Δ f ) = Δ P m Δ P e = Δ P S M
The use of Equations (9) and (10) can articulate it.
( n C D C S D C ) V D C d d t Δ V D C = ( 2 H f 0 ) d d t ( Δ f )
It is possible to obtain the voltage fluctuation formula in (11) by applying the Laplace transformation.
Δ V D C ( s ) = ( 2 H s n C D C f o ( V D C ) 2 ) Δ f ( s )
The relationship between charging voltage variation and frequency is explained by this equation. Multiplying the tie-line current by the observed voltage yields the power-reference signal. The HVDC tie-line load condition can be used to assign the value “I”. Because of the 50% loading, “I” is set to 0.5. In Figure 5 [24], the IET for the transferring function simulation is further explained.

4. Deregulation for Proposed LFC

ISO uses competitive bidding to determine the supply–demand relationship in the current decentralized electricity markets, and the highest bidders will consult and submit offers to both GENCO and DISCO [27]. The parties will use A DISCO Participation Matrix (DPM) to conduct LFC investigations, with the CPF for the applicable GENCO contract provided in each DPM entry. Each testing area has two DISCOs and two GENCOs. For example, using the DPM:
D P M = c p f 11 c p f 12 c p f 13 c p f 14 c p f 21 c p f 22 c p f 23 c p f 24 c p f 31 c p f 32 c p f 33 c p f 34 c p f 41 c p f 42 c p f 43 c p f 44
A DPM is composed of GENCO rows and DISCO columns. Consequently, deliberate delegations of jurisdictional authority are known as
Δ P tie , s c h = P E P I
PE minus PI is the quantity of electricity exported or electricity exported less electricity imported. The following is another way to express the tie-line:
Δ P tie ,   error = Δ P tie ,   act Δ P tie , s c h
The actual tie-line power due to AC-IET technology for HVDC tie-lines is as follows:
Δ P tie ,   act = ( Δ P tie ,   DC Δ P IET , 1 a 12 Δ P IET ,   2 ) + Δ P tie ,   AC
The resulting Area Control Error (ACE) is described using the following equation, which serves as a reference for the input from the controllers:
A C E = B i Δ f i + Δ P tie ,   error
Unrestricted trades include bilateral, poolco-based, as well as hybrid transactions. As demand changes, the local PBT power plants adjust. Together, the associated GENCOs created the BBT load-type switch. PBT and BBT types can be combined to examine a variety of situations more thoroughly.

5. Techniques for Controller and Optimization Proposed

5.1. The (PIλ + PIλf) Controller Based on ANN

Biological neural networks and Artificial Neural Networks (ANNs), a subclass of specialized data-handling networks, are intended to function similarly. In a typical configuration, the neurons act in tandem to complete their jobs. This structure is packed with neurons. In an artificial neural network, two neurons form “connecting links”, which interconnect the other neurons. Because of their assigned significance, these interconnected nodes stand in for the particular data that makes up the input signal. Changing the weight by backpropagation is the only way to solve this challenging problem. An ANN-based closed-loop (PIλ + PIλf) controller is shown in Figure 6, which includes this distinctive feature.
The authors make an effort to minimize the inaccuracy of their work because it could be interpreted as a result of the discrepancy between the actual and projected rates of outlier occurrences. To find out the optimal (PIλ + PIλf) gains for the system (the ANN has output), the neural network’s connection weights can be iteratively updated using the backpropagation technique. The only way to achieve this is to significantly reduce the speed. The ANN can produce results even if it has not been trained. The neural network’s parameters are taught to the controller via the backpropagation technique. The study employs a three-layer ANN trained using the backpropagation algorithm, where connection weights are iteratively optimized using a suitable learning rate and inertia terms. The tuning of these parameters directly influences error minimization, controller adaptability, and frequency stability in the power system, leading to faster settling times, reduced overshoot, and improved dynamic performance. Table 2 shows the summary of the performance of the ANN.

5.2. Backpropagation Algorithm

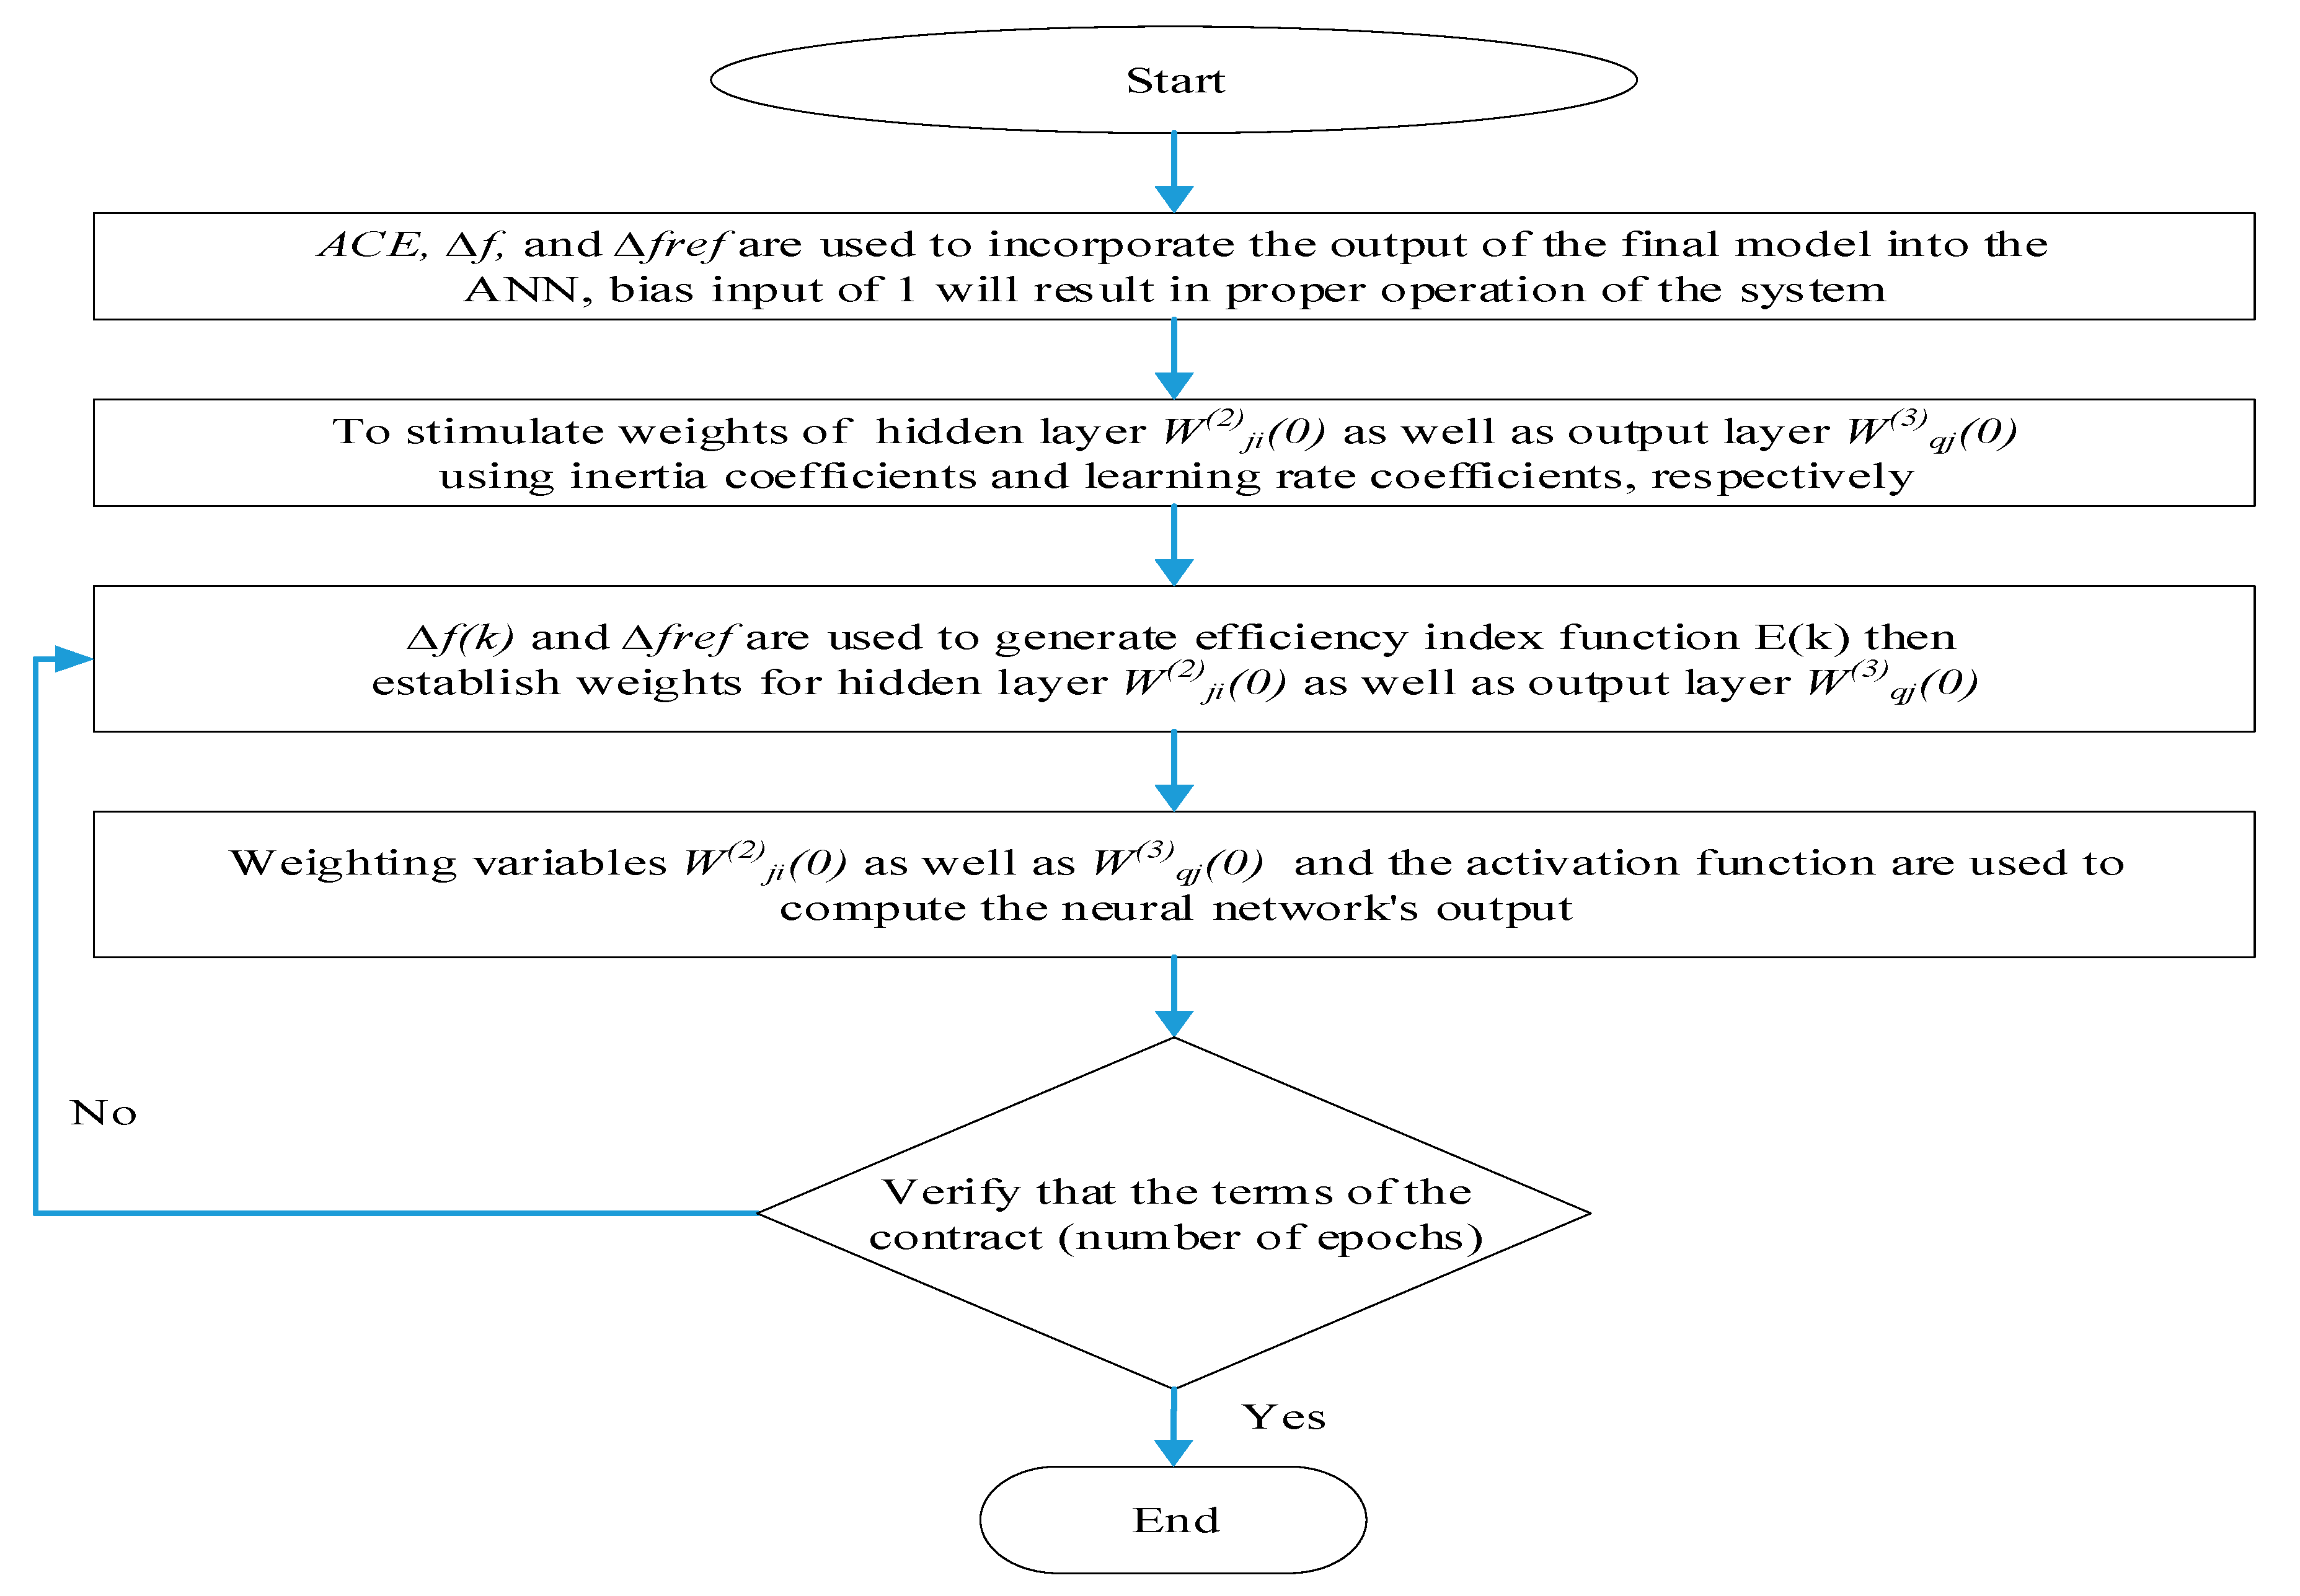
To improve the (PIλ + PIλf) controller parameters, a backpropagation technique is employed [28]. Figure 7 depicts a flowchart of the backpropagation algorithm functions which are as follows:
Step 1: ACE, ∆f, as well as ∆fref are used to incorporate the output of the final model into the ANN (Figure 2). A bias input of 1 will result in the proper operation of the system. It is necessary to initialize the weights of the output layer (W(3)qj(0)) as well as the hidden layer (W(2)ji(0)) using inertia coefficients and learning rate coefficients, respectively.
Step 2: ∆f(k) and ∆fref are used to generate the efficiency index function E(k). To take into consideration the system’s ∆f, the authors set ∆fref to zero when creating this scenario.
Step 3: The authors establish the weights for the hidden layer (W(3)qj(0)) as well as the output layer (W(2)ji(0)).
Step 4: The most recent weighting variables (W(2)ji(k), W(3)qj(k)) and the activation function are used to compute the neural network’s output. With the parameters of a (PIλ + PIλf) controller, the ANN yields the most efficient result.
Step 5: Whether the contract’s conditions (the number of epochs) have been met is confirmed. If this condition is not satisfied, k = k + 1 will be used in step 2.

5.3. The Suggested Adaptive (PIλ + PIλf) Controller

Cascade and fractional order are two common controller design types. There are benefits and drawbacks to any concept. Outlining the general advantages of specific architectures is the aim of this article by applying concepts of adaptive and fractional-order policy. In this study, a novel controller configuration—ANN-based (PIλ + PIλf)—was used. A few case studies have shown positive results. Some of the fundamental research was incorporated into the construction of this controller.
Allowing for the selection of fractional-order integrators increases the transient response by substituting it with a fractional-order integrator, thereby further improving the simple integral controller. The formula is PIλ + PIλf:
G P I λ + P I λ f = K P i + K I i s λ i +   K P i f + K I i f s λ i f
The integral and proportional gains are represented by the symbols KIi and KPi, respectively. Here, “i” stands for the “ith” area. The order of an integrator is represented by λ. The main advantages of using the ANN-based (PIλ + PIλf) controller over traditional fuzzy or PID-based controllers are that it is very fast, produces no overshoots, and produces smooth waveforms. Every parameter’s range is set between 0 and 2. The range for λ is between 0 and 1.5 [19]. Fractional order controllers, such as Fractional Order PI (FOPI) controllers, to tune their fractional orders (λ, λf) use time domain performance criteria and frequency domain restrictions. Gain crossover frequency, phase margin, sensitivity, and complementary sensitivity are among these requirements in the frequency domain; in the time domain, they include integral performance criteria such as ITSE. Although the particular system and control goal will determine how sensitive the system’s performance is to variations in λ and λf, fractional-order controllers often provide more flexibility and the possibility of better performance than integer-order controllers do.
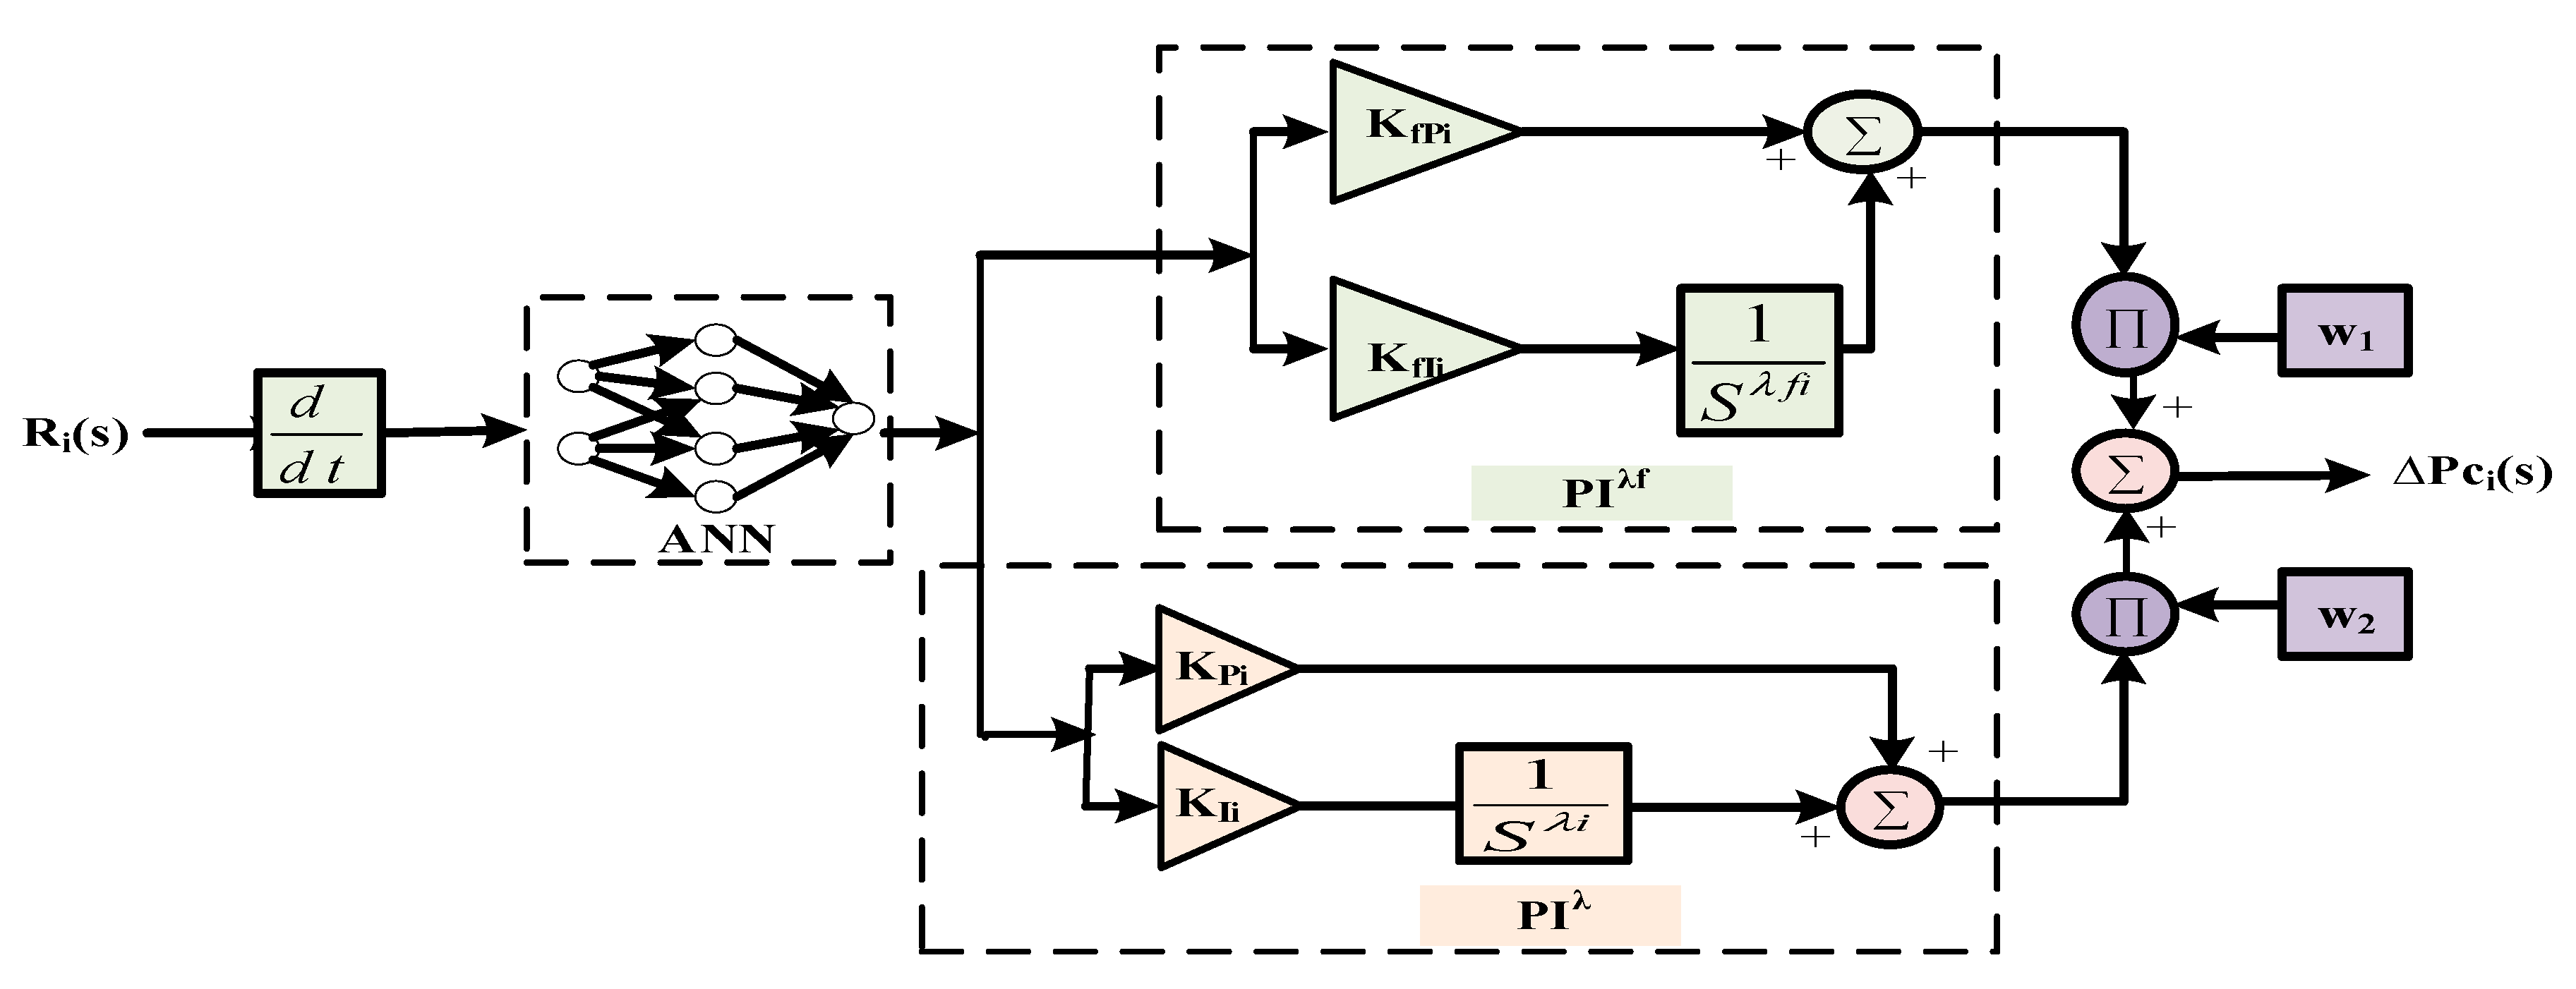
The controllers used in LFC research may be diverse. All controllers, no matter how different, have advantages as well as disadvantages. For the LFC mechanism, a (PIλ + PIλf) controller and an input-scaled ANN-based cascading FOPI controller are combined in a new parallel branching manner. ANN-based controllers manage complicated nonlinear systems effectively. Since their inception in the AGC of power systems, fractional-order PIλf (FOPIλf) controllers have garnered attention in recent years. Compared to an integral-order classical PIλ, a fractional-order controller has a number of advantages, including a greater degrees of freedom, adjustable parameters, a wider range of slopes, etc. By allocating the controller’s movable weights, the optimal control activity can also be identified. More encouraging results are obtained when the adaptive control mechanism is included. Figure 8 depicts the intricate controller mechanism. The controller section performance is given below:
  • The controller has been tested under various deregulated scenarios—Poolco-Based (PBT), Bilateral-Based (BBT), and Contract Violation-based (CVT)—each introducing unpredictable load changes and renewable energy fluctuations.
  • The system consistently maintained frequency stability, minimal overshoot, and fast settling time, indicating strong resilience to parameter uncertainties and load variations that mimic real-world behavior.
  • In practice, Renewable Energy Sources (RESs) like solar and wind exhibit intermittent and unpredictable outputs. The study incorporated this uncertainty (fluctuating between 0.005 p.u. and 0.003 p.u.), and the controller adapted effectively using the ANN’s self-learning and adaptive gain-tuning ability, ensuring frequency restoration even under dynamic renewable penetration levels.
  • Unlike conventional PI or PID controllers, which require manual retuning for new operating points, the ANN-based controller automatically updates control parameters through continuous learning. This makes it durable in evolving grid conditions, such as varying generation mixes, grid topology changes, or demand surges.

5.4. Optimization Technique

The field of LFC has used a wide variety of optimization algorithms to systematically tune controller characteristics. In this study, the parameters of the suggested ANN-based (PIλ + PIλf) controller are optimized using a novel optimization framework called the Quasi-Oppositional Reptile Search Algorithm (QORSA). The literature contains a wealth of metaheuristic techniques for many engineering problems and LFC. This includes a relatively recent metaheuristic method, the Reptile Search Algorithm (RSA). Its high exploitation and exploration properties have been proven among other well-known algorithms. Standard metaheuristic algorithms are surpassed by the RSA in solving a wide range of benchmark functions and difficult engineering problems. Using the quasi-opposite population, the research indicates a high probability of obtaining optimal solutions. In order to achieve a faster rate of convergence towards a global optimal solution, RSA has been improved by integrating quasi-opposition-based learning technologies. Avoiding the local optimum solution’s trap is also beneficial. In order to develop the proposed algorithm, some preparatory research was performed. Drawing inspiration from the cooperative hunting and social activities of crocodiles, the Reptile Search Algorithm (RSA) is a population-based, gradient-free metaheuristic [29]. It contains two stages: an exploration phase that simulates encircling prey, as well as an exploitation phase that reflects focused hunting behavior. Both phases are intended to effectively converge to the global optimum.
The quasi-oppositional learning approach is used to improve the convergence rate as well as search capabilities even further. By producing quasi-opposite solutions for every member of the population, this method enhances the algorithm’s capacity to evade local minima and speeds up overall convergence. Figure 9 shows the steps in the proposed QORSA [26] procedure.

6. Results and Discussion

A few case studies that utilize the new controller are examined in this paper, along with an explanation of the IET-defined HVDC tie-line. The models discussed in the preceding part and the MATLAB/Simulink environment were used to create this configuration. Four independent analyses make up the full analysis: discussion topics include (i) justification for the suggested controller; (ii) impact of an IET-based HVDC tie-line on frequency regulation (BBT), along with sensitivity analysis as well as stability analysis; (iii) contract violation; and (iv) survey of relevant literature. The QORSA ensures excellent performance in every scenario.

6.1. Case Study 1: Justification for the Suggested Controller

The case study is based on the uncontrolled environment of the PBT type and the two-area structure of Section 2. The authors only need to look at Equation (19) to identify the PBT-DPM of interest. Each GENCO is supposed to contribute about the same amount to load variations in its service areas.
D P M = 0.5 0.5 0 0 0.5 0.5 0 0 0 0 0 0 0 0 0 0
Fuzzy FOPI, ANN-based PIλDN, FOPI, fuzzy (PIλf + PIλDN), and the suggested adaptive control controller are utilized to record the dynamic performance of the system. With the help of the QORSA, Table 3 below displays the control settings for each of the controllers in question. Frequency as well as tie-line power are affected by the Step-change in Load Demand (SLD), as seen in Figure 10a–c.
A ±5% error tolerance is used when calculating the settling time. The ability of the suggested controller to effectively generate the required enhanced transient responsiveness is demonstrated by this kind of proof. In terms of error reduction and rising time, QORSA outperforms VPL and WOA. Figure 10d uses the numbers from Table 5 to display the OF against the number of iterations. When adaptive control is used with the suggested controller, improvements become apparent. Table 4 provides a comprehensive study of undershoot, overshoot, as well as settling time.
Table 4. Step-change in load demand for calculating the system’s response.
Controllers∆f1∆f2∆P12OF
OSUS(−ve)TSOSUS(-ve)TSOSUS(−ve)TS
FOPI0.0570.05599.50.0280.028499.590.0130.0128199.974.51
Fuzzy FOPI0.0260.02899.70.0090.020199.980.0050.0088299.921.13
Fuzzy (PIλ + PIλDN)0.0050.0156.080.0030.00966.3600.0000.003196.8019.52 × 10−5
ANN-based PIλDN0.0010.01218.10.0250.006811.200.0000.0032297.026.47 × 10−2
Proposed controllerIAE0.0010.01316.10.0010.008818.010.0000.0037538.947.18 × 10−2
ISE0.0010.00722.20.0000.003419.010.0000.0014537.906.22 × 10−2
ITAE0.0390.01512.10.0400.01117.020.0390.0482541.310.781
ITSE0.0000.0129.010.0000.006513.820.0000.0019632.757.02 × 10−2
Table 5. Ideal gain values are altered by step load demand.
GainsWAOVPLQORSA
IAEISEITAEITSE
Area 1Area 2Area 1Area 2Area 1Area 2Area 1Area 2Area 1Area 2Area 1Area 2
KPi0.380.580.750.8010.5420.4511.4640.480.5020.6610.3210.381
KIi0.730.860.730.8020.0850.6870.0380.620.0250.0900.1100.043
KfPi0.950.930.850.8960.2210.9140.1430.080.1430.0660.1310.032
KfIi0.650.970.630.9120.0380.2960.2210.050.1810.0140.1610.011
λi0.960.760.600.1001.3741.2351.5721.811.3511.7910.1310.241
λfi0.970.780.620.1021.3811.2401.5801.821.3591.7991.1320.249
w10.480.530.450.0830.4180.5970.9810.850.4410.1410.1310.181
w20.320.370.220.3470.6410.8481.4640.630.2860.4500.3410.075
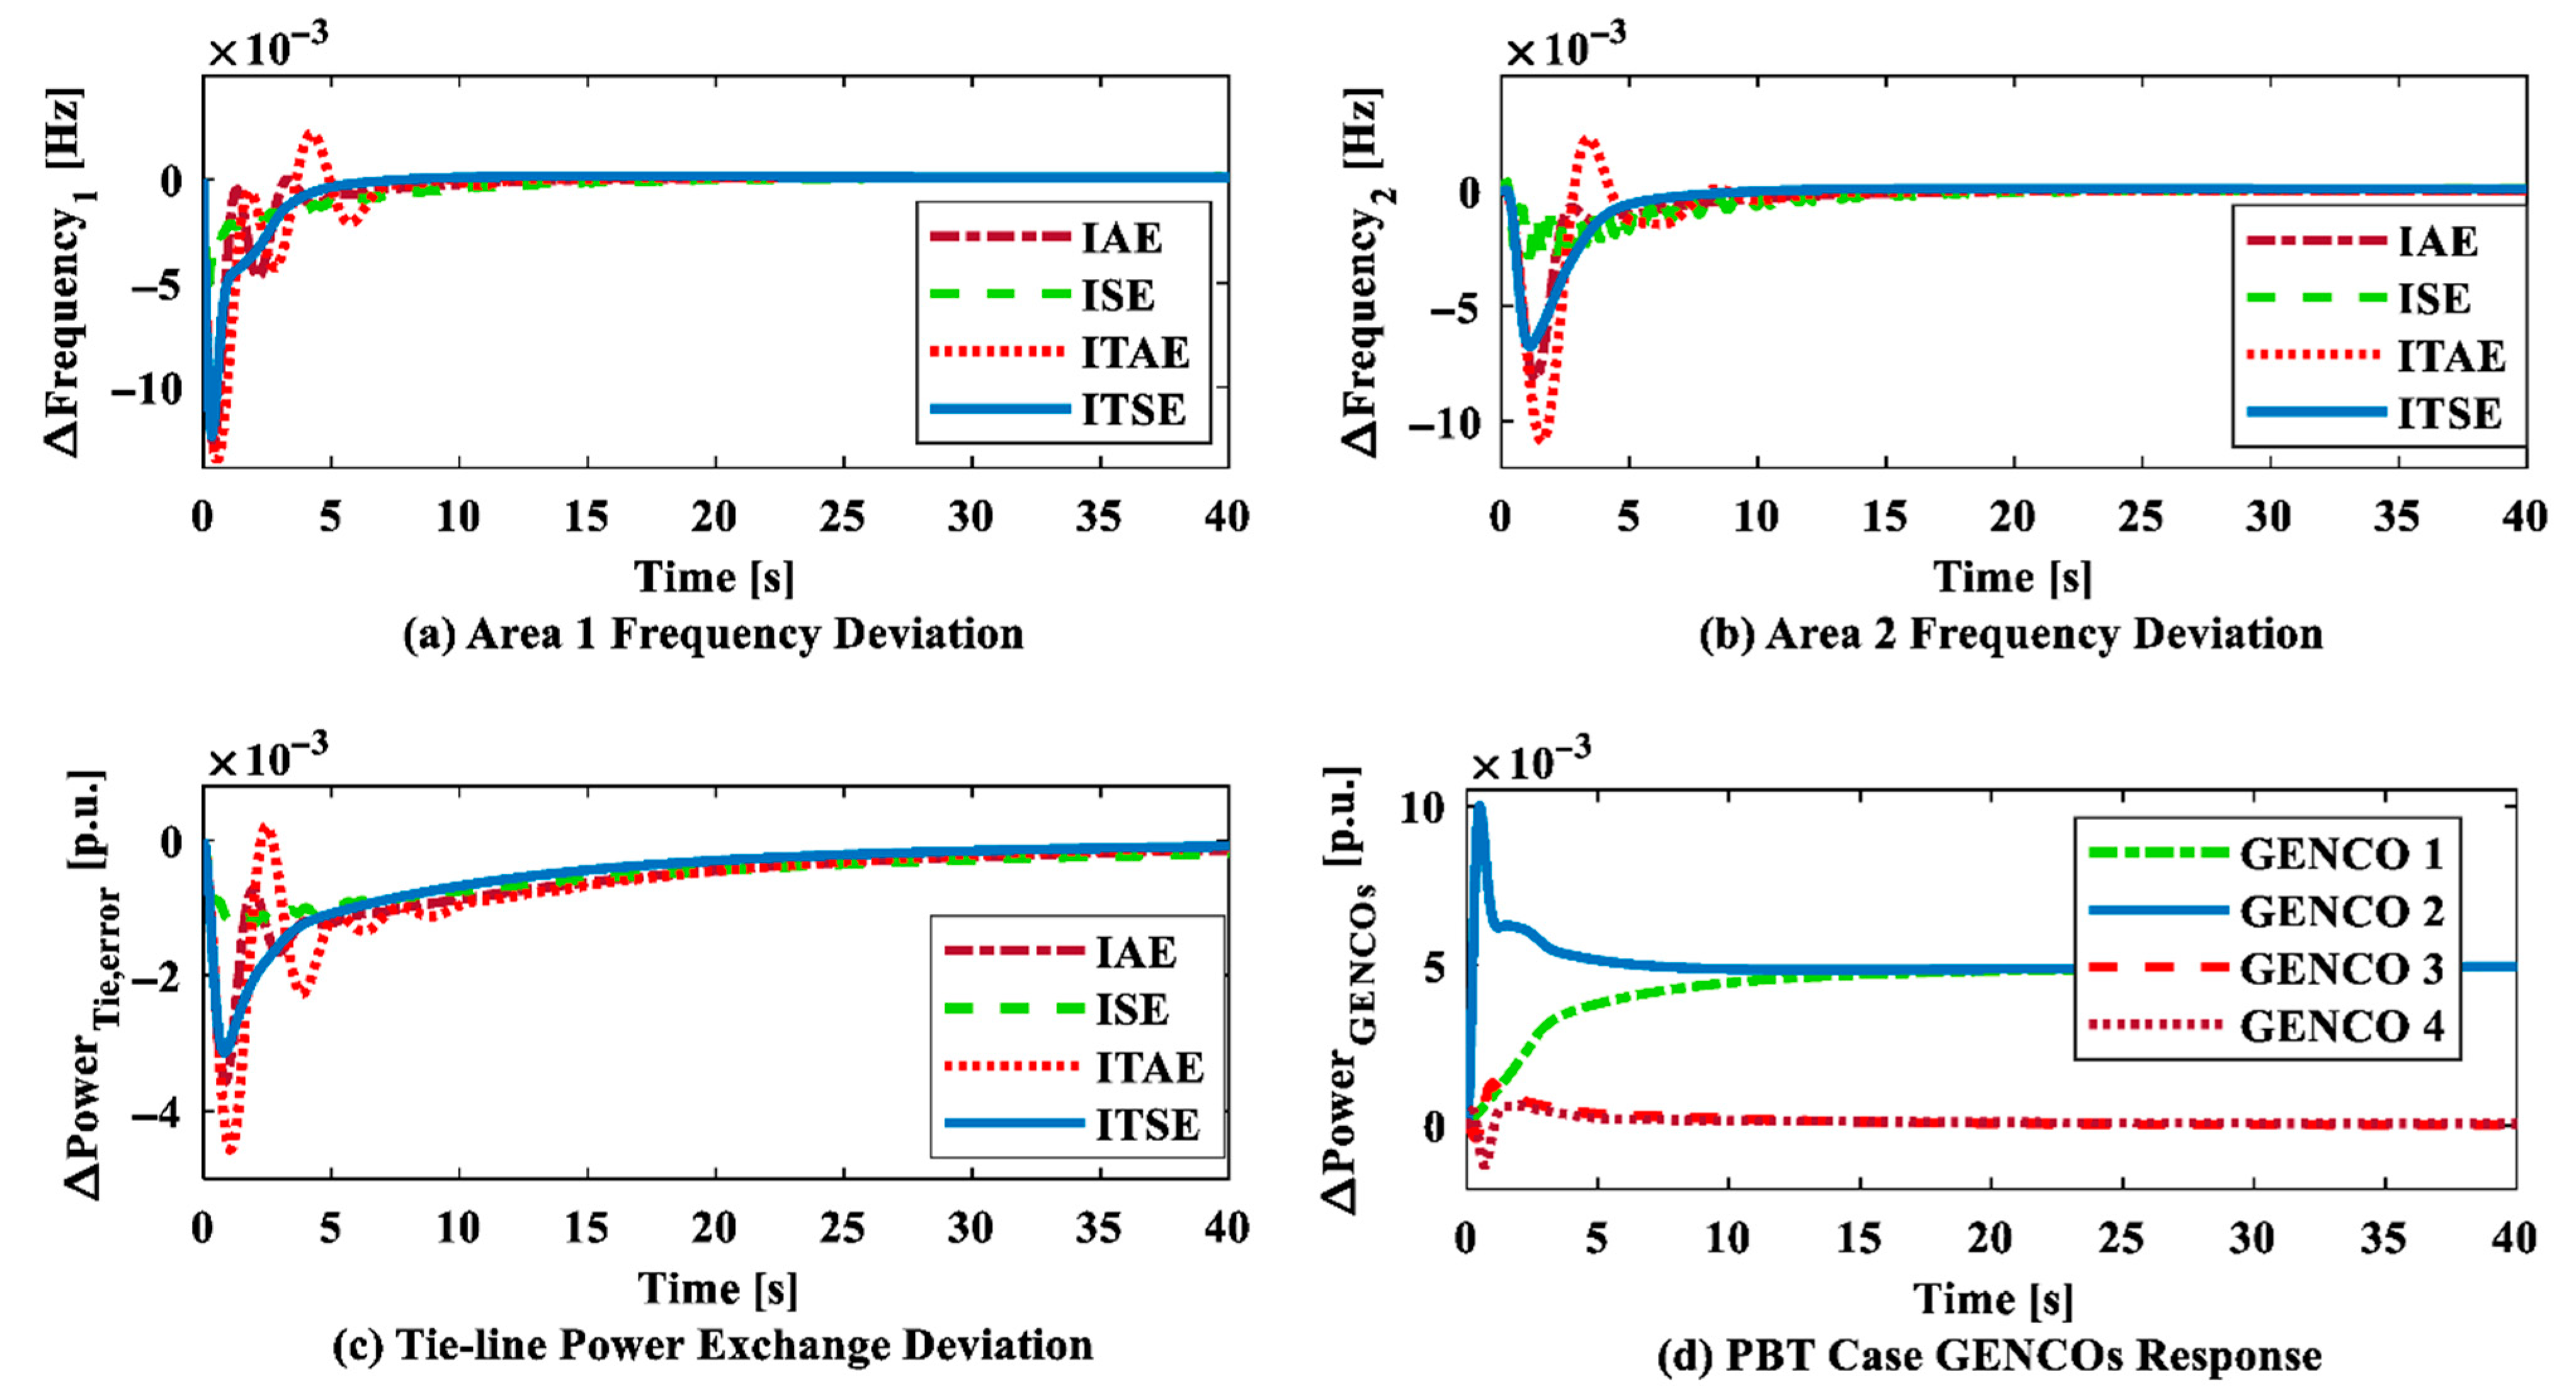
Furthermore, according to Equation (1), Objective Functions (OFs) can be separated into four different categories: IAE, ISE, ITAE, and ITSE. A system’s reaction using all four OFs is displayed in Figure 11a–c. For different OFs, QORSA’s evaluation results of the suggested controller’s control parameters are shown in Table 5. The effectiveness of the suggested controller as well as the system concerning all OFs is shown by the numerical data in Table 4. Following the adoption of ITSE, additional developments in OS, US, as well as TS were seen. ITSE is therefore given more consideration as the primary optimization objective. In this study, the deregulation of the decentralized PBT type is of interest to the authors. Due to its exclusive impact on Area 1, the load shift was similarly distributed among all GENCOs (Figure 11d).
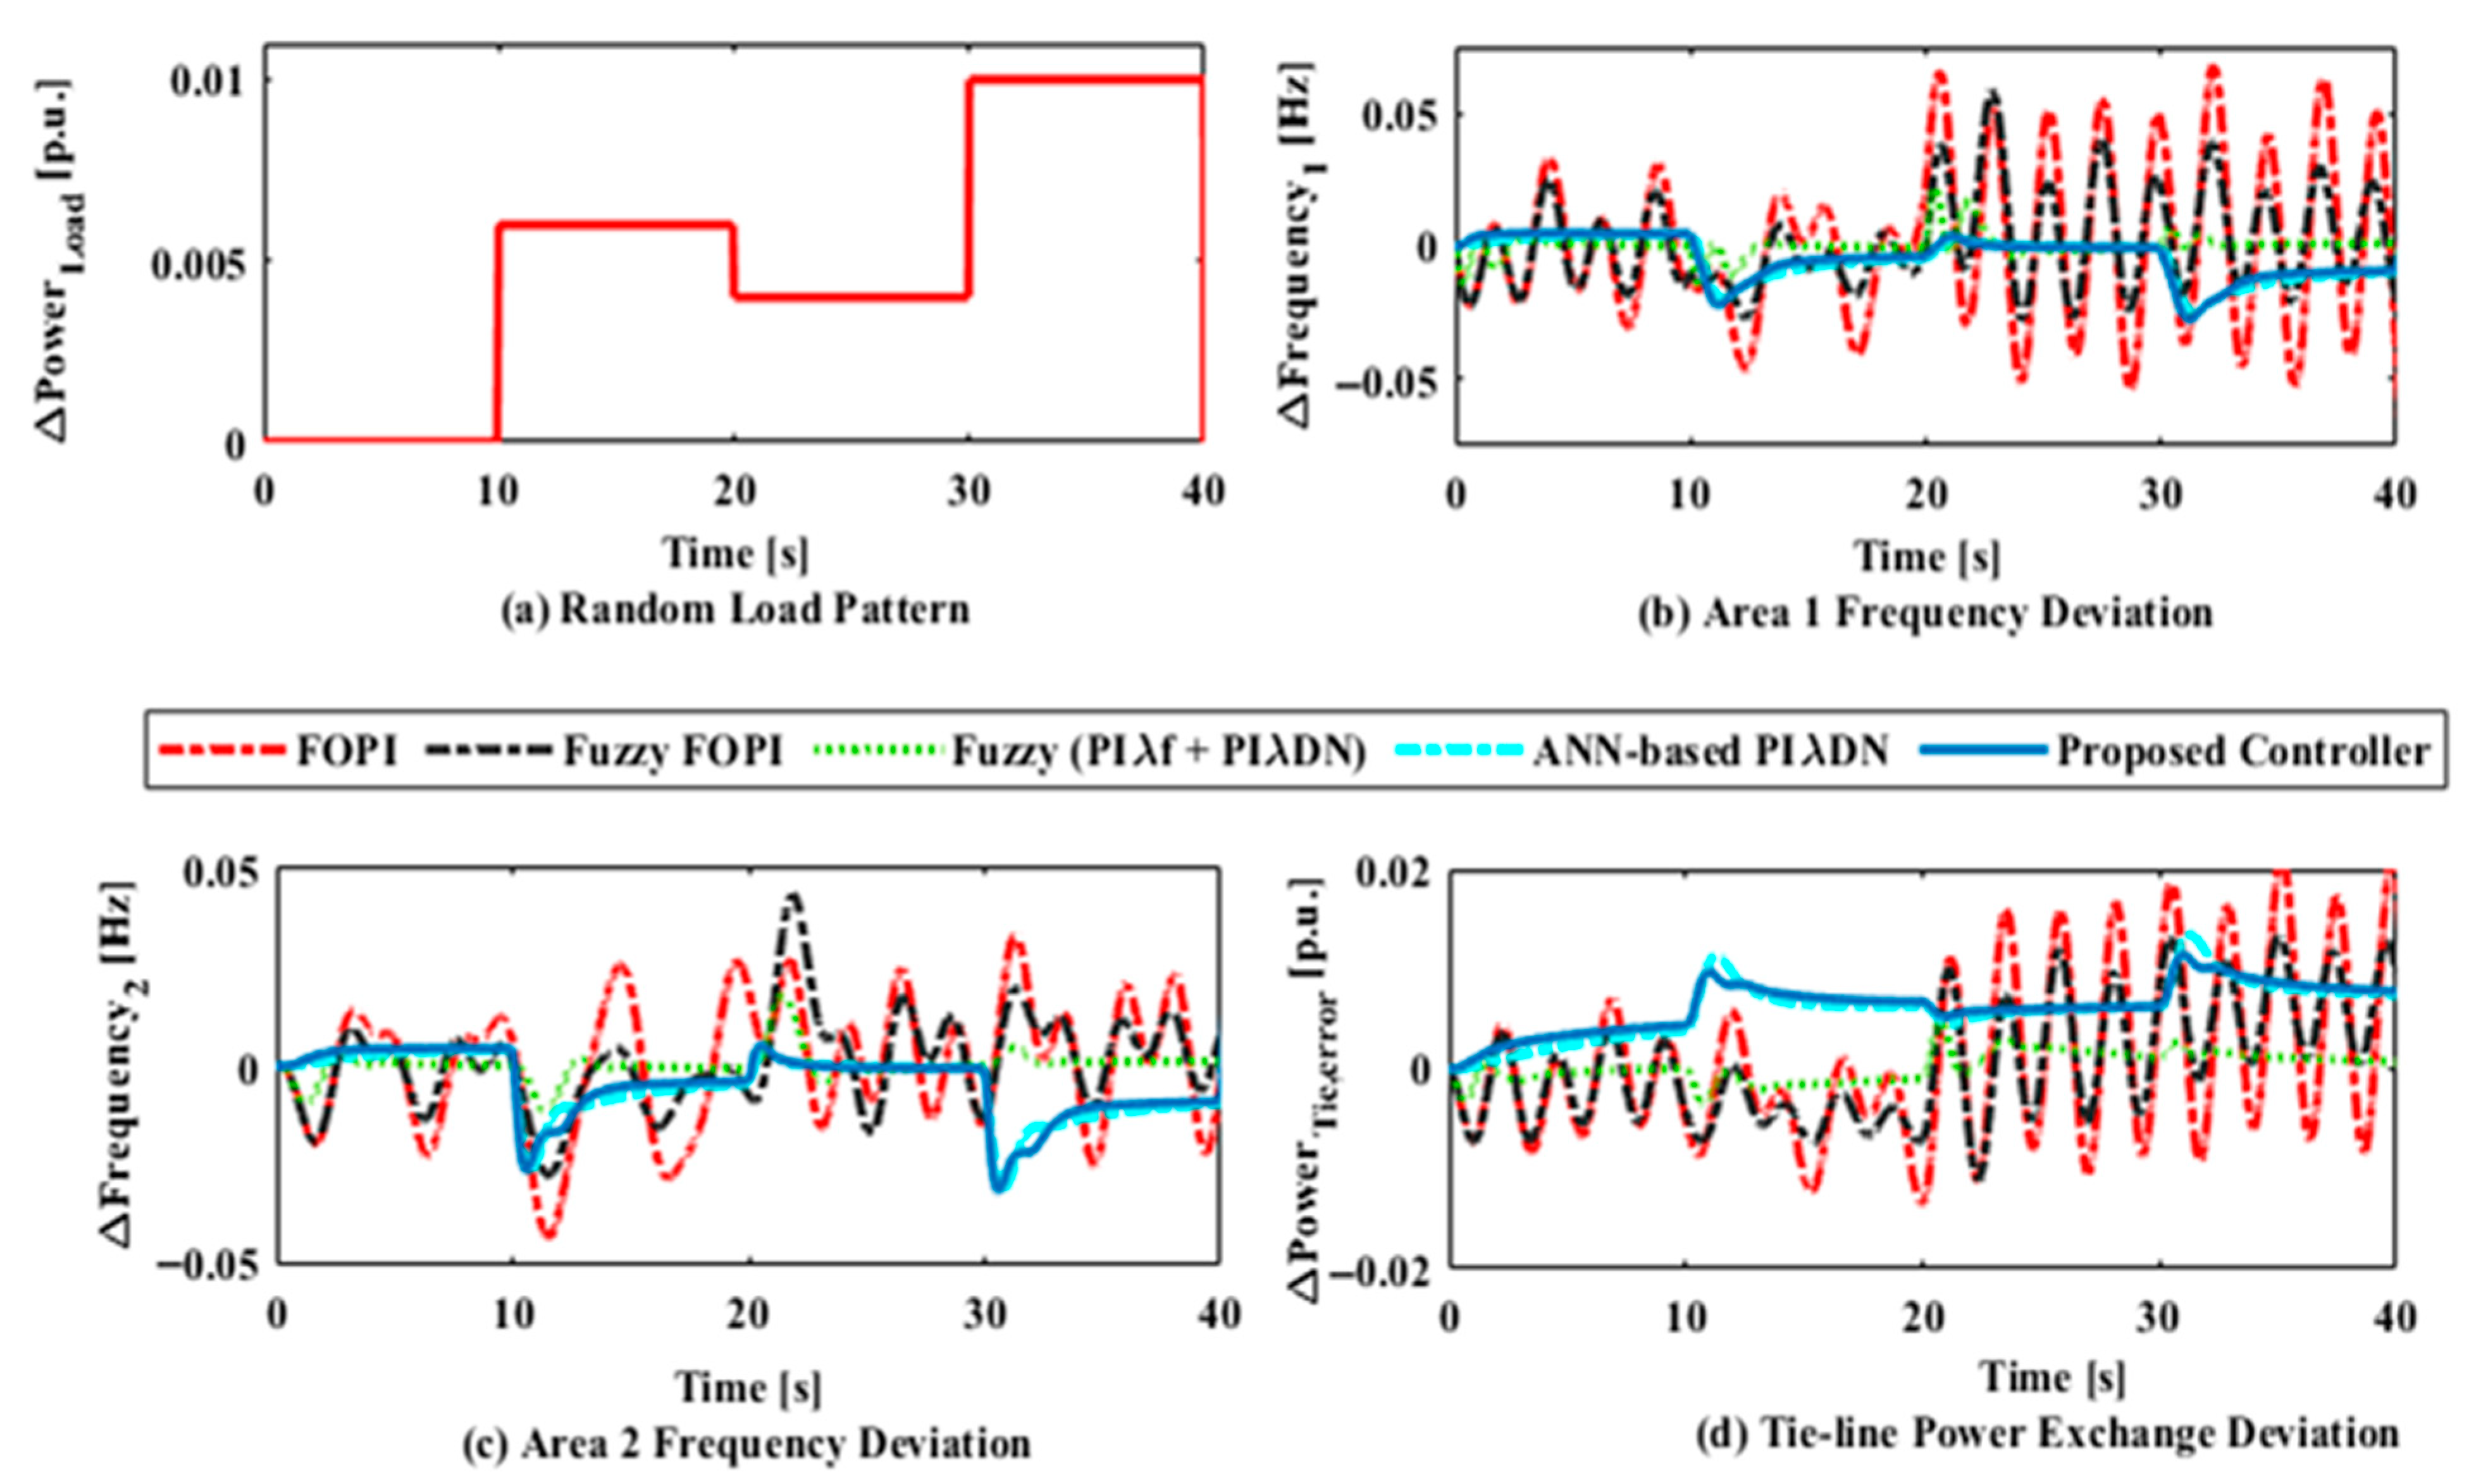
The optimal parameters identified by QORSA significantly enhanced the SLD scenario using the proposed controller. The authors assessed the system’s reaction to the chaotic load variations depicted in Figure 12a using the same optimal settings from Table 3. Figure 12b–d show how the system reacts dynamically to a random load disturbance. The adaptive controller that is suggested performs better than the alternatives.

6.2. Case Study 2: Impact of an IET-Based HVDC Tie-Line on Frequency Regulation (BBT), Along with Sensitivity Analysis and Stability Analysis

A DC capacitor is frequently seen in HVDC converters. Such capacitors aid in frequency regulation. In order to meet IET criteria, this article examines how changing the HVDC tie-line could affect the test setup’s LFC.
The remaining 30% of the load shift in Area 1 is caused by the gas turbine system, and 70% is caused by the thermal power system (GENCO 1). Similarly, hydropower accounts for 40% and thermal power in Area 2 accounts for 60%. Considering the SLD of 0.01 p.u., both sections are compared to the original case study. In the context of BBT, DPMs can be represented by the following Equation (20).
D P M = 0.2           0.1           0.2           0.1 0.4           0.3           0.4           0.3 0.3           0.2           0.2           0.1 0.1           0.4           0.2           0.5
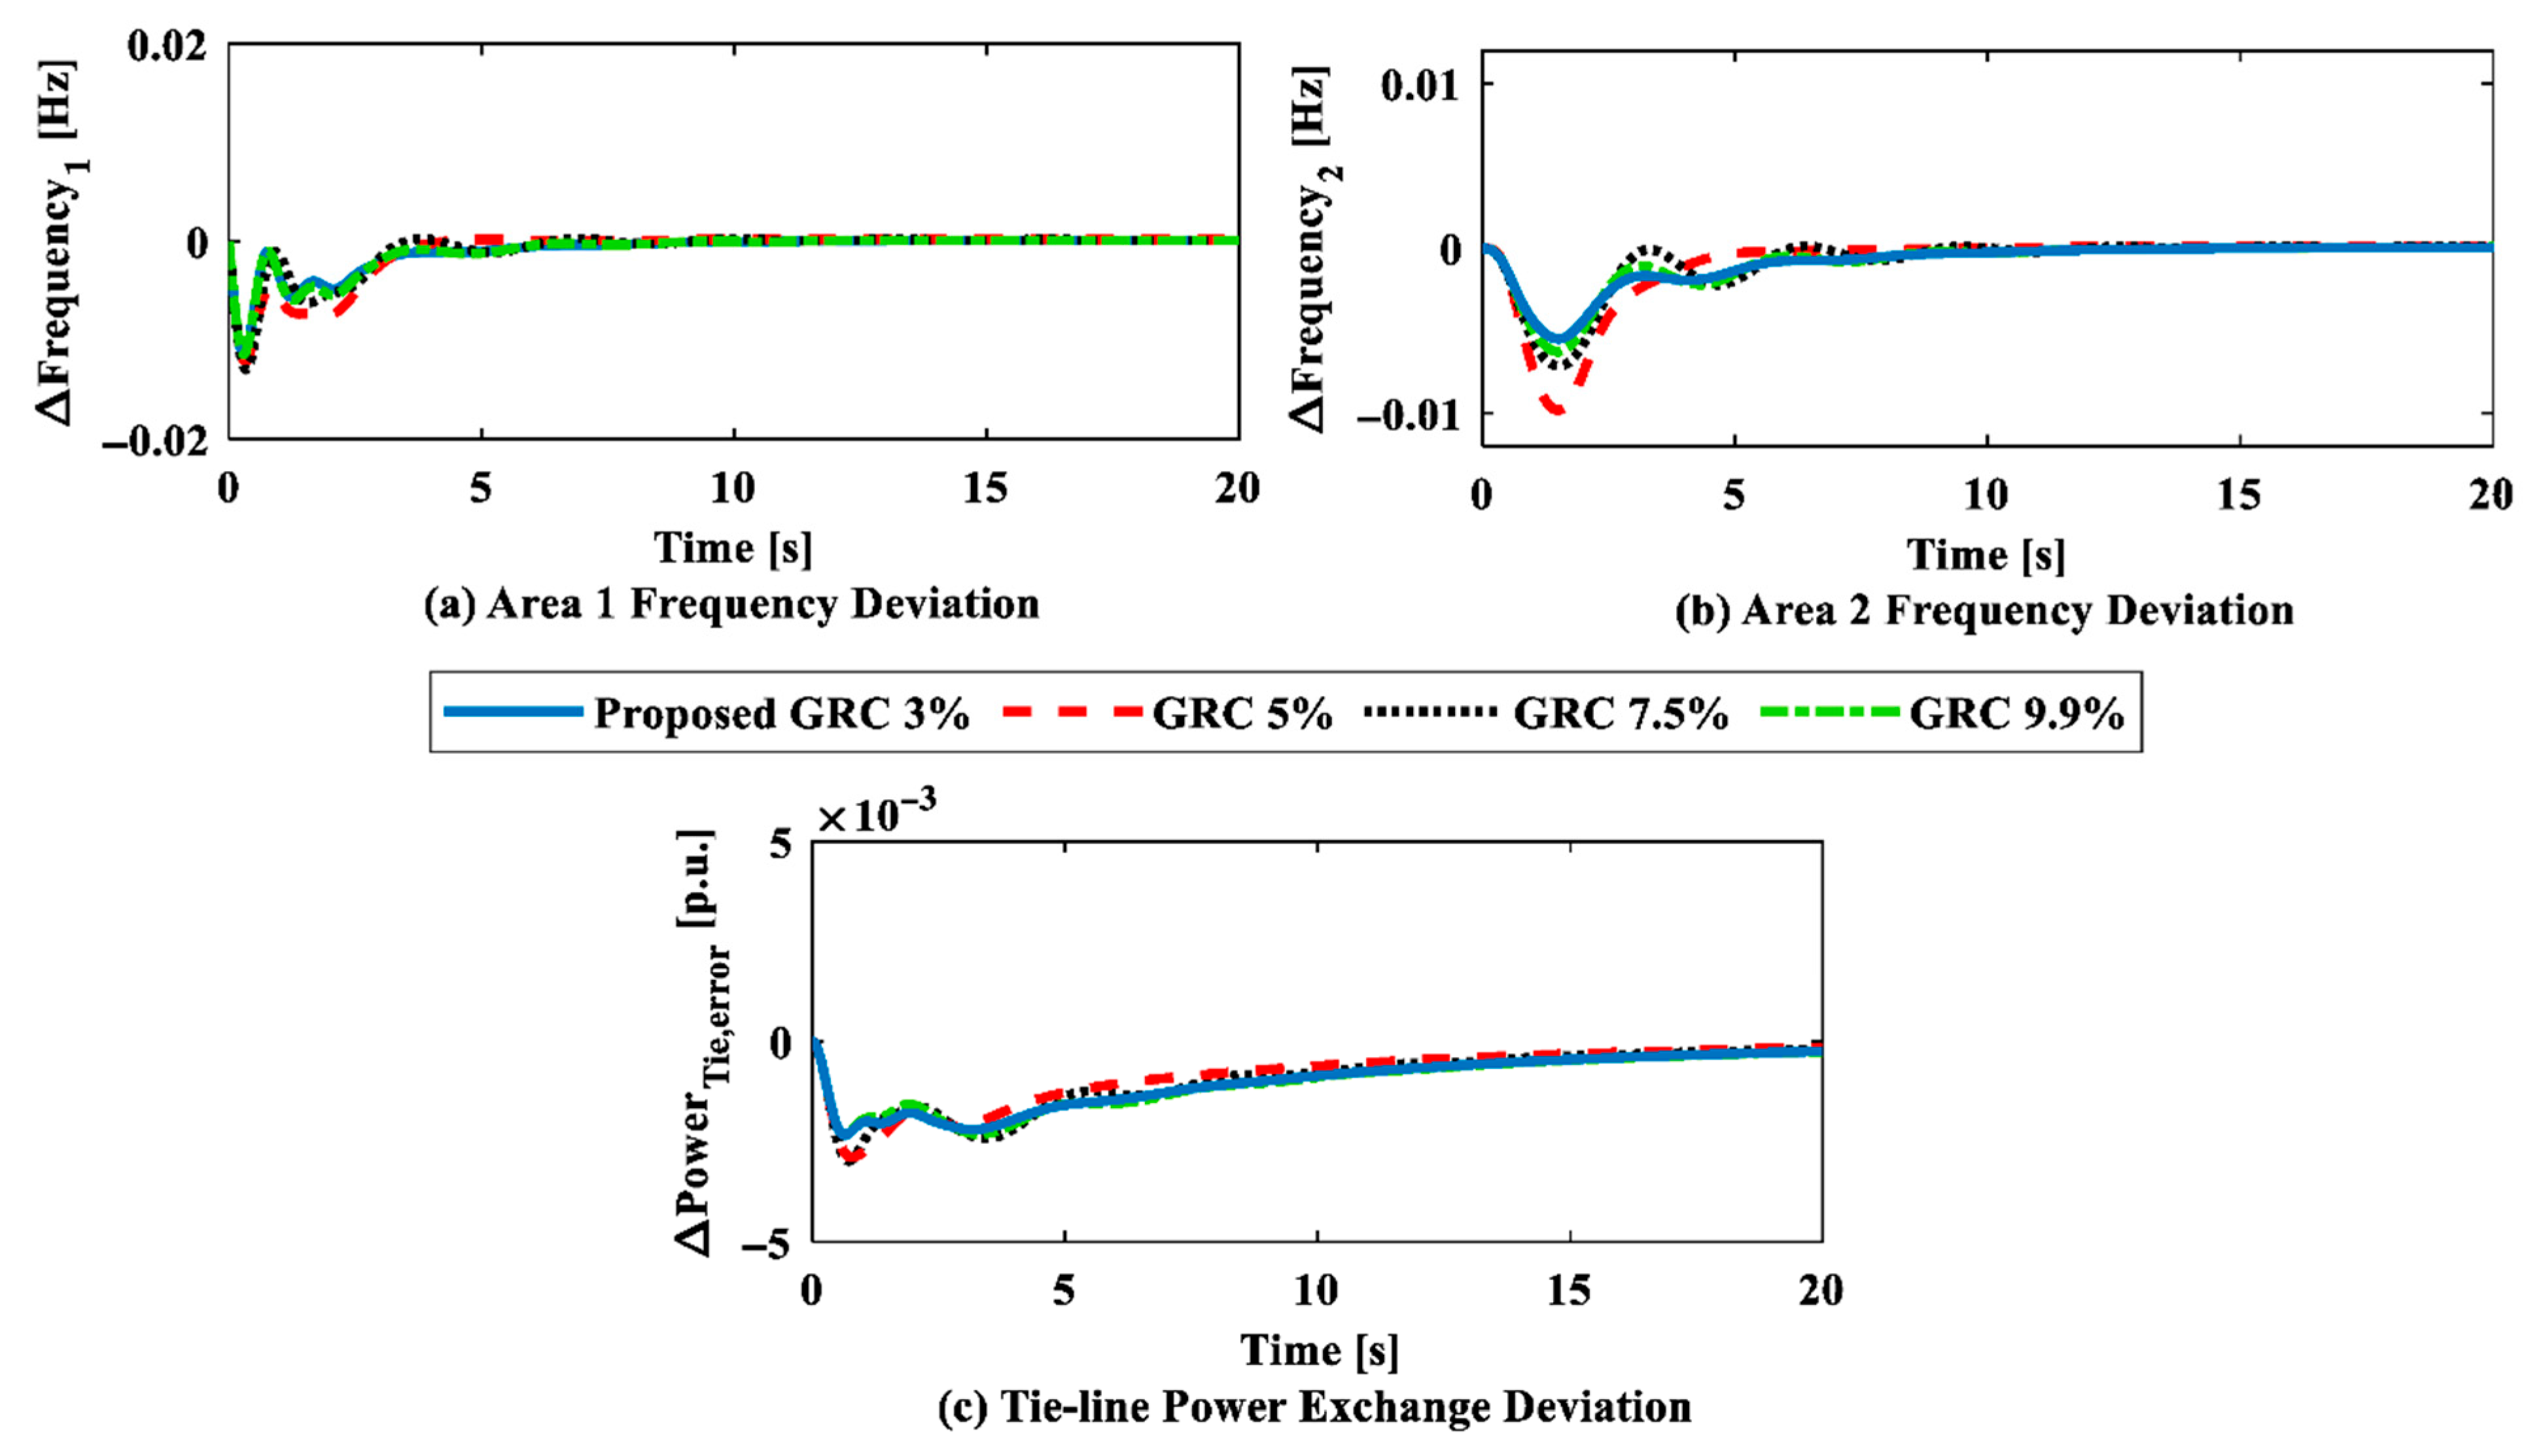
In the first case, the dynamic responsiveness of the proposed system is investigated with the help of an Alternating Current (AC) tie-line. In Scenario 2, the AC tie-line is eventually replaced with a parallel HVDC tie-line that uses AC-IET technology. Table 6 shows an investigation’s ideal control parameters. Figure 13a,b display the system’s frequency deviation response for each of the two conceivable outcomes. The results show that undershoot is reduced by 49.52% and 59.04%, respectively, when an IET-based HVDC tie-line is used. Table 7 displays these numerical comparisons. The GENCOs’ answer is shown in Figure 13c, and a similar scenario is shown in Figure 13d. Additionally, the authors perform a sensitivity analysis on Scenario 2 to determine how vulnerable it is to changes in the system’s properties. The authors assess the suggested controller’s QORSA-optimized stability by changing the input parameters by ± twenty-five percent of their usual range. A sensitivity study requires the following parameters: the hydro system’s transient droop (TR and TRH) parameters, the gas turbine parameters (X, Y, bg, as well as cg), the time constant (TPSi), the power system gain (KPSi), the thermal turbine constant (TTi), and the thermal governor time constant (TGi) (see Appendix A). There is a range of 3% to 10% in GRC. Figure 14 displays several GRC values for the tie-line, Area 1, as well as Area 2 frequency deviation. For each GRC, the ideal controller gain values are displayed in Table 9.
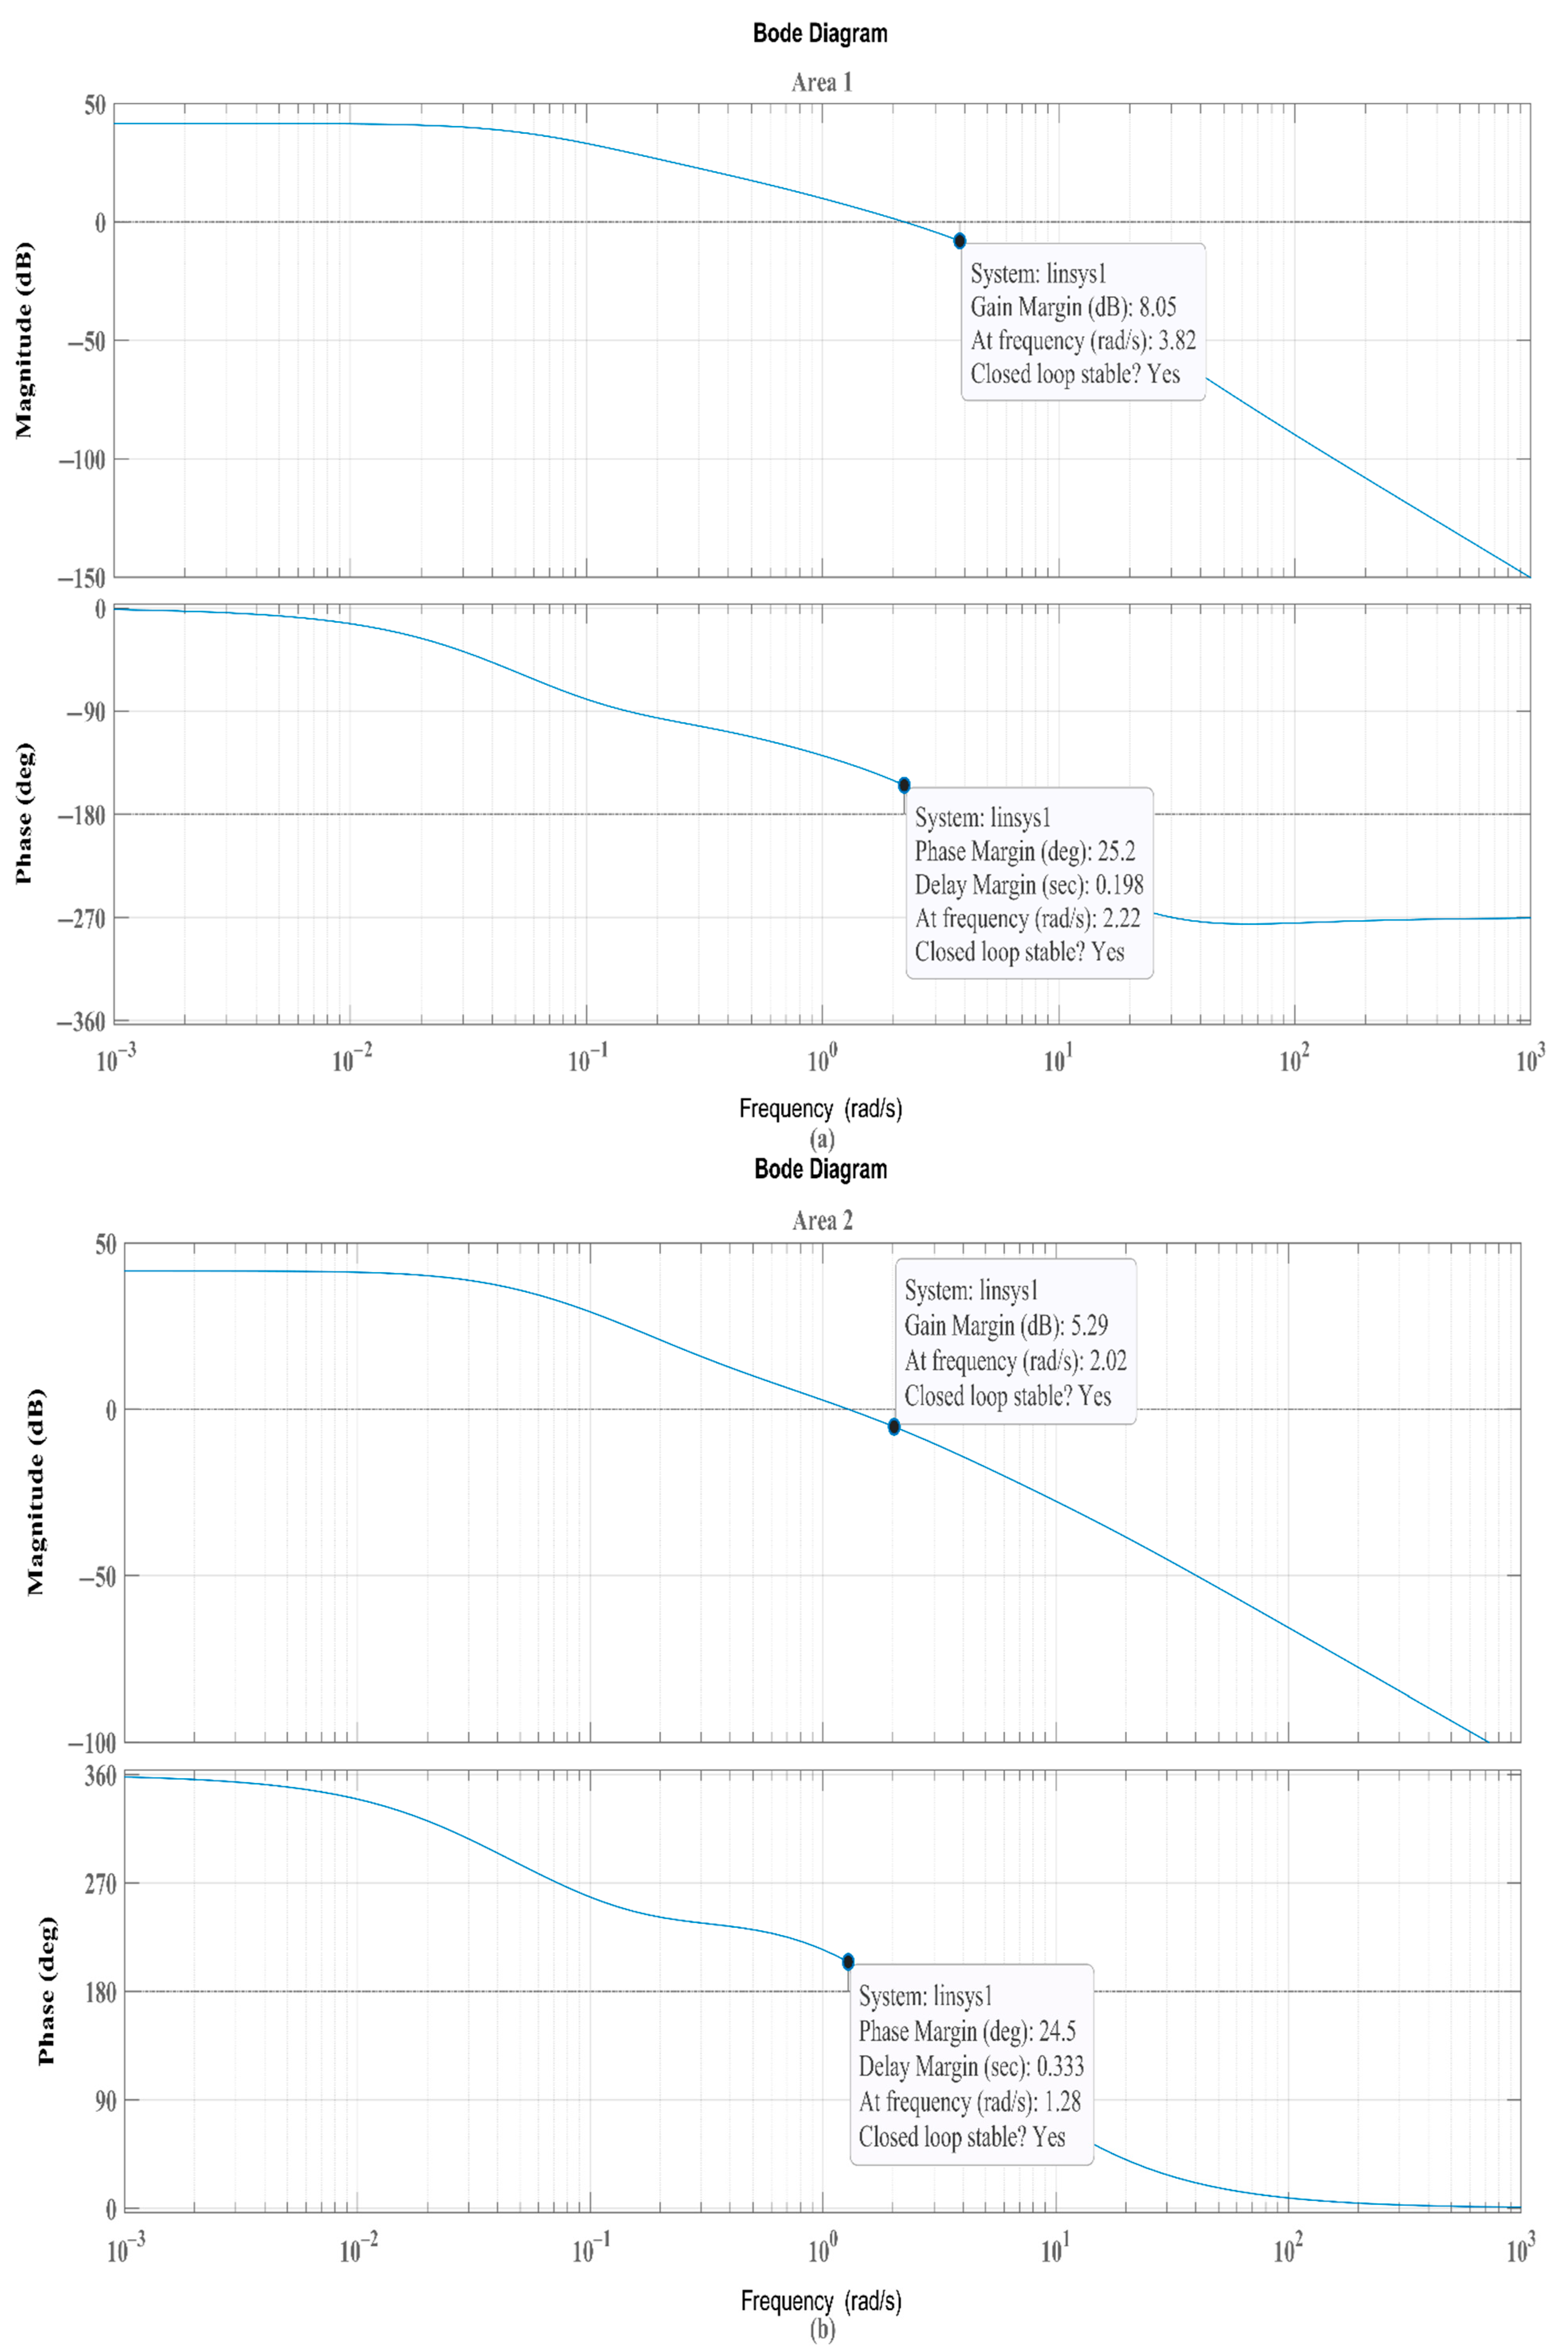
The robustness of the proposed ANN-based (PIλ + PIλf) controller is shown by the numerical analysis, which is shown in Table 8. As seen in Figure 15, the perturbation has no discernible effect on the system’s closed-loop stability.
Table 8. Investigation of the system’s susceptibility to notable modifications in input parameters.
Change% in Parameter+25% of Nominal−25% of Nominal
Parameter TsU.S (−Ve)O.S.TsU.S (−Ve)O.S.
TG1∆f115.22340.021120.000014.29410.021120.0000
∆f215.15620.028200.000014.71820.028810.0000
∆Ptie,error18.68290.000000.028218.68290.000000.0281
TG2∆f115.31900.021040.000014.11920.021030.0000
∆f215.41850.028920.000014.34090.028890.0000
∆Ptie,error18.89570.000000.028218.89120.000000.0282
Tt∆f115.91200.021030.000014.45710.021030.0000
∆f215.62060.027850.000014.36900.028690.0000
∆Ptie,error18.76470.000000.028218.87340.000000.0281
TRH∆f115.57290.019570.000014.67240.019420.0000
∆f215.34820.028300.000014.37820.028290.0000
∆Ptie,error18.64920.000000.028218.68250.000000.0283
KPS1∆f115.64370.021180.000014.82520.021180.0000
∆f215.28810.029410.000014.94320.028990.0000
∆Ptie,error18.76900.000000.028318.46220.000000.0282
TPS1∆f115.57200.021350.000014.78230.020920.0000
∆f215.68430.028840.000014.46890.028890.0000
∆Ptie,error18.91700.000000.028318.97620.000000.0282
KPS2∆f115.48570.021790.000014.87550.021820.0000
∆f215.30490.029660.000014.53730.029870.0000
∆Ptie,error18.97860.000000.029518.32840.000000.0295
TPS2∆f115.69580.021040.000014.98220.020340.0000
∆f215.85520.028480.000014.20390.028490.0000
∆Ptie,error18.23840.000000.028318.37480.000000.0280
TGH∆f115.28740.029950.000014.87290.020980.0000
∆f215.32760.028190.000014.12780.028010.0000
∆Ptie,error18.47640.000000.028418.39840.000000.0281
TR∆f115.37460.021340.000014.39480.020360.0000
∆f215.39810.029490.000014.28370.029110.0000
∆Ptie,error18.73840.000000.028618.47480.000000.0281
cg∆f115.03720.021480.000014.65620.021770.0000
∆f215.13480.028320.000014.14570.028260.0000
∆Ptie,error18.33940.000000.028718.23760.000000.0282
bg∆f115.32870.021120.000014.09240.020460.0000
∆f215.38930.028890.000014.13960.028890.0000
∆Ptie,error18.92270.000000.028418.13180.000000.0282
X∆f115.39200.019620.000014.48290.020570.0000
∆f215.38910.028920.000014.18130.028610.0000
∆Ptie,error18.47340.000000.028318.15700.000000.0281
Y∆f115.40240.021890.000014.53850.020520.0000
∆f215.30760.028240.000014.24890.028350.0000
∆Ptie,error18.42800.000000.028518.48290.000000.0284
Table 9. Optimal controller gain values for different GRCs.
Control ParametersProposed GRC 3%GRC 5%GRC 7.5%GRC 9.9%
Area 1Area 2Area 1Area 2Area 1Area 2Area 1Area 2
KPi0.13070.00810.90630.20150.05080.24020.09410.4213
KIi0.02610.01110.20470.35150.18600.30200.04640.3337
KfPi0.08240.01790.21080.37410.32900.01860.19750.0820
KfIi0.02050.00140.02220.38950.01320.00860.04860.0030
λi0.29140.01500.12090.17640.05940.20410.02520.2907
λfi0.03700.29010.12170.19040.14300.12990.13820.4655
w10.19580.00220.31130.25060.18520.25400.49000.0985
w20.31470.29200.12820.61650.06120.08990.28600.1207

6.3. Case Study 3: Contract Violation

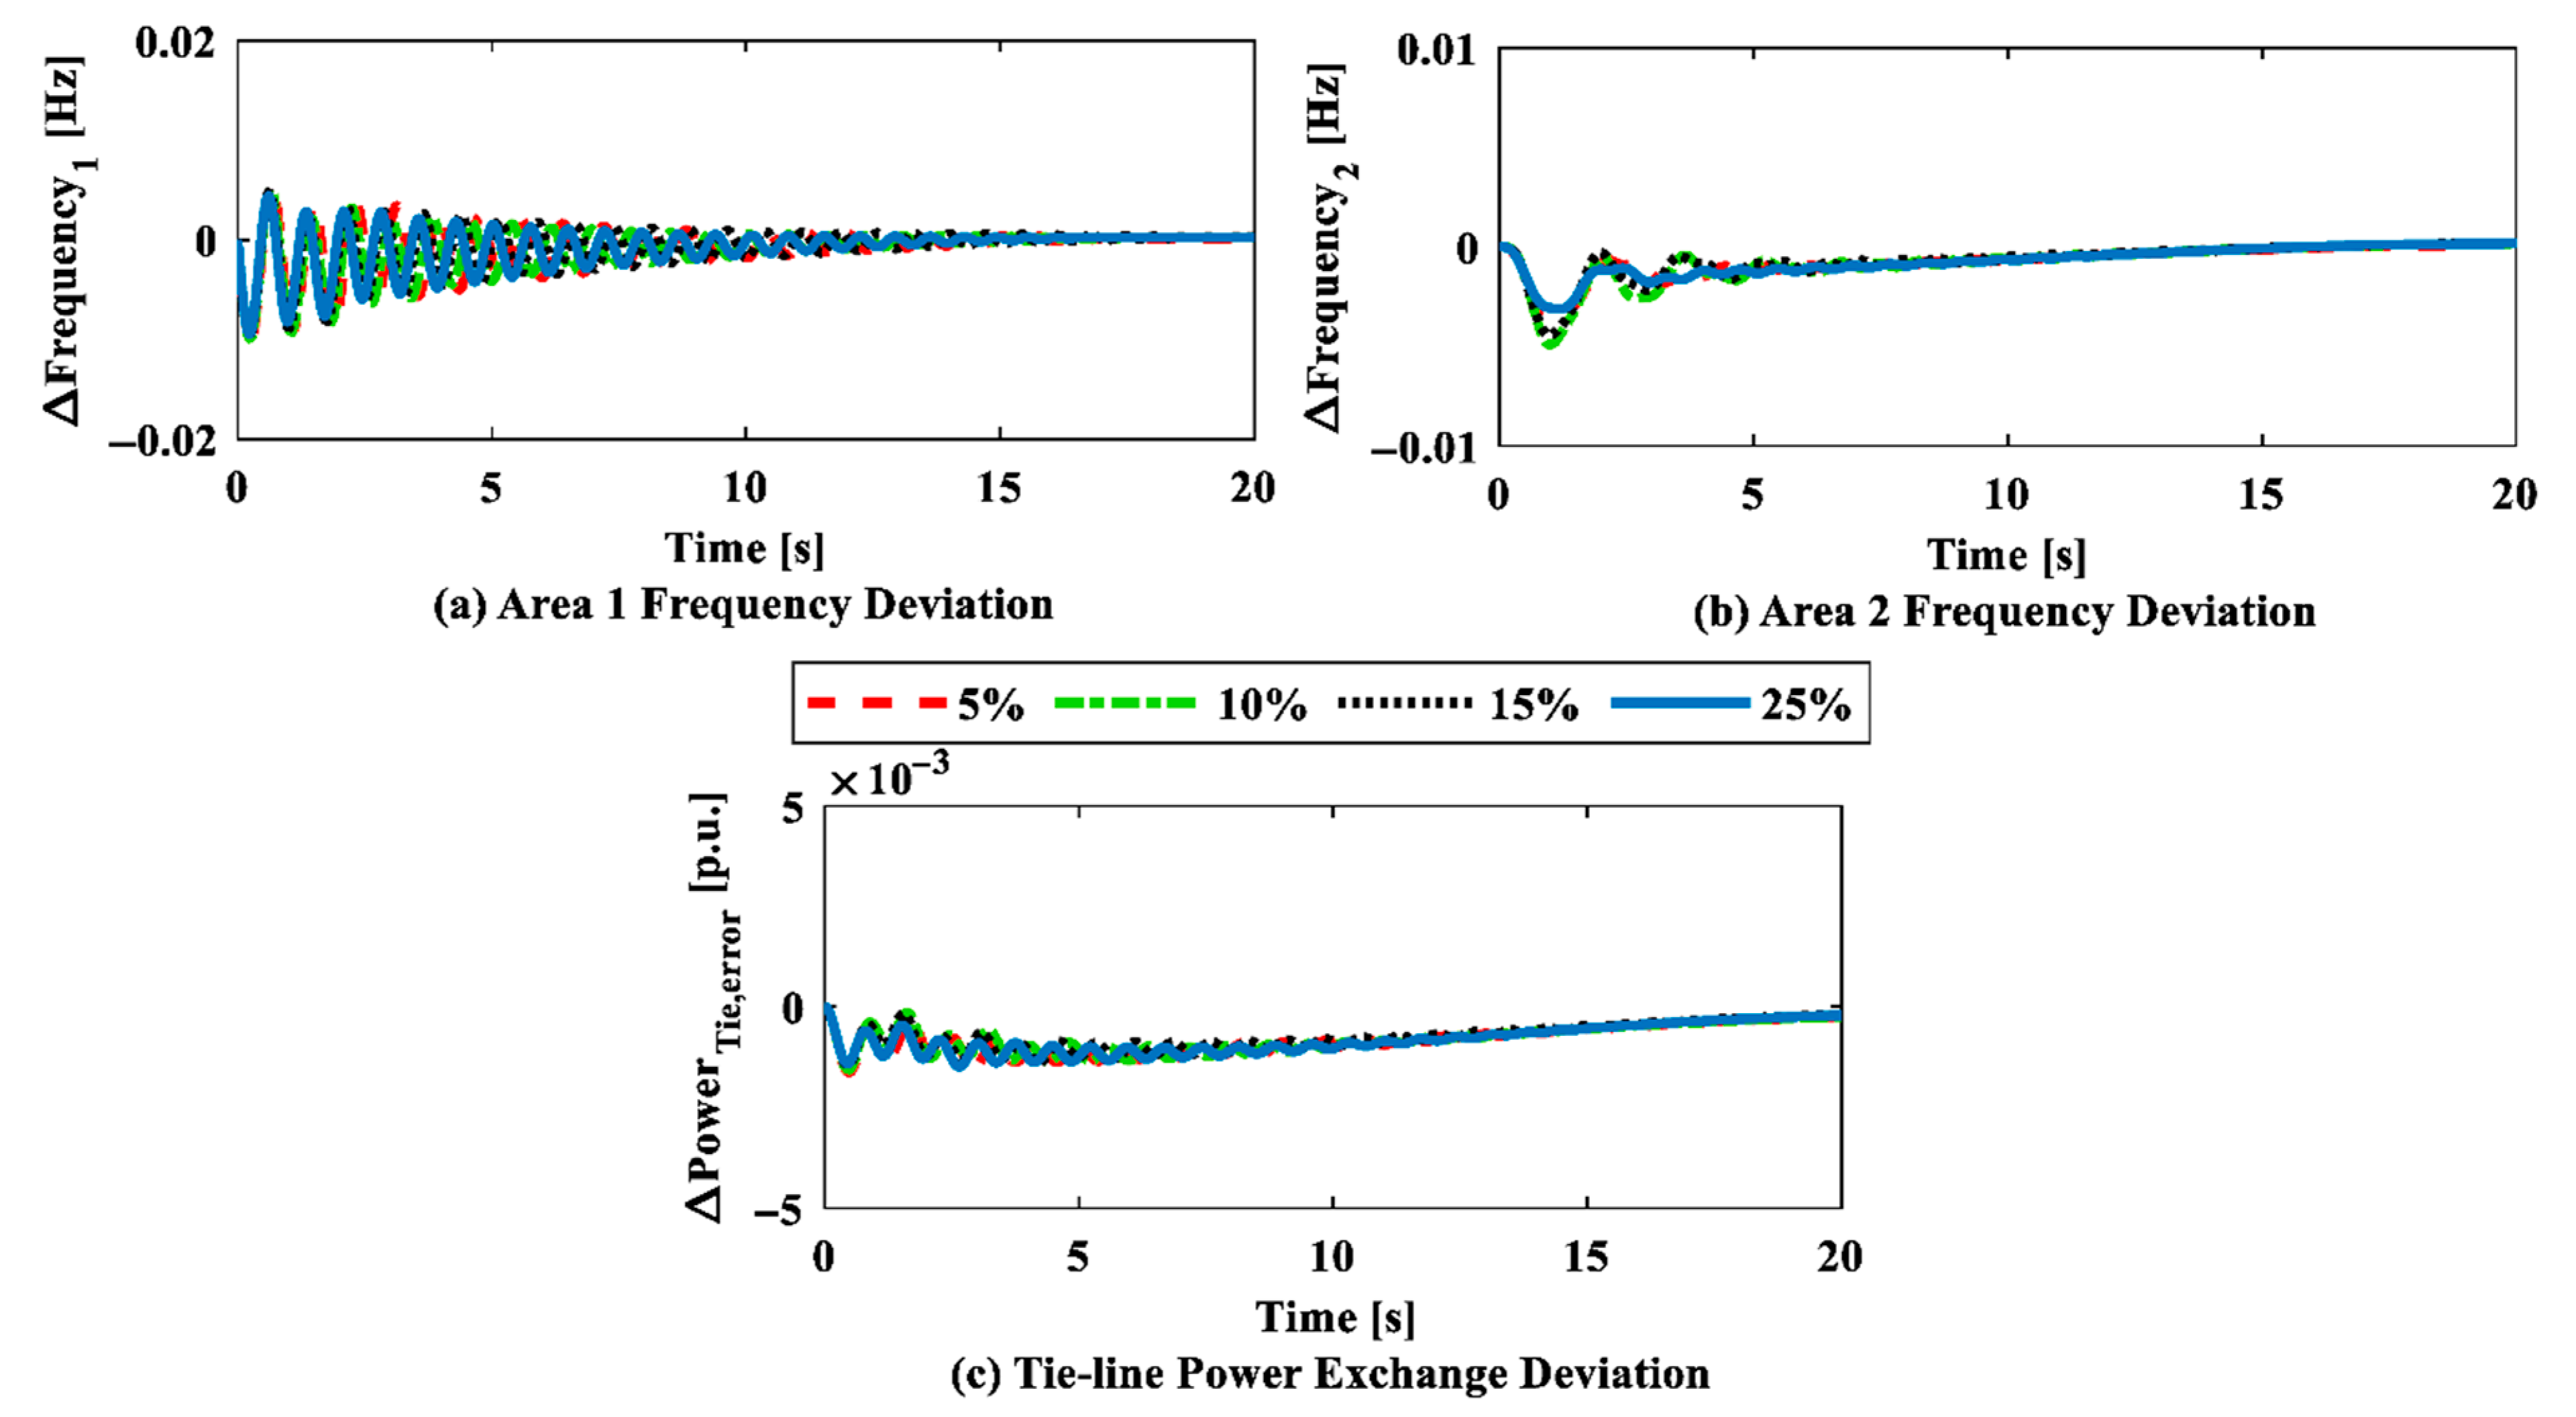
DISCOs typically try to use their position for more significant goals when they break contracts. In certain areas, all emergency power would be supplied by the GENCOs. The Area 1 DISCOs are presumably asking for a 0.05 p.u. increase over the section’s base rate (0.01 + 0.005). Production at both GENCOs has been modified to meet client demands. From 10 s to 20 s, the RES runs and adds 0.005 p.u. to the simulation. Following that, RESs will supply any extra power required during this time, while conventional sources will once more supply the predetermined amount of power. After the experiment’s 20 s, the generation is expected to drop from 0.005 p.u. to 0.003 p.u. Due to the uncertainty of the RESs, the remaining 0.002 p.u. will be divided evenly between GENCOs 1 and 2 during this period. Both Scenarios 3 and 4—with and without the HVDC connecting line—are analyzed. RESs with intermittent output, however, are noticeably less transiently reactive than HVDC tie-lines based on IET. Both the frequency response as well as the GENCOs’ reaction to this hypothetical situation are depicted in Figure 16. The high load variations and different levels of RES penetration for 5%, 10%, 15%, and 25% are displayed in Figure 17.

6.4. Case Study 4: Survey of Relevant Literature

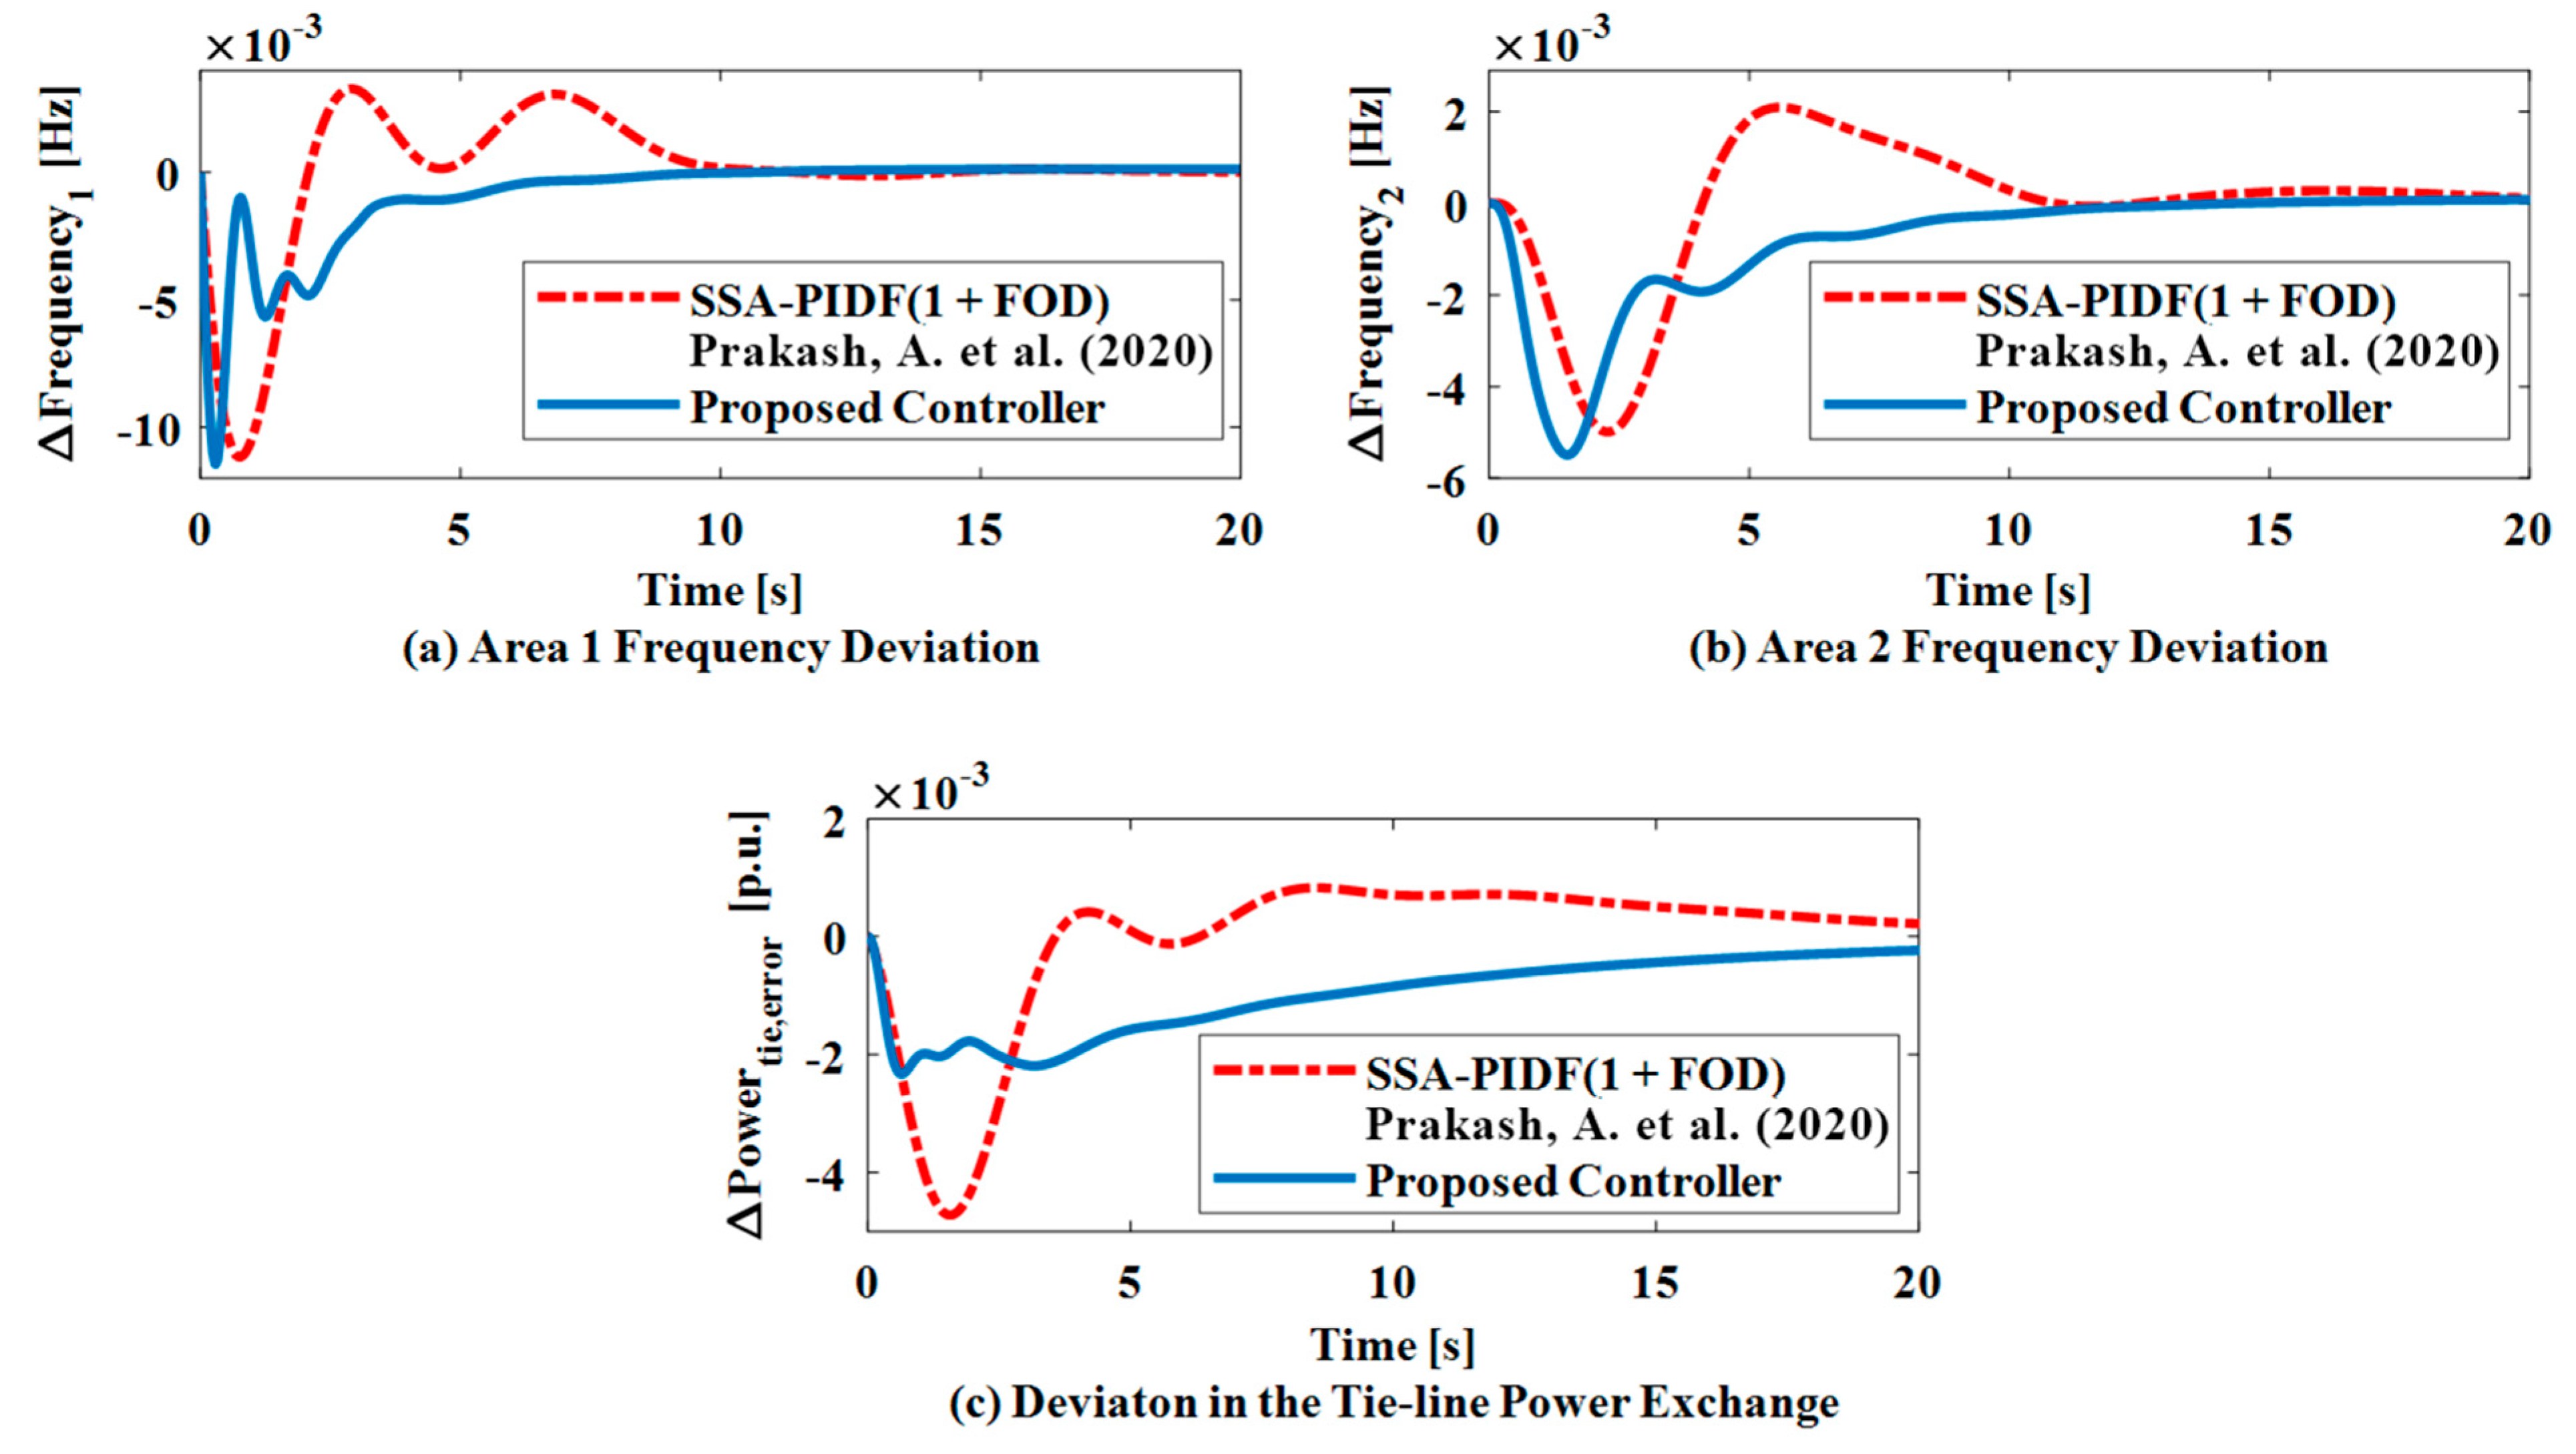
Additionally, by examining previous studies, the efficacy of the suggested QORSA-optimized controllers based on ANN-based (PIλ + PIλf) controllers is evaluated [30]. A salp swarm was used to optimize the PIDF (1 + FOD) controller that the authors employed in their research. The suggested LFC approach may be employed in place of a salp swarm-optimized PIDF (1 + FOD) controller to restore the system’s original frequency response.
Figure 18 shows the system’s dynamic response. The numerical study’s findings, which are shown in Table 10, demonstrate that the recommended controller enhanced the transient behavior. This demonstrates the adaptability of the suggested controller to various types of testing equipment.
The two-area thermal power plant, hydro power plant, and gas power plant test system in a decentralized setting was modeled using the previously described findings and debates. An IET-based HVDC tie-line reduces overshoot by 100% (Area 2 frequency deviation, such as ∆f2) and 100% (Area 1 frequency deviation, such as ∆f1). On the other hand, the findings show that the IET-based HVDC tie-line preserves the power system’s nominal values admirably. In the context of Poolco-Based Transactions (PBTs), Bilateral-Based Transactions (BBTs), as well as Contract Violation-based Transactions (CVTs), all of the major GENCOs actively participate in the decentralized power system. When SLD is considered, the suggested controller outperforms the most widely used alternative settings. The IEEE-39 bus system is modified with the addition of RESs [31]. The three control regions that comprise the IEEE-39 bus system are seen in Figure 19. Figure 20 shows how the IEEE-39 bus system responds to changes in frequency in Areas 1, 2, and 3. Using the proposed ANN-based (PIλ + PIλf) controller in the modified IEEE-39 bus system with real-time load variations is demonstrated in this example.

7. Conclusions

This research presents a new control setup for the suggested LFC technique in a decentralized two-area power system that uses RESs. The authors have examined the impact of the redesigned HVDC tie-line on the system under test. In order to determine the individual parameters of the suggested controller based on the ITSE performance index, the research used the efficient QORSA technique, which significantly improved the controller’s overall performance as well as system stability. The stability and overall precision control performance of the tested system are improved using a novel ANN-based (PIλ + PIλf) controller. Even random load disturbances can be resisted by the ideal parameters produced by the QORSA approach. Every potential deregulation scenario, including PBT, BBT, as well as CVT, has been validated by this study. By contrasting the controller’s performance with recently published work, it has also been verified that the suggested control technique enhances performance. The recommended controller fared better than the other controllers in the comparison because of its benefits, which included better noise reduction and faster rejection of disturbances. The QORSA is a popular technique for control setting optimization that is successful in lowering the Figure of Demerit (FOD). The key findings of the proposed method are:
  • By adopting an IET-based HVDC tie-line, undershoot is reduced by 49.52% and 59.04%, respectively, according to the results.
  • With an IET-based HVDC tie-line, overshoot is reduced by 100% in Areas 1 and 2 (frequency in Area 2, i.e., ∆f2, as well as frequency in Area 1, i.e., ∆f1).
  • However, the results show that the IET-based HVDC tie-line performs admirably in preserving the power system’s nominal values.
  • Lastly, a modified three-area IEEE-39 bus system is used to test the compatibility of the suggested controller, which has been tweaked by QORSA. In the IEEE-39 bus test system, the controller demonstrates effectiveness in handling real-time load variations.
In light of the growing number of problems with modern power systems, this work aimed to examine the effectiveness, efficiency, as well as versatility of the proposed QORSA-optimized ANN-based (PIλ + PIλf) controllers for LFC mechanisms. The growing popularity of electric cars, energy storage systems, as well as smart grid ideas may improve this research in the future.

Author Contributions

Conceptualization, R.S. (Rambaboo Singh); Methodology, R.S. (Rambaboo Singh); Validation, R.S. (Rambaboo Singh); Formal analysis, R.S. (Rambaboo Singh), R.S. (Ravi Shankar), and R.K.S.; Investigation, R.K. and R.S. (Ravi Shankar); Writing—original draft, R.S. (Rambaboo Singh); Writing—review and editing, R.K. and R.K.S.; Supervision, R.K. and R.S. (Ravi Shankar). All authors have read and agreed to the published version of the manuscript.

Funding

This research received no external funding.

Data Availability Statement

The original contributions presented in this study are included in the article. Further inquiries can be directed to the corresponding author.

Conflicts of Interest

The authors declare no conflicts of interest.

Abbreviations and Symbols

LFCLoad Frequency ControlλOrder of an Integrator
ANNArtificial Neural NetworkλfIntegrator’s Noninteger Order
HVDCHigh Voltage Direct Current∆PDiChange in the Load Demand
IETInertia Emulation TechniqueTR & TRHTransient Droop
QORSAQuasi-Opposition-learning-based Reptile Search AlgorithmKPsiPower System Gain
PIProportional–IntegralTtiThermal Turbine Constant
AGC Automatic Generation Control TGiThermal Governor Time Constant
ISE Integral Squared Error KriThermal Reheat Gain Constant
IAE Integral Absolute Error cgParameter of Valve Position
ITSE Integral Time-weighted Squared Error bg Constant of the Valve Actuator
ITAE Integral Time-weighted Absolute Error TfGas Delay of the Gas Turbine System
VPL Volleyball Premier League X and YLead and Lag Constant of the Gas Turbine Systems’ Governor Model
WOA Whale Optimization Algorithm TCDDischarge Delay of the Gas Turbine System
DB Dead Band TGHHydro Governor Time Constant
RES Renewable Energy Source TWWater Discharge Parameter
ACE Area Control Error TPVTime Constant of PV
GRC Generation Rate Constraint TWTSTime Constant of WTS
GENCO Generation Company RTHiReference Signal of the Thermal Power Plant
DISCO Distribution Company RGTiReference Signal of the Gas Power Plant
DPM DISCO Participation Matrix RHiReference Signal of a Hydro Power Plant
KP Proportional Constant ∆fiChange in Frequency of the ith Area
KI Integral Constant ∆PThiChange in the Power of the Thermal Power Plant
cpf Contract Participation Factor ∆PRESChange in the Power of the RES Power Plant
ij Area Number ∆PHChange in the Power of the Hydro Power Plant

Appendix A

System Parameters:
Thermal power plant: thermal governor time constant (TGi) = 0.08, thermal turbine constant (Tti) = 0.3, thermal reheat gain constant (Kri) = 0.5, thermal turbine constant (Tti) = 10;
Hydro power plant: hydro governor time constant (TGH) = 0.2, transient droop (TR) = 5, transient droop (TRH) = 28.75, water discharge parameter (Tw) = 1;
Gas power plant: lead and lag constant of the gas turbine systems’ governor model (X = 0.6), and (Y) = 1.1, parameter of valve position (cg) = 1, constant of the valve actuator (bg) = 0.049, combustion reaction delay of gas turbine system (TCR) = 0.01, time constant of the fuel system of the boiler (TF) = 0.239, discharge delay of the gas turbine system (TCD) = 0.2;
RES: time constant of PV (TPV) = 1.5, time constant of WTS (TWTS) = 1.8;
Power system: power system gain (KPsi) = 120, gain constant of the generator-load model (TPsi) = 20, frequency bias (Bi) = 0.425, reference signal of the thermal power plant (RTHi) = reference signal of the gas power plant (RGTi) = reference signal of a hydro power Plant (RHi) = 2.4, ratio of the area’s capacity a12 = −1/2;
Cases 1 and 3, ACE participation factors, apf11 = apf12 = apf21 = apf22 = 0.5; for Case 2, ACE participation factors, apf11 = 0.7, apf12 = 0.3, apf21 = 0.6, apf22 = 0.4.

References

  1. Kundur, P.; Balu, N.J.; Lauby, M.G. Power System Stability and Control; McGraw-Hill: New York, NY, USA, 1994; Volume 7. [Google Scholar]
  2. Kumar, P.; Kothari, D.P. Recent philosophies of automatic generation control strategies in power systems. IEEE Trans. Power Syst. 2005, 20, 346–357. [Google Scholar] [CrossRef]
  3. Peddakapu, K.; Mohamed, M.R.; Srinivasarao, P.; Veerendra, A.S.; Kishore, D.J.K.; Leung, P.K. Review on automatic generation control strategies for stabilising the frequency deviations in multi-area power system. Int. J. Ambient Energy 2021, 43, 5571–5594. [Google Scholar] [CrossRef]
  4. Ramesh, M.; Yadav, A.K.; Pathak, P.K. An extensive review on load frequency control of solar-wind based hybrid renewable energy systems. Energy Sources Part A Recovery Util. Environ. Eff. 2021, 47, 8378–8402. [Google Scholar] [CrossRef]
  5. Pappachen, A.; Fathima, A.P. Critical research areas on load frequency control issues in a deregulated power system: A state-of-the-art-of-review. Renew. Sustain. Energy Rev. 2017, 72, 163–177. [Google Scholar] [CrossRef]
  6. Aryan, P.; Raja, G.L. Design and Analysis of Novel QOEO Optimized Parallel Fuzzy FOPI-PIDN Controller for Restructured AGC with HVDC and PEV. Iran. J. Sci. Technol. Trans. Electr. Eng. 2022, 46, 565–587. [Google Scholar] [CrossRef]
  7. Khamies, M.; Magdy, G.; Hussein, M.E.; Banakhr, F.A.; Kamel, S. An Efficient Control Strategy for Enhancing Frequency Stability of Multi-Area Power System Considering High Wind Energy Penetration. IEEE Access 2020, 8, 140062–140078. [Google Scholar] [CrossRef]
  8. Vidyarthi, P.K.; Kumar, A. A modified tilt controller for AGC in hybrid power system integrating forecasting of renewable energy sources. Optim. Control Appl. Meth 2023, 45, 185–207. [Google Scholar] [CrossRef]
  9. Guha, D.; Roy, P.; Banerjee, S. Quasi-oppositional backtracking search algorithm to solve load frequency control problem of interconnected power system. Iran. J. Sci. Technol. Trans. Electr. Eng. 2020, 44, 781–804. [Google Scholar] [CrossRef]
  10. Khamies, M.; Magdy, G.; Ebeed, M.; Kamel, S. A robust PID controller based on linear quadratic gaussian approach for improving frequency stability of power systems considering renewables. ISA Trans. 2021, 117, 118–138. [Google Scholar] [CrossRef]
  11. Ahmed, M.; Magdy, G.; Khamies, M.; Kamel, S. Modified TID controller for load frequency control of a two-area interconnected diverse-unit power system. Electr. Power Energy Syst. 2022, 135, 107528. [Google Scholar] [CrossRef]
  12. Arya, Y. A novel CFFOPI-FOPID controller for AGC performance enhancement of single and multi-area electric power systems. ISA Trans. 2020, 100, 126–135. [Google Scholar] [CrossRef] [PubMed]
  13. Singh, K.; Amir, M.; Arya, Y. Optimal dynamic frequency regulation of renewable energy based hybrid power system utilizing a novel TDF-TIDF controller. Energy Sources Part A Recovery Util. Environ. Eff. 2022, 44, 10733–10754. [Google Scholar] [CrossRef]
  14. Sekyere, Y.O.M.; Effah, F.B.; Okyere, P.Y. Optimally tuned cascaded FOPI-FOPIDN with improved PSO for load frequency control in interconnected power systems with RES. J. Electr. Syst. Inf. Technol. 2024, 11, 25. [Google Scholar] [CrossRef]
  15. Patel, N.C.; Sahu, B.K. Design and implementation of a novel FO-hPID-FPID controller for AGC of multiarea interconnected nonlinear thermal power system. Int. Trans. Electr. Energy Syst. 2021, 31, e13078. [Google Scholar] [CrossRef]
  16. Aryan, P.; Raja, G.L.; Mehta, U.; Chelliah, T.R.; Muduli, U.R. A Resilient Tri-Parametric Fractional Frequency Control for Cybersecurity Threats Amid Latency. IEEE Trans. Ind. Appl. 2025, 61, 5597–5611. [Google Scholar] [CrossRef]
  17. Chen, L.; Salem, M.; Ben Hamad, K.; Prabaharan, N.; Ueda, S.; Senjyu, T. Design of a Two-Level Controller for Load Frequency Control in the Presence of Wind Farms and Battery Energy Storage System Based on VIC. IEEE Access 2025, 13, 148254–148268. [Google Scholar] [CrossRef]
  18. Jin, L.; He, Y.; Zhang, C.-K.; Shangguan, X.-C.; Jiang, L.; Wu, M. Robust Delay-Dependent Load Frequency Control of Wind Power System Based on a Novel Reconstructed Model. IEEE Trans. Cybern. 2022, 52, 8. [Google Scholar] [CrossRef]
  19. Ojha, S.K.; Maddela, C.O. A FOPIDN-(1+PIDN) controller design and optimization for load frequency control system integrated with renewables and electric vehicles. Electr. Eng. 2025, 107, 7617–7643. [Google Scholar] [CrossRef]
  20. Jawahar, A.; Ramakrishnan, K. Impact of Time Delay Margin on the Stability of Load Frequency Systems with Electric Vehicle Aggregator. Jordan J. Electr. Eng. 2022, 8, 151–164. [Google Scholar] [CrossRef]
  21. Demilade, D.; Peter, D.; Oluseyi, O. Optimal Under-Frequency Load Curtailment via Continuous Load Control in a Single Area Power System Using Fuzzy Logic, PIDFuzzy and Neuro Fuzzy (ANFIS) Controllers. Jordan J. Electr. Eng. 2018, 4, 208–223. [Google Scholar]
  22. Anand, A.; Aryan, P.; Kumari, N.; Raja, G.L. Type-2 fuzzy-based branched controller tuned using arithmetic optimizer for load frequency control. Energy Sources Part A Recovery Util. Environ. Eff. 2022, 44, 4575–4596. [Google Scholar] [CrossRef]
  23. Singh, R.K.; Verma, V. ANN-tuned PIDN controller for LFC with modified HVDC tie-line in deregulated Environment. Int. J. Inf. Technol. 2023, 15, 4193–4210. [Google Scholar] [CrossRef]
  24. Singh, R.K.; Verma, V. An Intelligence-Based Controller for Improved Frequency Regulation in Deregulated Power Environment. Jordan J. Electr. Eng. (JJEE) 2024, 10, 3. [Google Scholar] [CrossRef]
  25. Zhang, H.H.; Gong, L.F.; Liu, X.Z.; Xu, Y.X.; Cheng, G.S.; Liu, Y.; Shi, G.M.; Zheng, C.; Han, Y.J. Design of low-SAR and high on-body efficiency tri-band smartwatch antenna utilizing the theory of characteristic modes of composite PEC-lossy dielectric structures. IEEE Trans. Antennas Propag. 2022, 71, 1913–1918. [Google Scholar] [CrossRef]
  26. Singh, R.; Kumar, R.; Raj, U.; Shankar, R. Robust Load Frequency Control in Cyber-Vulnerable Smart Grids with Renewable Integration. Energies 2025, 18, 2899. [Google Scholar] [CrossRef]
  27. Kumar, V.; Sharma, S.; Kumar, V.; Dev, A. Optimal voltage and frequency control strategy for renewable-dominated deregulated power network. Sci. Rep. 2025, 15, 398. [Google Scholar] [CrossRef]
  28. Debnath, M.K.; Agrawal, R.; Tripathy, S.R.; Choudhury, S. Artificial neural network tuned PID controller for LFC investigation including distributed generation. Int. J. Numer. Model. El. 2020, 33, e2740. [Google Scholar] [CrossRef]
  29. Abualigah, L.; Abd, M.; Sumari, P.; Woo, Z. Reptile Search Algorithm (RSA): A nature-inspired meta-heuristic optimizer. Expert. Syst. Appl. 2022, 191, 116158. [Google Scholar] [CrossRef]
  30. Prakash, A.; Kumar, K.; Parida, S.K. PIDF (1 + FOD) controller for load frequency control with SSSC and AC–DC tie-line in deregulated environment. IET Gener. Transm. Distrib. 2020, 14, 2751–2762. [Google Scholar] [CrossRef]
  31. Gheisarnejad, M.; Khooban, M.H. Design an optimal fuzzy fractional proportional integral derivative controller with derivative filter for load frequency control in power systems. Trans. Inst. Measur. Control 2019, 41, 2563–2581. [Google Scholar] [CrossRef]
  32. Shangguan, X.-C.; He, Y.; Zhang, C.-K.; Jin, L.; Yao, W.; Jiang, L.; Wu, M. Control Performance Standards-Oriented Event-Triggered Load Frequency Control for Power Systems Under Limited Communication Bandwidth. IEEE Trans. Control Syst. Technol. 2022, 30, 860–868. [Google Scholar] [CrossRef]
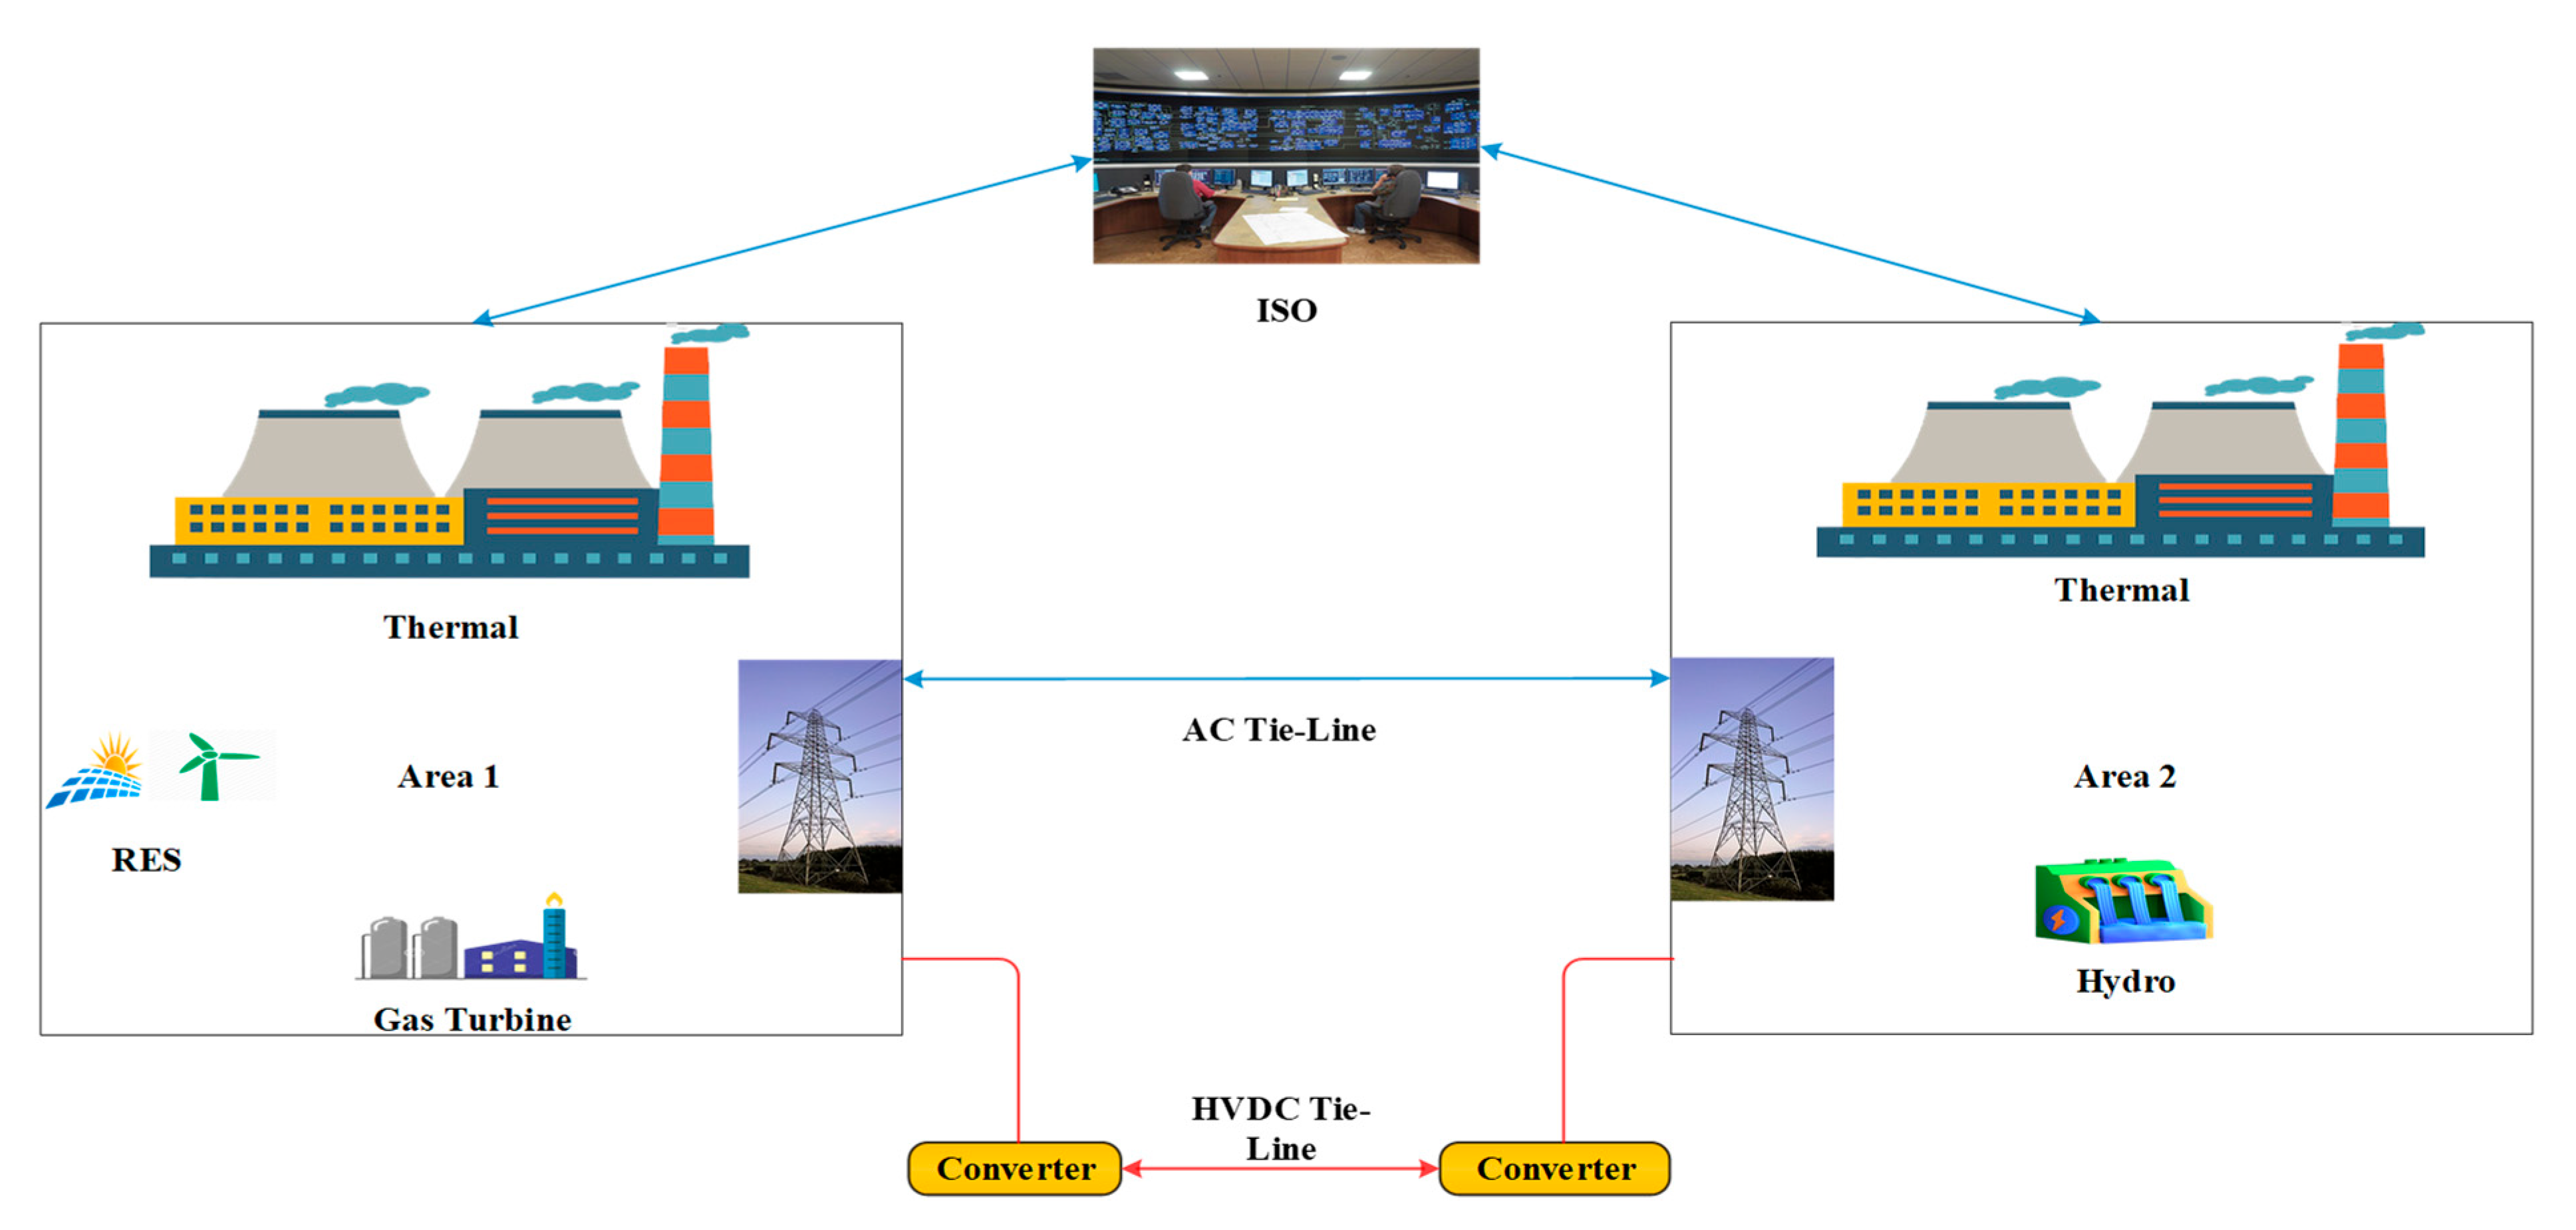
Figure 1. Diagram of a 2-area interlinked power system [24].
Processes 13 03562 g001
Figure 2. Schematic test setup for the simulation [24].
Processes 13 03562 g002
Figure 3. A model with inputs and outputs for a transfer function [24].
Processes 13 03562 g003
Figure 4. AC-HVDC tie-line schematic diagram [24].
Processes 13 03562 g004
Figure 5. Description of the IET model [24].
Processes 13 03562 g005
Figure 6. An ANN-based closed-loop (PIλ + PIλf) controller [24].
Processes 13 03562 g006
Figure 7. Backpropagation algorithm flowchart representation [24].
Processes 13 03562 g007
Figure 8. ANN-based (PIλ + PIλf) controller [24].
Processes 13 03562 g008
Figure 9. Overall QORSA flowchart representation [26].
Processes 13 03562 g009
Figure 10. Individual controllers for SLD test system response: (a) Area 1 frequency deviation, (b) Area 2 frequency deviation, (c) Deviation in tie-line power exchange, and (d) OF vs. no. of iterations.
Processes 13 03562 g010
Figure 11. Four objective functions test the system results: (a) Area 1 frequency deviation, (b) Area 2 frequency deviation, (c) Deviation in tie-line power exchange, and (d) PBT case GENCO response.
Processes 13 03562 g011
Figure 12. Different controllers for RLD test system results: (a) RLD pattern, (b) Frequency deviation in Area 1, (c) Frequency deviation in Area 2, and (d) Deviation in tie-line power exchange.
Processes 13 03562 g012
Figure 13. The BBT reaction consists of (a) Area 1 frequency deviation for Scenarios 1 and 2, (b) Area 2 frequency deviation for Scenarios 1 and 2, (c) the GENCOs’ response in Area 1, and (d) the GENCOs’ response in Area 2.
Processes 13 03562 g013
Figure 14. Different GRCs for SLD test system response: (a) Area 1 frequency deviation, (b) Area 2 frequency deviation, and (c) Deviation in tie-line power exchange.
Processes 13 03562 g014
Figure 15. Closed-loop transfer functions of Bode plots: (a) Area 1 and (b) Area 2.
Processes 13 03562 g015
Figure 16. CVT response of the tested system: (a) Area 1 frequency deviation for Scenarios 3 and 4, (b) Area 2 frequency deviation for Scenarios 3 and 4, (c) GENCO response of Area 1, (d) GENCO response of Area 2.
Processes 13 03562 g016
Figure 17. Varying levels of RES penetration or extreme load fluctuations: (a) Area 1 frequency deviation, (b) Area 2 frequency deviation, and (c) Tie-line power exchange deviation.
Processes 13 03562 g017
Figure 18. Test system response [30]: (a) Area 1 frequency deviation, (b) Area 2 frequency deviation, and (c) Deviation in tie-line power exchange.
Processes 13 03562 g018
Figure 19. IEEE-39 bus system [32].
Processes 13 03562 g019
Figure 20. Performance of proposed controller: (a) Area 1 frequency deviation, (b) Area 2 frequency deviation, (c) Area 3 frequency deviation, (d) tie-line power exchange deviation in Areas 1 and 2, (e) tie-line power exchange deviation in Areas 2 and 3, (f) tie-line power exchange in deviation in Areas 1 and 3.
Processes 13 03562 g020aProcesses 13 03562 g020b
Table 1. A review of AGC work.
AuthorsAlgorithmControllerDeregulationNonlinearityEnergy Storage SystemsGenerating Units
Arya Y. [12]ICAFuzzy FOPI-FOPDNNoNoneNoneThree-area thermal
Sekyere Y.O.M. et al. [14]PSOFOPI-FOPIDNNoGDB, GRCNoneThermal, PV, wind
Patel and Sahu [15]hPSO-MSC algorithmFO-hPID-Fuzzy PIDNoGRCNoneThree-area thermal
Singh R.K. and Verma V. [24]QOVPL algorithmANN-based
(PIλf + PIλDN)
YesGDB, GRC, BDIETThermal,
hydro, gas,
RES
Singh R. et al. [26]QOVPL algorithmFuzzy-LADRCNoGRCEVRES
Proposed WorkQORSAANN-based (PIλ + PIλf)YesGRCIETThermal, hydro, gas, RES, IEEE-39 bus system
Table 2. Summary of Performance Impact.
ParameterRole in ANN TrainingEffect on System Performance
Number of layers (3)Defines the model’s ability to map nonlinear relationshipsMore layers → higher learning capacity, but risk of overfitting
Learning rate (η)Controls weight update magnitudeToo low: slow learning; too high: instability
BackpropagationOptimization algorithmReduces frequency error and settling time
Hidden neuronsDetermine feature extraction capabilityMore neurons improve accuracy but increase computational cost
Table 3. QORSA optimal controller gain values.
Control ParametersFOPIFuzzy FOPIFuzzy (PIλ + PIλDN)ANN-Based PIλDNProposed Controller
A1A2A1A2A1A2A1A2A1A2
KPi0.02340.18470.12840.55261.25680.53940.39720.07490.13070.0081
KIi0.12370.58420.24930.11021.43350.48310.18640.14350.02610.0111
KDi----1.91040.91050.08150.0047--
KfPi----1.63591.1047--0.08240.0179
KfIi----0.89171.0048--0.02050.0014
Ni----61.43862.38217.21827.283--
λi0.48901---1.18911.18241.41821.83270.29140.0150
λfi-0.59341.52261.44520.46051.5627--0.03700.2901
K1i--0.09710.17240.87901.7628----
K2i--0.38750.02710.68640.5435----
w1----1.98520.57890.08960.14080.19580.0022
w2----0.86491.40720.01820.19890.31470.2920
Table 6. QORSA’s optimal gain values in different scenarios, with and without an IET-based HVDC.
Control ParametersScenario 1Scenario 2Scenario 3Scenario 4
Area 1Area 2Area 1Area 2Area 1Area 2Area 1Area 2
KPi0.11520.24410.27640.01950.06900.22350.42680.3817
KIi0.04170.67580.00520.16420.09610.84520.02590.5947
KfPi0.88390.89440.81790.84540.82980.81230.81790.8219
KfIi0.74870.76820.74310.75280.74370.75460.82450.8346
λi1.65471.78910.97480.87241.12191.42170.79650.6645
λfi1.67821.79360.98120.88191.14291.44810.81500.6814
w10.18540.24370.09120.29390.49320.34640.79160.8431
w20.56410.71450.16750.56270.14520.14590.59490.3319
Table 7. Evaluating hypotheses’ efficacy with as well as without an IET-based HVDC tie-line.
PerformanceScenario 1Scenario 2Improvement (%)Scenario 3Scenario 4Improvement (%)
OS∆f10.004240.000001000.0002980.00026112.41
∆f20.001260.000001000.0001400.00012014.28
US (−ve)∆f10.049170.0201459.040.0196150.0117240.24
∆f20.0442810.0223549.520.0991160.04601853.40
Ts∆f19.16337.491218.2422.6221.385.48
∆f210.25468.852013.6723.6821.339.92
OF0.020310.008458.640.00330.002621.21
Table 10. Comparing the proposed controller to [30].
Performance TermsReference [30]Proposed ControllerImprovement (%)
OS∆f10.0032660.0000000100
∆f20.0020760.0000000100
∆P120.0008210.0000000100
US (−Ve)∆f10.0116000.01144291.35
∆f20.0049700.00548245−10.31
∆P120.0047210.0023331650.57
Ts∆f19.09737.0225222.80
∆f216.80618.5121549.35
∆P1219.22269.4377950.90
OF0.00024350.000154236.67
Disclaimer/Publisher’s Note: The statements, opinions and data contained in all publications are solely those of the individual author(s) and contributor(s) and not of MDPI and/or the editor(s). MDPI and/or the editor(s) disclaim responsibility for any injury to people or property resulting from any ideas, methods, instructions or products referred to in the content.