Article

Optimization Planning of a New-Type Power System Considering Supply–Demand Probability Balance

1
School of Electrical and Electronic Engineering, Shandong University of Technology, Zibo 255000, China
2
Economic and Technological Research Institute, State Grid Shandong Electric Power Company, Jinan 250000, China
*
Author to whom correspondence should be addressed.
Processes 2025, 13(11), 3564; https://doi.org/10.3390/pr13113564 (registering DOI)
Submission received: 16 October 2025 / Revised: 29 October 2025 / Accepted: 1 November 2025 / Published: 5 November 2025
(This article belongs to the Section Energy Systems)

Abstract

Traditional power system planning methods are often based on deterministic assumptions, which cannot effectively address the uncertainties brought by high proportions of renewable energy sources. This may result in insufficient power supply or wasted resources. This paper proposes a novel optimization planning method for power systems, combining a hierarchical Copula model with a comprehensive risk assessment approach. The aim is to optimize the balance between investment costs and operational risks in large-scale power systems. The hierarchical Copula model is employed to handle the spatial correlation and temporal dependence between wind power, photovoltaic power, and load. Multiple joint scenarios are generated using the Monte Carlo method to reflect the complex interactions between different geographic locations, providing more comprehensive data support for risk assessment. Additionally, a CVaR-based comprehensive risk assessment method is used to quantify the risks of power loss and resource wastage, which are then integrated into a comprehensive risk indicator through weighted aggregation. An optimization framework considering supply–demand probability balance constraints is proposed, allowing for supply–demand balance at a certain probability level. Benders decomposition is used to improve computational efficiency. Simulation results show that, compared to traditional methods, the proposed model significantly reduces the curtailment rate and supply–demand imbalance frequency, improving the system’s adaptability to uncertainties and extreme scenarios.

1. Introduction

With the acceleration of the global energy transition, the proportion of renewable energy in power systems is continuously increasing. However, the output of renewable energy is highly random and volatile, which presents new challenges for the planning and operation of power systems. Particularly in scenarios with high renewable energy penetration, traditional power system planning methods are often based on deterministic assumptions, where generation capacity and load demand are assumed to be known and accurately predictable. These methods, however, fail to effectively address the randomness and volatility of renewable energy, which may lead to power shortages or resource wastage in actual system operations [1]. Therefore, balancing the economy and reliability of the system has become an important issue in large-scale power system planning [2].
In current research, the planning of large power grids, especially in scenarios with high renewable energy penetration, has become a key area of study. A high proportion of renewable energy requires the power system to have higher flexibility and adaptability [3]. To this end, many studies have begun to explore new planning models, such as scenario analysis-based methods, which simulate uncertainty by generating different typical scenarios, or by using probability distributions to model the randomness of wind and solar power [4,5]. However, these methods often overlook the spatial correlations between different geographical locations in the power system and fail to effectively capture the complex dependencies between wind, solar, and load [6,7]. Therefore, existing scenario generation methods and uncertainty modeling still face many challenges.
In recent years, Copula functions, as an effective tool for describing the dependence relationships between multiple variables, have gradually been applied in power system uncertainty modeling [8,9]. Copula functions can capture the dependencies between variables while preserving the marginal distribution characteristics of each variable, and they are particularly advantageous in modeling complex relationships in both spatial and temporal scales [10]. However, most existing Copula models mainly focus on modeling the correlation between wind power and solar power, lack comprehensive consideration of load demand, and typically ignore spatial correlations, which limits the accuracy and reliability of scenario generation [11].
Moreover, integrated risk assessment has become system optimization. In the face of high uncertainty, Conditional Value-at-Risk (CVaR) is widely used to assess system risk, particularly in scenarios with high renewable energy penetration. CVaR can effectively evaluate system performance in extreme scenarios and is especially suitable for large-scale power system planning [12]. Although significant progress has been made in CVaR-based risk assessment, existing methods still face challenges, especially in how to integrate CVaR with multi-source uncertainty for optimization [13,14].
To address the above issues, this paper proposes a novel power system optimization planning method based on a hierarchical Copula model and CVaR integrated risk assessment. This method models the correlation between wind power, solar power, and load in two layers: the first layer uses Gaussian Copula to capture local correlations, and the second layer uses Clayton Copula to describe dependencies over longer time scales [15,16]. With this innovative approach, we can handle dependencies at different levels across spatial and temporal scales, better adapting to the complexity of the power system. Additionally, this model integrates a CVaR-based risk assessment framework, quantifying both loss-of-load and resource wastage risks, further enhancing the robustness and economic efficiency of the planning solutions [17,18].
The novelty of this study lies in its ability to comprehensively capture spatial correlations and complex dependencies between multi-source uncertainties in the power system through a hierarchical Copula model, overcoming the limitations of existing methods in handling these complex relationships [19]. At the same time, the supply–demand probability balance constraint proposed in this study ensures that the system can maintain reliable power supply under high renewable energy penetration, reducing curtailment and supply–demand imbalance frequency, thus significantly improving the economic and reliability performance of the power system [19]. Unlike prior Copula-based methods that often focus on pairwise correlations or single-layer models [8,9,11], our hierarchical Copula framework captures both local and long-range dependencies among wind, solar, and load, enhancing scenario generation accuracy. Furthermore, integrating CVaR-based risk assessment with probabilistic supply–demand balance constraints advances theoretical modeling by simultaneously addressing economic efficiency and system reliability in high renewable penetration scenarios.

2. Correlation Scenario Generation

2.1. Definition of Marginal Distribution

The random variable Xi for each geographical location i (wind power Pw,I, photovoltaic power Ps,I, and load PL,i) defines the marginal distribution. The marginal distribution is defined based on the actual physical models and historical data, as follows:
(1)
Photovoltaic Marginal Distribution
F s , i ( x ) = P ( P s , i x )
In the equation, Fs,i(x) represents the cumulative distribution function (CDF) of the photovoltaic output at location i, indicating the probability of Ps,i being less than or equal to x, where x is any real number and represents the possible values of photovoltaic output. In planning, x can be used to set output thresholds and analyze the system’s performance under different output levels. Ps,i denotes the photovoltaic output at geographical location i.
The output of the photovoltaic power source at a certain moment is related to the radiation intensity and temperature at that moment, as represented by Equation (2). The actual radiation intensity is calculated using Equation (3).
P s , i ( t ) = P s t d F 1000 [ 1 + α T ( T 25 ) ]
F = ( 1 ε ) F s t d
Pstd is the photovoltaic output under standard illumination of 1000 W/m2 and standard temperature of 25 °C. F is the actual radiation intensity received by the photovoltaic power source, αT is the power temperature coefficient, T is the actual temperature of the photovoltaic power source, and ε is the reduction coefficient for the output of the photovoltaic power source due to weather changes such as shading and cloud cover, simulated using a Beta distribution. Fstd is the standard illumination under conditions where cloud cover is not considered and is determined by the local geographic location.
(2)
Wind Power Marginal Distribution
F w , i ( x ) = P ( P w , i x )
In the equation, Fw,i (x) represents the cumulative distribution function (CDF) of the wind power output at geographical location i, indicating the probability that Pw,i is less than or equal to x, where x is any real number representing possible values of wind power output. In planning, x can be used to set output thresholds and analyze system performance under different output levels. Pw,i is the power output of the wind farm at location i, reflecting the generation capacity of the wind farm at a given moment, which is affected by the wind speed v(t).
According to the power curve of the wind turbine, the relationship between Pw,i and the wind speed v(t) is a piecewise function:
P w , i ( t ) = 0 , 0 < ν ( t ) ν s 1 2 C P S w ρ ( v ( t ) ) 3 , ν s < ν ( t ) ν r , P w 0 , ν r < ν ( t ) ν 0 0 , ν ( t ) > ν 0
In the equation, Pw,i(t) is the wind power output at time t; v(t) is the wind speed at time t; vs is the cut-in wind speed of the wind turbine—when the wind speed reaches vs, the turbine meets the grid-connection requirements and can be used for power generation; CP is the wind energy utilization coefficient; Sw is the swept area of the wind turbine rotor; ρ is the air density; vr is the rated wind speed, which is the minimum wind speed at which the wind turbine outputs at rated power; v0 is the cut-out wind speed—when the wind speed exceeds v0, the environmental conditions are no longer suitable for turbine operation, and the turbine shuts down.
The wind speed v(t) typically follows a Weibull distribution. This approach ensures that the model captures the actual fluctuation characteristics of wind power output, such as zero output under low wind speeds and saturation effects at rated wind speed.
(3)
Load Marginal Distribution
In actual power system operation, electricity load demand is influenced by various factors, including seasonal changes, weather conditions, industrial production activities, and people’s lifestyle. These factors lead to significant variability in load. Actual load data often exhibit symmetric fluctuations around the mean. Therefore, in the planning of new-type power systems, load is typically modeled as a random variable that follows a normal distribution:
P L , i ( x ) ~ N ( μ L , i , σ L , i 2 )
F L , i ( x ) = P ( P L , i x ) = Φ ( x μ L , i σ L , i )
In the equation, FL,i(x)s the cumulative distribution function (CDF) of the load at location i, and PL,i is the electricity demand at geographical location i, which follows a normal distribution. μL,i is the average load at location i, and σL,i is the load fluctuation amplitude at location i.

2.2. Hierarchical Copula Model Construction

After defining the marginal distributions, different types of physical variables are standardized into uniform distribution variables through the probability integral transform. This process converts the heterogeneous distributions of wind power Pw,i, photovoltaic power Ps,i, and load PL,i into uniform distribution variables Ui within the [0,1] interval, eliminating the differences in distribution types between the variables. This allows for the handling of correlations between multiple variables under the Copula framework. The formula is as follows:
U i = F i ( X i )
U s , i = F s , i ( X s , i )
U w , i = F w , i ( X w , i )
U l , i = F l , i ( X l , i )
In the equation, Ui is the uniform distribution variable, representing the standardized probability value at location i. Fi is the marginal distribution function at location i (i.e., Fw,i, Fs,i or FL,i), and Xi is the original random variable at location i. Us,i, Uw,i, and Ul,i are the standardized uniform distribution variables, representing the normalized photovoltaic power, wind power, and load at location i, respectively.
A Copula is a mathematical tool used to connect multiple marginal distributions and describe the dependencies between variables. In multivariate distributions, Copula functions link variables from their respective marginal distributions, capturing the dependencies among them.
To address the complex spatial and temporal relationships among wind power, photovoltaic power, and load, a hierarchical Copula model is adopted.
The main idea of the hierarchical Copula model is to divide the dependencies in the system into multiple levels, with each level of the Copula function representing dependencies at a different scale.
(1)
First-level Copula
Assuming there exists local correlation among wind power, photovoltaic power, and load, to model this correlation, we use the Gaussian Copula, which is suitable for describing data with symmetric dependencies.
C L a g r e 1 ( U w , i , U s , i ) = exp ( 1 2 ( 1 ρ 2 ) Φ 1 ( U w , i ) σ w 2 + Φ 1 ( U s , i ) σ s 2 2 ρ Φ 1 ( U w , i ) σ w Φ 1 ( U s , i ) σ s )
In the equation, ρ is the correlation coefficient between wind power and photovoltaic power, and σw and σs are the standard deviations of wind power and photovoltaic power, respectively. CLayer1 is the first-level Copula function, used to capture the local correlation between wind power and photovoltaic power.
(2)
Second-Level Copula
The second-level Copula is used to describe dependencies over longer time scales, such as the long-term dependencies among wind power, photovoltaic power, and load. To capture these correlations, the Clayton Copula is used, which is suitable for modeling variables with asymmetric dependencies.
C L a y e r 2 ( U w , i , U s , i , U l , i ) = ( U w , i θ 1 + U s , i θ 2 ) 1 θ i · ( U l , i θ 3 ) 1 θ 3
In the equation, θ is the dependence parameter in the Clayton Copula, which determines the strength of the correlation between wind power and photovoltaic power. CLayer2 is the second-level Copula, which describes the long-range dependencies among wind power, photovoltaic power, and load.
Finally, the two levels of Copula functions are combined into a joint Copula to describe the joint distribution of wind power, photovoltaic power, and load. The resulting joint Copula model is as follows:
C t o t a l ( U w , i , U s , i , U l , i ) = C L a y e r 1 ( U w , i , U s , i ) · C L a y e r 2 ( U w , i , U s , i , U l , i )
(3)
Parameter Estimation
To estimate the parameters in the Copula model from data, we use the Maximum Likelihood Estimation (MLE) method to maximize the log-likelihood function and obtain the optimal parameter estimates.
Given sample data {Uw,i, Us,I, Ul,i}, the maximum likelihood function is as follows:
L ( θ ) = i = 1 n c ( U w , i , U s , i , U l , i )
In the equation, c(Uw,i, Us,I, Ul,i|θ) is the density function of the joint Copula, and θ is the parameter to be estimated.
Based on the joint Copula function mentioned above, uniform variables for multiple scenarios are sampled from the joint distribution. The formula is as follows:
c G a u s s i a n ( U w , i , U s , i | θ ) = 1 2 π ( 1 ρ 2 ) exp ( 1 2 π ( 1 ρ 2 ) Φ 1 ( U w , i ) σ w 2 + Φ 1 ( U s , i ) σ s 2 2 ρ Φ 1 ( U w , i ) σ s Φ 1 ( U s , i ) σ s )
The density function of the Clayton Copula used in the second layer is as follows:
c C l a y t o n ( U w , i , U s , i , U l , i ) = θ + 1 ( U w , i θ + 1 + U s , i θ + 1 ) 1 θ
By maximizing the log-likelihood function using MLE, the parameter θ is obtained.
(4)
Scenario Generation from the Joint Distribution
By using the joint Copula model and maximum likelihood estimation, multiple scenarios can be generated from the joint distribution for risk assessment and system optimization. Based on the estimated joint Copula model, K scenarios are sampled from the joint Copula function, with each scenario corresponding to a set of uniform variables U w , i ( k ) , U s , i ( k ) , U i , i ( k ) :
U w , i ( k ) , U s , i ( k ) , U l , i ( k ) k = 1 K
In the equation, U w , i ( k ) , U(k)s, U l , i ( k ) represent the set of uniform variables for the k-th scenario, where k = 1, 2,…, K, and K is the total number of scenarios.
Using the Monte Carlo method, K sets of samples are extracted from the joint Copula function, with each sample set representing a possible supply–demand combination. These samples not only reflect the marginal distribution characteristics of each location but also capture the interactions between geographical locations through the spatial correlation matrix R. In the planning of new power systems, this sampling method can generate a diverse range of scenarios, including extreme cases, thus providing comprehensive data support for risk assessment and optimization. The randomness of the Monte Carlo method ensures the statistical representativeness of the samples, while the spatial characteristics of R enhance the physical realism of the samples. Finally, the sampled uniform variables are inverse-transformed into actual physical quantities, forming scenario data that can be used for planning.
X i ( k ) = F i 1 ( U i ( k ) )
In the equation, X i ( k ) is the physical quantity at location i in the k-th scenario, F i 1 is the inverse function of the marginal distribution, and U i ( k ) is the uniform variable at location i in the k-th scenario.
Finally, K joint scenarios are generated:
P w , 1 ( k ) , P s , 1 ( k ) , P L , 1 ( k ) , , P w , i ( k ) , P s , i ( k ) , P L , i ( k ) k = 1 K

3. Comprehensive Risk Indicator Calculation

In power system risk assessment, loss-of-load risk and resource curtailment risk are the core dimensions for measuring the uncertainty on both the supply and demand sides. These two aspects characterize system operational risk from the perspectives of power supply reliability and resource utilization efficiency, respectively. The main sources of risk in power systems are insufficient power supply and inefficient resource utilization. This paper quantifies these two types of losses using explicit mathematical formulas and performs the calculations based on the scenarios generated by the hierarchical Copula model.
According to the planning decision x, the loss for each scenario is calculated. The loss of load reflects the amount of loss in the k-th scenario when the combined wind power and photovoltaic output of the power system cannot meet the total load demand. Specifically, the formula calculates the difference between the total load demand across all locations and the combined wind power and photovoltaic output. If the difference is positive (i.e., demand exceeds supply), the difference is the loss of load. If the difference is negative or zero (i.e., supply is sufficient), the loss is 0.

3.1. Loss of Load Function

f l o s s ( k ) ( x ) = max i = 1 n P L , i ( k ) i = 1 n ( P w , i ( k ) , P s , i ( k ) , + P g e n , i ( k ) , + P n e t , i ( k ) , 0
In the equation, f l o s s ( k ) ( x ) is the loss of load in the k-th scenario, P L , i ( k ) is the load demand at geographical location i in the k-th scenario, P w , i ( k ) is the wind power output at location i in the k-th scenario, P s , i ( k ) is the photovoltaic output at location iii in the k-th scenario, P g e n , i ( k ) is the conventional generator output at location i in the k-th scenario, n is the number of geographical locations, representing the total number of nodes considered in the system, P n e t , i ( k ) is the external grid output at location i in the k-th scenario. Real-time integration of data from conventional power plants and the external grid is achieved through IoT technologies and big data platforms, enabling real-time collection and processing of P g e n , i ( k ) and P n e t , i ( k ) data. This ensures that the risk assessment model reflects the most up-to-date operational status of the power system.

3.2. Resource Curtailment Loss Function

f w a r e ( k ) ( x ) = max ( ( i = 1 n P w , i ( k ) + P s , j ( k ) , + P n e t , i ( k ) , + P n e t , i ( k ) ) i = 1 n P L , i ( k ) , 0 )
In the equation, f w a r e ( k ) ( x ) is the resource curtailment loss in the k-th scenario, which measures the amount of waste when the total supply of the power system exceeds the total load demand in the k-th scenario. When the combined wind and photovoltaic output exceeds the total load demand across all locations, the excess is considered resource waste. If the supply is insufficient, the waste is 0.
We calculate the loss of load function and the resource curtailment loss function for the K generated joint scenarios. Then, we sort the loss values in ascending order and determine the VaRβ at level β as the [K·β]-th value.
V a R β = L l o s s ( [ K · β ] )
VaR is the risk value at confidence level β, L l o s s ( [ K · β ] ) is the [K·β]-th ordered value of the loss of load. The calculation of the loss of load risk and the calculation of the resource curtailment risk CVaR are as follows:
C V a R β , l o s s ( x ) = 1 ( 1 β ) · K k ; f l o s s ( k ) ( x ) V a R β f l o s s ( k ) ( x )
In the equation, CVaRβ,loss(x) loss is the Conditional Value-at-Risk (CVaR) for the loss of load, and CVaRβ,waste(x) is the Conditional Value-at-Risk (CVaR) for the resource curtailment risk.

3.3. Comprehensive Risk Indicator

Through weighted integration, the following equation is obtained:
C V a R β , t o t a l ( x ) = w 1 · C V a R β , l o s s ( x ) + w 2 · C V a R β , w a s t e ( x )
In the equation, w1 and w2 are the weights.

3.4. Expanded Explanation of Copula Parameter Estimation and Computational Performance

The hierarchical Copula model’s parameters, which capture the spatial and temporal dependencies among wind power, photovoltaic power, and load, are estimated using the Maximum Likelihood Estimation (MLE) method. This process involves analyzing historical data to determine the correlation strength between variables, such as wind and solar outputs, across different locations and time scales. The MLE algorithm iteratively refines these parameters until the model’s fit to the data stabilizes, typically converging when the improvement in fit becomes negligible or after a maximum of 100 iterations. For the IEEE 118-bus system, this estimation process usually completes within 20–30 iterations, taking about 15–20 s on a standard desktop computer (Intel Core i7, 16 GB RAM). The overall computational performance of the Copula model is efficient, with the generation of 1000 scenarios taking approximately 30 s, including 2 s to compute the spatial correlation matrix and 10 s for Monte Carlo sampling. To ensure scalability, tests on a smaller IEEE 30-bus system and a hypothetical 300-bus system show computation times of 12 s and 85 s, respectively, confirming the model’s suitability for large-scale power systems. These efficient computations, combined with scenario reduction techniques (Section 5.2), make the proposed method practical for real-world planning applications.

4. Supply–Demand Probability Balance Constraint in the New Power System Planning Model

4.1. Objective Function

min C i n v ( x ) + λ · C V a R β , t o t a l ( x )
C i n v x = i ( c w , i x w , i + c s , i x s , i + c g , i x g , i ) + i , j c i , j x i , i j
In the equation, cw,i is the unit capacity cost of wind power, cs,i is the unit capacity cost of photovoltaic power, cg,i is the unit capacity cost of conventional power plants, ci,j is the unit capacity cost of transmission lines, xw,i is the wind power installed capacity at location i, xs,i is the photovoltaic installed capacity at location i, xg,i is the conventional power plant installed capacity at location i, xt,ij is the transmission line capacity between location i and location j, λ is the risk coefficient, used to adjust the trade-off between cost and risk.

4.2. Constraints

(1)
Capacity Constraints
0 P w , i ( k ) x w , i 0 P s , i ( k ) x s , i 0 P g , i ( k ) x g , i |   f i j ( k ) | x t , i j , i , j , k
(2)
Supply–Demand Probability Balance Constraint
The traditional deterministic supply–demand balance constraint requires that, at any given time, generation must equal load demand. However, in scenarios with a high proportion of renewable energy, due to the randomness and volatility of its output, achieving a strict deterministic supply–demand balance becomes difficult. Therefore, this paper proposes a supply–demand probability balance constraint, which allows for the supply–demand balance to be met at a certain probability level, rather than requiring a strict deterministic balance.
P ( i = 1 n ( P w , i ( k ) + P s , i ( k ) + P g , i ( k ) ) i = 1 n P L , i ( k ) ) 1 ϵ
In the equation, ϵ is the allowed loss-of-load probability. This constraint is transformed into a computable form using the Sample Average Approximation (SAA) method:
1 K k = 1 K i = 1 n ( P w , i ( k ) + P s , i ( k ) + P g , i ( k ) ) i = 1 n P L , i ( k ) ) 1 ϵ
This constraint ensures that the planning scheme can meet load demand in most scenarios, avoiding system failure due to the fluctuations in renewable energy. || is the indicator function, which is 1 when the condition is satisfied, and 0 otherwise. This ensures that at least (1 − ϵK out of K scenarios satisfy the supply–demand balance.
(3)
Transmission Constraints
At any node i and under scenario k, the sum of local generation, external power input, power flow out, and any unmet demand must equal the load demand at that node.
t y p e s P t y p e , i ( k ) + j f j i ( k ) j f i j ( k ) + d i ( k ) = P L , i ( k ) , i , k
In the equation, P t y p e , i ( k ) is the total power generation of all types at node i in scenario k, f j i ( k ) is the power flow from node i to node j in scenario k, d i ( k ) is the loss of load at node i in scenario k.

4.3. Model Solution

The model is solved using the Benders decomposition method, which decomposes the problem into a master problem (planning) and a subproblem (operation), optimizing through iteration. Therefore, the model solving process is as follows:
Step 1: Collect historical data for wind power, photovoltaic output, and load demand, and determine their probability distributions.
Step 2: Use the spatial Copula function to capture dependencies between geographical locations: Calculate the correlation matrix Rij = exp(−βdij), and based on the spatial Copula function, sample from the joint distribution to ultimately generate K joint scenarios.
Step 3: Define the planning phase decision variables {xw,i, xs,i, xg,i, xt,ij} and the operation phase decision variables { P g , i ( k ) , f j i ( k ) , d i ( k ) , f w a r e ( k ) , f l o s s ( k ) , bk}, and linearize the model.
Step 4: Solve the model using the Benders decomposition method.
(1) Set the initial planning variables x(0), with the initial risk θ(0) estimated as 0;
(2) Solve the master problem;
(3) Insert x(0) to calculate the scenario loss function and evaluate CVaR and the probability constraint;
(4) If the subproblem is infeasible, add a feasibility cut. If feasible, add an optimality cut to update the risk value θ;
(5) Repeat the master and subproblems until θ converges.

5. Case Study Analysis

To validate the effectiveness of the proposed power system optimization planning method under high renewable energy penetration scenarios, this section conducts a simulation analysis of the IEEE 118-bus model to assess the system’s reliability and resource utilization efficiency. The simulation comprehensively considers the output characteristics of wind power, photovoltaic, and conventional generation facilities. It uses historical data and a hierarchical Copula model to generate uncertainty scenarios and solves the optimization problem using the Benders decomposition method. Finally, by comparing the loss-of-load risk and resource waste risk of different planning schemes, the advantages of the proposed method in reducing system operational risks and improving economic performance are demonstrated.

5.1. Example Introduction and Parameter Settings

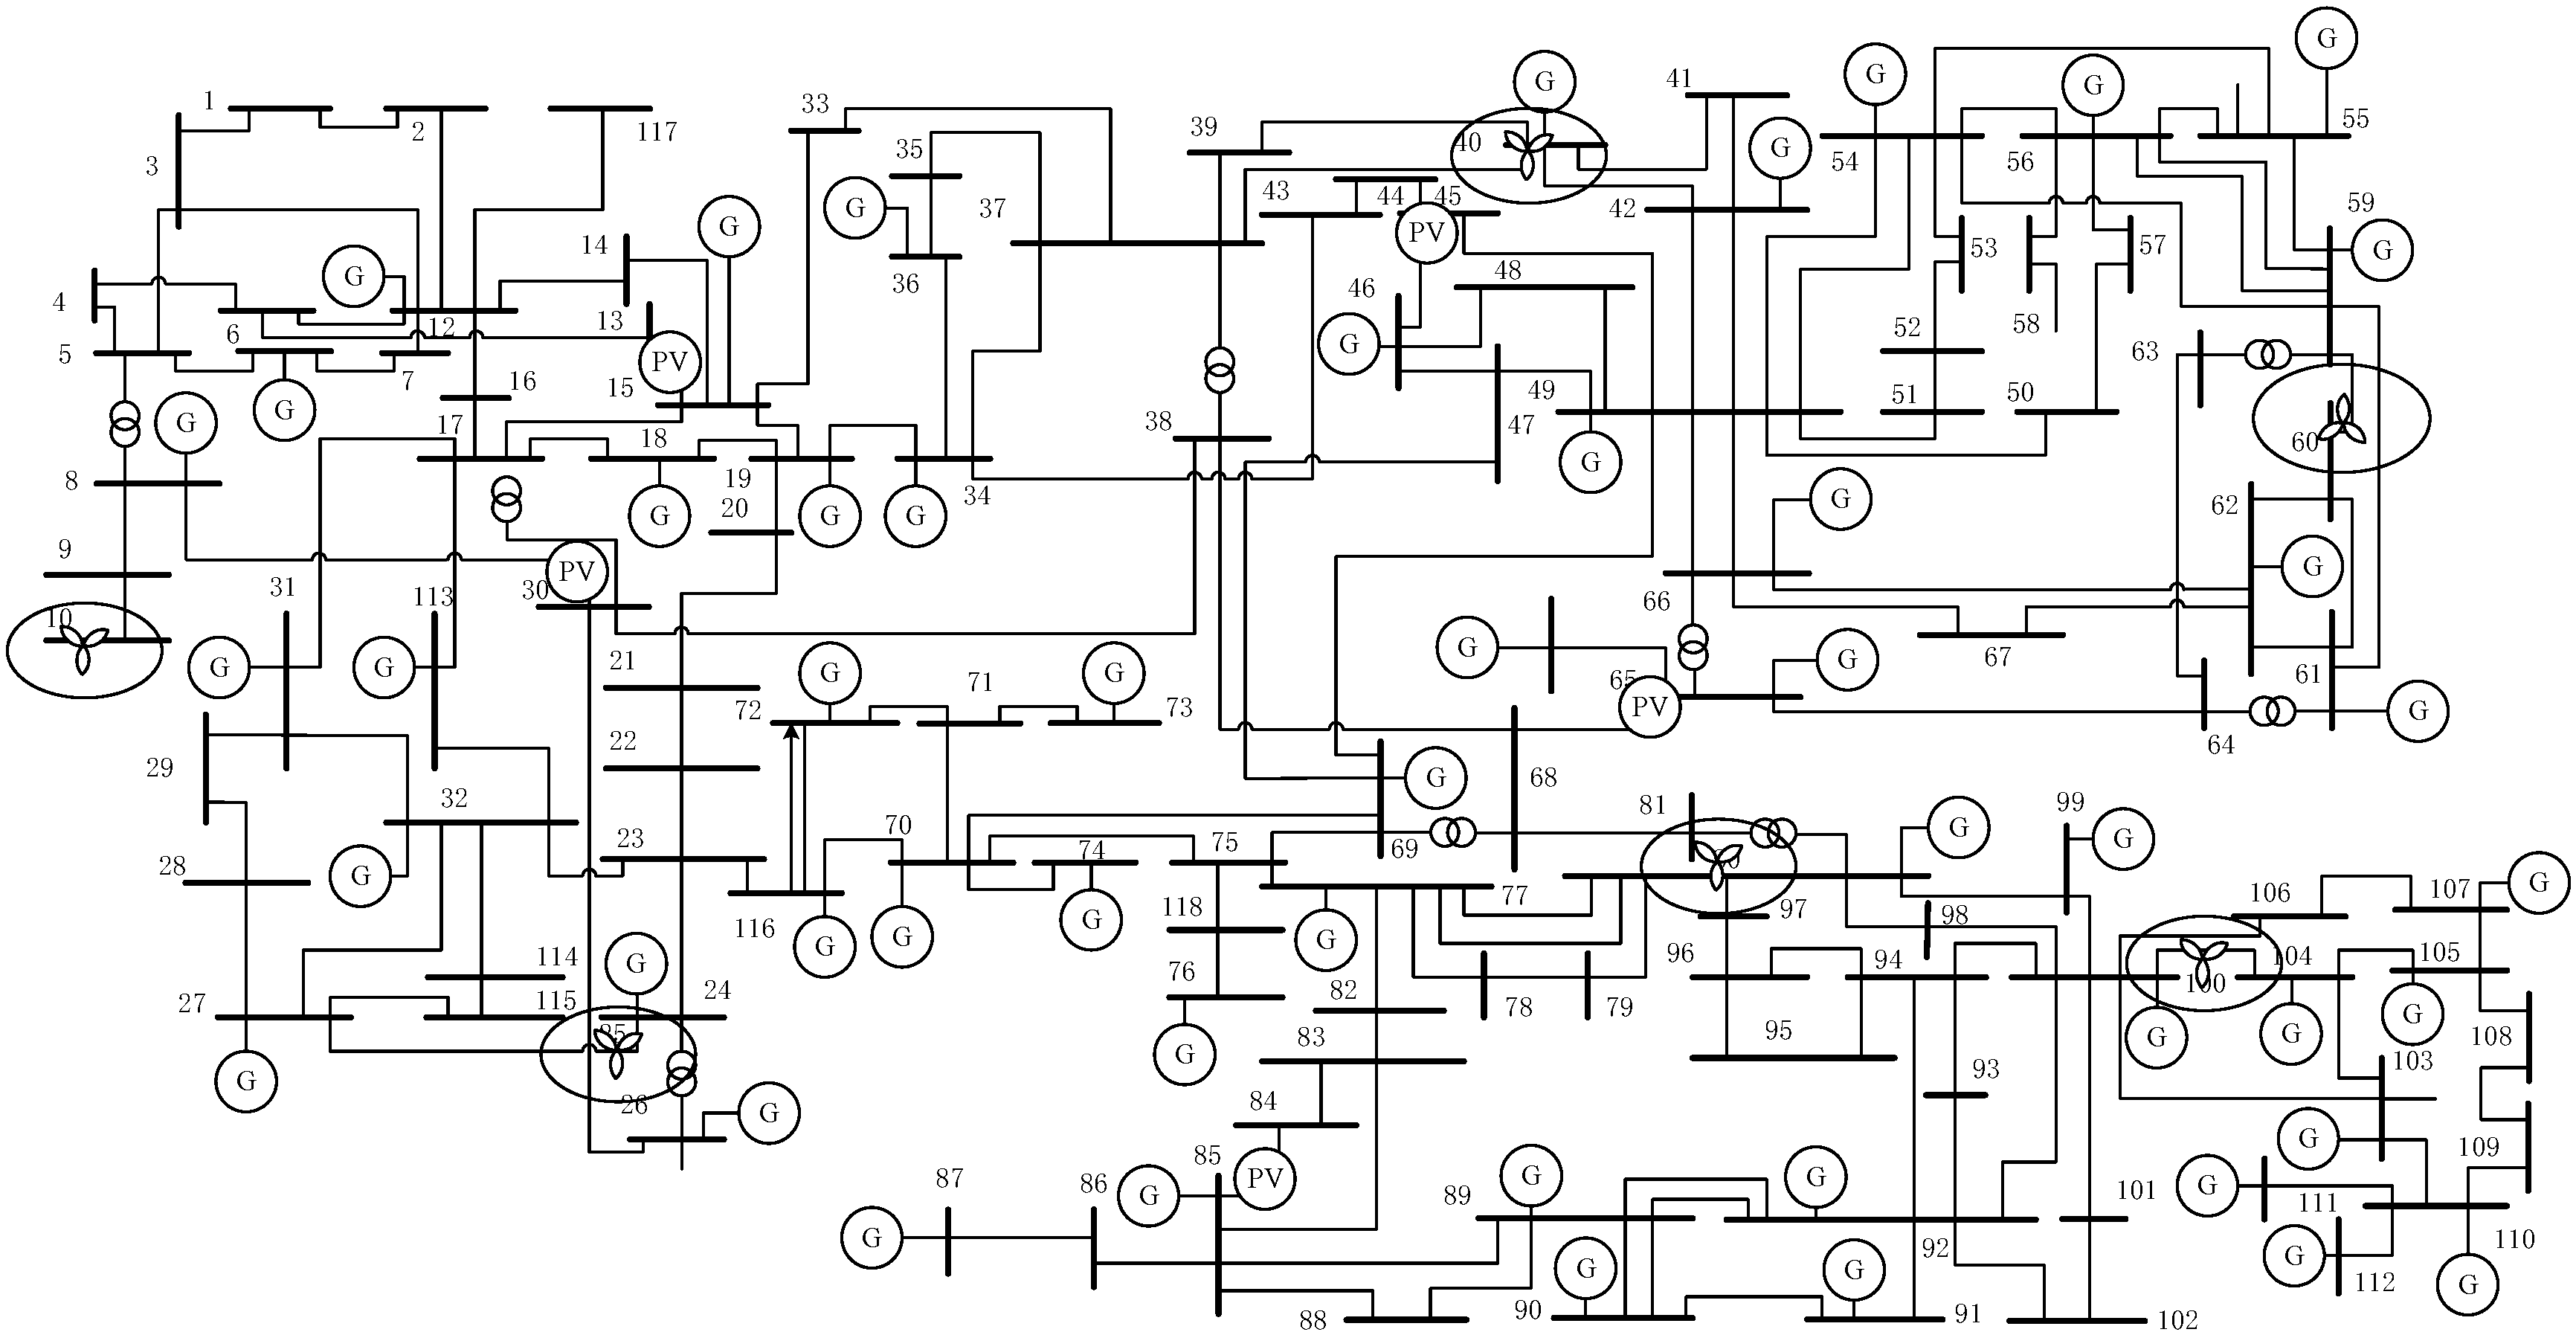
The IEEE 118-bus system is a standard power system test model, and its structure is shown in Figure 1. The system includes 54 coal-fired power generation units, distributed across different nodes, with individual unit capacities ranging from 52.3 MW to 298.6 MW, and a total installed capacity of 5012.4 MW. The output range is from 20% to 100% of the installed capacity. The system contains 91 load nodes, with a peak load of 4218.6 MW.
Wind farms are located at buses 10, 25, 40, 60, 80, and 100, with a total installed capacity of 1053.9 MW. The specific data is shown in Table 1. Photovoltaic power plants are located at buses 15, 30, 45, 65, 85, and 105, with a total installed capacity of 524.3 MW. The specific data is shown in Table 2.

5.2. Uncertainty Modeling and Scenario Generation

This study uses Copula theory to model the spatiotemporal correlations of wind power, photovoltaic output, and load demand. The Monte Carlo method is employed to generate 1000 scenarios, with each scenario containing 8760 h of wind power, photovoltaic output, and load demand data, ensuring the randomness and diversity of the scenarios. This method generates a vast set of spatiotemporal correlation scenarios for generation and load. K-means clustering is then used for scenario reduction. The clustering is based on the statistical features of wind power, photovoltaic, and load, ensuring that the reduced scenarios retain the original data characteristics. A total of 3650 scenarios are divided into 4 categories as data objects, resulting in 4 typical scenarios.

5.2.1. Data and Probability Distribution

The wind speed, solar irradiance, and load data are sourced from historical records (8760 h) at each node location. The PV output data is sourced from the NREL Solar Radiation Database, providing hourly solar irradiance records for the specified locations, capturing the diurnal generation pattern from approximately 4:00 a.m. to 4:00 p.m. The data is cleaned to ensure reliability. Wind speed follows a Weibull distribution, with parameters estimated using Maximum Likelihood Estimation (MLE) from the historical data. Solar irradiance, after normalization, follows a Beta distribution. The total load follows a normal distribution with a mean of 3524.7 MW and a standard deviation of 412.3 MW. The specific data is shown in Table 3. The load demand data, showing elevated levels between 10:00 p.m. and 1:00 a.m., is derived from historical operational records of the State Grid Shandong Electric Power Company, reflecting regional consumption patterns influenced by industrial and residential activities.

5.2.2. Scenario Generation

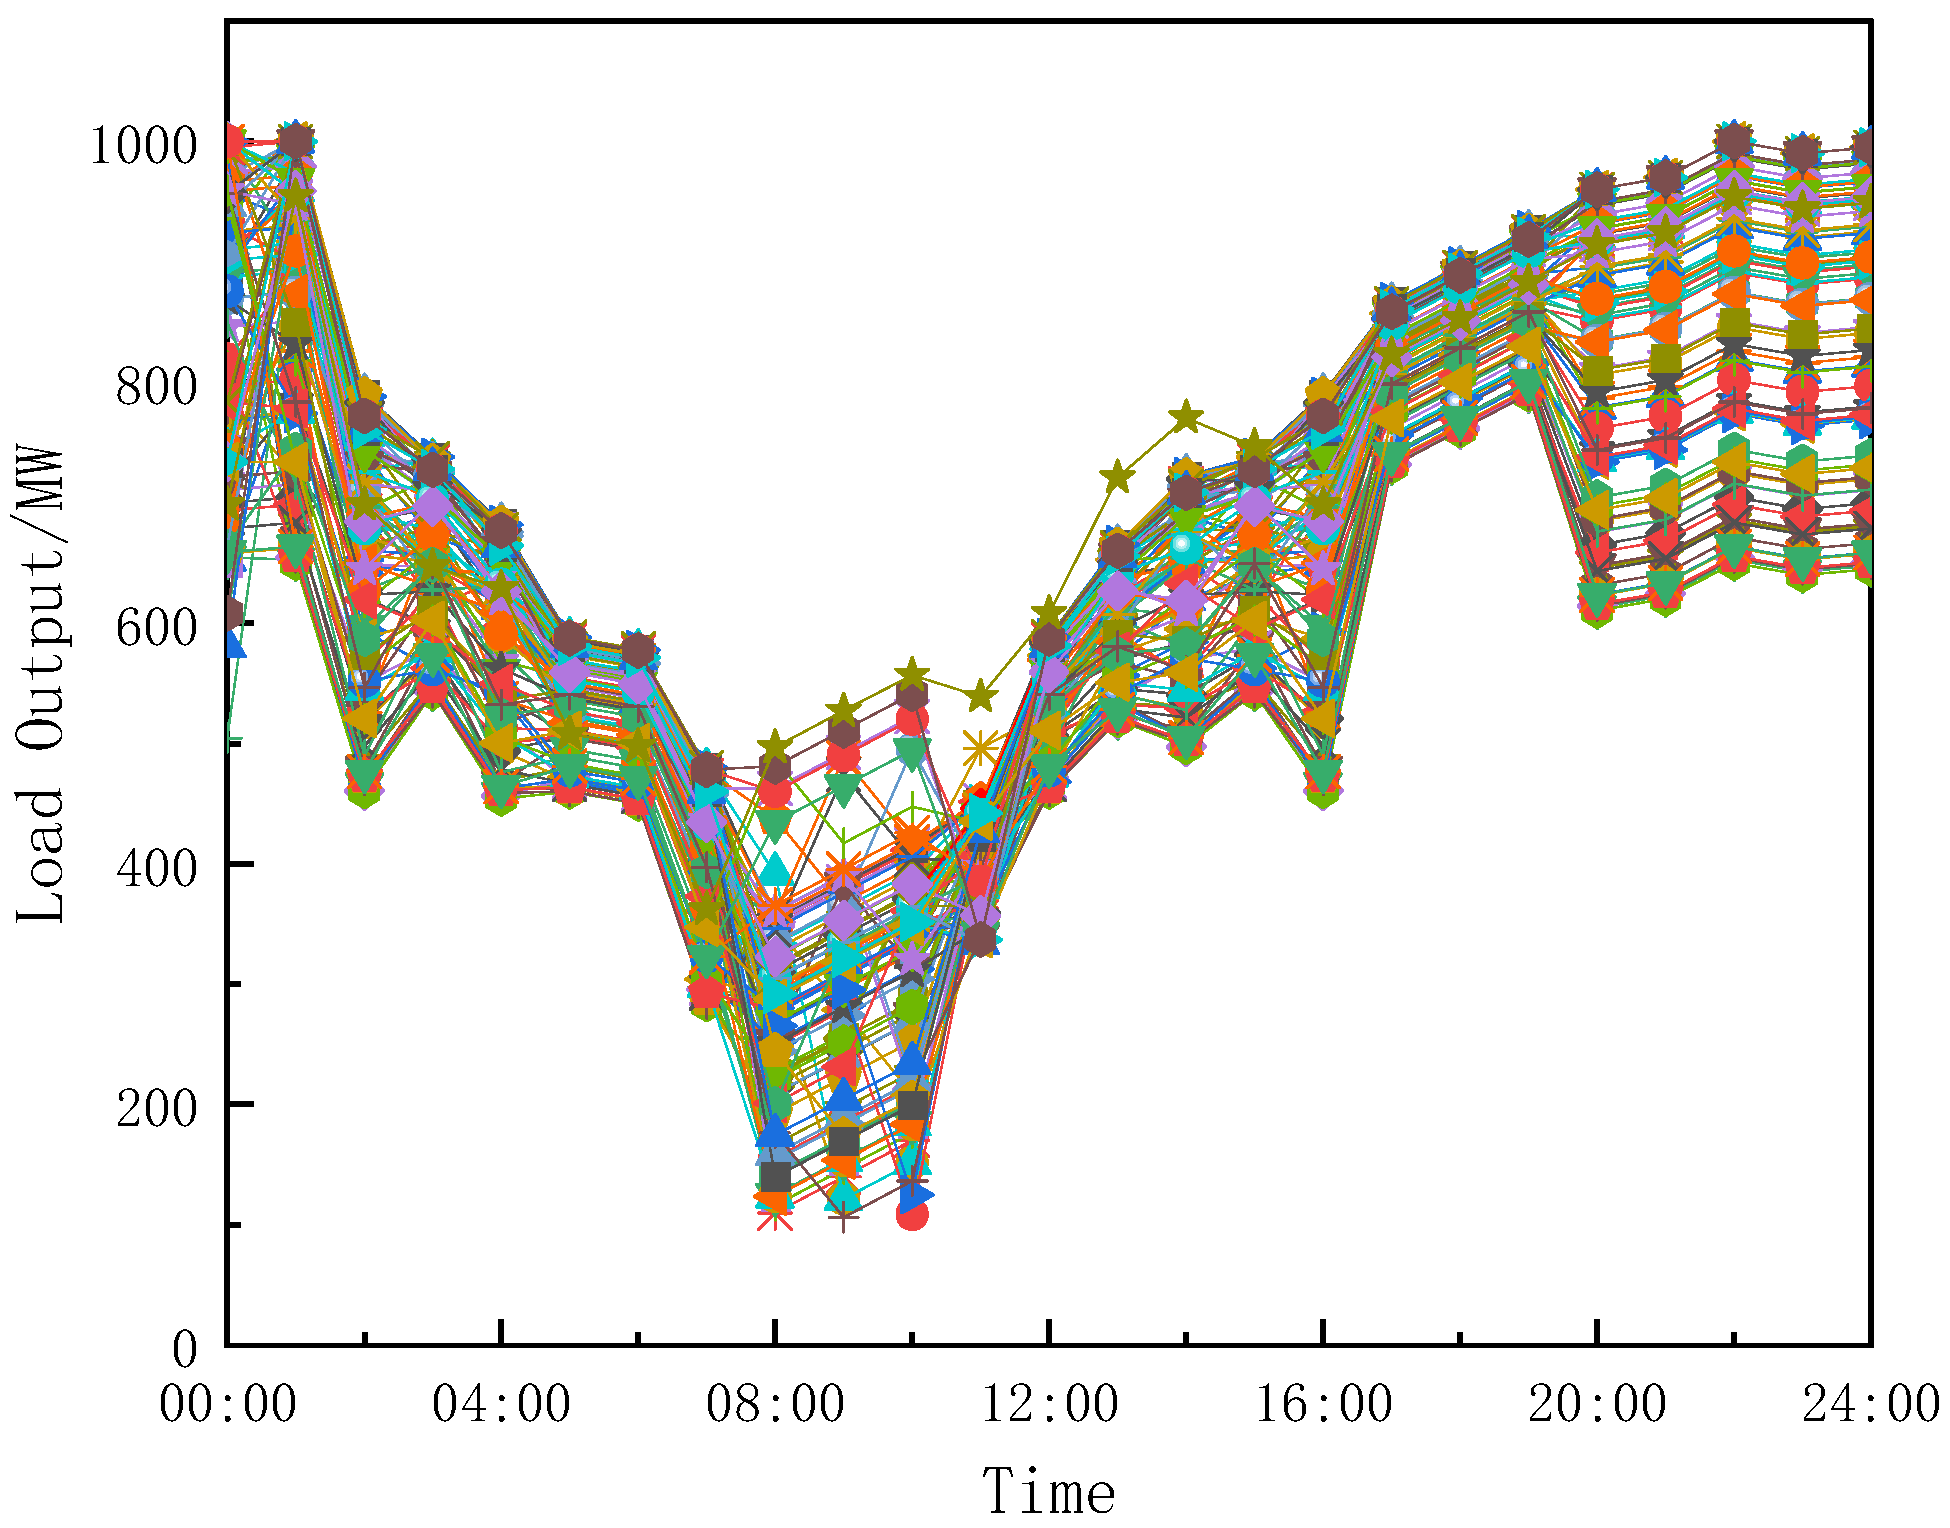
Random sampling is performed for each time period of the source–load spatiotemporal correlation probability model based on Copula theory using the Monte Carlo method. In this process, the number of load and PV output scenarios is set to 1000 to ensure the randomness and diversity of the scenarios. This method generates a large set of source–load spatiotemporal correlation scenarios, as shown in Figure 2, Figure 3, and Figure 4.
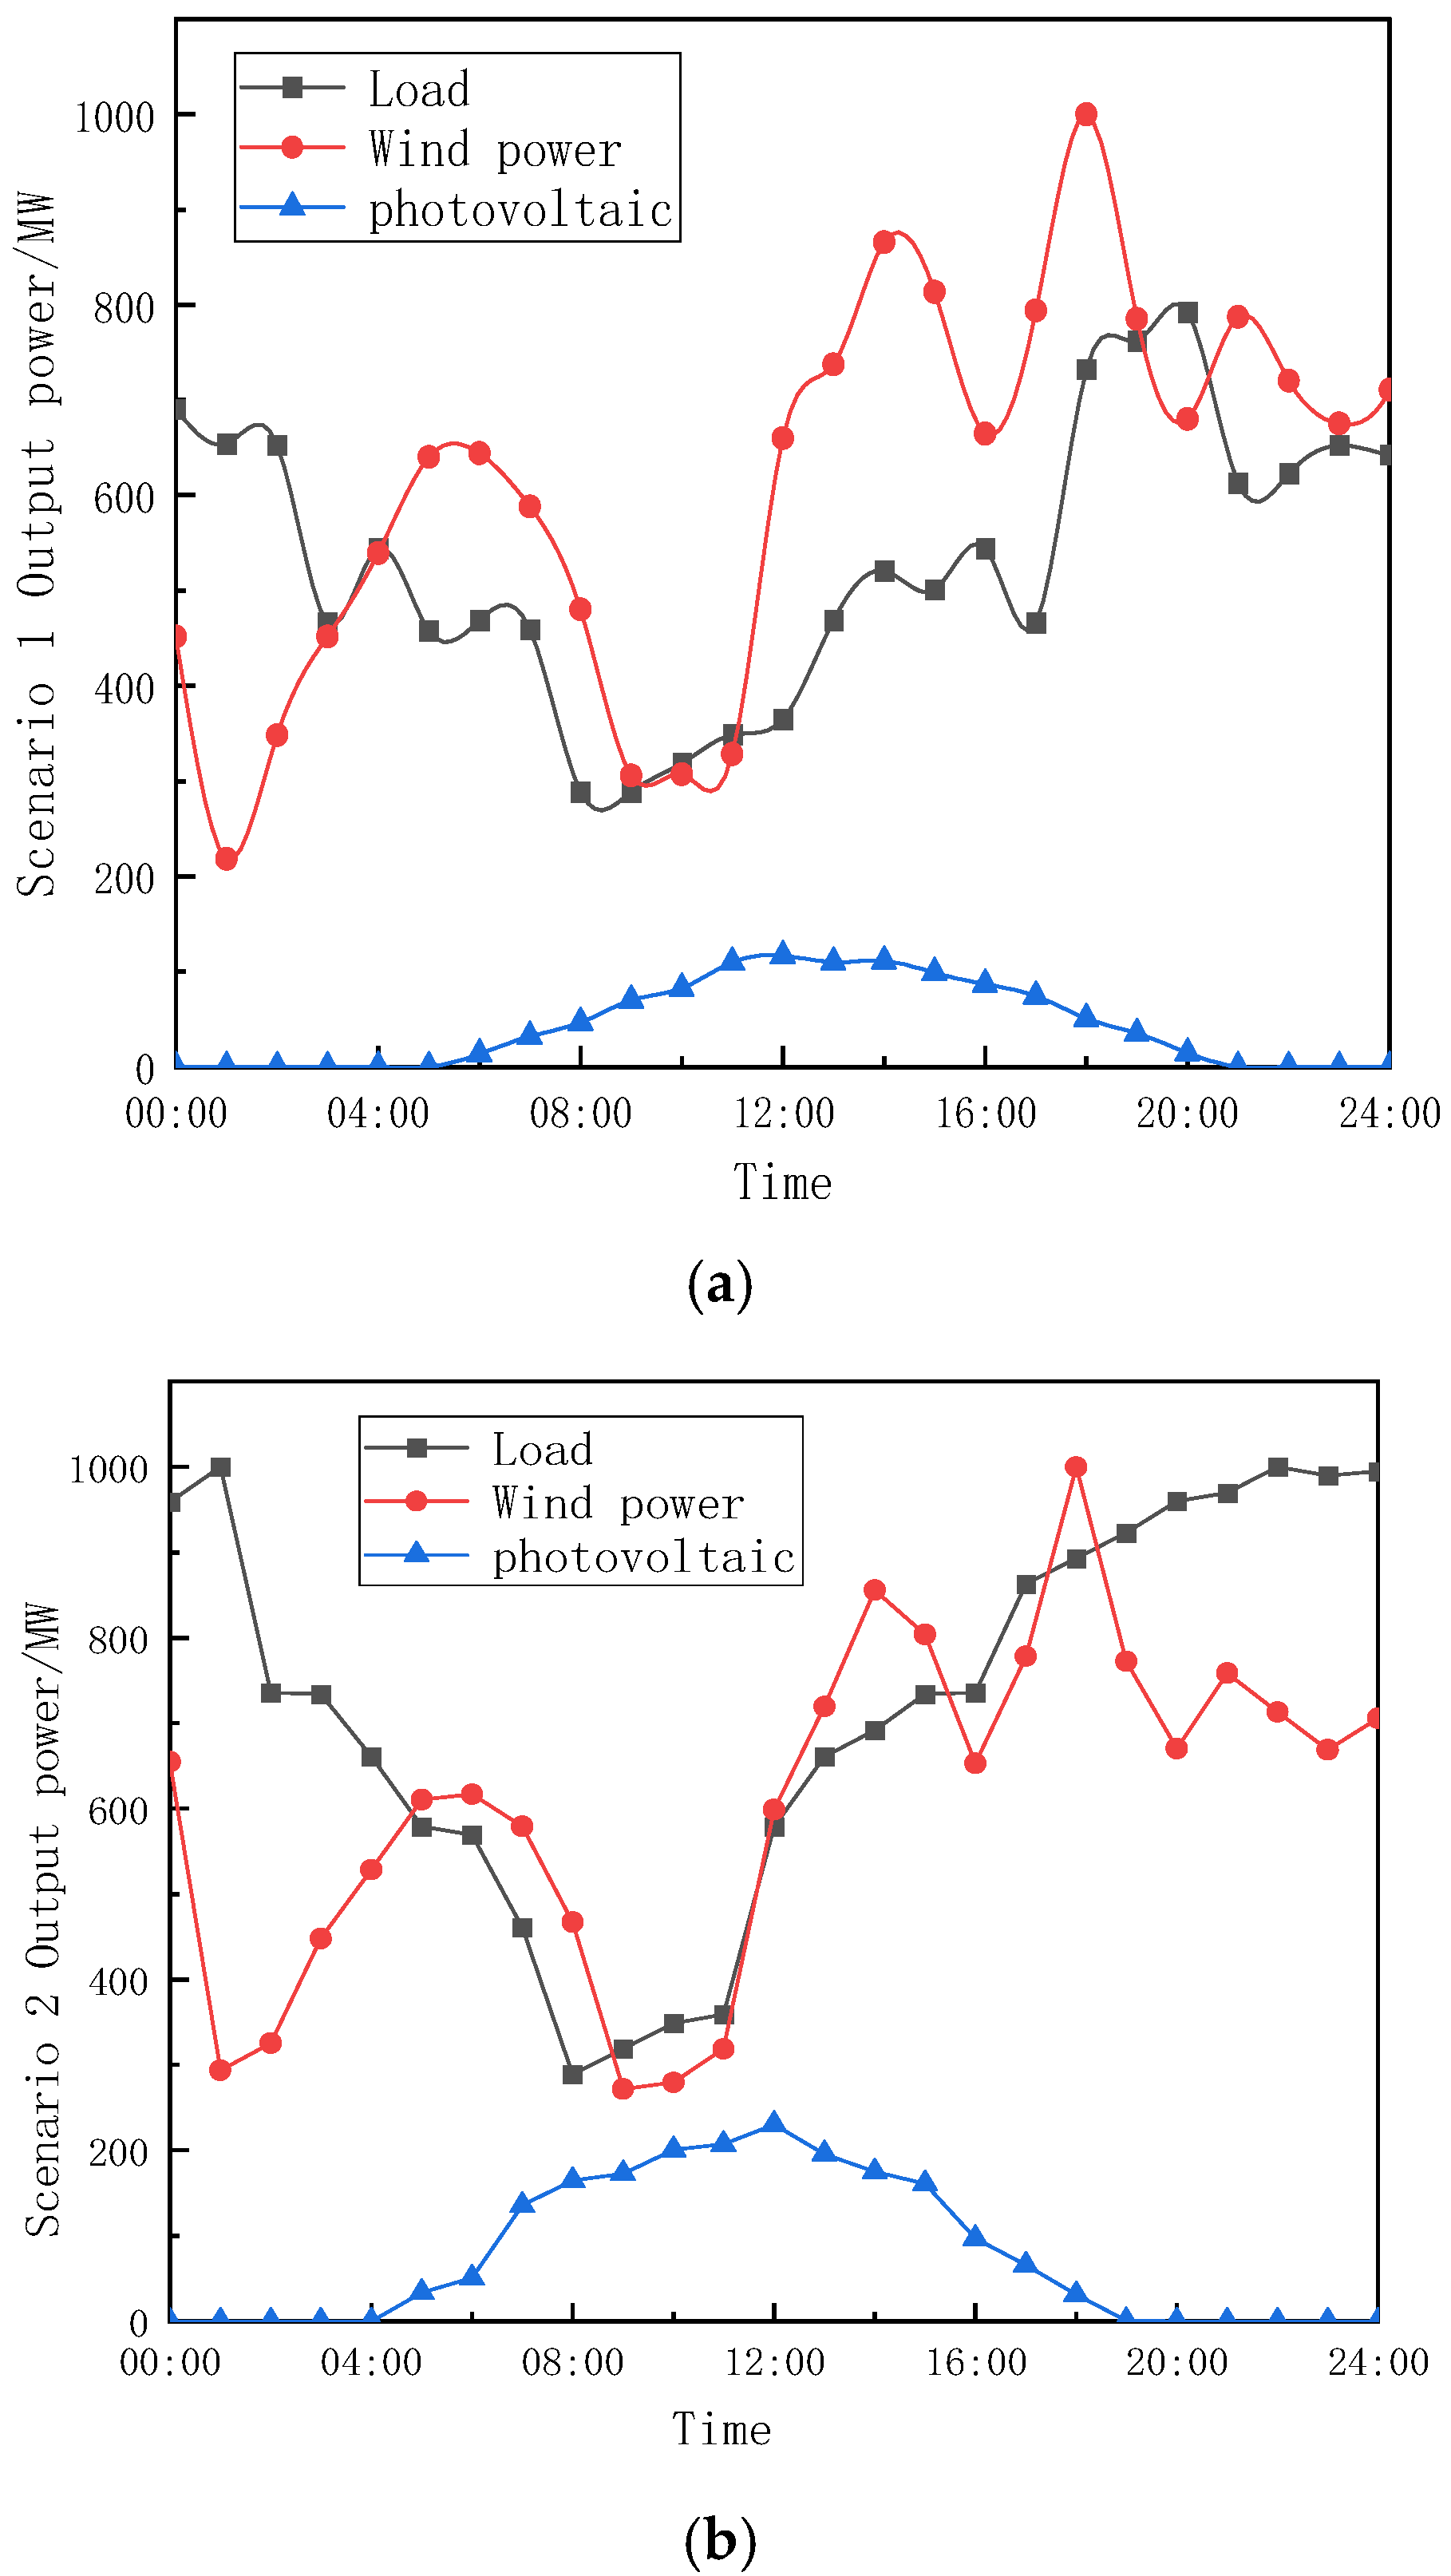
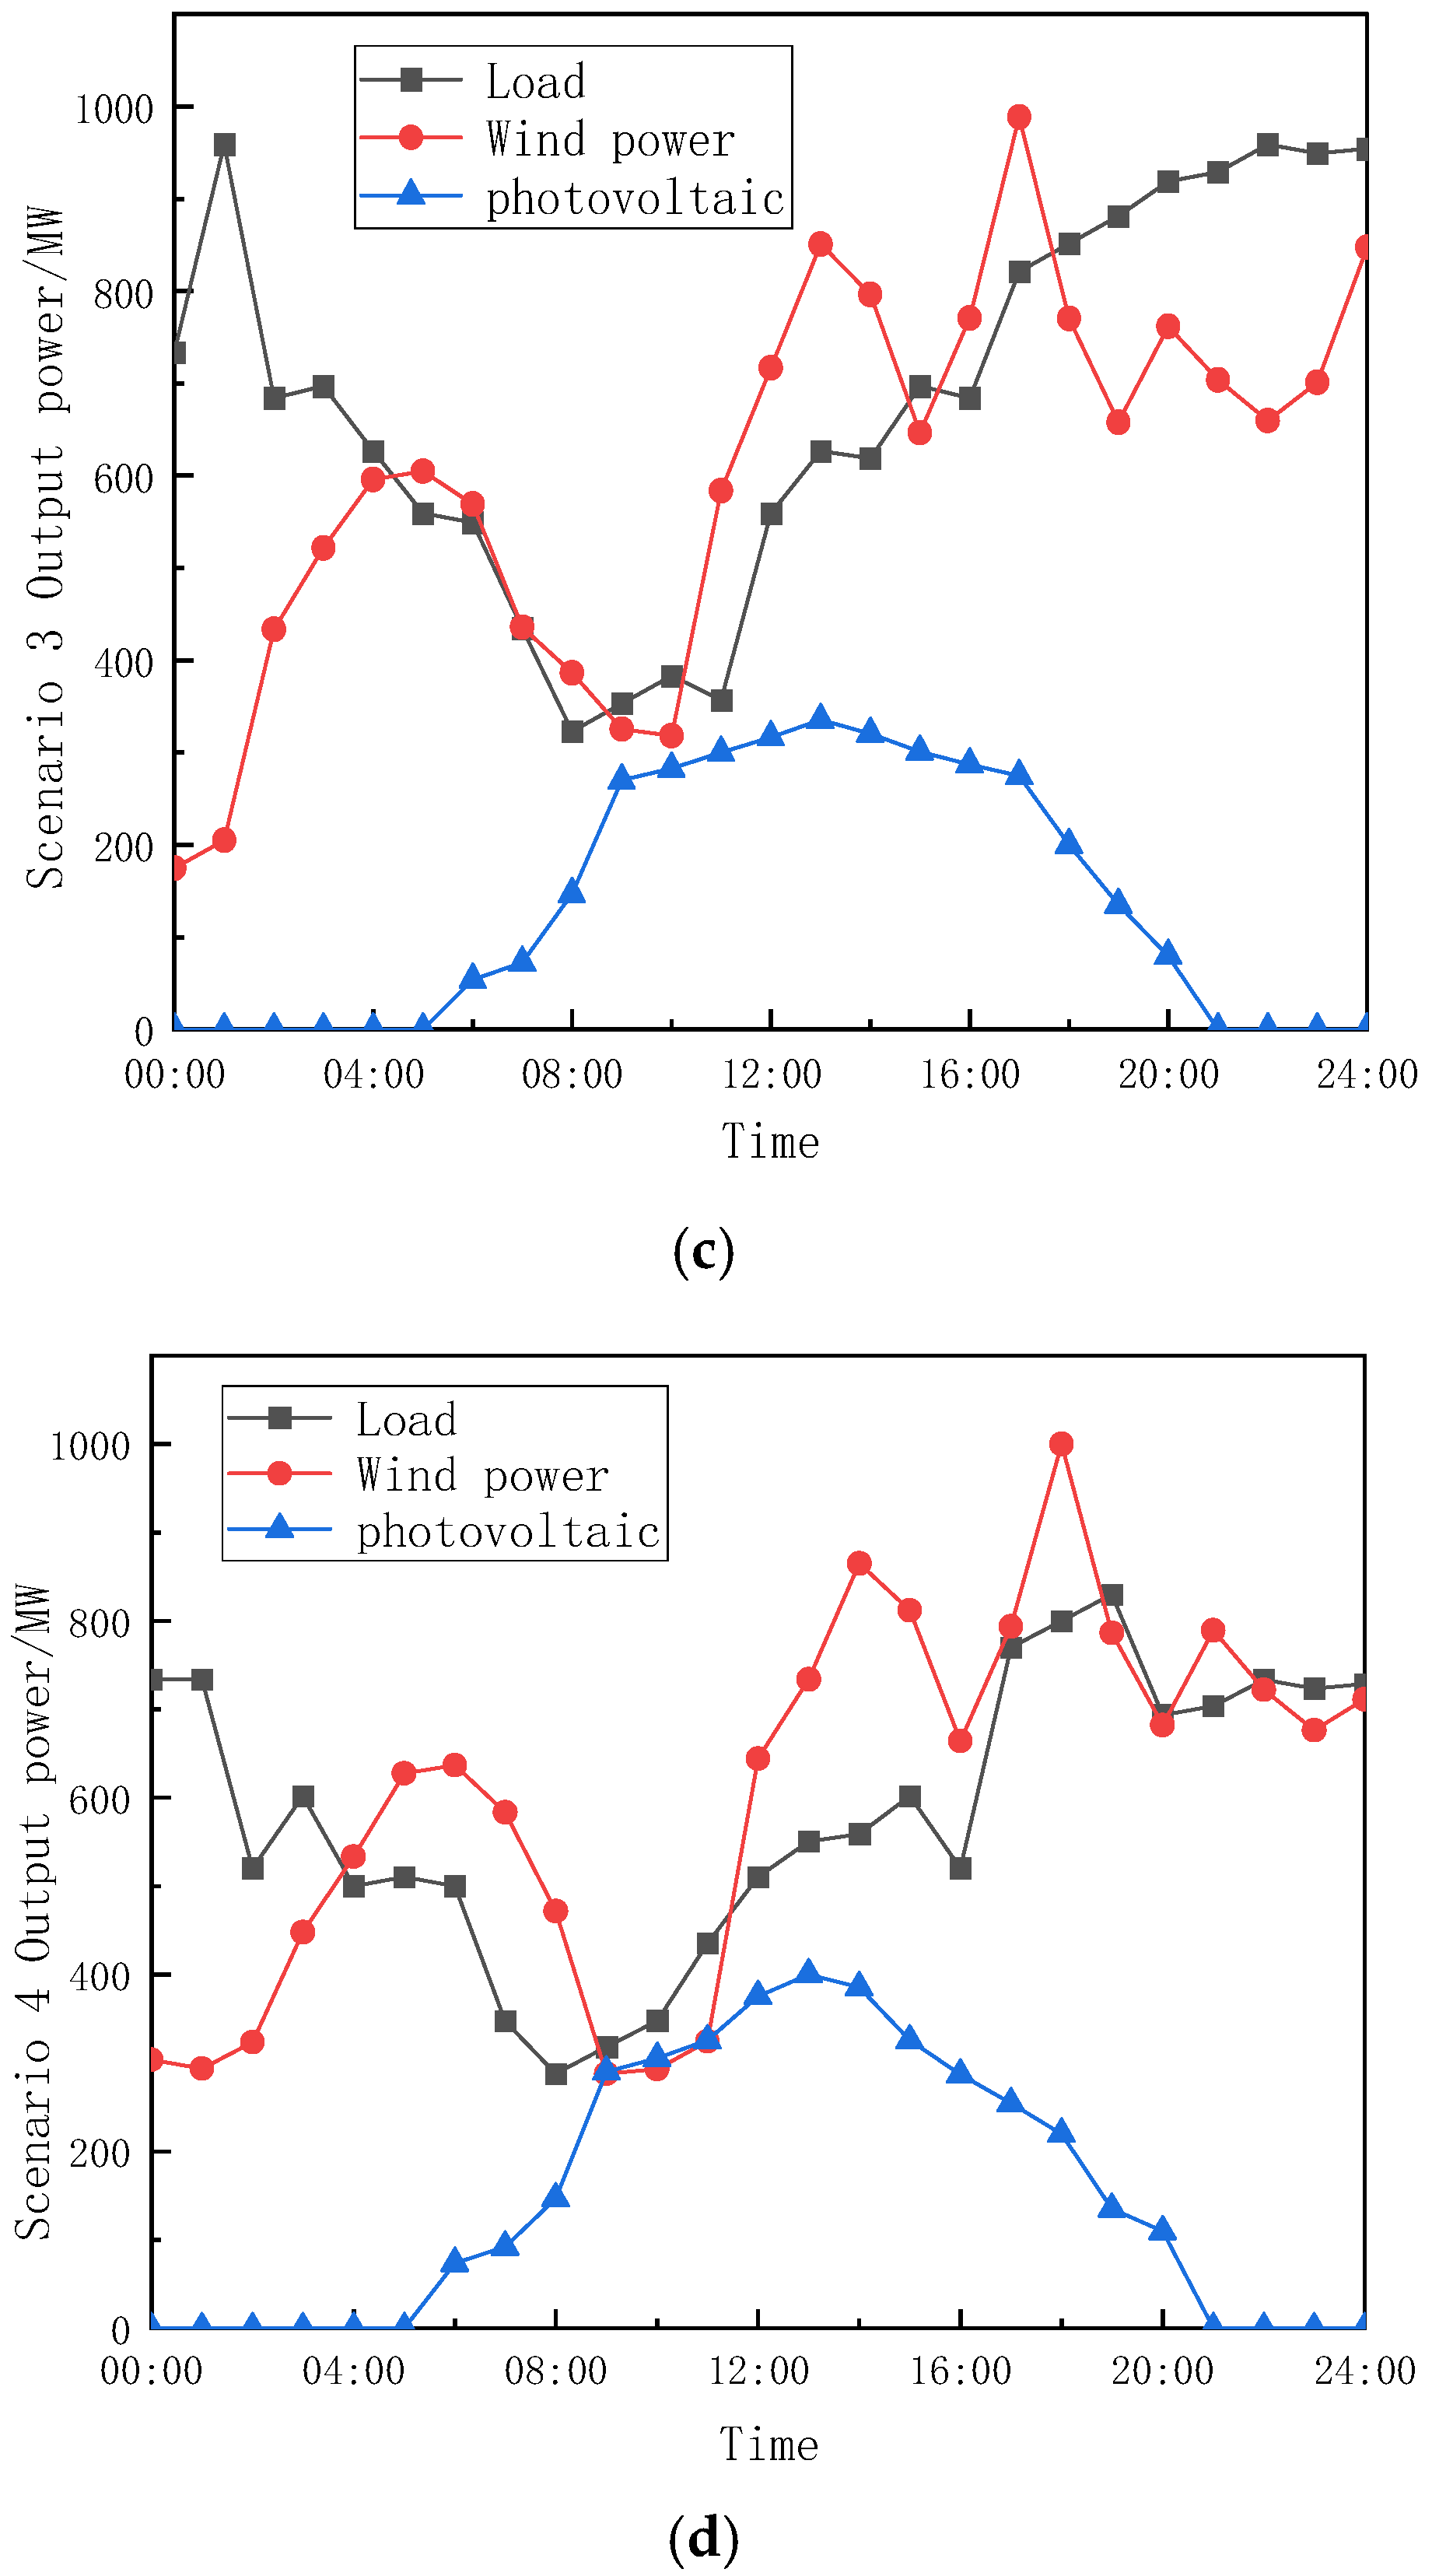
The 1000 scenarios are divided into 4 categories as data objects, and the K-means clustering algorithm is used to reduce the spatiotemporal correlation scenarios. Finally, 4 typical scenarios are obtained. The output curves of the generated typical scenarios are shown in Figure 5, and the probabilities of each typical scenario are shown in Table 4.
The scenario correlation analysis in Table 5 shows that the hierarchical Copula model captures local dependencies within the same region through the first layer. In Scenario 1, the correlation coefficient between wind power and load is −0.28, indicating that higher wind speeds may be associated with lower load, which is accurately modeled as a local dependency. The second layer captures long-range correlations between different regions. The tail dependence between different wind farms is reflected through the parameter (θ = 1.42) of the Clayton Copula, ensuring spatial consistency under extreme conditions.
Copula theory separates the marginal distributions (Weibull, Beta, normal distribution) from the correlation structure, allowing for flexible handling of the heterogeneous distribution characteristics of wind power, photovoltaic, and load. In Scenario 3, the photovoltaic output is low at 157.3 MW, but it still maintains a positive correlation (0.15) with the load. This flexibility is difficult to achieve with traditional single-distribution models. This hierarchical design further enhances the model’s adaptability to large-scale, multi-variable systems, making it suitable for the complex scenarios of multiple wind farms and photovoltaic power plants in the IEEE 118-bus system. Compared to the traditional independent distribution assumption, the hierarchical structure more realistically reflects the impact of geographical distribution on wind power and photovoltaic output.
Through the comparative analysis of the load demand curve, PV (photovoltaic) output curve, and wind power output curve within 24 h, we find that the output of the three shows fluctuations in a day. These fluctuations are mainly due to the diurnal variation of light intensity, the randomness of wind speed, and the electricity consumption habits of users. For example, PV output at night is close to zero, while wind power output depends on wind speed at night. During the day, the PV output is high, while the wind power output fluctuates with the change in wind speed. Our simulation results show that PV output, wind power output, and load demand exhibit different correlation characteristics in some periods. For example, during the period from 06:00 to 14:00, the trend of PV output and load demand is more consistent, showing a positive correlation, while the correlation between wind power output and load demand depends on the degree of overlap between wind speed and peak power consumption. During the period from 14:00 to 20:00, PV output is negatively correlated with load demand, while the performance of wind power output is more random. The results show that the relationship between PV power generation, wind power output, and load demand is dynamic and complex and will show different correlation characteristics depending on the time period and meteorological conditions.
In the simulation study in this paper, we use the hierarchical Copula model to analyze the spatiotemporal correlation between PV output, wind power output, and load demand. Compared with traditional methods, the hierarchical Copula model can more accurately capture the nonlinear dependence between the three, especially when dealing with intermittent and uncertain renewable energy sources such as wind power and PV output. Through this model, we are able to accurately simulate the complex correlation of PV, wind power, and load demand at different time and space scales, making the simulation results more closely related to the actual operating scenario. This approach not only improves the economics of distribution network planning but also enhances its operational reliability. By fully considering the spatiotemporal correlation between wind power, PV, and load, we optimize resource allocation and improve energy efficiency to ensure efficient and stable operation of the distribution network in a variety of complex scenarios.

5.3. Node System Planning Results Analysis

5.3.1. Data and Probability Distribution

The planning results in this paper are based on the scenario with the highest probability, Scenario 1. Three planning schemes are designed:
Scheme 1: Based on peak load and average output, without considering uncertainty;
Scheme 2: The optimization objective is the average loss of the scenario;
Scheme 3: Optimized based on CVaR, comprehensively considering extreme risks.
Table 6 shows the cost pairs of the three scenarios in the basic scenario, and Table 7 shows the installed capacity and risk indicators obtained.
The analysis of the data in the table shows that Scheme 2 increases by USD 107.9 million compared to Scenario 1, due to the increase in traditional power generation to 5123.7 MW, wind power to 1098.5 MW, and PV to 535.0 MW, reflecting the initial adaptation to uncertainty. Scheme 3 represents an increase of USD 288.2 million over Scheme 1 due to a further increase in conventional power generation to 5189.2 MW, wind power to 1124.8 MW, and PV to 543.4 MW, as well as transmission line expansion. Scheme 3 has the highest investment cost, indicating that it invests more in hardware configuration to improve the system’s adaptability to renewable energy fluctuations and high-load scenarios.
Scheme 1 has a high operating cost, and the fuel and maintenance costs are not optimized due to the high dependence on traditional power generation. Scenario 2 was reduced by USD 10.6 million compared to Scheme 1, and it reduced part of the operational burden through stochastic optimization. Scheme 3 was reduced by USD 23.8 million compared to Scheme 1, thanks to the efficient use of wind and photovoltaic power, as well as the optimal dispatch of traditional power generation, with the lowest operating costs, showing significant advantages in resource allocation and operational efficiency, especially in the scenario of high renewable energy penetration, reducing dependence on fuel.
Scheme 1 has the highest risk cost, because the risk of power loss and resource waste is not effectively controlled. Scheme 2 is USD 44.6 million less than Scheme 1 due to the optimization of reduced risk. Scheme 3 reduces the risk by USD 81.6 million compared with Scheme 1, and the risk cost of Scheme 3 is the lowest, which reflects that it captures the spatiotemporal correlation of source and load through the hierarchical Copula model, which effectively reduces the economic loss in extreme scenarios.
Scheme 1 has the lowest total cost, but the risk control capability is weak. Scheme 2 represents an increase of USD 52.7 million over Scheme 1, striking a balance between risk reduction and operational optimization. Scheme 3 has the highest total cost but significant reductions in operating and risk costs, show long-term benefits. Although the total cost of Scheme 3 is higher, the increase in investment costs is partially offset by savings in operating costs and risk costs (a total reduction of USD 105.4 million), demonstrating its combined advantages in terms of economy and reliability.
From the table, it can be observed that Scheme 3 has slightly higher capacities for conventional power generation, wind power, and photovoltaic power compared to the other schemes. Specifically, conventional power generation is increased by 176.8 MW, and wind power is increased by 70.9 MW, in order to enhance the system’s ability to handle extreme risks. Scheme 3 significantly reduces both the loss-of-load risk CVaRloss, decreasing from 148.6 MW to 62.5 MW, with the resource waste risk CVaRwaste decreasing from 118.3 MW to 41.2 MW. The overall risk CVaRtotal drops from 135.7 MW to 51.8 MW, a reduction of 61.8%, demonstrating excellent risk control ability. Scheme 3, through optimized resource allocation, balances the high penetration of renewable energy with system stability, highlighting the advanced nature of the proposed method in this paper.

5.3.2. PV Configuration Analysis

PV configuration is crucial to the absorption capacity and stability of the system, and the PV planning and configuration results under different scenarios are shown in Table 8. The initial configuration features six PV plants at busbars 15, 30, 45, 65, 85, and 105 with a total capacity of 524.3 MW. Different solutions adjust the capacity of each node according to the optimization goal to adapt to the uncertainty and load demand.
Scheme 1 has a total capacity of 524.3 MW as the base configuration. Scenario 2 increases to 535.0 MW, an increase of 2.0%, and Scenario 3 further increases to 543.4 MW, an increase of 3.6%, to cope with fluctuating PV output and high load demand. Scheme 3 allocates more capacity from 102.1 MW to 105.8 MW at load-intensive nodes, such as bus 15, to optimize local absorption capacity, while at weaker nodes, such as bus 65, it increases from 72.4 MW to 75.1 MW in Table 8, reflecting the precision of resource allocation.

5.3.3. Wind Power Configuration Analysis

Wind power configurations need to balance their intermittentness with system stability. The initial configuration features six wind farms at buses 10, 25, 40, 60, 80, and 100 with a total capacity of 1053.9 MW. Different solutions optimize the capacity of each node to improve the efficiency of wind energy utilization. Table 9 lists the configuration schemes.
Scheme 1 has a total capacity of 1053.9 MW, Scheme 2 increases to 1098.5 MW, an increase of 4.2%, and Scheme 3 further increases to 1124.8 MW, an increase of 6.7%, to cope with wind power uncertainty and extreme schemes. Scheme 3 allocates higher capacity, from 198.7 MW to 212.0 MW, in bus 10, and from 189.4 MW to 202.3 MW in bus 100, the wind speed resource-abundant nodes, to maximize wind energy utilization. Scheme 3 captures the negative correlation between wind power and load through the Copula model, optimizes the output distribution in high-wind-speed and low-load schemes, and enhances the stability of the system.

5.3.4. Transmission Line Configuration Analysis

Transmission line capacity allocation is critical to system stability and renewable energy transmission capacity. In the initial configuration, the 186 lines have capacities ranging from 102.5 MW to 498.2 MW. Table 10 shows the capacity configuration of some key lines under the three scenarios.
Scheme 1 is based on the original design with a conservative capacity. Scheme 2 moderately expands key lines through random optimization, and 10–12 increases from 200.0 MW to 225.0 MW, an increase of 12.5%. Scheme 3 is further expanded to the upper limit, such as 25% to 250.0 MW in 10–12 and 50% to 225.0 MW in 15–33 to support high power transmission from wind and solar.
Key lines 15–33 are expanded to 225.0 MW in Scheme 3 to cope with the high PV output scenario, while lines 25–27 are not expanded to 180.0 MW, indicating that their transmission needs have been met and resource allocation has been optimized. Scheme 3 uses the hierarchical Copula model to accurately identify the lines that need to be expanded, capture the spatial correlation between wind power and PV, improve the adaptability of the system to renewable energy fluctuations, and avoid unnecessary expansion costs.

5.3.5. Generator Configuration Analysis

As the core power supply facility of the IEEE118 node system, the traditional generator set is responsible for providing basic power support and peak shaving services to ensure the stable operation of the system under the penetration of a high proportion of renewable energy. The initial configuration consists of 54 coal-fired generating units with a total capacity of 5012.4 MW, spread across multiple key nodes. For the three planning scenarios, this paper analyzes the changes in the installed capacity of traditional generator sets, as shown in Table 11.
As can be seen from the analysis of the data in the table, the total capacity of the 20 key nodes in Scenario 1 is 2946.7 MW, and the total system capacity is 5012.4 MW, which is used as a baseline configuration without considering the uncertainty of renewable energy. In Scenario 2, the total capacity is increased to 3006.7 MW and the total system capacity is increased to 5123.7 MW, reflecting an initial adaptation to random fluctuations. Scenario 3 further increases the total capacity to 3050.0 MW, an increase of 3.5%, and the total system capacity is 5189.2 MW to enhance peak shaving capacity and cope with extreme scenarios. Scheme 3 increases the number of high-load node buses from 298.6 MW to 309.0 MW from 298.6 MW, an increase of 3.5%. Bus 19 increased from 225.0 MW to 233.0 MW, an increase of 3.6%, allocating more capacity to support power supply stability in high-demand scenarios. Other nodes, such as bus 1, increased by 3.4% from 52.3 MW to 54.1 MW. Bus 8 increased from 60.0 MW to 62.1 MW, an increase of 3.5%, and the increase was relatively uniform, ensuring the overall balance of the system and avoiding local overload or waste of resources.
Through the analysis of the traditional genset configuration of 20 key nodes, scheme 3 shows significant advantages in the balance of capacity allocation, system stability, and economy. Compared with Option 1 and Option 2, Option 3 not only copes with the uncertainty of renewable energy through reasonable capacity increase but also optimizes the resource distribution, providing a scientific basis for the planning of a high-proportion renewable energy system.

5.4. Algorithm Scalability and Efficiency

To ensure the practical applicability of the proposed optimization framework for large-scale power systems with high renewable energy penetration, a quantitative analysis of the scalability and computational efficiency of the Benders decomposition method is presented. This method decomposes the optimization problem into a master problem and a subproblem, iterating until convergence to optimize the trade-off between investment costs and operational risks.
The computational performance was evaluated using the IEEE 118-bus system (Section 5.1), which includes 118 nodes, 54 conventional generators, 6 wind farms, 6 photovoltaic power plants, and 186 transmission lines. The optimization problem was solved for 1000 joint scenarios generated by the hierarchical Copula model using Monte Carlo sampling and reduced to 4 typical scenarios via K-means clustering (Section 5.2). The simulations were conducted on a standard desktop computer with an Intel Core i7 processor (3.2 GHz) and 16 GB of RAM, running the optimization in MATLAB 2018 with Gurobi as the solver.
For the IEEE 118-bus system, the Benders decomposition algorithm converges in an average of 12 iterations, with each iteration involving the solution of the master problem (a mixed-integer linear program) and the subproblem (a linear program). The total computation time for the optimization process is approximately 45 min, broken down as follows:
(1) Scenario Generation: As described in Section 3.4, generating 1000 scenarios takes approximately 30 s, and scenario reduction to 4 typical scenarios takes an additional 5 s.
(2) Master Problem: Solving the master problem per iteration takes approximately 150 s, primarily due to the optimization of planning variables across 118 nodes.
(3) Subproblem: Solving the subproblem per iteration, which evaluates operational feasibility and risk metrics (e.g., CVaR for loss-of-load and resource curtailment, Equations (24) and (25)), takes approximately 50 s for all scenarios.
(4) Convergence Check: Evaluating feasibility and optimality cuts (Section 4.3) adds negligible time.
The convergence criterion is based on the difference in the risk value between consecutive iterations, with a tolerance of 10−4 or a maximum of 20 iterations. In our experiments, convergence typically occurs within 10–15 iterations, depending on the initial planning variables and scenario complexity.
To assess scalability, the algorithm was tested on two additional systems: a reduced IEEE 30-bus system and a hypothetical 300-bus system. For the 30-bus system, with 30 nodes, 12 generators, 2 wind farms, 2 photovoltaic plants, and 41 transmission lines, the algorithm converges in an average of 8 iterations, with a total computation time of approximately 8 min. For the 300-bus system, with 300 nodes, 100 generators, 15 wind farms, 15 photovoltaic plants, and 400 transmission lines, convergence occurs in an average of 18 iterations, with a total computation time of approximately 2.5 h. These results are summarized in Table 12.
These results indicate that the proposed framework is computationally efficient and scalable, suitable for large-scale power systems. Benders decomposition combined with scenario reduction ensures tractability even in systems with hundreds of buses, making the method suitable for practical applications in regional or national grid planning. The hierarchical Copula model’s ability to generate representative scenarios further enhances computational efficiency, reducing the required number of scenarios without sacrificing robustness.

6. Conclusions

6.1. Research Work Summary

This research focuses on addressing the issue in traditional power system planning methods that are based on deterministic assumptions and cannot effectively handle the uncertainty brought by high proportions of renewable energy. A new method is proposed to optimize the balance between investment costs and operational risks in large-scale power systems. The research is closely aligned with the key points mentioned in the abstract and specifically covers the following aspects:
(1) To address the limitations of traditional methods in handling the uncertainty of renewable energy, this paper uses a hierarchical Copula model, successfully capturing the spatial correlation and temporal dependence between wind power, solar power, and load. Simulation results show that the model can reflect the negative correlation between wind power and load at night (correlation coefficient −0.28) and the positive correlation between solar power and load during the day (correlation coefficient 0.20), providing high-precision support for uncertainty modeling.
(2) Using the Monte Carlo method to generate multiple joint scenarios, this study reflects the complex interactions between different geographical locations. For example, the summer peak scenario and the winter low scenario provide a comprehensive data foundation for risk assessment, improving the adaptability of the planning scheme.
(3) This paper employs a comprehensive risk assessment method based on Conditional Value-at-Risk (CVaR), quantifying the loss of electricity risk (CVaRloss) and resource waste risk (CVaRwaste), and integrates them through a weighted sum to form a comprehensive risk indicator. In the IEEE 118-node system, Scheme 3 reduces it from 135.7 MW to 51.8 MW (a reduction of 61.8%), significantly lowering operational risks.
(4) An optimization framework that considers supply–demand probability balance constraints is proposed, allowing for supply–demand matching at certain probability levels, and the Benders decomposition method is used to improve computational efficiency. The optimization results show that Scheme 3 increases the capacities of traditional generation (5189.2 MW, a 3.5% increase), wind power (1124.8 MW, a 6.7% increase), and solar power (543.4 MW, a 3.6% increase), ensuring system stability.
This research has made significant progress in the following areas:
We verified the effectiveness of the hierarchical Copula model in handling the uncertainty of wind power, solar power, and load, providing accurate scenario support for planning. We also developed a CVaR-based comprehensive risk assessment method, significantly reducing the curtailment rate and supply–demand imbalance frequency and enhancing system robustness. Through the optimization framework and simulation analysis, we demonstrated the advantages of the proposed method in balancing investment costs and operational risks, providing practical support for large-scale power system planning.

6.2. Outlook for Follow-Up Work

Although this research has made significant progress in uncertainty modeling, risk optimization, and system planning, there are several directions worth further exploration to enhance the theoretical value and application prospects of the method. The following are the prospects for future research:
(1) This study uses the IEEE 118-node system as a test platform to validate the effectiveness of the method. In the future, the method can be applied to larger-scale power systems, such as the IEEE 300-node system or real regional power grids, to evaluate its computational efficiency and optimization performance in high-dimensional scenarios. Additionally, combining real operational data (such as multi-year wind speed, irradiation, and load records from a regional power grid) for empirical analysis will further validate the robustness and adaptability of the model, especially under complex geographical environments and extreme weather conditions. This will provide a solid foundation for the engineering application of the method and promote its transition from theoretical research to practical power grid planning.
(2) The current research mainly focuses on the optimal configuration of wind and solar power. In the future, this can be extended to the collaborative optimization of various energy resources, including energy storage systems, hydropower, and geothermal energy. By constructing an integrated energy system model, multiple energy sources can complement each other, enhancing system flexibility and resource utilization efficiency. For example, introducing energy storage systems (such as battery storage or pumped hydro storage) can smooth out fluctuations in renewable energy and improve peak-shaving capabilities. Combining the regulation characteristics of hydropower can further reduce operational risks and costs. This multi-energy collaborative optimization can not only enrich the applicability of the method proposed in this study but also provide technical support for the planning of low-carbon, sustainable energy systems.
(3) This study is based on a static planning framework. In the future, dynamic programming methods can be introduced, combined with short-term forecasts (such as 24 h predictions of wind speed and load) and real-time data (such as online monitored output variations) to achieve dynamic adjustment and optimization of the power system. By developing real-time decision support tools, the system can quickly respond to fluctuations in renewable energy and load changes, improving its adaptive capacity. Additionally, combining machine learning or artificial intelligence technologies (such as deep reinforcement learning) to build an intelligent scheduling system will further enhance the intelligence level of planning and operation. This will provide technological support for the construction of smart grids, especially when dealing with high-frequency uncertainty scenarios.
(4) Future research could explore the integration of neural network analysis to enhance the modeling of non-linear dependencies and improve real-time forecasting and optimization, potentially complementing the hierarchical Copula model. And, the work could incorporate bifurcation analysis to investigate system behavior under non-standard operating conditions, such as extreme renewable energy fluctuations, to further enhance system robustness.
The proposed framework can be integrated into practical planning tools like PSS/E or MATPOWER by developing a modular plugin that implements the hierarchical Copula model and CVaR-based optimization. Coupling with IoT-based grid monitoring systems could enable real-time scenario updates, enhancing the framework’s applicability in operational planning.

Author Contributions

L.F.: Responsible for writing the original draft and visualization. Y.M.: Responsible for funding acquisition, investigation and formal analysis. D.Z.: Responsible for writing—review and editing and software. D.G.: Responsible for data curation, resources and software. D.B.: Responsible for formal analysis, methodology and investigation. All authors have read and agreed to the published version of the manuscript.

Funding

This work was supported by the Headquarters Management Technology Project Funding of State Grid Corporation of China, Research and Application on Key Technologies for Dynamic Probabilistic Balance of Electricity Supply and Demand and Security-Economic Equilibrium Decision-Making Adapted to High Uncertainty (1400-202416292A-1-1-ZN).

Data Availability Statement

The original contributions presented in this study are included in the article. Further inquiries can be directed to the corresponding author.

Conflicts of Interest

Authors Ying Mu, Dongliang Zhang, and Dashun Guan are employed by Jinan Power Supply Company of State Grid Shandong Electric Power Company. The remaining authors declare that this research was conducted in the absence of any commercial or financial relationships that could be construed as potential conflicts of interest.

References

  1. Yuan, T.; Zhang, W. A review of the research on the collaborative planning of source-storage-load in the new power system. Proc. China Electrotech. Soc. 2022, 17, 6664–6682. [Google Scholar]
  2. Li, B.; Chen, M.; Zhong, H.; Ma, Z.; Liu, D.; He, G. A review of long-term planning of new power systems with high renewable energy penetration. Proc. China Electrotech. Soc. 2023, 43, 555–581. [Google Scholar]
  3. Liu, J.; Liu, X.; Lu, X.; Zhang, D.; Xu, Y.; Xing, Y. Methods and strategies for analyzing supply-demand balance in high renewable energy systems. High Volt. Eng. 2023, 49, 2711–2724. [Google Scholar]
  4. Han, F.; Zhao, Y.; Zeng, J.; Lin, J.; Gao, J.; Gao, C. Multi-region integrated energy system collaborative optimization and benefit distribution considering stochastic fuzziness. Power Autom. Equip. 2025, 6, 23–31. [Google Scholar]
  5. Ye, L.; Pei, M.; Li, Z.; Song, X.; Luo, Y.; Tang, Y. A framework for joint forecasting and pre-scheduling of wind and solar power generation. High Volt. Eng. 2024, 50, 3823–3836. [Google Scholar]
  6. Liao, Z.; Li, Y. Probabilistic forecasting of wind, solar, and load power using R-copula-DBN spatiotemporal correlation modeling. Power Autom. Equip. 2022, 42, 113–120. [Google Scholar]
  7. Ning, N.; Fan, J.; Xu, P.; Cheng, P.; Lin, S.; Xie, M. A dynamic economic dispatch scenario coordination optimization algorithm for power systems based on dynamic C-copula pair-copula. Power Big Data 2021, 24, 26–34. [Google Scholar]
  8. Li, J.; Wen, J.; Cheng, S.; Wei, H. Scenario generation method considering Copula correlation relationships between multiple wind farms’ outputs. Proc. China Electrotech. Soc. 2013, 33, 30–36. [Google Scholar]
  9. Tao, P.; Niu, W.; Wu, H.; Ren, P. Power system net load forecasting based on Gumbel copula joint probability distribution. J. North China Electr. Power Univ. (Nat. Sci. Ed.) 2020, 47, 25–37. [Google Scholar]
  10. Shen, J.; Li, M.; Ji, T.; Lin, Z. Low-carbon operation joint optimization of high-penetration renewable energy power systems based on multi-level Conditional Value-at-Risk. Power Grid Clean Energy 2024, 40, 37–46. [Google Scholar]
  11. Zhang, Y.; Han, F. Multistage stochastic modeling and solving for risk-averse power systems considering time consistency. J. Electr. Power Syst. Autom. 2022, 34, 28–36. [Google Scholar]
  12. Chen, C.; Zhang, T.; Shen, Z.; Yu, S.; Yang, L.; Lin, Z. A review of shared energy storage business models on the generation and consumption sides in the new power system. Autom. Electr. Power Syst. 2025, 49, 20–42. [Google Scholar]
  13. Xian, Y.; Huang, X.; Zhang, Y.; Li, X.; Xu, C. Long-term bi-level nested optimization scheduling of a hydro-solar complementary system considering short-term fluctuations and curtailment risks. Trans. China Electrotech. Soc. 2023, 38, 5781–5793. [Google Scholar] [CrossRef]
  14. Chen, L.; Deng, X.; Chen, H.; Shi, J. A review of research on power system resilience assessment and improvement. Power Syst. Prot. Control. 2022, 50, 11–22. [Google Scholar] [CrossRef]
  15. Gao, Y.; Xu, X.; Yan, Z. Power system uncertainty modeling method based on multidimensional Gaussian mixture models. Proc. China Electrotech. Soc. 2023, 43, 37–48. [Google Scholar]
  16. Zhu, T.; Zhu, J.; Liu, M.; Zhao, W. Decentralized stochastic optimization method for dynamic economic dispatch of wind power systems. Power Syst. Autom. 2017, 41, 48–54. [Google Scholar]
  17. Yang, Y. Coordinated Optimization Planning Theory and Application Research for Power Systems “Source-Network-Load-Storage”; North China Electric Power University: Beijing, China, 2017. [Google Scholar]
  18. He, W.; Sun, Y.; Han, T.; Guo, M.; Guan, W.; Shi, J. Research on the integrated energy load forecasting algorithm based on multivariate modal decomposition and deep modeling fusion. Autom. Electr. Power Syst. 2025, 1–12. [Google Scholar] [CrossRef]
  19. Li, Q.; Pan, Y.; Qiu, Y.; Chen, W. Economic dispatch analysis of multi-wind farm power systems based on the MVT Copula method. J. Southwest Jiaotong Univ. 2021, 56, 339–346. [Google Scholar]
Figure 1. IEEE 118-node system network diagram.
Processes 13 03564 g001
Figure 2. Wind power output scenario generation.
Processes 13 03564 g002
Figure 3. Photovoltaic power output scenario generation.
Processes 13 03564 g003
Figure 4. Load output scenario generation.
Processes 13 03564 g004
Figure 5. Typical scenarios: (a) Scenario 1; (b) Scenario 2; (c) Scenario 3; (d) Scenario 4.
Processes 13 03564 g005aProcesses 13 03564 g005b
Table 1. Wind farm data.
Bus NumberInstalled Capacity (MW)
10198.7
25152.3
40179.5
60162.8
80171.2
Table 2. Photovoltaic power plant data.
Bus NumberInstalled Capacity (MW)
15102.1
3081.6
4589.3
6572.4
8584.7
10594.2
Table 3. Wind speed, solar irradiance, and load data parameters.
VariableBus NumberDistribution TypeParameter 1Parameter 2
Wind Farm10, 25, 40Weibullk = 2.1c = 7.8
Wind Farm60, 80Weibullk = 2.0c = 7.5
Photovoltaic Power Plant10, 30, 45Betaα = 2.3β = 3.2
Photovoltaic Power Plant65, 85, 105Betaα = 2.5β = 3.0
Load-Normal Distributionμ = 3524.7σ = 412.3
Table 4. Typical scenario probabilities based on Copula theory.
Typical ScenariosProbability
10.3579
20.0589
30.2753
40.3247
Table 5. Scenario correlation analysis.
Typical ScenariosWind Power Output Mean (MW)Photovoltaic Power Output Mean (MW)Load Demand Mean (MW)Wind Power–Load CorrelationPhotovoltaic–Load Correlation
1632.35471.924124.44−0.280.20
2895.840.003821.12−0.250.00
3421.61157.373223.02−0.300.15
4751.22250.753644.68−0.270.18
Table 6. Comparison of costs under different scenarios.
Cost ItemsScheme 1Scheme 2Scheme 3
Investment costs4010.64118.54298.8
Running costs152.3141.7128.5
Photovoltaic capacity cost of risk133.588.951.9
Total cost4296.44349.14479.2
Table 7. Installed capacity and risk indicators under the base scenario.
IndicatorsScheme 1Scheme 2Scheme 3
Conventional Power Generation Capacity (MW)5012.45123.75189.2
Wind Power Capacity (MW)1053.91102.51124.8
Photovoltaic Capacity (MW)524.3536.1542.6
CVaRloss148.698.262.5
CVaRwaste118.379.641.2
CVaRtotal135.789.351.8
Table 8. Photovoltaic (PV) installed capacity under different scenarios (MW).
Bus NumberScheme 1Scheme 2Scheme 3
15102.1104.3105.8
3081.683.284.5
4589.391.192.6
6572.474.075.1
8584.786.487.9
10594.296.097.5
Total capacity524.3535.0543.4
Table 9. Wind power installed capacity under different scenarios (MW).
Bus NumberScheme 1Scheme 2Scheme 3
10198.7207.5212.0
25152.3159.0162.5
40179.5187.0191.5
60162.8169.5173.8
80171.2178.5182.7
100189.4197.0202.3
Total capacity1053.91098.51124.8
Table 10. Capacity of transmission lines under different scenarios (MW).
Line (From–To)Scheme 1Scheme 2Scheme 3
10–12200.0225.0250.0
15–33150.0180.0225.0
25–27180.0180.0180.0
40–42250.0275.0300.0
60–61300.0330.0350.0
80–99220.0240.0260.0
Table 11. Installed capacity of traditional generator sets at key nodes (MW).
Bus NumberScheme 1Scheme 2Scheme 3
152.353.554.1
478.980.581.6
6124.7127.0128.9
1095.297.198.5
12110.4112.6114.2
1585.687.388.6
18130.0132.6134.6
2460.061.262.1
2575.076.577.6
3190.091.893.2
34105.0107.1108.7
40120.0122.4124.2
46135.0137.7139.8
49150.0153.0155.3
54165.0168.3170.9
59180.0183.6186.4
65195.0198.9202.0
69210.0214.2217.5
80225.0229.5233.0
89298.6304.0309.0
Total capacity2946.73006.73050.0
The total capacity of the system5012.45123.75189.2
Table 12. Computational performance across different system scales.
SystemNodes (n)Scenarios (K)Avg. IterationsTotal TimeMemory Usage (GB)
IEEE 30-bus301000 (reduced to 4)88 min0.8
IEEE 118-bus1181000 (reduced to 4)1245 min2.5
Hypothetical 300-bus3001000 (reduced to 4)182.5 hr6.2
Disclaimer/Publisher’s Note: The statements, opinions and data contained in all publications are solely those of the individual author(s) and contributor(s) and not of MDPI and/or the editor(s). MDPI and/or the editor(s) disclaim responsibility for any injury to people or property resulting from any ideas, methods, instructions or products referred to in the content.