Abstract
Elucidating the characteristics of methane adsorption in coal is essential for accurately assessing coalbed methane (CBM) potential. Methane adsorption is primarily governed by the compositional complexity of coal and its pore structure. Molecular simulation enables characterization of coal’s molecular composition at the microscopic level and facilitates the construction of nanoscale pore models. In this study, Nuclear Magnetic Resonance (NMR), Fourier Transform Infrared Spectroscopy (FTIR), and X-ray Photoelectron Spectroscopy (XPS) were used to characterize the molecular structure of coal. Pore models of various sizes were constructed in Materials Studio (MS) to simulate methane adsorption under different temperatures and pressures. To further clarify the influence of molecular structure, a reconstructed macromolecular model (RMM) was compared with a graphite model, revealing differences in methane adsorption behavior across varying pore sizes, temperatures, and pressures. The results show that absolute methane adsorption increases with pore size, while excess adsorption behavior is strongly associated with the adsorption layer. In the pore size range of 0.4 nm to 1.2 nm, excess adsorption increases due to spatial confinement, but decreases as pore size exceeds 1.2 nm. Structural differences between the RMM and graphite models also resulted in distinct temperature responses, with the graphite model underestimating methane adsorption capacity, highlighting the importance of realistic macromolecular representations in adsorption studies.
1. Introduction
Coal, as a heterogeneous adsorbent, contains various components that play distinct roles in methane adsorption [1,2]. Understanding the mechanisms of methane adsorption is essential for the efficient exploitation of coalbed methane (CBM) [3,4,5]. Monte Carlo and molecular dynamics simulations have been widely applied to investigate gas adsorption behaviors, offering detailed insights into coal’s nanoscale pore structure and molecular-level composition [6,7,8,9,10,11].
The critical role of pore structure on methane adsorption was revealed by pore characterization methods with methane adsorption isotherm experiments [12,13,14,15,16,17,18]. Methane adsorption capacity, which can be predicted using adsorption isotherms, serves as a key parameter for estimating CBM reserves [19,20,21,22]. Experimental Langmuir isotherm analysis of coals with varying metamorphic grades reveals that higher-rank coals exhibit the greatest adsorption capacity, with substantial gas uptake occurring even at low pressures [23]. Monolayer and multilayer adsorption behaviors in Indian coal have been described using models such as D–R, Temkin, Freundlich and Langmuir [24]. Furthermore, adsorption isotherms indicate that methane uptake increases exponentially the number of nanopores between 8 and 50 nm, while pore size distribution in this range did not affect the maximum adsorption capacity [25]. In bituminous coal, the specific surface area of pores smaller than 1 nm is one to two orders of magnitude greater than that of larger pores, providing abundant adsorption sites for methane [26,27]. Molecular simulations also show that gases are preferentially adsorbed in micropores [28]. In the 1 nm pores, limited space restricts gas movement and adsorption, while 2 nm pores exhibit enhanced uptake due to overlapping adsorption potentials and increased volume [9]. In addition, molecular simulations reveal that pore geometry is a key determinant of methane adsorption capacity [13,29]. Methane adsorption capacity is highest in slit pores, followed by cross and then round pores [30]. As shown in the bulk adsorption isotherms of methane in 0.95 nm carbon pores with different geometries, the bulk-phase density in circular pores is three times greater than in triangular and slit pores, while in square pores it is approximately twice as high [31]. When using a slit-shaped pore model for methane adsorption, a transition from monolayer to bilayer adsorption occurs as the pore width approaches 1 nm. The adsorption layer adjacent to the coal matrix exhibits a higher density [32]. These findings highlight that both the distribution and geometry of pores significantly influence methane adsorption in coal. However, current studies remain limited in their ability to precisely characterize how variations in pore distribution affect adsorption capacity.
Molecular simulation can be applied not only to model pore structures but also to represent the coal matrix at the molecular level. Graphite-based models composed of benzene rings have frequently been used as initial structures to study gas adsorption in coal and shale [6,33,34]. The simulation results between multilayer graphite and CH4 were found to be in good agreement of the trend with the experimental results [6,14]. The methane excess adsorption amount increasing with decreasing temperature and decreasing with increasing slit pore size of the graphite model [6,35]. The excess adsorption per unit area increases stepwise with pore size from 0.5 to 1.5 nm and remains constant beyond 1.5 nm [36]. These findings offer valuable insights for CBM exploration. However, the adsorption isotherms derived from the graphite model show limited agreement with the experimental results. The molecular simulation underestimated excess adsorption at pressures less than 2.5 MPa, while overestimated excess adsorption at pressures greater than 2.5 MPa up to 20 MPa [32]. In order to improve the accuracy of molecular simulation and reduce the limitations of the model, many researchers have developed coal macromolecular structure models based on the molecular characteristics of coal samples, such as the Give, Wiser, and Solomon models [10,37]. When performed the molecular simulations under a COMPASS force field using the wiser model, the simulation results, including diffusion coefficients, and sorption isotherms, that align well with experimental results [10]. Using Wender’s and Kumagai’s models, bond order and bond dissociation enthalpy were calculated via DFT, yielding results consistent with experiment [38]. The improved agreement between simulation and experimental results can be attributed to the inclusion of functional group effects in the model.
The molecular structure of coal significantly influences methane adsorption variations, which include distinct functional groups exhibiting differential adsorption affinities for methane molecules [39]. The methane adsorption properties of carboxyl groups are greater than those of some heteroatomic functional groups [40,41]. A reduction in oxygen-containing functional groups (such as C–O, C=O, and –COOH) weakens the methane adsorption capacity of the coal matrix [42,43]. Therefore, with the continuous progress of geochemical methods, the reconstructed macromolecular model (RMM) have gradually come to the public’s attention to construct macromolecular structural models of coal samples for gas adsorption [7,44,45,46]. Molecular simulations of coal maceral structural models revealed that methane adsorption capacity and isosteric heat of adsorption both increase with coal metamorphism [47]. The methane adsorption by coal macromolecules with varying moisture contents was modeled, revealing that internal moisture primarily affects methane adsorption through competitive adsorption in micropores, with minimal impact on monolayer adsorption [15]. The methane adsorption data obtained from the coal macromolecular model, constructed using molecular structures, show that the isotherm adsorption curves closely match the experimental results [48]. These methods enable researchers to precisely understand the interaction mechanisms between coal and methane, providing theoretical support for the efficient exploitation of coalbed methane in actual production processes [33,46,49,50]. Therefore, developing models tailored to specific research areas is crucial, as they can more accurately reflect experimental situation. However, there is still limited research on the specific differences between these models and graphite models.
Methane adsorption capacity of coal is governed by a complex interplay of factors. The pore distribution and heterogeneous molecular composition of the coal matrix serve as the primary determinants. Therefore, studying the impact of nanoscale pore sizes on methane adsorption in coal is crucial. Additionally, more research is needed to clarify the specific differences between graphite models and the reconstructed macromolecular model (RMM) in methane adsorption simulation. To address these problems, this study focuses on pore size effects by constructing slit-shaped pore and applying molecular simulations to elucidate methane adsorption behaviors. The objectives of this study are (1) quantitatively characterization of the methane adsorption behaviors in the different pore space which formed by the RMM, and (2) clarify the discrepancy of methane adsorption behavior between graphite model and the RMM under different temperatures and pore sizes.
2. Materials and Methods
2.1. Sample Information
The coal sample was obtained from the Benxi Formation, Ordos Basin, at a depth of 2358.12 m. Proximate analysis was conducted to determine the basic properties of the coal, following the method described in Guo et al. [2]. Vitrinite reflectance was measured according to the procedure outlined by Burnaz et al. [51]. The elemental analysis followed the method of Wang et al. [52]. The results are showed in Table 1.

Table 1.
Sample physical parameters.
2.2. 13C Nuclear Magnetic Resonance Spectra
13C NMR experiments were performed using an Bruker AVANCE III HD spectrometer (Saarbrücken, Germany) equipped with a magnetic field strength of 9.4 Tesla. Spectra were recorded at room temperature using a Bruker magic-angle spinning (MAS) probe (Saarbrücken, Germany) with a rotation rate of 10 kHz, a contact time of 2 ms, and a recycle delay of 3 s. Spectral deconvolution and fitting were performed using PeakFit software. Structural assignments of coal macromolecular components were based on chemical shift regions [53,54]. The bridge carbon ratios, which can be used to infer the presence of aromatic carbons, were calculated using Equation (1).
2.3. X-Ray Photoelectron Spectroscopy
XPS analysis was performed using the Thermo Scientific K-Alpha X (Waltham, MA, USA) to investigate the bonding patterns of C, H, O, and N atoms, enabling characterization of the heteroatomic structure of the coal sample. Full-spectrum and narrow-scan transmission measurements for C, N, O, and S were performed using 20–30 mg of sample. The full-scan transmission energy was set to 150 eV in 1 eV increments, while the narrow-scan transmission energy was 60 eV in 1 eV increments. Binding energy corrections were applied using a carbon peak at 284.6 eV prior to data processing.
2.4. Fourier Transform Infrared Spectroscopy
FTIR analysis was performed using a Thermo Nicolet iS50+Continu μm instrument to identify the functional groups present in the coal. The sample was ground to 200 mesh, dried at 60 °C for 24 h, mixed with pure KBr, and pressed into pellets. The spectrum was obtained with a resolution of 2 cm−1, ranging from 4000 and 400 cm−1. Baseline correction was applied before spectral fitting, and functional groups were identified based on fitted peak positions.
2.5. Molecular Mechanics and Molecular Dynamics Calculations
The chemical formula and two-dimensional model of the coal sample were inferred from its molecular structural features. Based on 13C NMR, FTIR, and XPS analyses, the carbon skeleton, aliphatic carbon structures, and heteroatomic functional groups were characterized, respectively. The two-dimensional model was then converted into a three-dimensional model by importing it into Materials Studio (MS) and performing molecular mechanics and molecular dynamics calculations.
The 3D model was initially optimized using the forcite module, with the geometry optimization task for molecular mechanics and the anneal task for molecular dynamics. Additionally, each molecular dynamics optimization was followed by a molecular mechanics optimization. Compass II field was selected as the force field to describe the interaction between gas molecules and coal molecules. The charge calculation method used the forcefield assignment method, the electrostatic force used the Ewald method, and the van der Waals force used the Atom-based calculation method [55]. In the COMPASS force field, the intermolecular collision diameter is represented by the Lennard-Jones model [56]. Canonical ensemble dynamics were performed at temperatures ranging from 300 to 600 K for 10 cycles, with a time step of 1 fs. Based on the amorphous cell module, the three 3D macromolecular structures were subjected to density simulations with periodic boundary conditions. The most structurally stable cell, with the lowest total energy, was selected to serve as the foundation for subsequent experiments. Thirty identified coal molecules were placed into a unit cell, and the compaction effect of the strata was simulated to reduce the porosity between the molecular structures. After construction, the coal matrix had a length and width of 7.5 nm, with a height of 1 nm.
Pore size modeling was carried out using the build layers module, after geometry optimization and annealing of the cell model developed in the previous study. During the construction process, the previously compacted coal molecular unit cell was used as the top and bottom surfaces of the pore model, with a vacuum layer inserted between them. The pore size was adjusted by varying the length of the vacuum layer. The sorption module was used for the adsorption simulations, with force field parameters consistent with Compass II molecular force field. The pressure value selected in the simulation process was the fugacity value [1]. The CH4 bond length is found to be 0.109 nm with a corresponding bond angle of 109.471° [44]. Methane adsorption isotherms for various pore size models were simulated using the sorption module, that the temperature is set to 318 K and the pressure was set to 0~20 MPa. The Langmuir isothermal adsorption equation derived from the molecular motion theory and the monomolecular layer adsorption theory is the equation that can describe the gas–solid adsorption process, which equation is shown below [15]:
where is adsorption volume at pressure, mmol/g; is pressure in simulation, MPa; is the Langmuir volume, which means the maximum adsorbed methane quantity at a certain temperature (mmol/g); and is the Langmuir pressure (MPa−1).
3. Results and Discussion
3.1. Construction of the Macromolecular Structure of Coal
3.1.1. Coal Molecular Structure Information
To construct a molecular model of the coal sample, approaches including X-ray photoelectron spectroscopy (XPS), Fourier Transform Infrared (FTIR) and 13C Nuclear Magnetic Resonance Spectra (13C NMR) were employed to characterize molecular bonding and elemental distribution (Figure 1).
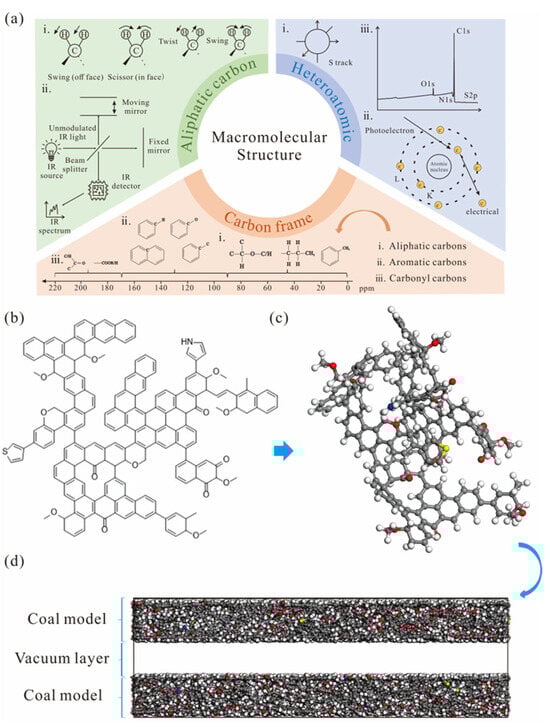
Figure 1.
Construction of the pore model for the coal sample: (a) characterization of molecular structures, (b) two-dimensional coal model, (c) three-dimensional coal model, (d) pore model.
The 13C NMR spectra of the coal samples exhibit chemical shifts spanning 0–250 ppm (Figure 2), with three distinct regions corresponding to aliphatic carbons (0–90 ppm), aromatic carbons (90–165 ppm), and carbonyl carbons (165–250 ppm), respectively [8]. The results of the 13C NMR spectral fitting display the proportions of carbon-containing functional groups in the carbon backbone (Table 2). The sample was primarily composed of aromatic carbon, with protonated aromatic carbon being the most abundant. This suggests that the macromolecular carbon skeleton of the coal samples is predominantly made up of aromatic structures. Within the aliphatic carbon fraction, oxygenated methylene carbon was the major component, while carbonyl carbon was the dominant form in the carbonyl group. Statistical analysis of the carbon types is provided in Table 3.
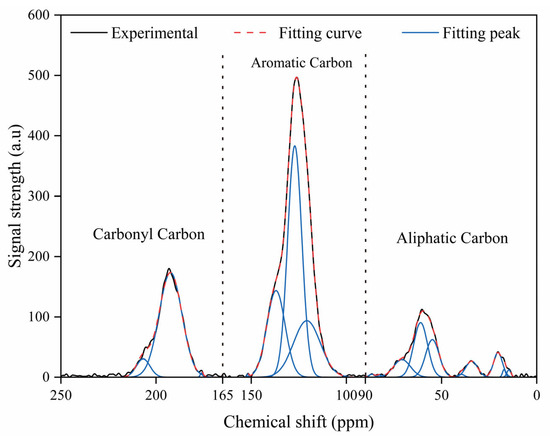
Figure 2.
Peak fitting for 13C NMR spectra.
Table 2.
13C NMR spectrum splitting results.
Table 3.
Proportion of functional groups of different types of carbon.
The bridge-to-perimeter ratio (XBP), calculated using Equation (1), is 0.26. The XBP values for benzene, naphthalene, anthracene, and pyrene are 0, 0.2, 0.28, and 0.37, respectively, suggesting that the carbon skeleton of the coal macromolecules is primarily composed of naphthalene and anthracene [11]. Initially, naphthalene and anthracene units were added or removed with linkage adjustments guided by comparison to the 13C NMR spectrum. The aromatic carbon structure was determined to consist of one benzene, five naphthalene and three anthracene units, corresponding to a total of 110 aromatic carbon atoms. As shown in Table 3, the measured value of 61.9% corresponds to a total carbon number of 186, demonstrating that aliphatic, carboxyl, and carbonyl carbons collectively account for 76 of the total carbon.
The functional group distribution obtained from peak-fitting of the XPS spectra is shown in Figure 3, and the relative proportions of each group are summarized in Table 4. Nitrogen is primarily present as pyrrole, accounting for 49.32%, with the remainder consisting of pyridine, quaternary N, and N-Oxides. Sulfur mainly appears as thiophene at 71.28%, while the remaining species are -SH, pyrite, -S=O-, and sulfone (-SO2-). Oxygen is largely found in C-O-H and C-O-C forms, reaching up to 60.65%, and the rest is distributed as C=O, O-C=O, C-O-C=O, and water (H2O). Elemental analysis shows that the coal sample consists of 86.87% carbon, 3.07% hydrogen, 6.99% oxygen, 1.04% nitrogen, and 2.03% sulfur. Since nitrogen and sulfur together account for less than 3% of the total composition, only one pyrrole and one thiophene unit were included in the coal macromolecular model. Figure 4 presents the FTIR peak-fitting results, identifying characteristic peaks for aromatic structures (700–900 cm−1), oxygen-containing functional groups (1000–1800 cm−1), aliphatic structures (2800–3000 cm−1), and hydroxyl groups (3000–3600 cm−1). Based on the deconvolution results, the features of the aliphatic carbon structure were determined and are summarized in Table 5. Methyl and methylene groups dominate the aliphatic region with a ratio of 7:3. Oxygen speciation analysis indicates a predominant presence of C–O bonds, in agreement with the XPS results.
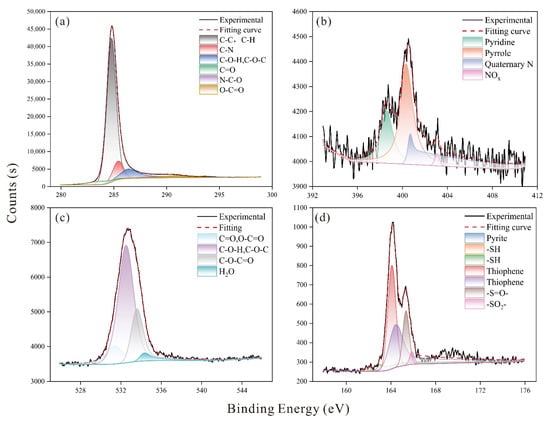
Figure 3.
Peak fitting for XPS spectra: (a) C spectra, (b) N spectra, (c) O spectra, (d) S spectra.
Table 4.
XPS spectrum splitting results.
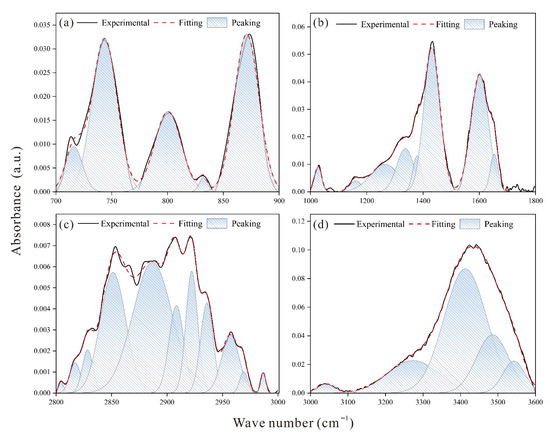
Figure 4.
Peak fitting for FTIR spectra: (a) aromatic hydrocarbons spectra, (b) oxygen-containing functional groups, (c) aliphatic hydrocarbons spectra, (d) hydroxyl hydrogen bond spectra.
Table 5.
FTIR spectrum splitting results.
3.1.2. Three-Dimensional Coal Macromolecular Model
The macromolecular structure was developed through initial model construction based on statistical analysis of spectral data. The final two-dimensional macromolecular structure was confirmed through iterative validation against the 13C NMR spectra. Initially, the aromatic hydrocarbons in the carbon backbone were arranged according to the structure derived from NMR peak fitting. The aliphatic carbons were then added, followed by the incorporation of heteroatom-containing functional groups. Notably, 13C NMR analysis exhibited significant signal amplification in the carbonyl, carboxyl region (165-220 ppm) due to spinning sideband artifacts, necessitating exclusion of this spectral region during experimental–model correlation [48,57]. The final optimized structure (C186H125O14NS) shows excellent agreement with the spectra, as illustrated in Figure 5. To convert the two-dimensional configuration into a three-dimensional model, Materials Studio (MS) was employed to perform hydrogenation, geometry optimization and molecular dynamics optimization.
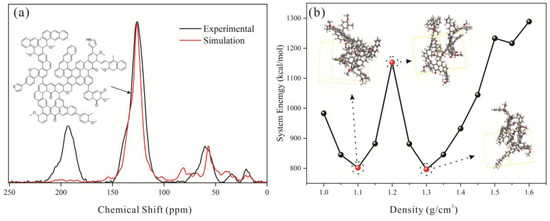
Figure 5.
Construction of the amorphous cell structure: (a) determination of the two-dimensional model, (b) transformation of the 3D model to amorphous cell structure.
The density in the simulation was incrementally increased from 1.0 g/cm3 to 1.6 g/cm3 in 0.05 g/cm3 steps. The model with the lowest energy configuration was retained for subsequent simulations. A total of 10,000 loading steps were employed, and the force field parameters were maintained consistent with those used in the preceding simulations. Subsequent density data revealed an inverse correlation between energy and density at lower values (Figure 5), reaching the first potential energy minimum at 1.1 g/cm3. The optimal density corresponds to the secondary local energy minimum (1.3 g/cm3) following the first potential trough, aligning with the characteristic density range (1.2–1.4 g/cm3) of bituminous coal [58]. Using the Amorphous Cell module, 30 coal molecules were placed in a box measuring 7.5 nm × 7.5 nm. The Build Layer tool was then used to position three fixed graphene layers above and below this box along the Z-axis, ensuring they were in close proximity to the coal molecules without any physical contact [59]. The coal molecules were compressed by graphene layers through geometric optimization and molecular dynamics simulations. Subsequently, a sandwich pore model was constructed using the Build Layer tool. This model features upper and lower layers of coal molecules, with the same molecular face oriented inward, while maintaining the original X-Y plane dimensions of 7.5 nm × 7.5 nm. As can be seen from Figure 1d, the pore size was controlled by inserting vacuum layers of varying thickness between the two coal molecule layers.
3.2. Methane Absolute Adsorption Characteristic Analysis Under Different Pore Sizes
3.2.1. Methane Absolute Adsorption Isotherm Characteristic Analysis
The pressure and absolute adsorption amount relationships are presented in Figure 6. The methane absolute adsorption isotherms in the coal matrix pore models follow a similar pattern. Rapid adsorption occurs at low pressures, adsorption rates decrease as pressure increases, and equilibrium is reached at high pressures. As pore size increases, the approach to plateau becomes more gradual. For the 0.4 nm pore, the isotherm begins to level off at approximately 4 MPa, whereas for the 5 nm pore it continues to rise even at 20 MPa. Meanwhile, it can be seen that the maximum absolute adsorption amount is also increasing with the increasing pore size (Table 6). Notably, Increasing the pore width from 0.8 to 1.0 nm raises the maximum adsorption from 3.86 to 4.76 mmol/g, an increase of 0.9 mmol/g. In contrast, the same 0.2 nm expansion from 1.8 to 2 nm boosts adsorption from 6.2 to 8.1 mmol/g, an increase of 1.89 mmol/g. The absolute adsorption capacity increments vary nonlinearly with pore size.
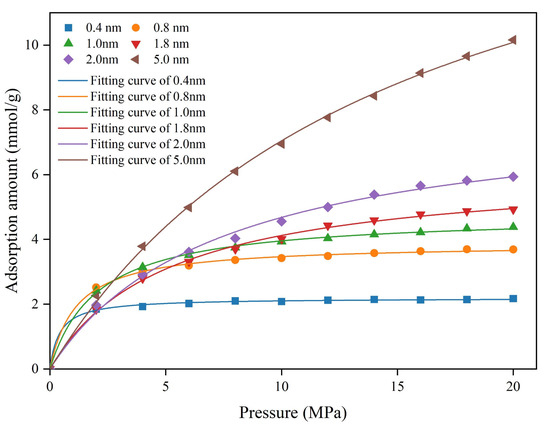
Figure 6.
Methane absolute adsorption isotherms for different pore sizes.
Table 6.
Langmuir parameter of CH4 adsorption under different pore size.
3.2.2. Methane Adsorption Layer Characteristic Analysis
By examining the methane adsorption snapshots in models with different pore sizes, the methane formed adsorption layers on the coal matrix surface (Figure 7). As pore size increases from 0.4 nm to 2nm, the number of adsorption layers increases from one in 0.4 nm pore size to three in 1 nm pore size and four in 2 nm pore size. It is also evident that the density of each adsorption layer varies, with the density increasing as the layer approaches the coal matrix [32]. Methane density distribution curves, perpendicular to the coal matrix, were derived from extracted molecules (Figure 8 and Figure 9). In 0.4 nm pores, methane forms a monolayer adsorption structure, as shown by relative density distributions. At 0.5 nm pore size, slightly exceeding methane’s 0.38 nm molecular diameter, a pseudo-bilayer adsorption configuration forms between pore walls. At 0.6 nm, a distinct bilayer adsorption structure emerges, with molecules adopting crosswise or intercalated arrangements rather than side-by-side packing [6]. At 0.9 nm pore size, two distinct monomolecular adsorption layers form. A low central peak in density distributions indicates a secondary adsorption layer forming at 0.9 nm (Figure 8). This secondary layer stabilizes and becomes clearly defined at 1 nm. With further pore enlargement, bilayer adsorption dominates [60]. At 1.4 nm pore, two symmetric density peaks appear near each coal matrix surface. Initially, interactions between the adsorbate and adsorbent form the first adsorption layer, as pressure increases and space permits, adsorbate–adsorbate interactions give rise to a second layer [61,62]. The differential peak intensities between adsorption layers reflect decreasing coal matrix-methane interaction forces with increasing distance from the surface. With the gradual increase in pore size, the gap between the adsorption layer and the stacking density layer becomes smaller [55,60].
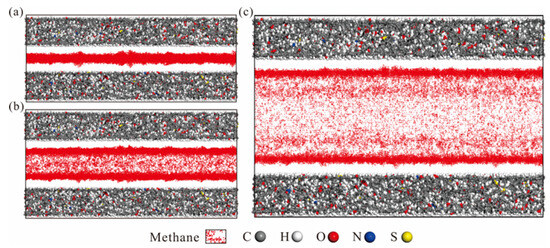
Figure 7.
Snapshots of methane adsorption at 10 MPa with different pore sizes: (a) 0.4 nm, (b) 1 nm, (c) 2 nm.
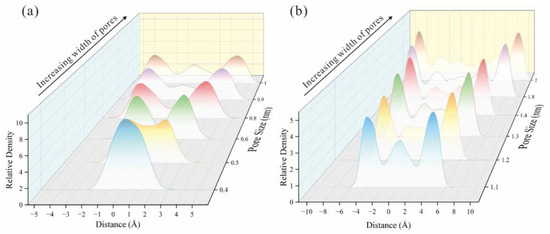
Figure 8.
The relative methane density distribution of micropores: (a) 0.4 nm~1 nm. (b) 1.1 nm~2 nm.
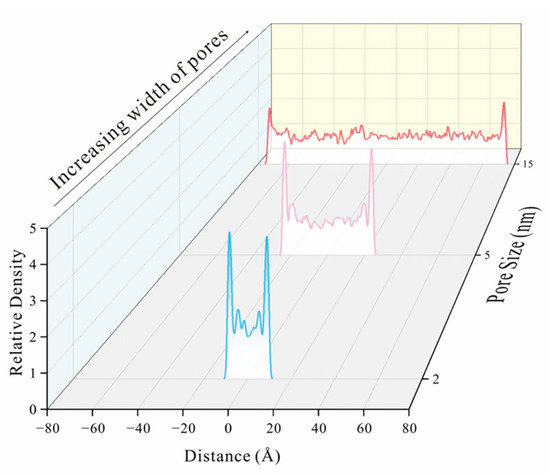
Figure 9.
The relative methane density distribution of 2 nm wide pore, 5 nm wide pore and 15 nm wide pore.
3.3. Methane Excess Adsorption Characteristic Analysis Under Different Pore Sizes
3.3.1. Methane Excess Adsorption Density Characteristic Analysis
Absolute adsorption loadings were converted into excess adsorption loadings to quantitatively characterize how the adsorbed layer varies across different pore sizes. The calculation basis for the excess adsorption amount is shown in Equation (3).
where is the excess adsorption loading, g; is the absolute adsorption loading, g; is the density at a certain temperature and pressure, g/m3; V is the pore volume of the adsorbent, m3.
Based on these calculations, plots of pressure versus excess adsorption were generated for different pore size (Figure 10). The excess adsorption density decreases as pore size increases under the same pressure. The pressure at which maximum adsorption occurs also increases with pore size, and the decline after the maximum account becomes more gradual, resulting in smoother isotherm curves for larger pores. This result indicates that the adsorbed-phase density decreases with increasing pore size and gradually approaches the bulk density [55]. The 0.6 nm pore size exhibits unique methane adsorption behavior, with maximum excess adsorption density lower than at 0.4 nm but higher than at 0.5 nm. In 0.4 nm and 0.5 nm pores, methane adsorbs as a single monomolecular layer. As pore size increases, added pore volume surpasses the increase in adsorbed amount, reducing excess adsorption density. At 0.6 nm, two monomolecular adsorption layers form, theoretically doubling the adsorbed amount, though spatial constraints limit this increase. Consequently, excess adsorption at 0.6 nm exceeds that at 0.5 nm but remains below that at 0.4 nm. Above 10 MPa, the bilayer configuration’s faster density increase with pressure causes the 0.6 nm pore’s excess adsorption to surpass that of the 0.4 nm pore. At 0.7 nm, adsorption isotherms align closely with those at 0.5 nm, lacking the distinctive behavior at 0.6 nm, as increased pore volume outweighs additional adsorption from the second layer.
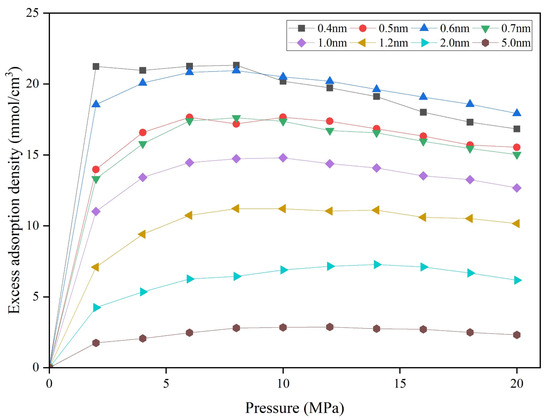
Figure 10.
Methane excess adsorption density of different pore sizes.
3.3.2. Methane Excess Adsorption Capacity Characteristic Analysis
Pore size was varied by adjusting the distance between opposing coal matrix surfaces, thereby altering the pore volume. Therefore, with the coal matrix structure held constant, the maximum excess adsorption capacity was plotted against pore size (Figure 11). Methane adsorption capacity increases with pore size up to 1.5 nm, with significant enhancements at 0.6 nm and 1 nm. As can be seen from Figure 8, when the pore size increases to 0.6 nm, two adsorption layers begin to appear. As the pore size gradually increases to 1.0 nm, a secondary adsorption layer starts to emerge. This suggests that additional adsorbed molecular layers enhance adsorption capacity [63]. In small pores, spatial confinement restricts methane to a single adsorption layer on the coal matrix, leading to a reduced excess adsorption capacity. As pore size increases, additional adsorption layers form, causing abrupt increases at 0.6 nm and 1.0 nm. Accordingly, larger pores accommodate more adsorption layers and exhibit higher adsorption capacity. However, beyond 1.2 nm, adsorption capacity gradually decreases as increased pore volume diminishes the nanoconfinement effect, weakening coal–methane interactions and reducing adsorption [64]. The nanoconfinement effect, where nanoscale pores akin to carbon nanotubes impose spatial restrictions, enhances methane mobility, alters molecular distribution and propagation, and increases adsorption [65,66]. Below 1.2 nm, nanoconfinement enhances adsorption. So excess adsorption increases with pore size within this small range. Beyond 1.2 nm, further pore enlargement weakens confinement of methane molecules, and excess adsorption decreases as pore size increases. And no further adsorption layers develop. Similarly, Figure 8 and Figure 9 show that as pore size increases, the relative density of the adsorption layer gradually converges toward the density at the pore center. And no further adsorption layers develop.
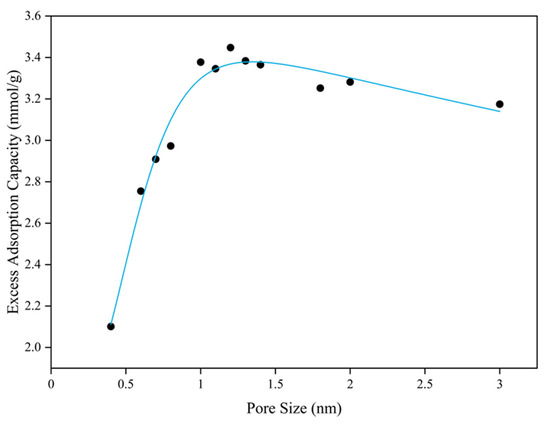
Figure 11.
Methane excess adsorption capacity for different pore sizes.
3.4. Methane Adsorption Heat Characteristic Analysis Under Different Pore Sizes
Methane adsorption heat characterizes the thermal energy released during methane molecule adsorption onto coal surfaces, reflecting the interaction intensity between methane and the coal matrix [30]. The adsorption heat of CH4 across various pore sizes and pressures is summarized in Table 7. All values remain below 42 kJ mol−1, consistent with physisorption mechanisms [67]. Under conditions of constant pore size, methane adsorption heat increases with rising pressure. As pressure continues to escalate, its impact on methane adsorption heat progressively diminishes [68]. For example, in the 0.4 nm pore, when the pressure increases from 2 MPa to 4 MPa, the heat of CH4 adsorption increases by 3.615 kJ/mol, but when the pressure increases from 18 MPa to 20 MPa, the increase is only 0.063 kJ/mol. This gradual increase is attributed not only to the interaction between methane molecules and the coal surface, but also to the interactions between previously adsorbed methane molecules, which generate intermolecular forces, perform work, and release heat [67]. Methane adsorption heat in 0.4 nm pores decreases slightly between 14 MPa and 16 MPa. A similar slight decrease occurs in 5 nm pores between 10 MPa and 12 MPa. This decrease may result from electrostatic repulsion exerted by earlier-adsorbed gas molecules on subsequently adsorbed molecules, which promotes desorption and entails an endothermic process [44].
Table 7.
Isosteric heats for different pore sizes at different pressures.
A comparative analysis of CH4 adsorption heat variations across different pore sizes reveals distinct thermodynamic behavior. The proportion of micropore increase, the higher number of effective adsorption sites increased the adsorption potential energy [69]. As pore size increases, the heat of CH4 adsorption gradually diminishes. For example, the 5 nm pore exhibits a variation of only 1.332 kJ/mol over the 2–20 MPa range, when the 0.4 nm pore shows a threefold greater change of 3.954 kJ/mol. Notably, the 0.6 nm pore deviates from this trend. The adsorption heat of methane is higher in 0.6 nm pore size than in 0.5 nm pore size (Table 7). This high value corresponds to the change in adsorption layers. As previously noted, the adsorption layer transitions from a monolayer to a bilayer at a pore size of 0.6 nm. The excess adsorption capacity also increases at this point. Consequently, the interaction between methane molecules and the adsorption layer intensifies, leading to an anomalous increase in methane adsorption heat. Comparative analysis of the isosteric heat of adsorption across different pore sizes reveals a general increasing trend with pressure in pores smaller than 2 nm, despite some fluctuations. Conversely, it decreases in a 5 nm pore. This is likely because, at higher pressures within larger pores, methane molecules find it more difficult to adsorb and are forced to occupy lower-energy sites. Since molecules occupying high-energy sites release more heat than those on low-energy sites, this site-filling sequence results in a decrease in the observed adsorption heat [70]. Additionally, adsorption is a dynamic process where desorption, an endothermic event, occurs simultaneously. Thus, the isosteric heat of adsorption decreases with increasing pressure [44].
3.5. Comparison of Methane Adsorption Across Different Coal Models
Previous studies have employed graphite-based slit shape pore models to examine methane adsorption, demonstrating that pore width alters adsorption configurations and that the stacking arrangement of graphite layers influences adsorption behavior [6,35]. In particular, zigzag graphite with Bernal stacking exhibits the highest methane adsorption energy [71]. Furthermore, graphite and kaolinite composite models were used to simulate organic–inorganic interlayer pores and study shale gas adsorption. The results show that the total adsorption capacity increases with both pressure and pore size [34]. Mosher et al. examined the excess adsorption and density profiles of methane in graphite slit pores of various widths, and proposed that graphite-based models provide a valid starting point for simulating gas adsorption in coal and shale [32]. The graphite-based models tend to overestimate methane adsorption under high-pressure conditions in molecular simulations. Similarly, adsorption simulations using the RMM overestimate experimental adsorption volumes [72]. The underlying causes of these discrepancies remain unclear. The primary distinction between the RMM and graphite models lies in the diversity of functional groups. Differences in adsorption affinity among these groups lead to distinct methane uptake characteristics [42,73].The aliphatic chain length decreases with increasing aromaticity and the methane adsorption properties of carboxyl groups are greater than those of some heteroatomic functional groups, and the methane adsorption properties of alkanes are comparatively small [40,41].And for the oxygen-containing functional groups, whereas a decrease in the oxygen-containing functional groups (C-O, C=O, and -COOH) weakens the methane adsorption capacity of the coal rock, but coals with higher oxygen surface groups are less hydrophobic, and methane adsorption capacity is superior in the more hydrophobic coal rock [42,43].
However, few studies have explored how functional group–induced variations cause differences in methane adsorption simulations between the RMM and graphite models. The model developed in this study incorporates diverse oxygen-containing and heteroatom functional groups, methyl substituents, and other moieties to reflect the coal. Methane excess adsorption isotherms for both the RMM and graphite models in 1 nm pores were determined at various temperatures and are shown in Figure 12. For both models, increasing temperature decreases methane adsorption and this effect is more pronounced in the graphite model. As temperature increases, gas molecules gain kinetic energy, increasing intermolecular distances and reducing interaction energies, which weakens the adsorption potential wells of the pore walls and converts more adsorbed gas into the free phase [49]. In the RMM, the isotherms at 298 K and 318 K differ only marginally, with some adsorption points even showing slight increases at the higher temperature. A similar trend has been observed in other RMMs, where an increase in temperature around 300 K initially promotes methane adsorption on the coal matrix. With further temperature elevation, the adsorption capacity eventually declines [74]. These results indicate that the coal model, incorporating diverse functional groups, exhibits markedly different temperature sensitivity compared to the graphite model. Therefore when the temperature and pressure are changed, the functional groups’ response mechanisms are also different [50,75,76].
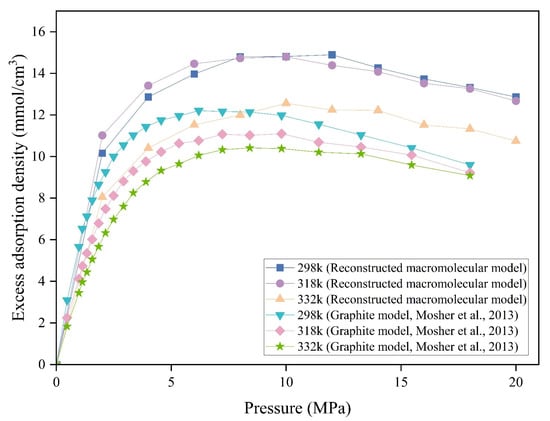
Figure 12.
Methane excess adsorption density in 1 nm pores for different models and temperatures. Graphite model, Mosher et al. [32].
The excess adsorption isotherms of both the coal model and the graphite model were compared at 298 K across various pore sizes (Figure 13). Although both models follow the same general trend, the graphite model consistently underestimates the methane adsorption capacity of coal across various pore sizes. This deviation is particularly significant at a pore size of 0.6 nm, where the underestimation reaches 34.34% (Table 8). This behavior may arise from the molecular arrangement of methane within the pore space. The previous study demonstrated that CO2 molecules form parallel adsorption layers in graphite slit pores, and methane likely adopts a similar configuration [77]. In Mosher et al.’s monolayer graphite model, the excess methane adsorption amount uptake in 0.6 nm pore size is lower than in 0.5 nm pore size [32]. By contrast, Song et al.’s ABA-stacked graphite model shows greater uptake in 0.65 nm pore size than in 0.55 nm pore size [31]. Zhang et al. further demonstrated this pore size-dependent behavior in smooth versus rough graphite models, where methane adopts a zipper-like configuration to accommodate more molecules than a linear arrangement [6]. In our RMM, differing affinities of functional groups similarly enable higher methane loading than linear packing, explaining the divergent adsorption behavior at 0.6 nm between the RMM and graphite models.
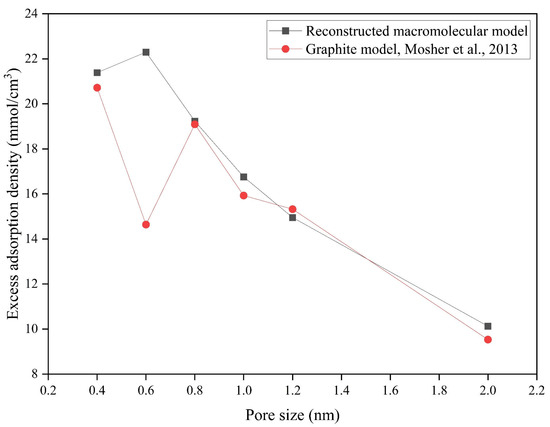
Figure 13.
Methane excess adsorption density of different model and pore sizes. Graphite model, Mosher et al. [32].
Table 8.
Methane excess adsorption density of different model and pore sizes.
4. Conclusions
This study characterized the molecular structure of coal from the Benxi Formation, Ordos Basin, using elemental analysis, 13C NMR, XPS, and FTIR experiments. Based on these molecular features, pore models derived from the coal’s macromolecular structure were constructed. Molecular simulations comprehensively investigated methane adsorption behavior across various pore sizes, focusing on adsorption isotherms, heat, and excess adsorption. Comparisons between the reconstructed macromolecular model and the graphite model elucidated differences in methane adsorption behavior. The following conclusions were drawn:
(1) The coal primarily comprises aromatic carbon, predominantly protonated, with oxygenated methylene carbon dominating the aliphatic fraction. The chemical formula (C186H125O14NS) of the studied coal was inferred through spectroscopic and elemental analyses.
(2) Absolute methane adsorption capacity increases with pore size. In pores smaller than 0.6 nm, methane forms a monolayer due to molecular diameter constraints. Larger pores enable the formation of secondary and multiple adsorption layers.
(3) Excess methane adsorption capacity increased from 0.4 nm to 1.2 nm, with a sharp increase at 0.6 nm and 1.0 nm due to additional adsorption layers. Beyond 1.2 nm, excess adsorption capacity decreased with increasing pore size.
(4) The reconstructed macromolecular model exhibits more complex methane adsorption behavior than the graphite model. Both models showed decreasing adsorption density with increasing pore size, but the graphite model underestimated methane adsorption capacity.
Author Contributions
J.C.: writing—original draft, data curation, investigation, conceptualization, methodology, software. H.L.: supervision, conceptualization. X.Y.: data curation, investigation. T.L.: data curation, investigation. Q.G.: supervision, conceptualization, writing—review and editing, methodology. All authors have read and agreed to the published version of the manuscript.
Funding
This work was supported by the National Natural Science Foundation of China (Grant No. 42202202 and 42472223). Also the project was supported by the “CUG Scholar” Scientific Research Funds at China University of Geosciences (Wuhan) (Project No. 2023056).
Data Availability Statement
The data that support the findings of this study are available from the corresponding author upon reasonable request.
Conflicts of Interest
Author Hanlin Liu was employed by the company Petro China, Research Institute of Petroleum Exploration and Development. Authors Xin Yang and Tao Lei was employed by the company China National Offshore Oil Corporation Limited. The remaining authors declare that the research was conducted in the absence of any commercial or financial relationships that could be construed as a potential conflict of interest.
References
- Han, Q.; Deng, C.; Jin, Z.; Gao, T. Molecular Simulation of the Adsorption Characteristics of Methane in Pores of Coal with Different Metamorphic Degrees. Molecules 2021, 26, 7217. [Google Scholar] [CrossRef] [PubMed]
- Guo, Q.; Fink, R.; Littke, R.; Zieger, L. Methane Sorption Behaviour of Coals Altered by Igneous Intrusion, South Sumatra Basin. Int. J. Coal Geol. 2019, 214, 103250. [Google Scholar] [CrossRef]
- Qiu, F.; Liu, D.; Cai, Y.; Liu, N.; Qiu, Y. Methane Adsorption Interpreting with Adsorption Potential and Its Controlling Factors in Various Rank Coals. Processes 2020, 8, 390. [Google Scholar] [CrossRef]
- Shi, Y.; He, Y.; Wan, J.; Sun, J.; Zeng, J.; Cui, R. The Primary Controlling Factors of the Occurrence State of Deep High-Rank Coalbed Methane in Eastern Ordos Basin. Front. Earth Sci. 2024, 12, 1340523. [Google Scholar] [CrossRef]
- Tan, X.; Ma, X.; Li, X.; Li, Y. An Adsorption Model Considering Fictitious Stress. Fractal Fract. 2025, 9, 17. [Google Scholar] [CrossRef]
- Zhang, D.; Tang, H.; Zhang, X.; Ranjith, P.G.; Perera, M.S.A. Molecular Simulation of Methane Adsorption in Nanoscale Rough Slits. J. Nat. Gas Sci. Eng. 2022, 102, 104608. [Google Scholar] [CrossRef]
- Ding, C.; Li, Z.; Hu, D.; Miao, C.; Lu, B.; Gao, D. Construction of Macromolecular Model and Analysis of Oxygen Absorption Characteristics of Hongyang No. 2 Coal Mine. Arab. J. Chem. 2023, 16, 104662. [Google Scholar] [CrossRef]
- Ni, X.; Zhang, J.; Xu, X.; Wang, B. Molecular Structure Characterization of Middle-High Rank Coal via 13C NMR, XPS, and FTIR Spectroscopy. China Geol. 2024, 7, 702–713. [Google Scholar] [CrossRef]
- Nie, B.; Zhu, X.; Liu, P.; Zhao, D.; Liu, X.; Deng, B.; Lun, J.; Wang, M.; Qin, F. Novel Insights into Gas Sorption Mechanisms in Multiscale Coal Nanopores via Molecular Simulation. Energy Fuels 2025, 39, 9373–9387. [Google Scholar] [CrossRef]
- Hu, H.; Li, X.; Fang, Z.; Wei, N.; Li, Q. Small-Molecule Gas Sorption and Diffusion in Coal: Molecular Simulation. Energy 2010, 35, 2939–2944. [Google Scholar] [CrossRef]
- Su, X.; Li, N.; Li, L.; Tuerhong, R.; Yu, Y.; Zhang, P.; Su, Q.; Shen, T.; Sun, M.; Ma, X. Structural Parameters and Molecular Model of Shendong Subbituminous Coal. Chin. J. Chem. Eng. 2024, 76, 124–134. [Google Scholar] [CrossRef]
- Wang, Y.; Liu, D.; Cai, Y.; Li, X. Variation of Petrophysical Properties and Adsorption Capacity in Different Rank Coals: An Experimental Study of Coals from the Junggar, Ordos and Qinshui Basins in China. Energies 2019, 12, 986. [Google Scholar] [CrossRef]
- Nie, B.; Liu, X.; Yang, L.; Meng, J.; Li, X. Pore Structure Characterization of Different Rank Coals Using Gas Adsorption and Scanning Electron Microscopy. Fuel 2015, 158, 908–917. [Google Scholar] [CrossRef]
- Chen, C.; Sun, J.; Zhang, Y.; Mu, J.; Li, W.; Song, Y. Adsorption Characteristics of CH4 and CO2 in Organic-Inorganic Slit Pores. Fuel 2020, 265, 116969. [Google Scholar] [CrossRef]
- Wang, L.; Liu, M.; Li, J.; Sun, Y.; Lv, B.; Ma, X.; Zhou, M.; Zhang, J. Investigation of Methane Adsorption Mechanism in Low-Rank Bituminous Coal Considering Internal Water Distribution: A Molecular Simulation and Experimental Study. Chem. Eng. J. 2024, 495, 153562. [Google Scholar] [CrossRef]
- Teng, T.; Chen, Y.; Wang, Y.; Qiao, X. In Situ Nuclear Magnetic Resonance Observation of Pore Fractures and Permeability Evolution in Rock and Coal under Triaxial Compression. J. Energy Eng. 2025, 151, 4025036. [Google Scholar] [CrossRef]
- Cao, Z.; Xiong, Y.; Xue, Y.; Du, F.; Li, Z.; Huang, C.; Wang, S.; Yu, Y.; Wang, W.; Zhai, M.; et al. Diffusion Evolution Rules of Grouting Slurry in Mining-Induced Cracks in Overlying Strata. Rock Mech. Rock Eng. 2025, 58, 6493–6512. [Google Scholar] [CrossRef]
- Wang, L.; Zhu, L.; Cao, Z.; Liu, J.; Xue, Y.; Wang, P.; Cao, X.; Liu, Y. Thermo-Mechanical Degradation and Fracture Evolution in Low-Permeability Coal Subjected to Cyclic Heating–Cryogenic Cooling. Phys. Fluids 2025, 37, 086617. [Google Scholar] [CrossRef]
- Zhang, L.; Ren, T.; Aziz, N. Influences of Temperature and Moisture on Coal Sorption Characteristics of a Bituminous Coal from the Sydney Basin, Australia. IJOGCT 2014, 8, 62. [Google Scholar] [CrossRef]
- Zhang, L.; Yan, D.; Yang, S.; Mangi, H.N.; Fu, H.; Wang, G.; Yang, X.; Zhang, B.; Li, T.; Liang, W.; et al. Effects of Sequence Stratigraphy on Coal Characteristics and CH4 Adsorption Capacity of the Low-Rank Coal in Santanghu Basin, China. J. Nat. Gas Sci. Eng. 2020, 81, 103467. [Google Scholar] [CrossRef]
- Zhao, Y.; Han, C.; Sun, Y.; Gao, Y.; Qiao, H.; Tai, Z. Impact of Fractal Features on Gas Adsorption and Desorption Capacities and Ad-/Desorption Hysteresis in Coals Based on Synchrotron Radiation SAXS. Front. Earth Sci. 2022, 10, 824348. [Google Scholar] [CrossRef]
- Cheng, X.; Cheng, Y.; Hu, B.; He, X. Quantitative Analysis of Difference in CH4 and CO2 Adsorption Capacity in Coal Based on Adsorption Model. J. Nat. Gas Sci. Eng. 2022, 102, 104541. [Google Scholar] [CrossRef]
- Zhao, J.; Tang, D.; Qin, Y.; Xu, H.; Liu, Y.; Wu, H. Characteristics of Methane (CH4) Diffusion in Coal and Its Influencing Factors in the Qinshui and Ordos Basins. Energy Fuels 2018, 32, 1196–1205. [Google Scholar] [CrossRef]
- Kumar, H.; Mishra, M.K.; Mishra, S. Sorption Capacity of Indian Coal and Its Variation with Rank Parameters. J. Pet. Explor. Prod. Technol. 2019, 9, 2175–2184. [Google Scholar] [CrossRef]
- Kiani, A.; Sakurovs, R.; Grigore, M.; Sokolova, A. Gas Sorption Capacity, Gas Sorption Rates and Nanoporosity in Coals. Int. J. Coal Geol. 2018, 200, 77–86. [Google Scholar] [CrossRef]
- Zhang, S.; Tang, S.; Li, Z.; Liu, B.; Wang, R. Effect of Pore Structure on Competitive Sorption and Diffusion of Mixed Methane and Carbon Dioxide in Anthracite, South Qinshui Basin, China. Int. J. Coal Geol. 2022, 253, 103956. [Google Scholar] [CrossRef]
- Karacan, C.O.; Okandan, E. Adsorption and Gas Transport in Coal Microstructure: Investigation and Evaluation by Quantitative X-Ray CT Imaging. Fuel 2001, 80, 509–520. [Google Scholar] [CrossRef]
- Li, S.-G.; Bai, Y.; Lin, H.-F.; Shu, C.-M.; Yan, M.; Laiwang, B. Molecular Simulation of Adsorption of Gas in Coal Slit Model under the Action of Liquid Nitrogen. Fuel 2019, 255, 115775. [Google Scholar] [CrossRef]
- Li, Y.; Yang, Z.; Ju, X.; Zhou, A. Adsorption and Diffusion Behavior of CH4 and CO2 in Closed and Open Pores from Zhaozhuang Coal. Energy Fuels 2022, 36, 2582–2590. [Google Scholar] [CrossRef]
- Liu, S.; Li, X.; Cai, J.; Xie, H.; Chen, S. Investigation of the Impact of Micro-Nano Pore Geometry on CH4 Adsorption. Chem. Eng. J. 2024, 500, 157162. [Google Scholar] [CrossRef]
- Song, W.; Yao, J.; Ma, J.; Li, A.; Li, Y.; Sun, H.; Zhang, L. Grand Canonical Monte Carlo Simulations of Pore Structure Influence on Methane Adsorption in Micro-Porous Carbons with Applications to Coal and Shale Systems. Fuel 2018, 215, 196–203. [Google Scholar] [CrossRef]
- Mosher, K.; He, J.; Liu, Y.; Rupp, E.; Wilcox, J. Molecular Simulation of Methane Adsorption in Micro- and Mesoporous Carbons with Applications to Coal and Gas Shale Systems. Int. J. Coal Geol. 2013, 109–110, 36–44. [Google Scholar] [CrossRef]
- Cui, C.; Wang, D.; Zhang, L.; Yang, M. Molecular Simulation on the Desorption and Extraction of Methane in the Slits with Varying Surface Activity. Chem. Phys. 2023, 572, 111975. [Google Scholar] [CrossRef]
- Chen, J.; Jiang, F.; Cong, Q.; Pang, X.; Ma, K.; Shi, K.; Pang, B.; Chen, D.; Pang, H.; Yang, X.; et al. Adsorption Characteristics of Shale Gas in Organic–Inorganic Slit Pores. Energy 2023, 278, 127788. [Google Scholar] [CrossRef]
- Lin, K.; Yuan, Q.; Zhao, Y.-P. Using Graphene to Simplify the Adsorption of Methane on Shale in MD Simulations. Comput. Mater. Sci. 2017, 133, 99–107. [Google Scholar] [CrossRef]
- Liu, Y.; Zhu, Y.; Li, W.; Xiang, J.; Wang, Y.; Li, J.; Zeng, F. Molecular Simulation of Methane Adsorption in Shale Based on Grand Canonical Monte Carlo Method and Pore Size Distribution. J. Nat. Gas Sci. Eng. 2016, 30, 119–126. [Google Scholar] [CrossRef]
- Song, Y.; Jiang, B.; Wei, C.; Dai, X.; Quan, F.; Hou, C.; Cheng, G. A Review on the Application of Molecular Dynamics to the Study of Coalbed Methane Geology. Front. Earth Sci. 2021, 9, 775497. [Google Scholar] [CrossRef]
- Liu, J.; Wu, J.; Zhu, J.; Wang, Z.; Zhou, J.; Cen, K. Removal of Oxygen Functional Groups in Lignite by Hydrothermal Dewatering: An Experimental and DFT Study. Fuel 2016, 178, 85–92. [Google Scholar] [CrossRef]
- Huang, J.; Zhai, C.; Sun, Y.; Lai, Y.; Xu, H.; Huang, T.; Wang, Y.; Li, Y.; Xu, J. Microscopic Scale Influence of Functional Groups on the Displacement Behavior of Coalbed Methane by Hot Humid Flue Gas: A Molecular Simulation Study Based on the Dynamic Injection Process. Gas Sci. Eng. 2024, 131, 205477. [Google Scholar] [CrossRef]
- Fu, X.; Lun, Z.; Zhao, C.; Zhou, X.; Wang, H.; Zhou, X.; Xu, Y.; Zhang, H.; Zhang, D. Influences of Controlled Microwave Field Irradiation on Physicochemical Property and Methane Adsorption and Desorption Capability of Coals: Implications for Coalbed Methane (CBM) Production. Fuel 2021, 301, 121022. [Google Scholar] [CrossRef]
- Chen, Y.; Mastalerz, M.; Schimmelmann, A. Characterization of Chemical Functional Groups in Macerals across Different Coal Ranks via Micro-FTIR Spectroscopy. Int. J. Coal Geol. 2012, 104, 22–33. [Google Scholar] [CrossRef]
- Hao, S.; Wen, J.; Yu, X.; Chu, W. Effect of the Surface Oxygen Groups on Methane Adsorption on Coals. Appl. Surf. Sci. 2013, 264, 433–442. [Google Scholar] [CrossRef]
- Bastos-Neto, M.; Canabrava, D.V.; Torres, A.E.B.; Rodriguez-Castellón, E.; Jiménez-López, A.; Azevedo, D.C.S.; Cavalcante, C.L. Effects of Textural and Surface Characteristics of Microporous Activated Carbons on the Methane Adsorption Capacity at High Pressures. Appl. Surf. Sci. 2007, 253, 5721–5725. [Google Scholar] [CrossRef]
- Li, J.; Ge, S.; Liu, S. Differential Adsorption of H2S/CH4 by Bituminous Coal and Its Competitive Adsorption Properties. Chem. Eng. J. 2024, 500, 157447. [Google Scholar] [CrossRef]
- Jia, T.; Zhang, S.; Tang, S.; Xin, D.; Zhang, S.; Wang, B.; Zhang, Q.; Zhang, K.; Lin, D.; Yang, W. Density and Volume of Adsorbed Methane in Key Applications for In-Situ Gas Content: Insights from Molecular Simulation. Chem. Eng. J. 2024, 490, 151809. [Google Scholar] [CrossRef]
- Yang, Q.; Xue, J.; Lin, H.; Jin, Z. Two-Way Coupling Dynamics of CH4 Adsorption and Coal Matrix Deformation: Insights from Hybrid GCMC/MD Simulations. Chem. Eng. J. 2024, 498, 155321. [Google Scholar] [CrossRef]
- Han, Q.; Deng, C.; Gao, T.; Jin, Z.; Zhang, H. Construction of Different Metamorphic Degree Coal Models and Corresponding Adsorption Characteristics Based on Molecular Simulation. J. Mol. Struct. 2023, 1274, 134517. [Google Scholar] [CrossRef]
- Pan, J.; Jiao, F.; Wang, K.; Li, Y.; Song, D.; Hou, Q. Molecular Simulations of the Effects of CO2 and N2 Injection on CH4 Adsorption, Coal Porosity and Permeability. Adv. Geo-Energy Res. 2024, 12, 205–222. [Google Scholar] [CrossRef]
- Zou, Y.; Chen, M.; Kang, Y.; You, L.; Li, P.; Chen, X.; Zhang, F. Molecular Simulation Insights into Methane-Water Adsorption and Transport Mechanisms in Deep Shale Multiscale Nanoslits under High-Temperature and High-Pressure Conditions. Fuel 2025, 396, 135267. [Google Scholar] [CrossRef]
- Wang, Z.; Zhang, S.; Zhang, X.; Cheng, J.; Lu, W.; Bai, E.; You, Z. Thermodynamic Characteristics of CH4/CO2 Adsorption in Different Rank Coals and Its Molecular Mechanism. Langmuir 2025, 41, 5419–5438. [Google Scholar] [CrossRef]
- Burnaz, L.; Zieger, L.; Schmatz, J.; Botero, A.E.; Amberg, S.; Thüns, N.; Littke, R. Preparation Techniques for Microscopic Observation of Dispersed Organic Matter and Their Effect on Vitrinite Reflectance. Int. J. Coal Geol. 2023, 272, 104249. [Google Scholar] [CrossRef]
- Wang, Q.; Zhang, J.; Li, H.; Zhang, H.; Bai, H.; Guo, Q. Exploring Molecular Structure Characteristics and Chemical Index of Qinghua Bituminous Coal: A Comprehensive Insight from Single Molecule of Macerals to Particles with Various Sizes. Powder Technol. 2022, 396, 36–49. [Google Scholar] [CrossRef]
- Zhang, S.; Zhang, C.; Zhang, M.; Liu, X.; Xue, S. Model Construction and Optimization of Coal Molecular Structure. J. Mol. Struct. 2023, 1290, 135960. [Google Scholar] [CrossRef]
- Zhu, B.; Dong, X.; Fan, Y.; Ma, X.; Yao, S.; Fu, Y.; Chen, R.; Chang, M. Structural Characterization and Molecular Model Construction of High-Ash Coal from Northern China. Molecules 2023, 28, 5593. [Google Scholar] [CrossRef] [PubMed]
- Wang, H.; Xiang, J.; Deng, X.; Gao, W. Molecular Simulation of the Adsorption and Diffusion Properties of CH4 and CO2 in the Microporous System of Coal. Fuel 2024, 360, 130566. [Google Scholar] [CrossRef]
- Alam, M.d.S.; Jeong, J.H. MD Simulation Estimation of Saturation Pressure and Vapor-Liquid Equilibrium for Binary Blends of HFO-1234yf and HFO-1123. Int. J. Air-Cond. Refrig. 2022, 30, 9. [Google Scholar] [CrossRef]
- Zhang, S.; Wang, Z.; Zhang, X.; Wei, J.; Chen, F. Construction of Molecular Structure Model of Tunlan Coal and Its Microscopic Physicochemical Mechanism. Fuel 2022, 308, 121936. [Google Scholar] [CrossRef]
- Takanohashi, T.; Nakamura, K.; Terao, Y.; Iino, M. Computer Simulation of Solvent Swelling of Coal Molecules: Effect of Different Solvents. Energy Fuels 2000, 14, 393–399. [Google Scholar] [CrossRef]
- Hu, F.; Han, F.; Wu, K.; Liu, M.; Niu, G.; Xue, D.; Wang, H. Construction and Optimization of Liuzhuang Coal Molecular Model for Wettability Mechanism Analysis. Fuel 2026, 404, 136187. [Google Scholar] [CrossRef]
- Ghasemzadeh, H.; Babaei, S.; Tesson, S.; Azamat, J.; Ostadhassan, M. From Excess to Absolute Adsorption Isotherm: The Effect of the Adsorbed Density. Chem. Eng. J. 2021, 425, 131495. [Google Scholar] [CrossRef]
- Qiu, T.; Hu, S.; Zhang, J. Application of the Material Balance Equation Based on the BET Multimolecular Fractal Theory in a Shale Gas Reservoir. Front. Energy Res. 2022, 10, 829800. [Google Scholar] [CrossRef]
- Brunauer, S.; Deming, L.S.; Deming, W.E.; Teller, E. On a Theory of the van Der Waals Adsorption of Gases. J. Am. Chem. Soc. 1940, 62, 1723–1732. [Google Scholar] [CrossRef]
- Liu, S.; Wang, H.; Sang, S.; Liu, T.; Zheng, S. Effects of Pore Structure Changes on the CH4 Adsorption Capacity of Coal during CO2-ECBM. Fuel 2022, 330, 125529. [Google Scholar] [CrossRef]
- Yang, L.; Zhou, X.; Zhang, K.; Zeng, F.; Wang, Z. Investigation of Dynamical Properties of Methane in Slit-like Quartz Pores Using Molecular Simulation. RSC Adv. 2018, 8, 33798–33816. [Google Scholar] [CrossRef] [PubMed]
- Pan, X.; Bao, X. The Effects of Confinement inside Carbon Nanotubes on Catalysis. Acc. Chem. Res. 2011, 44, 553–562. [Google Scholar] [CrossRef]
- Guan, J.; Pan, X.; Liu, X.; Bao, X. Syngas Segregation Induced by Confinement in Carbon Nanotubes: A Combined First-Principles and Monte Carlo Study. J. Phys. Chem. C 2009, 113, 21687–21692. [Google Scholar] [CrossRef]
- Zhang, M.; Gong, Z.; Tan, Z.; Liu, H.; Yang, M. Study on Heat Adsorption Based on the Experiment of Coal Adsorption of Methane by Using the Weight Method. J. Nat. Gas Geosci. 2021, 6, 245–253. [Google Scholar] [CrossRef]
- Xiang, J.; Zeng, F.; Liang, H.; Li, B.; Song, X. Molecular Simulation of the CH4/CO2/H2O Adsorption onto the Molecular Structure of Coal. Sci. China Earth Sci. 2014, 57, 1749–1759. [Google Scholar] [CrossRef]
- Gao, C.; Liu, D.; Vandeginste, V.; Cai, Y.; Sun, F. Thermodynamic Energy Change and Occurrence Mechanism of Multiple Fluids in Coal Reservoirs. Energy 2023, 283, 129089. [Google Scholar] [CrossRef]
- Hao, M.; Wei, C.; Zhang, H. Adsorption and Diffusion of Methane in Coal Slit Pores: Insights into the Molecular Level. Energy Fuels 2022, 36, 880–886. [Google Scholar] [CrossRef]
- Yang, N.; Yang, D.; Zhang, G.; Chen, L.; Liu, D.; Cai, M.; Fan, X. The Effects of Graphene Stacking on the Performance of Methane Sensor: A First-Principles Study on the Adsorption, Band Gap and Doping of Graphene. Sensors 2018, 18, 422. [Google Scholar] [CrossRef] [PubMed]
- Liu, Y.; Hao, C.; Wang, Z.; Xie, J.; Zhao, W.; Meng, F.; Han, Y. Micropore Distribution and Methane Adsorption Process and Mechanism in Bituminous Coals: A Molecular Dynamics Simulation Study. J. Environ. Chem. Eng. 2024, 12, 112139. [Google Scholar] [CrossRef]
- Wang, J.; Hu, S.; Yang, T.; Chen, X.; Li, W.; Wang, T. Mechanistic Study of Carbon Dioxide Sequestration Technology Using Molecular Simulations to Assess the Adsorption of Methane and Carbon Dioxide by Different Functional Groups. Appl. Surf. Sci. 2024, 677, 161058. [Google Scholar] [CrossRef]
- Zhao, D.; Ke, X.; Huang, M.; He, W.; Tong, M.; Chen, B.; Du, Q. The Study on the Adsorption Characteristics of Anthracite under Different Temperature and Pressure Conditions. PLoS ONE 2025, 20, e0310863. [Google Scholar] [CrossRef]
- Song, Y.; Jiang, B.; Lan, F. Competitive Adsorption of CO2/N2/CH4 onto Coal Vitrinite Macromolecular: Effects of Electrostatic Interactions and Oxygen Functionalities. Fuel 2019, 235, 23–38. [Google Scholar] [CrossRef]
- Dang, Y.; Zhao, L.; Lu, X.; Xu, J.; Sang, P.; Guo, S.; Zhu, H.; Guo, W. Molecular Simulation of CO2/CH4 Adsorption in Brown Coal: Effect of Oxygen-, Nitrogen-, and Sulfur-Containing Functional Groups. Appl. Surf. Sci. 2017, 423, 33–42. [Google Scholar] [CrossRef]
- Liu, Y.; Wilcox, J. Molecular Simulation of CO2 Adsorption in Micro- and Mesoporous Carbons with Surface Heterogeneity. Int. J. Coal Geol. 2012, 104, 83–95. [Google Scholar] [CrossRef]
Disclaimer/Publisher’s Note: The statements, opinions and data contained in all publications are solely those of the individual author(s) and contributor(s) and not of MDPI and/or the editor(s). MDPI and/or the editor(s) disclaim responsibility for any injury to people or property resulting from any ideas, methods, instructions or products referred to in the content. |
© 2025 by the authors. Licensee MDPI, Basel, Switzerland. This article is an open access article distributed under the terms and conditions of the Creative Commons Attribution (CC BY) license (https://creativecommons.org/licenses/by/4.0/).