Article

Effects of Operating Parameters on Combustion Characteristics of Hydrogen-Doped Natural Gas

1
State Power Investment Corporation Research Institute Co., Ltd. (SPICRI), Beijing 102209, China
2
Shanxi Research Institute for Clean Energy, Tsinghua University, Taiyuan 030082, China
3
Inner Mongolia Huomei Hongjun Aluminum and Electric Co., Ltd. Zhahanaoer Branch, Tongliao 029100, China
*
Author to whom correspondence should be addressed.
These authors contributed equally to this work and should be considered co-first authors.
Processes 2025, 13(11), 3477; https://doi.org/10.3390/pr13113477
Submission received: 10 September 2025 / Revised: 18 October 2025 / Accepted: 21 October 2025 / Published: 29 October 2025
(This article belongs to the Section Chemical Processes and Systems)

Abstract

The operational optimization of industrial boilers utilizing hydrogen-enriched natural gas is constrained by two critical gaps: insufficient understanding of the coupled effects of hydrogen blending ratio, equivalence ratio, and boiler load on combustion performance—compounded by unresolved challenges of combustion instability, flashback, and elevated NOx emissions—and a lack of systematic investigations combining these parameters in industrial-scale systems (prior studies often focus on single variables like hydrogen fraction). To address this, a comprehensive computational fluid dynamics (CFD) analysis was conducted on a 2.1 MW industrial boiler, employing the Steady Laminar Flamelet Model (SLFM) with a modified k-ε turbulence model and the GRI-Mech 3.0 mechanism. Simulations covered hydrogen fractions (f(H2) = 0–25%), equivalence ratios (Φ = 0.8–1.2), and load conditions (15–100%). All NOx emissions reported herein are normalized to 3.5% O2 (mg/Nm3) for regulatory comparison. Results show that increasing the hydrogen content raises the flame temperature and NOx emissions while reducing CO and unburned hydrocarbons; a higher equivalence ratio elevates temperature and NOx, with Φ = 0.8 balancing efficiency and emission control; and reducing load significantly lowers furnace temperature and NO emissions. Notably, the boiler’s unique staged-combustion configuration (81% fuel supply to the central rich-combustion nozzle, 19% to the concentric lean-combustion nozzle) was found to mitigate NOx formation by 15–20% compared to single-inlet burner designs, and its integrated cyclone blades (generating maximum swirling velocity of 14.2 m/s at full load) enhanced fuel–air mixing, which became particularly critical for maintaining combustion stability at low loads (≤20%) and high hydrogen blending ratios (≥20%). This study provides quantitative trade-off insights between combustion efficiency and pollutant formation, offering actionable guidance for the safe, efficient operation of hydrogen-enriched natural gas in industrial boilers.

1. Introduction

The decarbonization of industrial energy systems has positioned hydrogen-blended natural gas as a pivotal transitional fuel. However, its deployment in existing boiler infrastructure faces significant challenges related to combustion stability, safety, and elevated nitrogen oxide (NOx) emissions. Industrial-scale incidents underscore these risks: hydrogen must be manipulated in safe and reliable circumstances that will restrict equipment contact with H2 and satisfy certain conditions to avoid leaks, ignition, and possible explosion [1]. Meanwhile, the combustion of CH4 and H2 mixtures demonstrated an increase in H2 proportion correlated with an increase in NO emissions [2]. These findings demonstrate the urgent need for optimized combustion strategies, as well as a critical disconnect between laboratory-scale research and industrial operational demands.
Current research on hydrogen–methane combustion in boilers exhibits limitations that hinder direct industrial translation. While numerous studies have investigated the hydrogen-blending ratio, they often neglect its interaction with other critical operational parameters and the boiler-specific design characteristics that dictate real-world performance. For instance, Huang et al. [3] investigated the effect of different equivalence ratio (Φ) variations, from 0.6 to 0.8, on pure methane combustion through calculations and experiments without considering hydrogen addition. Cheng et al. [4] analyzed the combustion characteristics of hydrogen-doped natural gas in industrial boilers by conducting single-variable experiments under varying hydrogen doping ratios and excess air coefficients; however, they neglected the synergistic effects between these parameters and load. Zhang et al. [5] analyzed the effect of hydrogen blending ratios on the chemical kinetics of CH4-air mixtures using CHEMKIN software, with hydrogen blending ratios ranging from 0 to 25%. This oversight of hydrogen fraction-Φ-load coupling effects and boiler-specific design influences represents a critical knowledge gap, as industrial boilers frequently operate under dynamic conditions with 15–100% load fluctuations and variable fuel compositions.
Accurate prediction of turbulent combustion in H2/CH4 mixtures requires careful model selection that accounts for hydrogen’s distinctive properties and the boiler-specific flow and mixing characteristics. The probability density function (PDF) transport model, while theoretically advantageous for capturing turbulence-chemistry interactions, exhibits significant limitations when applied to hydrogen-enriched fuels. This shortcoming stems primarily from the model’s inherent equal-diffusivity assumption, which can lead to substantial inaccuracies—such as those observed in NOx predictions [6]. In contrast, the modified k-ε turbulence model has demonstrated superior performance for industrial-scale applications and temperature fields-outperforming RNG k-ε (9–11% error) and Reynolds stress models (10–13% error) while maintaining computational efficiency (1200 core-hours versus 2400 core-hours for LES) [7,8,9].
For chemical kinetics and turbulence–chemistry coupling models, selection was guided by industrial relevance, validation rigor, and compatibility with the boiler’s operational parameters. For chemical kinetics and turbulence–chemistry coupling models, selection was guided by industrial relevance and validation rigor and compatibility with the boiler’s operational parameters. The steady laminar flamelet model (SLFM) [10] was adopted based on its proven accuracy in 2.1 MW CH4/H2 boiler simulations, demonstrating errors below 7% for temperature and 9% for species concentration. However, its quasi-steady state assumption leads to measurable limitations: in transient conditions with load fluctuations exceeding 20%, SLFM predictions of flame front position deviate by over 15% from experimental data [10]. For chemical kinetics, while modern mechanisms like HyChem [11] and AramcoMech 2.0 [12] offer improved accuracy for hydrogen combustion, this study employs GRI-Mech 3.0 to maintain direct comparability with approximately 80% of prior industrial boiler studies [4,13]. We explicitly recognize this as a limitation and plan subsequent validation with HyChem in future work.
The validated modeling framework enables systematic analysis of NOx formation mechanisms, which exhibit complex dependencies on operational parameters and boiler-specific design features. Thermal–NOx, governed by the Zeldovich mechanism via core reactions (1) N2 + O ↔ NO + N and (2) N + O2 ↔ NO + O, [14], increases significantly with hydrogen addition due to elevated flame temperatures, showing a 2.3-fold increase in the formation rate as the hydrogen fraction rises from 0 to 25% at Φ = 1.0. In contrast, prompt NOx production decreases by 25–30% at 25% hydrogen blending, attributed to a 40% reduction in CH radical concentration, which limits fuel-N conversion [15]. The N2O-intermediate pathway, involving reactions N2 + OH ↔ N2O + H and N2O + O ↔ 2NO, demonstrates particular relevance under lean, low-temperature conditions: it accounts for 35% of total NOx at Φ = 0.8 and 15% load but less than 10% at Φ = 1.0 and full load. These pathway-specific trends emphasize the necessity of multi-parameter analysis for accurate NOx prediction.
Global research initiatives highlight the industrial imperative for understanding such parameter-coupling effects. While these large-scale demonstration projects validate the technical feasibility of hydrogen blending (up to 30%, H2), they lack the systematic parametric analysis needed for operational optimization across diverse conditions [16]. Notably, material–hydrogen interactions, such as hydrogen embrittlement, though critical for long-term equipment durability, require multi-physics simulations integrating solid mechanics and combustion kinetics, which will be addressed in future works [17]. Thermoacoustic instability and flame oscillations, meanwhile, become significant only at hydrogen fractions exceeding 30% [18], placing them beyond the scope of this study’s 0–25% blending range—relevant to near-term industrial implementation.
This study addresses these research gaps through the first comprehensive CFD investigation of coupled hydrogen blending ratio (0–25%), equivalence ratio (0.8–1.2), and load (15–100%) effects in a 2.1 MW industrial boiler. The primary novelty lies in: (1) establishing quantitative relationships between multiple operational parameters and NOx formation pathways in an industrially relevant geometry; (2) providing validated data for operational optimization under low-load conditions critical for peak shaving; and (3) developing a modeling framework that balances computational accuracy with practical applicability for industrial boiler design. Furthermore, the analysis specifically accounts for the boiler’s staged-combustion burner design, linking its flow and mixing characteristics to the observed global performance and emission trends. This work advances beyond prior CFD studies by capturing parameter-coupling effects that directly impact compliance with stringent emission standards operational safety.

2. Modeling and Numerical Methods

2.1. Physical Model and Computational Domain

This study investigates a YY(Q)W-2000Y(Q) organic heat carrier boiler (Hebei Yineng Boiler Co., Ltd., Cangzhou, Hebei, China) with a rated thermal input of 2.1 MW. To balance computational accuracy and efficiency, the computational domain was simplified to its core cylindrical combustion chamber (diameter: 1200 mm, height: 4980 mm). The downstream convective tube bundle was excluded, as its flue gas temperature remains below 600 K, exerting a negligible influence on combustion processes and pollutant formation.
The burner employs a staged combustion design: a central nozzle (Fuel-inlet 1, flow area: 923.628 mm2) for rich combustion and a concentric secondary nozzle (Fuel-inlet 2, flow area: 1017.876 mm2) for lean combustion (Table 1). Fuel is distributed based on the effective flow area, with 81% and 19% of the total fuel supplied to Fuel-inlet 1 and Fuel-inlet 2, respectively. This configuration has been demonstrated to reduce NOx emissions by 15–20% compared to single-inlet designs [19,20]. Cyclone blades integrated at the air inlet generate a swirling flow (maximum velocity: 14.2 m/s at 100% load) to enhance mixing (Figure 1).

2.2. Numerical Methods, Model Validation, and Reliability

All simulations were conducted using the commercial CFD software ANSYS Fluent 2023 R1. A quantitative comparison of turbulence models was performed to justify the selection of the modified k-ε model, addressing its limitations for capturing detailed turbulent flame dynamics. The comparison, based on data from literature [8,9] (Table 2), is summarized below:
While the modified k-ε model cannot capture transient phenomena (e.g., flame flickering) due to the Boussinesq isotropic assumption—which may underestimate turbulent mixing in high-swirl regions—it was selected for this study because it provides an optimal balance between accuracy and computational feasibility for steady-state parametric analysis. Given the scope of 90 simulation cases, employing LES would be computationally prohibitive (90 cases × 2400 core-hours = 216,000 core-hours), whereas the modified k-ε model (90 × 1200 = 108,000 core-hours) remains practical while delivering acceptable accuracy for the comparative analysis intended [8,9]. The modified constant Cε1 = 1.6 in the turbulent k-ε model was determined through sensitivity analysis. A well-established detailed reaction mechanism, GRI-Mech 3.0, was adopted for chemical kinetics modeling, encompassing 325 elementary reactions and 53 chemical species [21].

2.3. Boundary Conditions and Numerical Setup

The fuel and air inlets were defined as velocity inlets, and the outlet was set as a pressure outlet. Walls were modeled using a constant temperature boundary condition. Pressure–velocity coupling was handled using the SIMPLE algorithm, and pressure interpolation using the PRESTO! Scheme. The momentum and energy equations were discretized using a first-order upwind scheme, while all other equations employed a second-order upwind scheme, balancing stability and accuracy. The convergence criteria for all equations were set to residual values below 10−6 for energy and below 10−5 for other variables, ensuring numerical accuracy.
To comprehensively investigate the coupled effects of hydrogen-blending ratio, equivalence ratio, and load, multiple operating conditions were systematically simulated, as detailed in Table 3. Table 3 summarizes key boundary conditions, including air flow rates and inlet velocities, for different loads (100%, 80%, 50%, 20%, 15%), equivalence ratios (Φ = 0.8, 1.0, 1.2), and hydrogen-blending ratios (f(H2) = 0–25%). The hydrogen-blending ratio f(H2) at 300 K and 1 atm is defined as follows:
f H 2 = V ( H 2 ) V H 2 + V ( C H 4 )
where V(H2) is the volume flow rate of hydrogen (m3/h); V(CH4) is the volume flow rate of methane (m3/h); and f(H2) is the hydrogen-doping ratio of natural gas (0~0.25). The fuel fractions under different f(H2) conditions are summarized in Table 4.

2.4. Meshing and Grid Independence Study

Unstructured polyhedral meshes were generated using Fluent Meshing. Local refinement was applied to critical regions like the burner to accurately resolve flow and combustion details (Figure 2). The minimum orthogonal quality of the mesh was better than 0.15, and the maximum skewness was below 0.7.
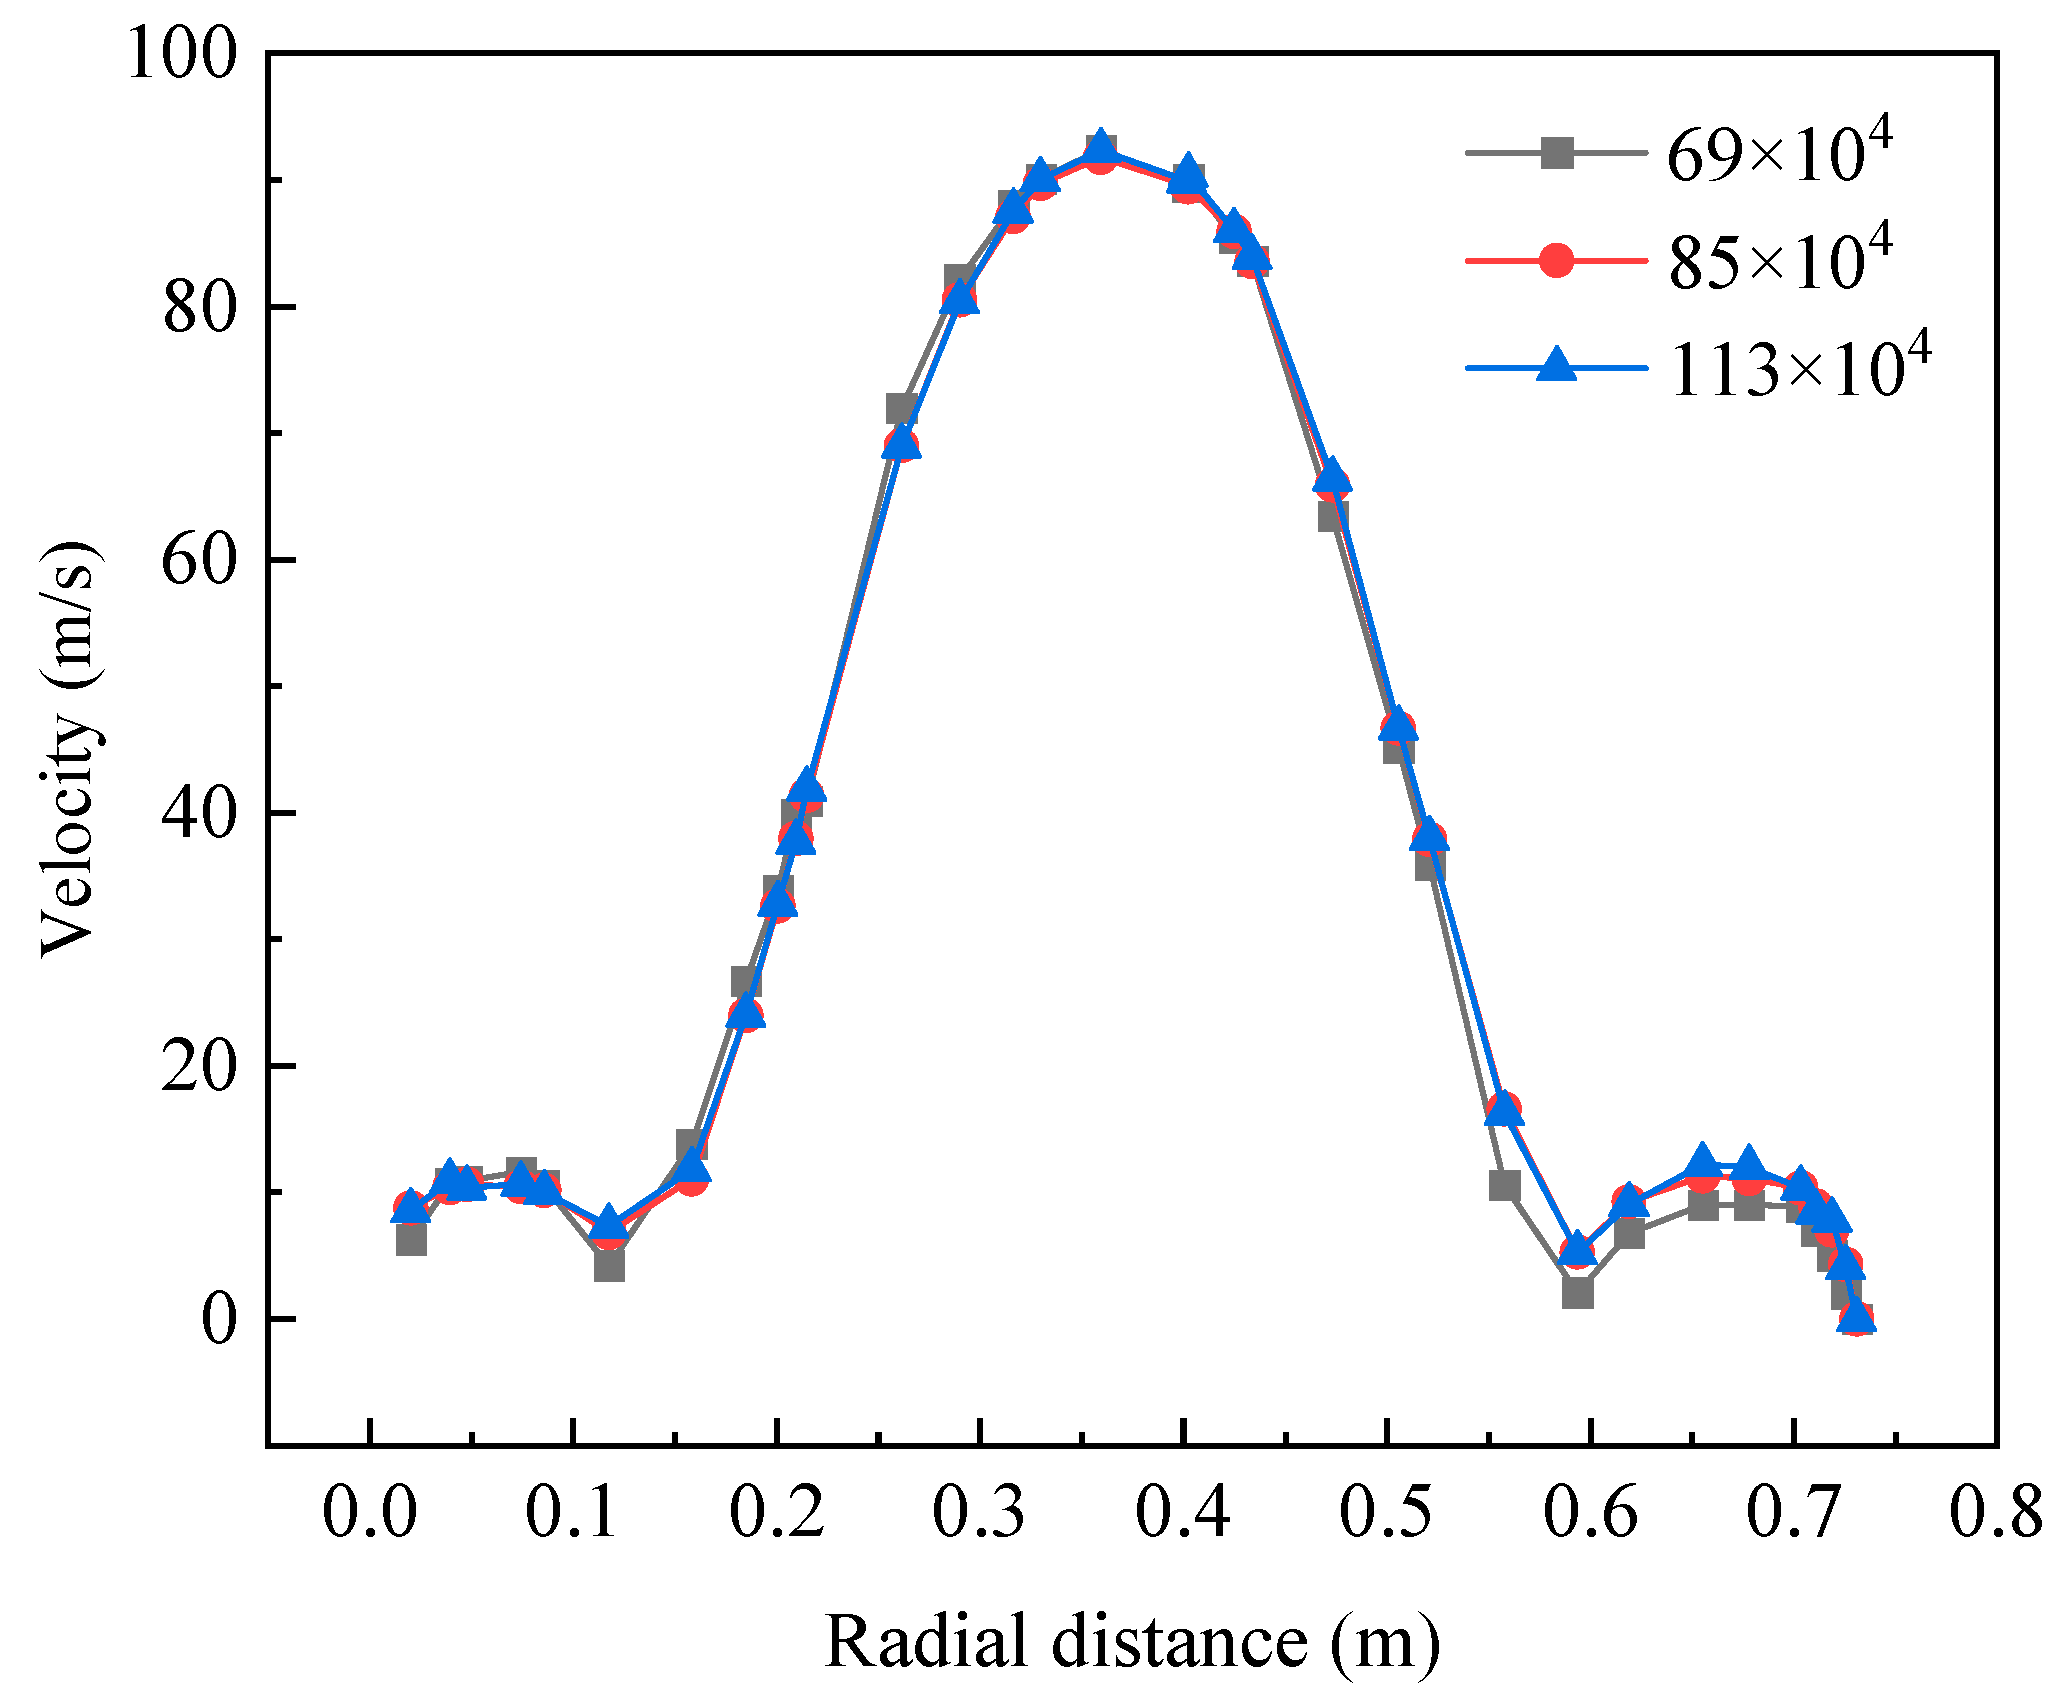
A grid independence study was conducted using three mesh densities (0.69 million, 0.85 million, and 1.13 million cells) to quantify and minimize numerical uncertainties associated with grid resolution. Grid dependency was assessed by comparing radial velocity profiles at an axial position of z = 500 mm (Figure 3) and key parameters like peak temperature.
Quantitative analysis revealed excellent agreement between the medium (0.85 million cells) and fine (1.13 million cells) grids. The maximum relative velocity error between them was less than 2% (Table 5), and the peak temperature difference was below 1.0%. These errors fall within the acceptable tolerance for this study. Consequently, the grid configuration with 0.85 million cells was selected for all subsequent simulations, ensuring computational accuracy while maintaining efficiency.

2.5. Data Processing and Analysis

2.5.1. Data Acquisition and Pre-Processing

Raw simulation data (temperature, species mole fractions, velocity) were extracted from 100 uniformly distributed sampling points within the combustion chamber (5 axial positions, 20 radial positions). To improve the data quality, a Gaussian filter (σ = 0.05 m) was applied to remove high-frequency numerical fluctuations, and outliers were excluded using the Grubbs test (α = 0.05) [22].

2.5.2. Calculation of Key Results

Key quantitative results were derived from the simulation data using specific calculation methods. The peak temperature was determined as the maximum value recorded within the entire combustion chamber, while the average temperature at the outlet was obtained by computing the area-weighted average across the furnace outlet cross-section. For pollutant emissions, NOx and CO levels were quantified as area-weighted average mole fractions at the outlet section. To eliminate the effect of excess air, the NOx mole fractions were converted to mass concentration under a reference oxygen content of 3.5% (mg/Nm3, dry basis) [23].

2.5.3. Repeatability and Computational Conditions

To ensure repeatability, three independent simulations were performed for the benchmark condition (100% load, Φ = 0.8, f(H2) = 20%). The coefficient of variation (CV) for all key parameters (temperature, NOx, and CO) was less than 2%, meeting repeatability requirements. All simulations were performed on a workstation equipped with 120 Intel Xeon Gold 6348 cores and 512 GB RAM. The average computational time per case was approximately 20 h (until convergence criteria were met).

3. Simulation Results and Analysis

3.1. Effect of the Hydrogen-Doping Ratio on the Combustion Process of the Burner

The load levels selected for this study (15–100%) are based on actual operational data from industrial boilers, covering peak production, normal operation, partial load, and the minimum stable load for this boiler type. This study limits the range to 0–25% to reflect current natural gas infrastructure compatibility constraints and near-term industrial implementation targets.
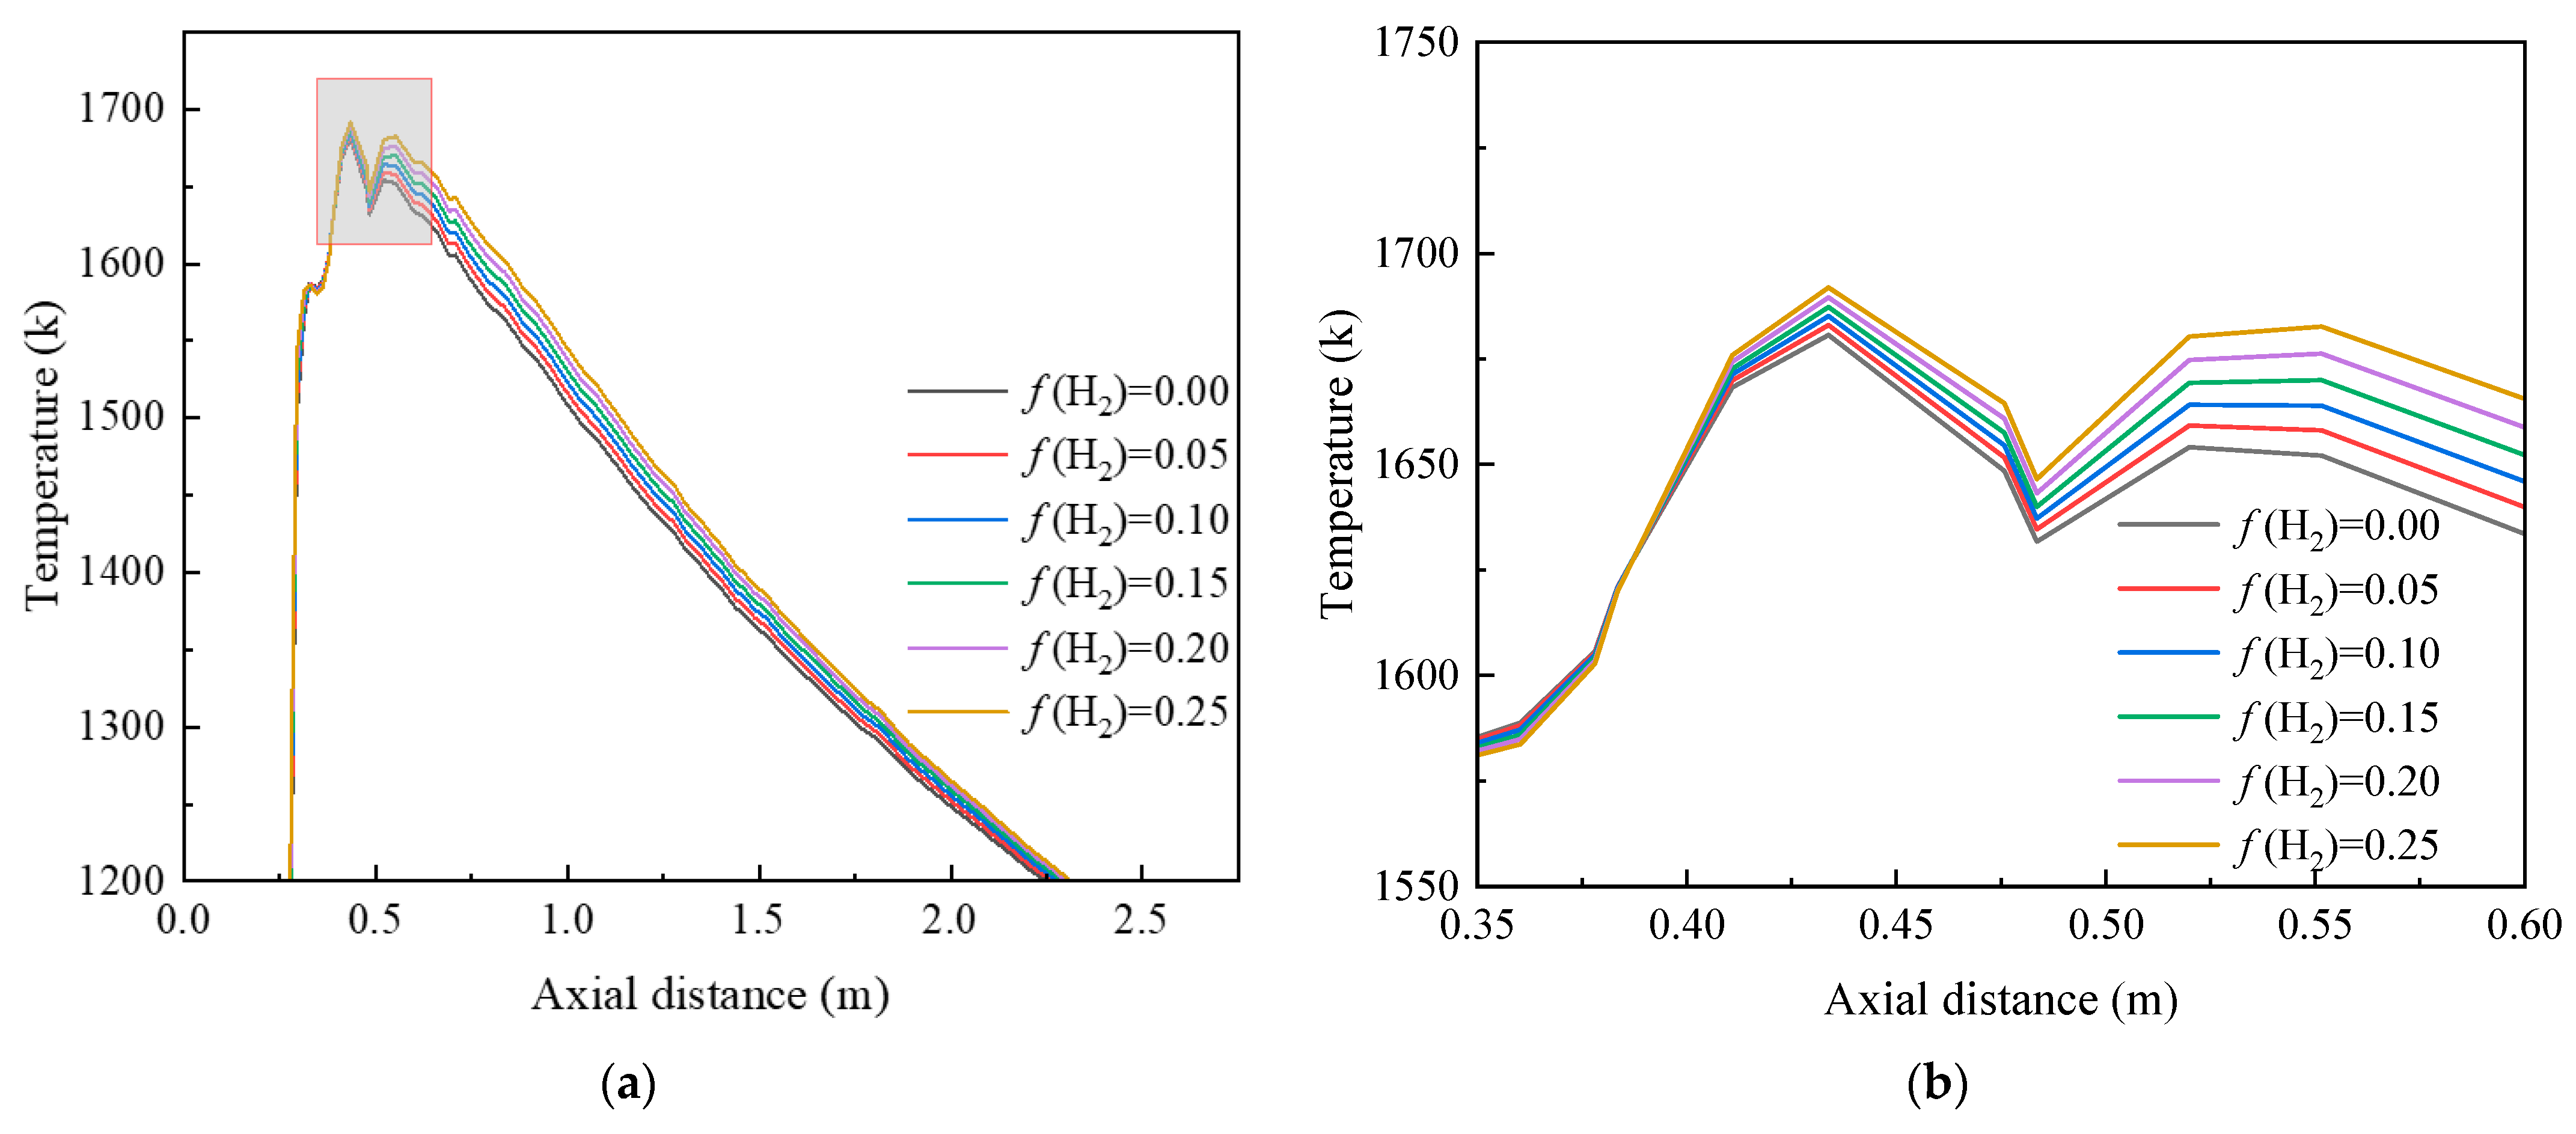
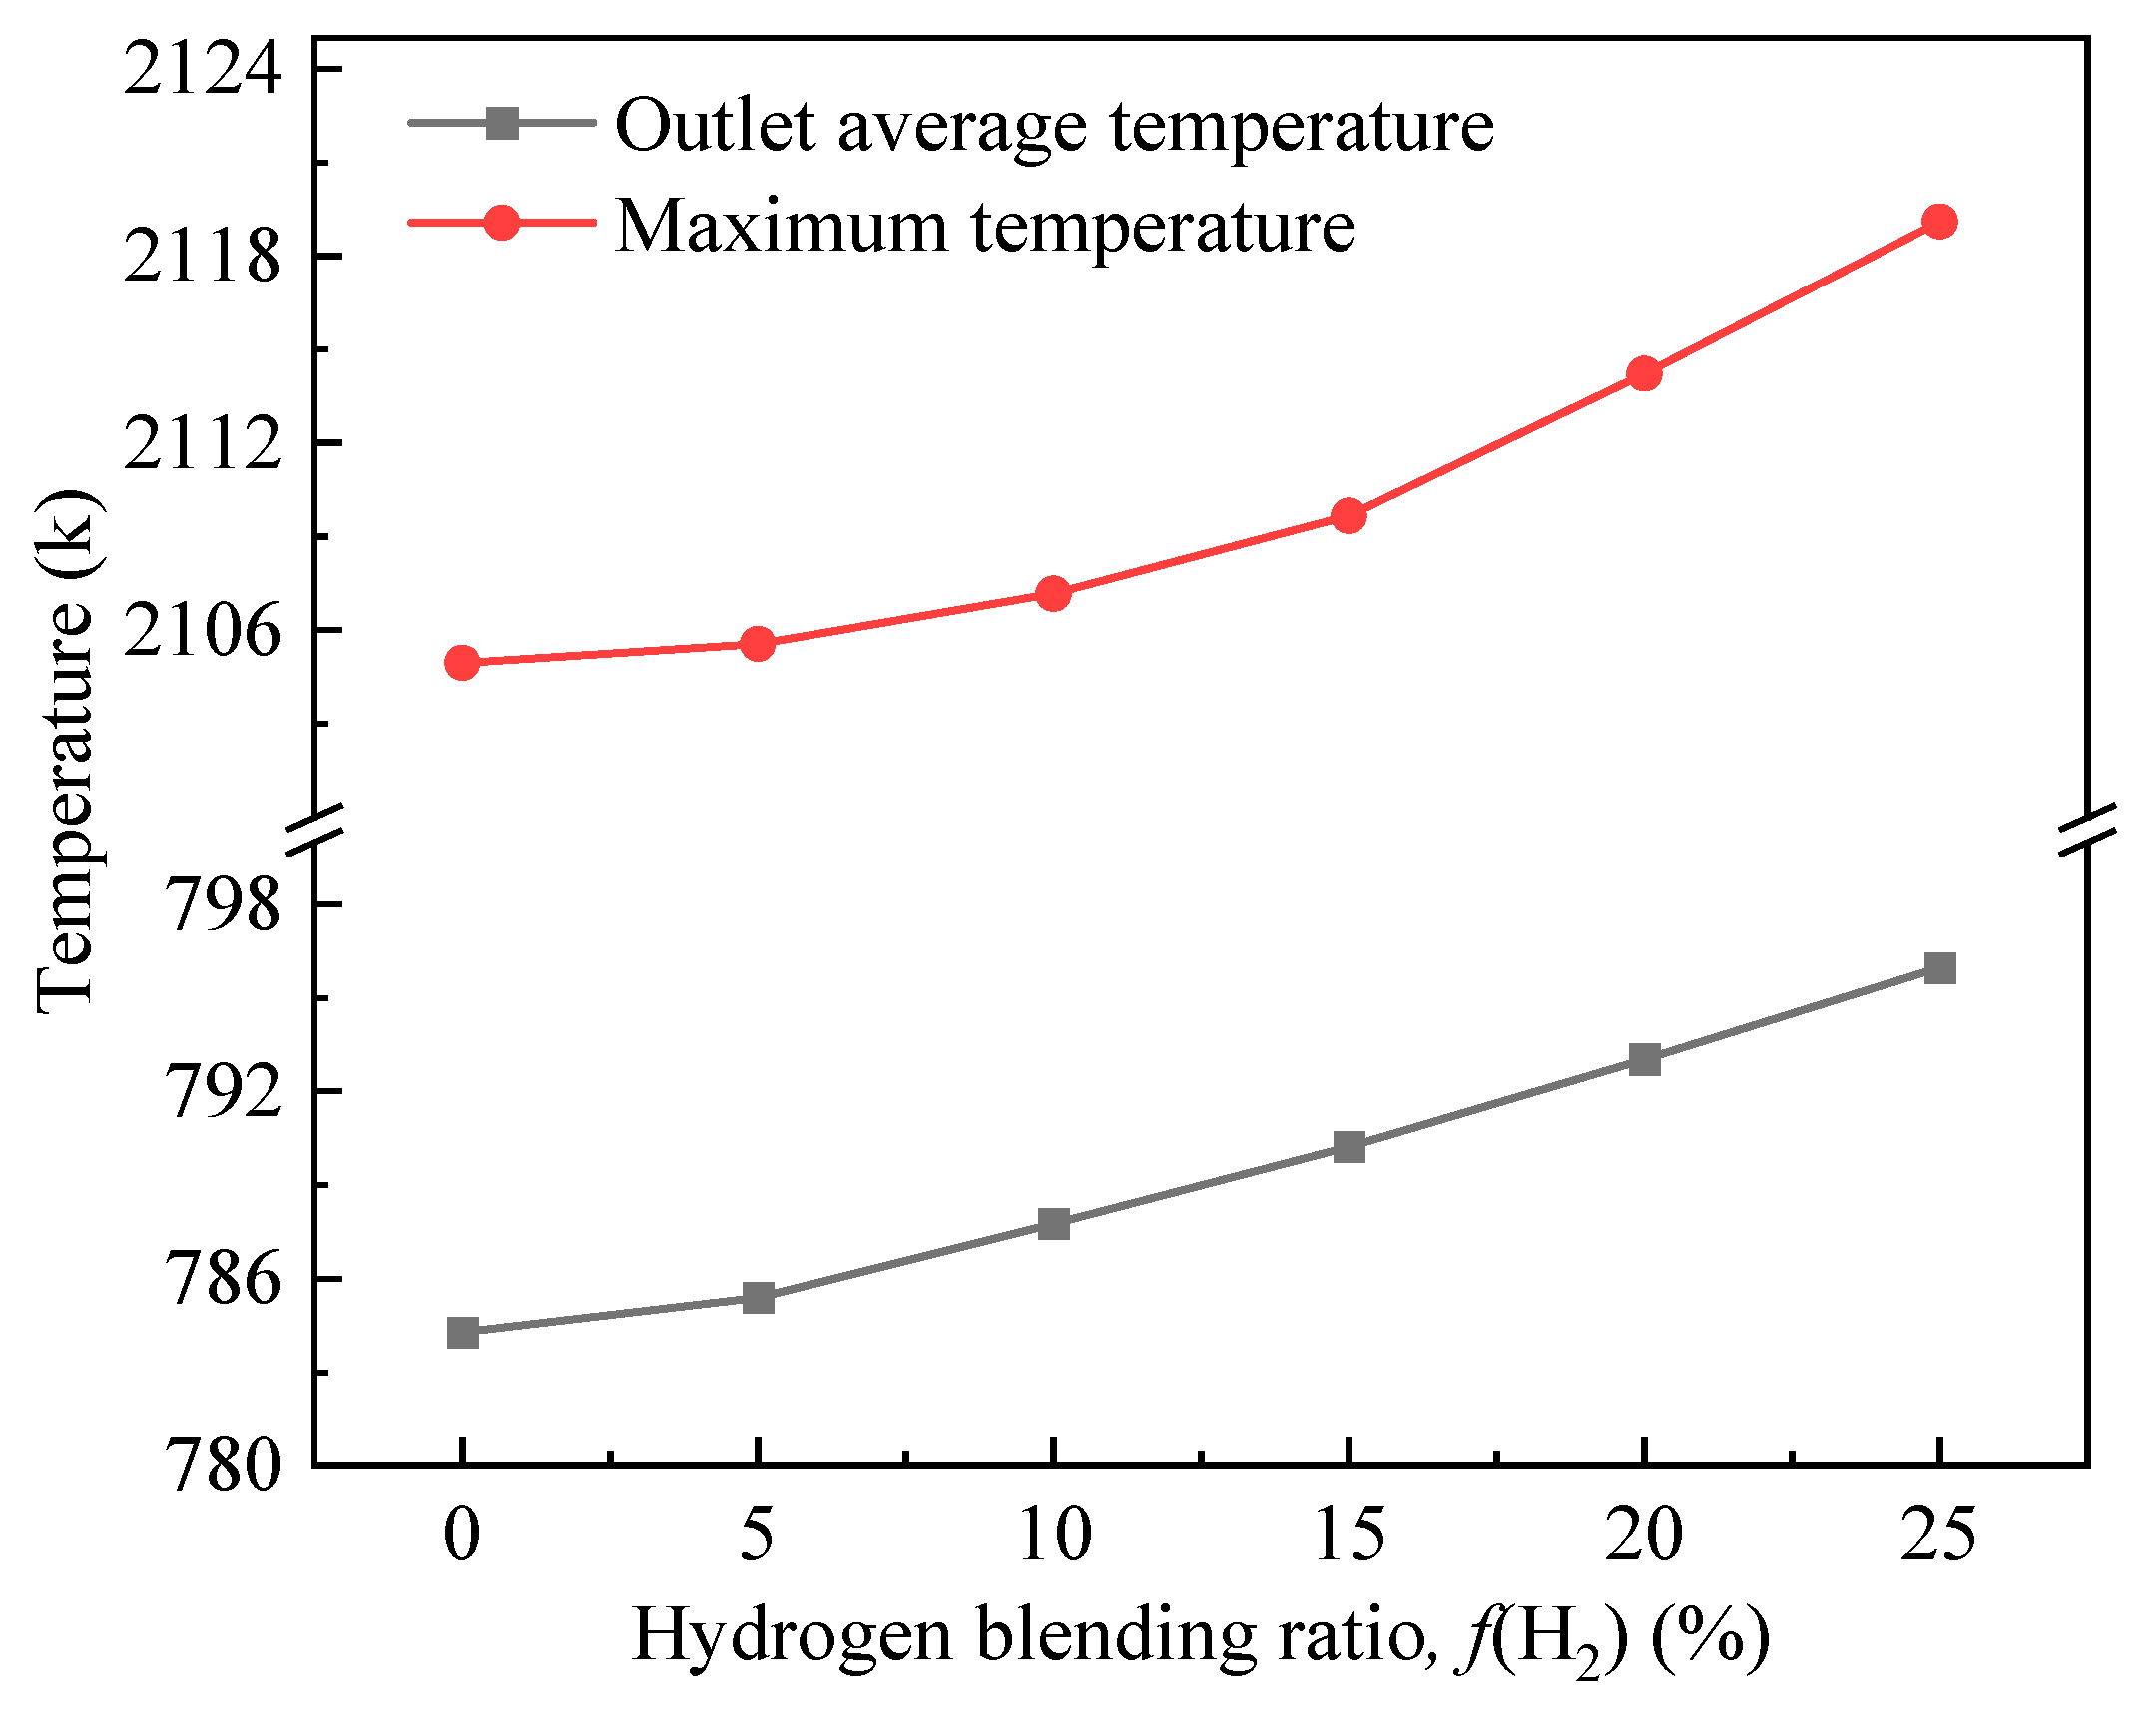
Temperature is a critical parameter characterizing combustion reactions and directly affects pollutant concentrations. Consistent with the conclusions in the literature [19,24], as the hydrogen-blending ratio increases from 0 to 25%, the maximum temperature and the average outlet temperature increase approximately linearly, with the maximum combustion temperature rising by approximately 20 K (Figure 4 and Figure 5, Table A1). This trend is attributed to hydrogen’s higher adiabatic flame temperature and laminar flame speed compared to methane, leading to increased local flame temperature and a more compact flame structure [25,26].
From a combustion chemistry perspective, hydrogen addition not only increases temperature but also influences pollutant formation by altering the radical pool. The CO concentration initially increases, then decreases, and finally stabilizes along the furnace axis (Figure 6), with the peak concentration decreasing by over 30% as the hydrogen-blending ratio increases. This phenomenon can be explained by key reaction pathways: HCO + H ↔ H2 + CO and OH + CO ↔ H + CO2. Hydrogen addition increases the OH radical concentration, promoting CO consumption by enhancing the CO oxidation pathway while simultaneously reducing the conversion rate of CH4-derived intermediates (e.g., HCO) to CO.
The axial variation trend in NO concentration is consistent with the literature [24], showing an increase with higher hydrogen blending ratios (Figure 7), with peak concentration rising by approximately 15%. This is primarily due to enhanced thermal-NO formation (Zeldovich mechanism: N2 + O ↔ N + NO) promoted by the increased flame temperature. Although hydrogen addition suppresses the prompt-NO route (CH + N2 ↔ HCN + N), the thermal-NO pathway prevails within the temperature range investigated in this study. When normalized to 3.5% O2, the NOx emissions at the furnace outlet increase from approximately 43 to 53 mg/Nm3 as f(H2) increases from 0 to 25% at Φ = 0.8 and full load.

3.2. Effect of Equivalence Ratio on Burner Combustion Processes

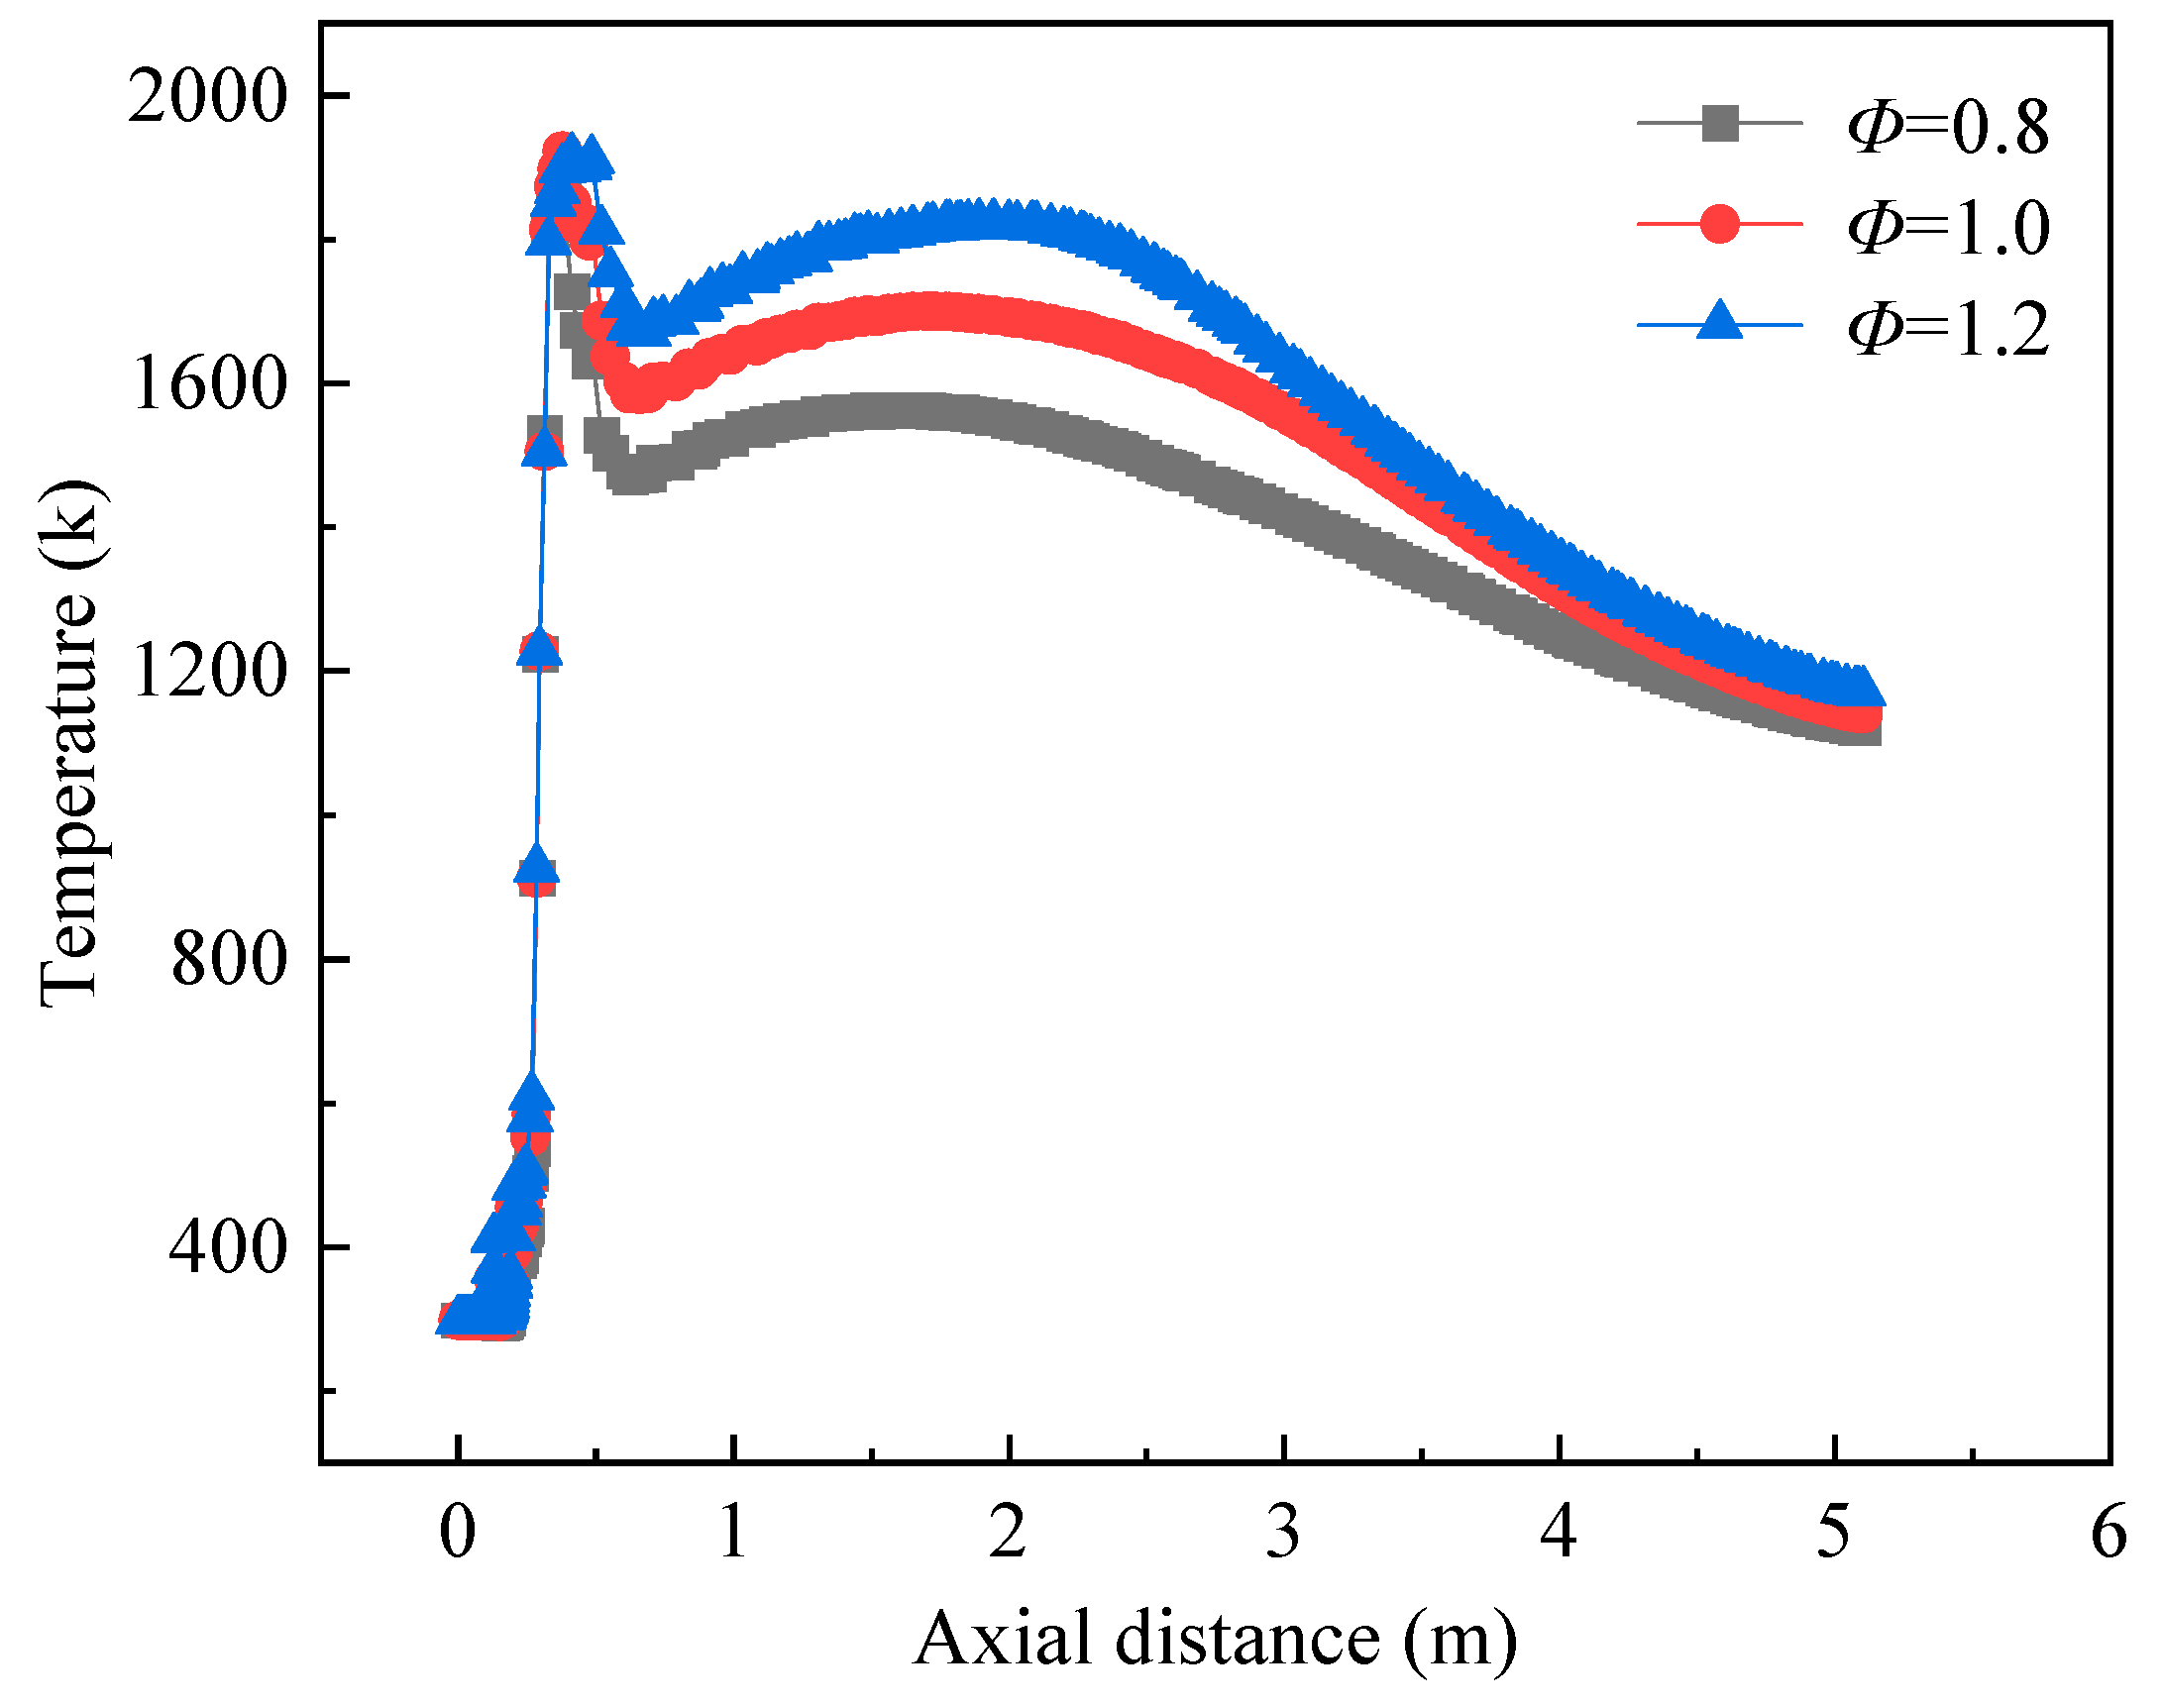
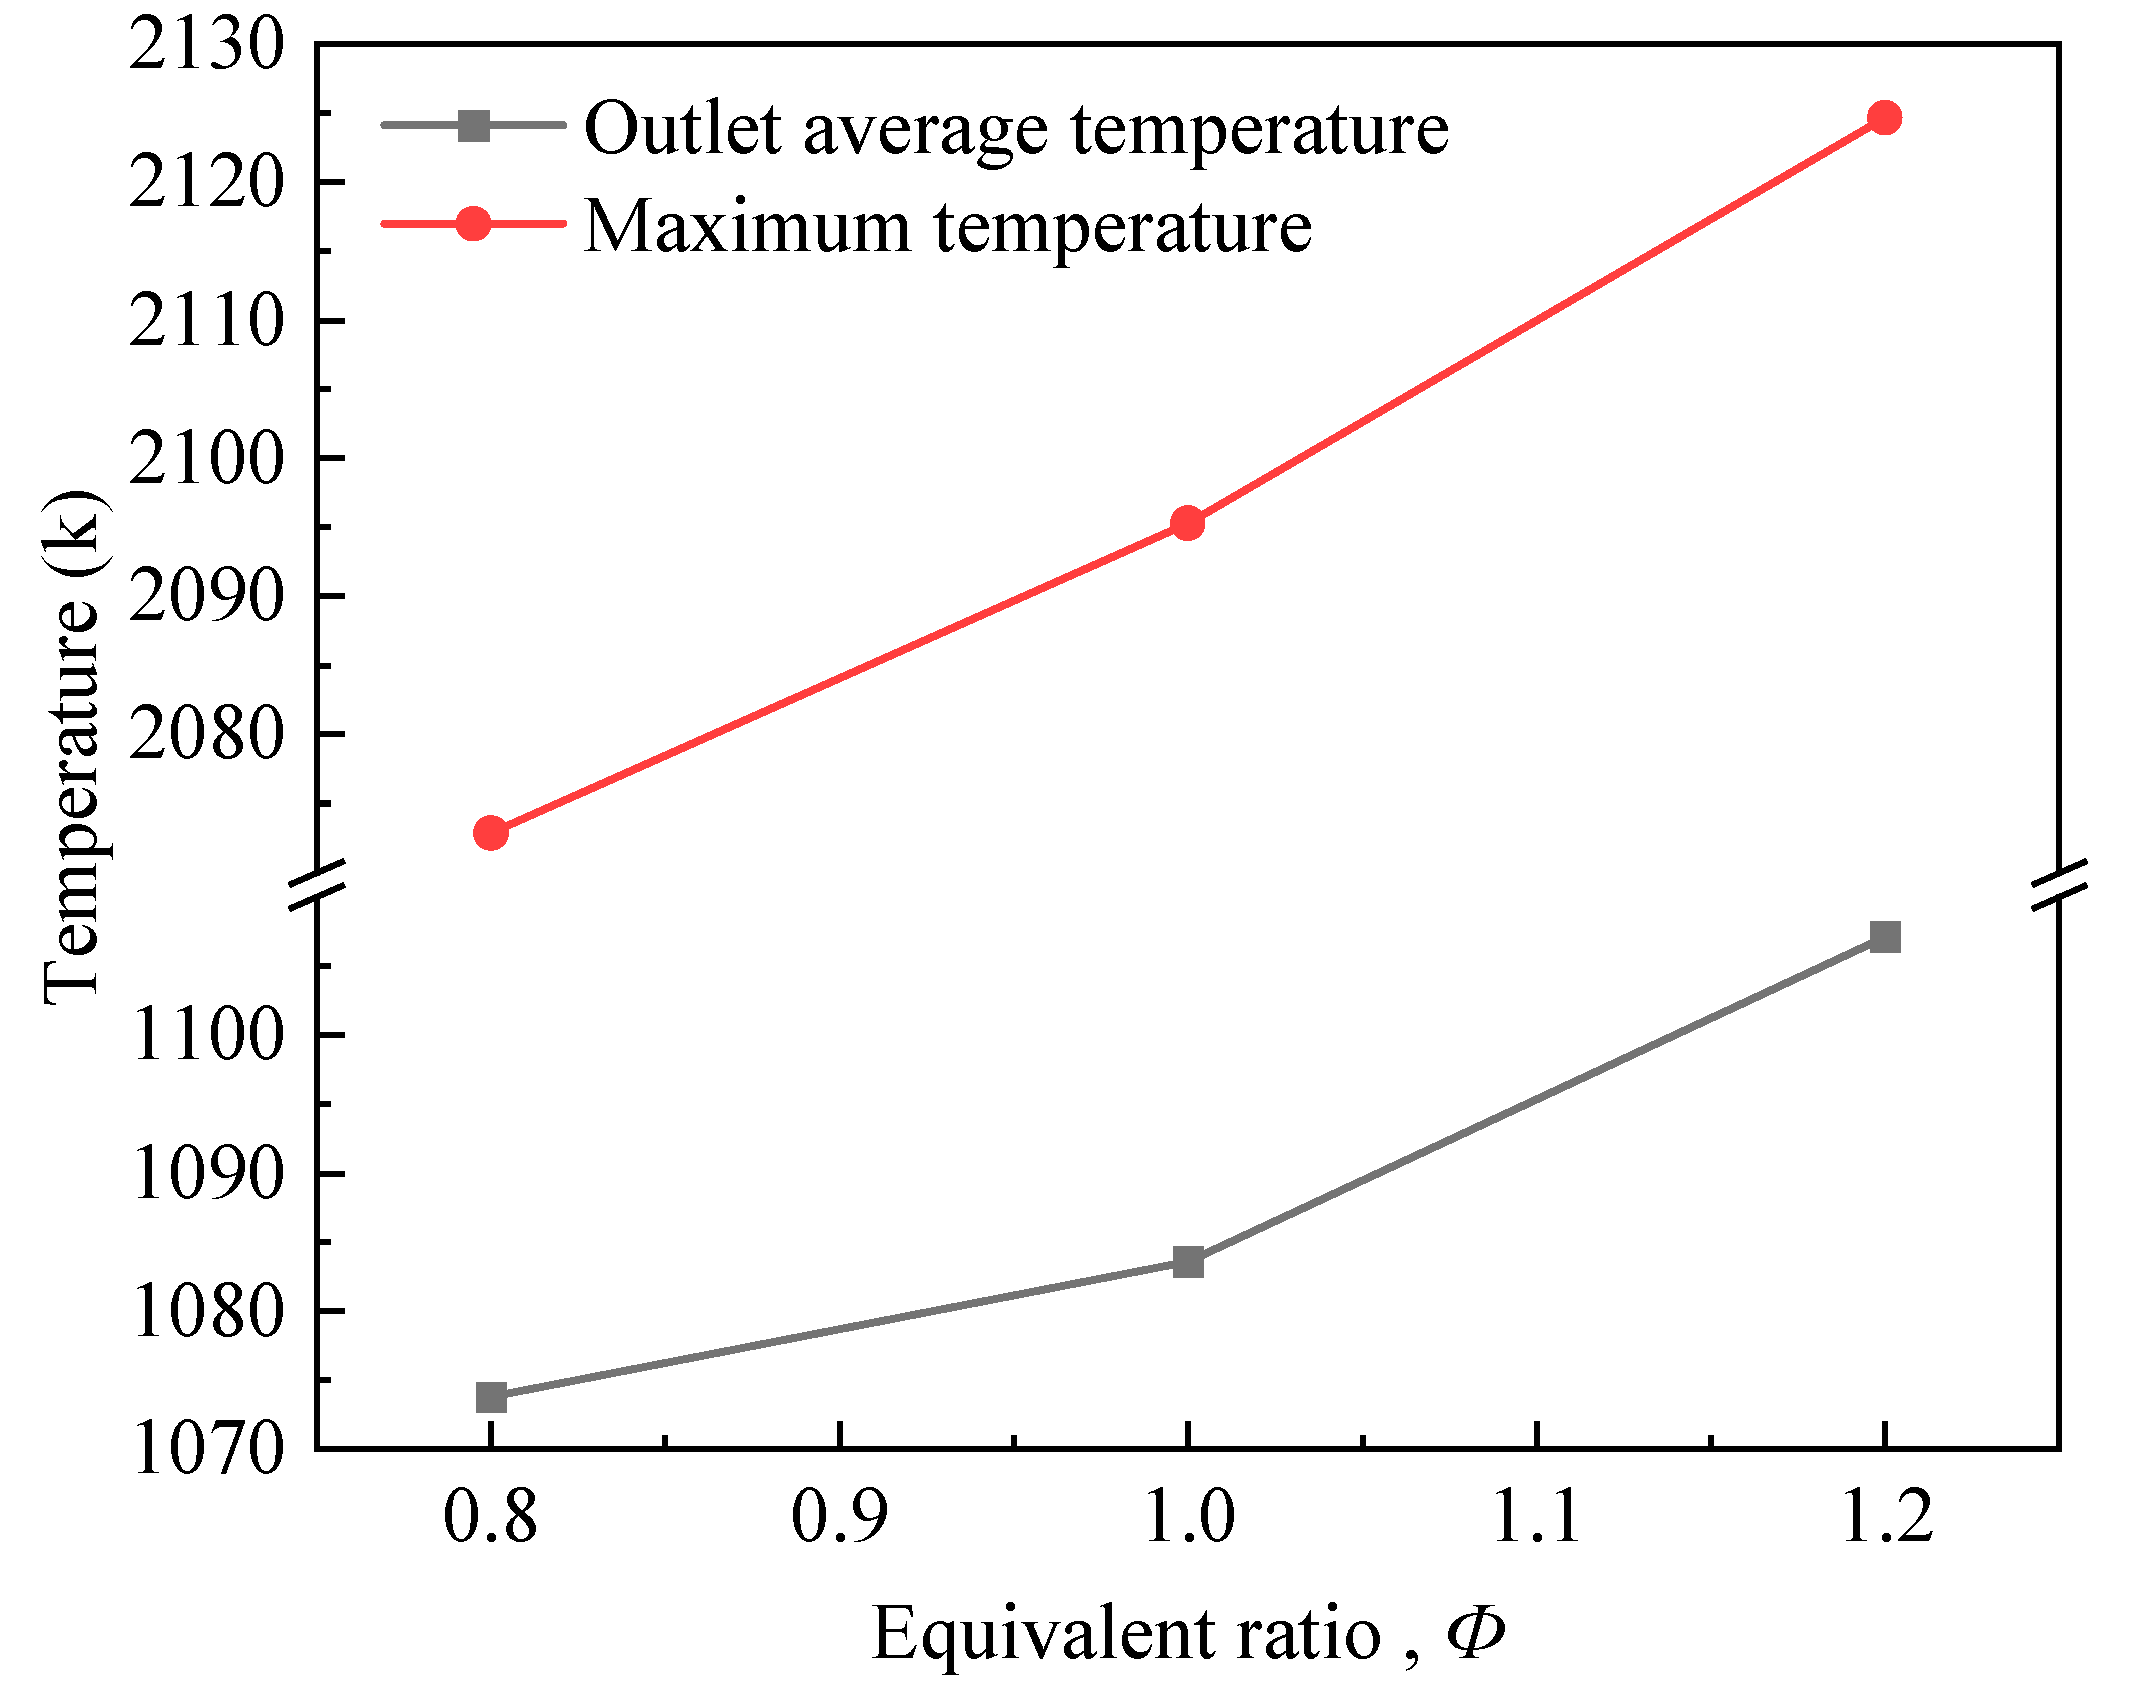
Under full load conditions with f(H2) = 0, increasing the equivalence ratio from 0.8 to 1.2 raises temperatures at multiple locations within the furnace and increases the average outlet temperature from 1073 K to 1107 K (Figure 8 and Figure 9, Table A1). Aligned with industrial operational data, this temperature rise is attributed to enhanced chemical energy release due to increased fuel concentration.
From a pollutant control perspective, the NO concentration gradually increases with the equivalence ratio (Figure 10). The corresponding NOx emissions normalized to 3.5% O2 are presented. Under lean conditions (Φ ≤ 1), increasing the equivalence ratio brings the fuel–air ratio closer to stoichiometric, improving combustion completeness and raising temperature, which promotes thermal NO formation. Under rich conditions (Φ > 1), although the O2 concentration decreases, localized high-temperature zones and radicals (CHi and H) produced by the decomposition of excess fuel enhance prompt NO formation via HCN intermediates [15].
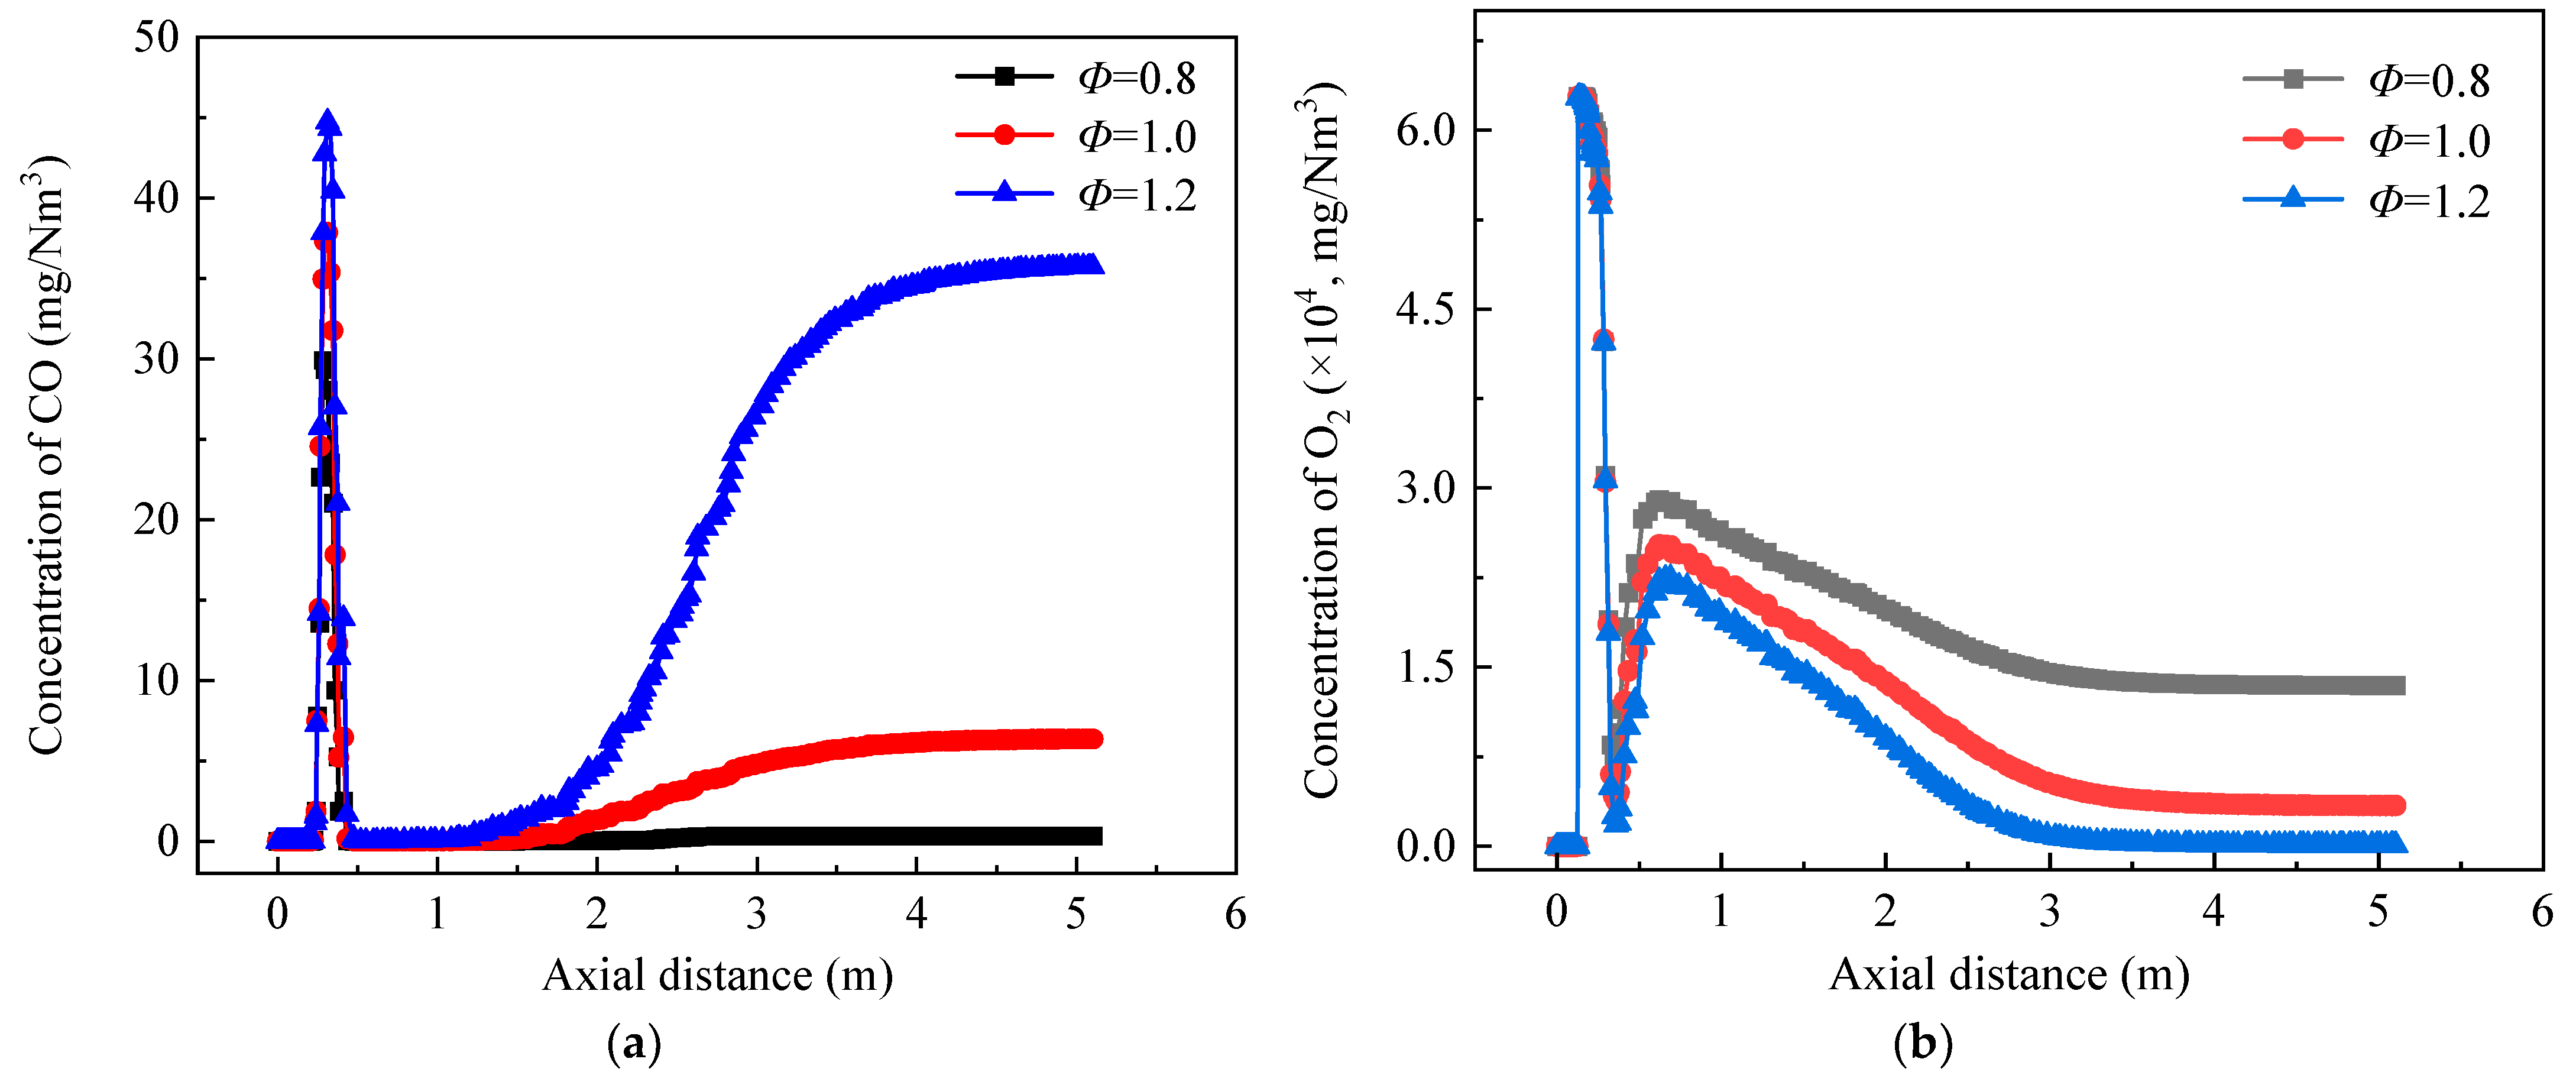
Variations in CO and O2 concentrations further confirm the influence of the equivalence ratio (Figure 11). Under Φ > 1, significant O2 deficiency leads to incomplete combustion and increased CO production. At Φ = 0.8, moderate excess air ensures consistently low CO emissions while avoiding the NO peak near Φ = 1.0. This compromise condition provides practical guidance for industrial operation, suggesting the use of Φ = 0.8 at medium loads to achieve emission balance.

3.3. Influence of Load on the Combustion Process of the Burner

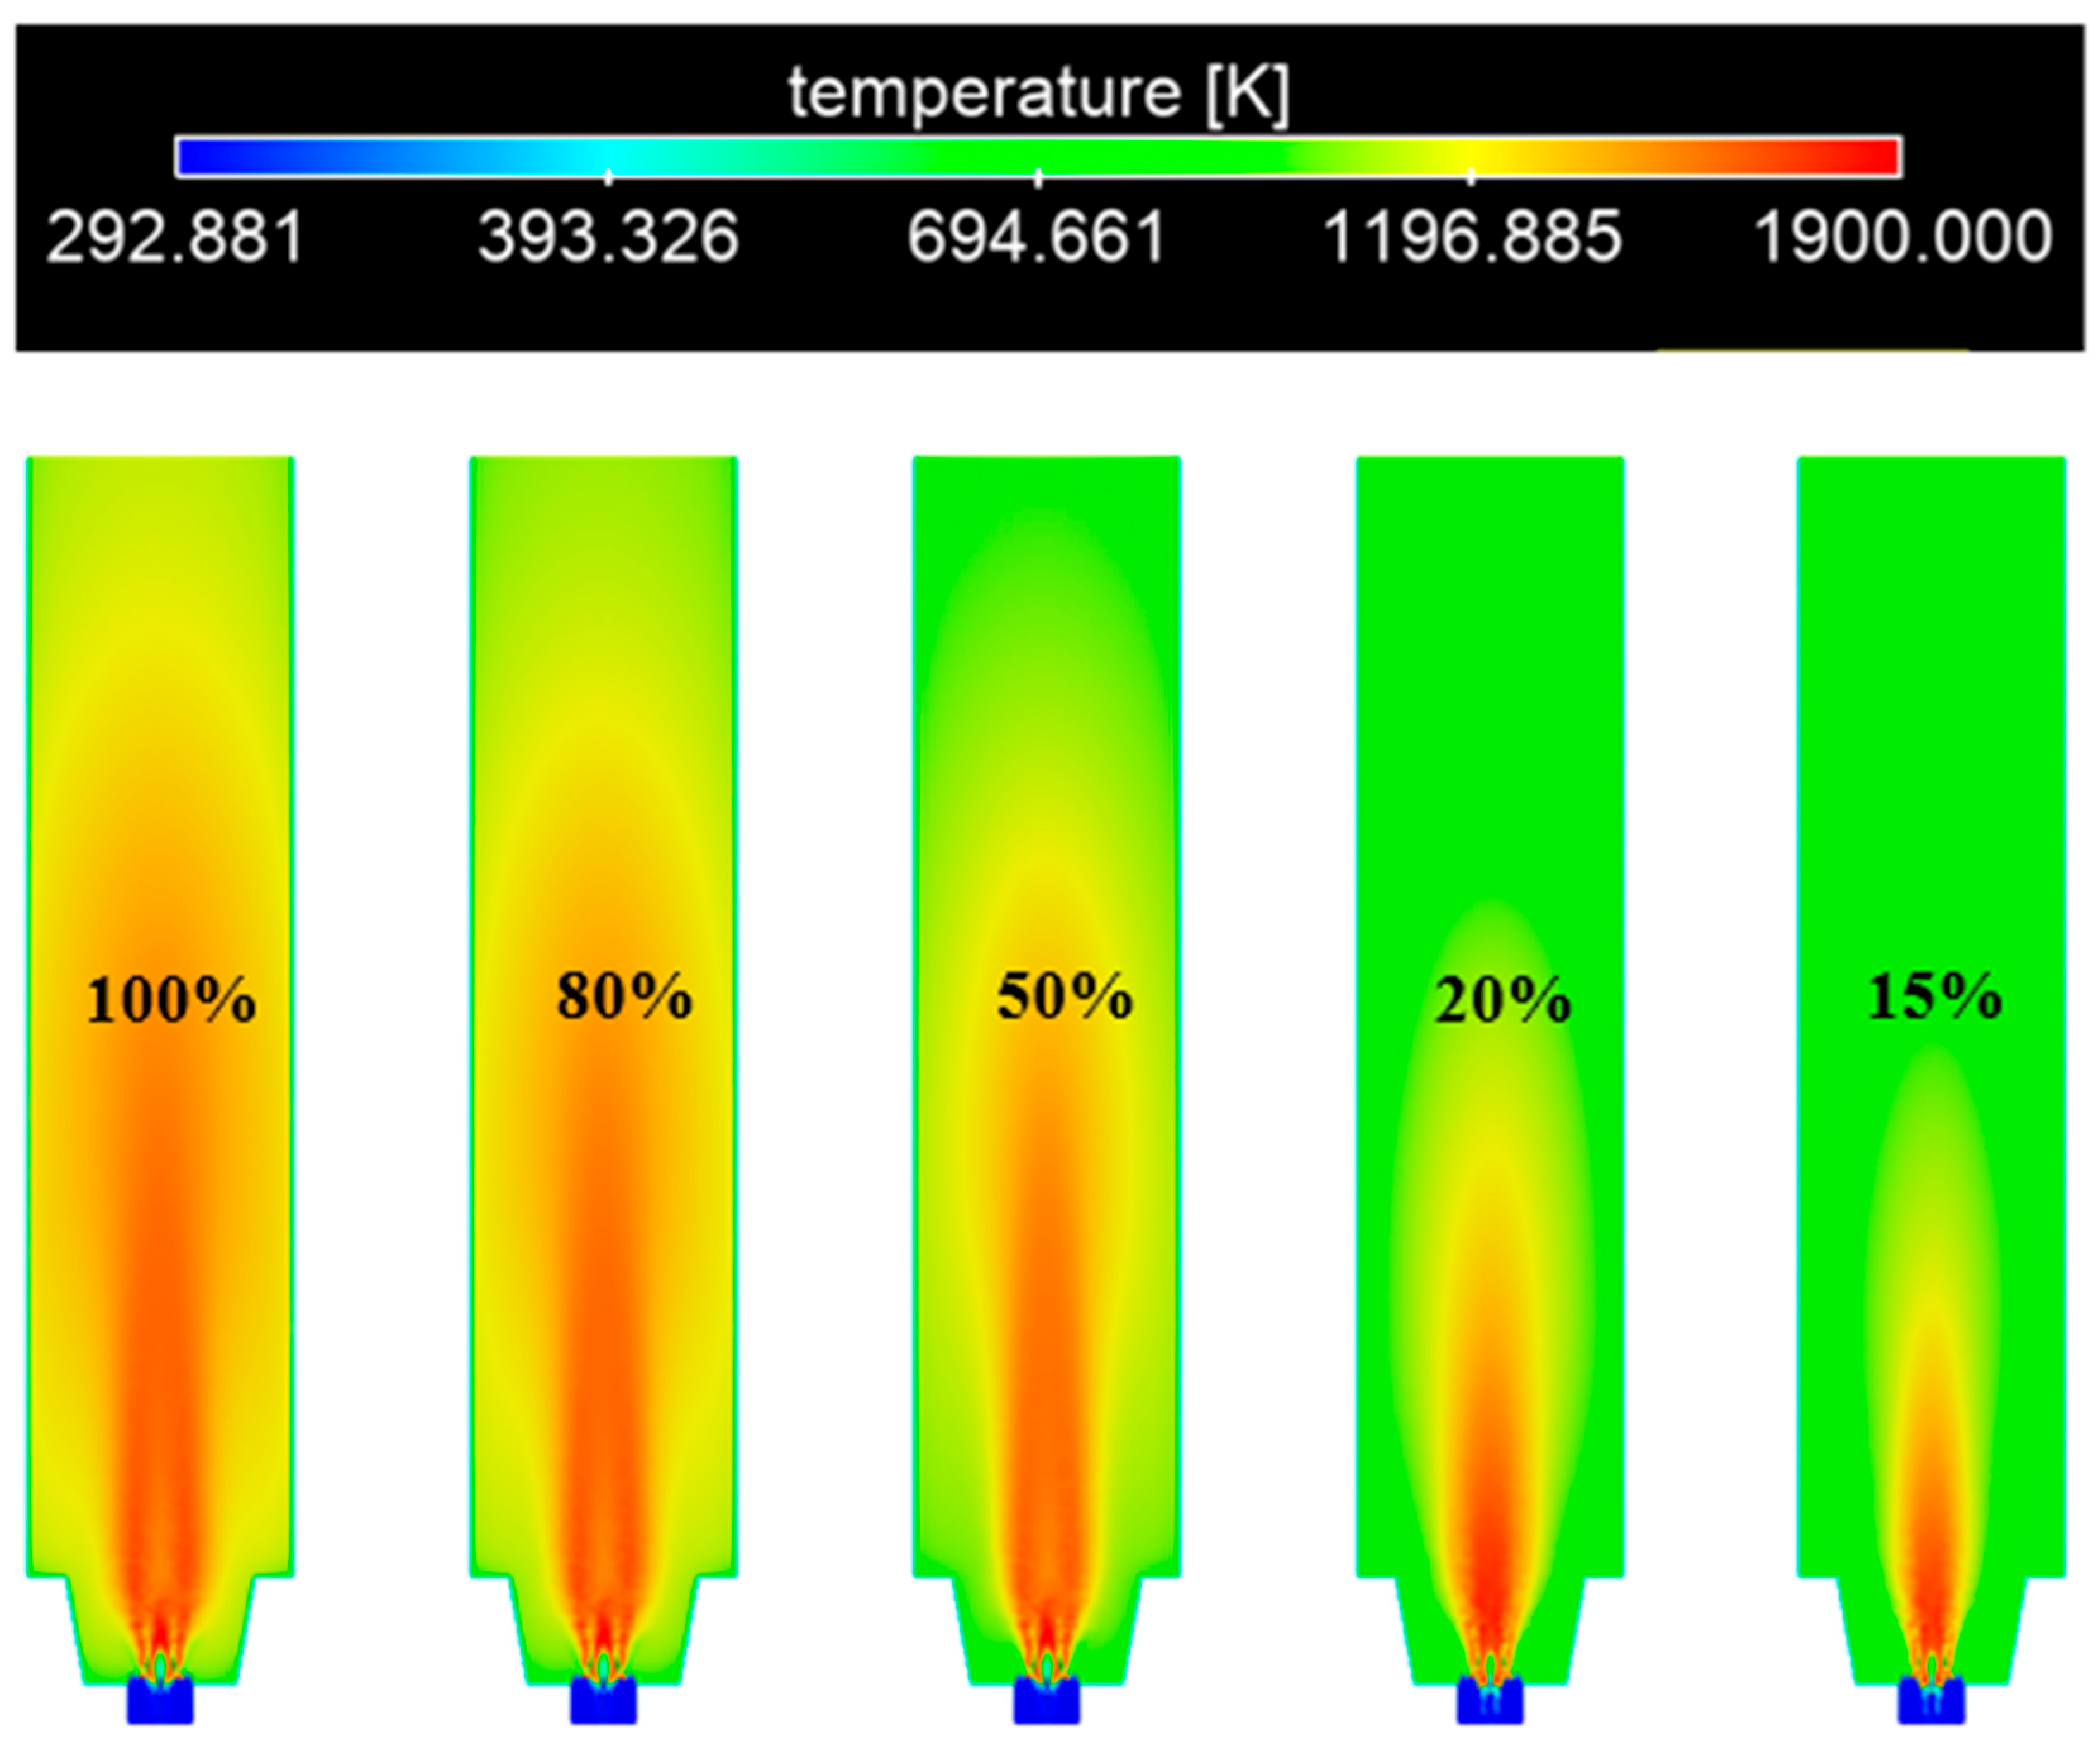
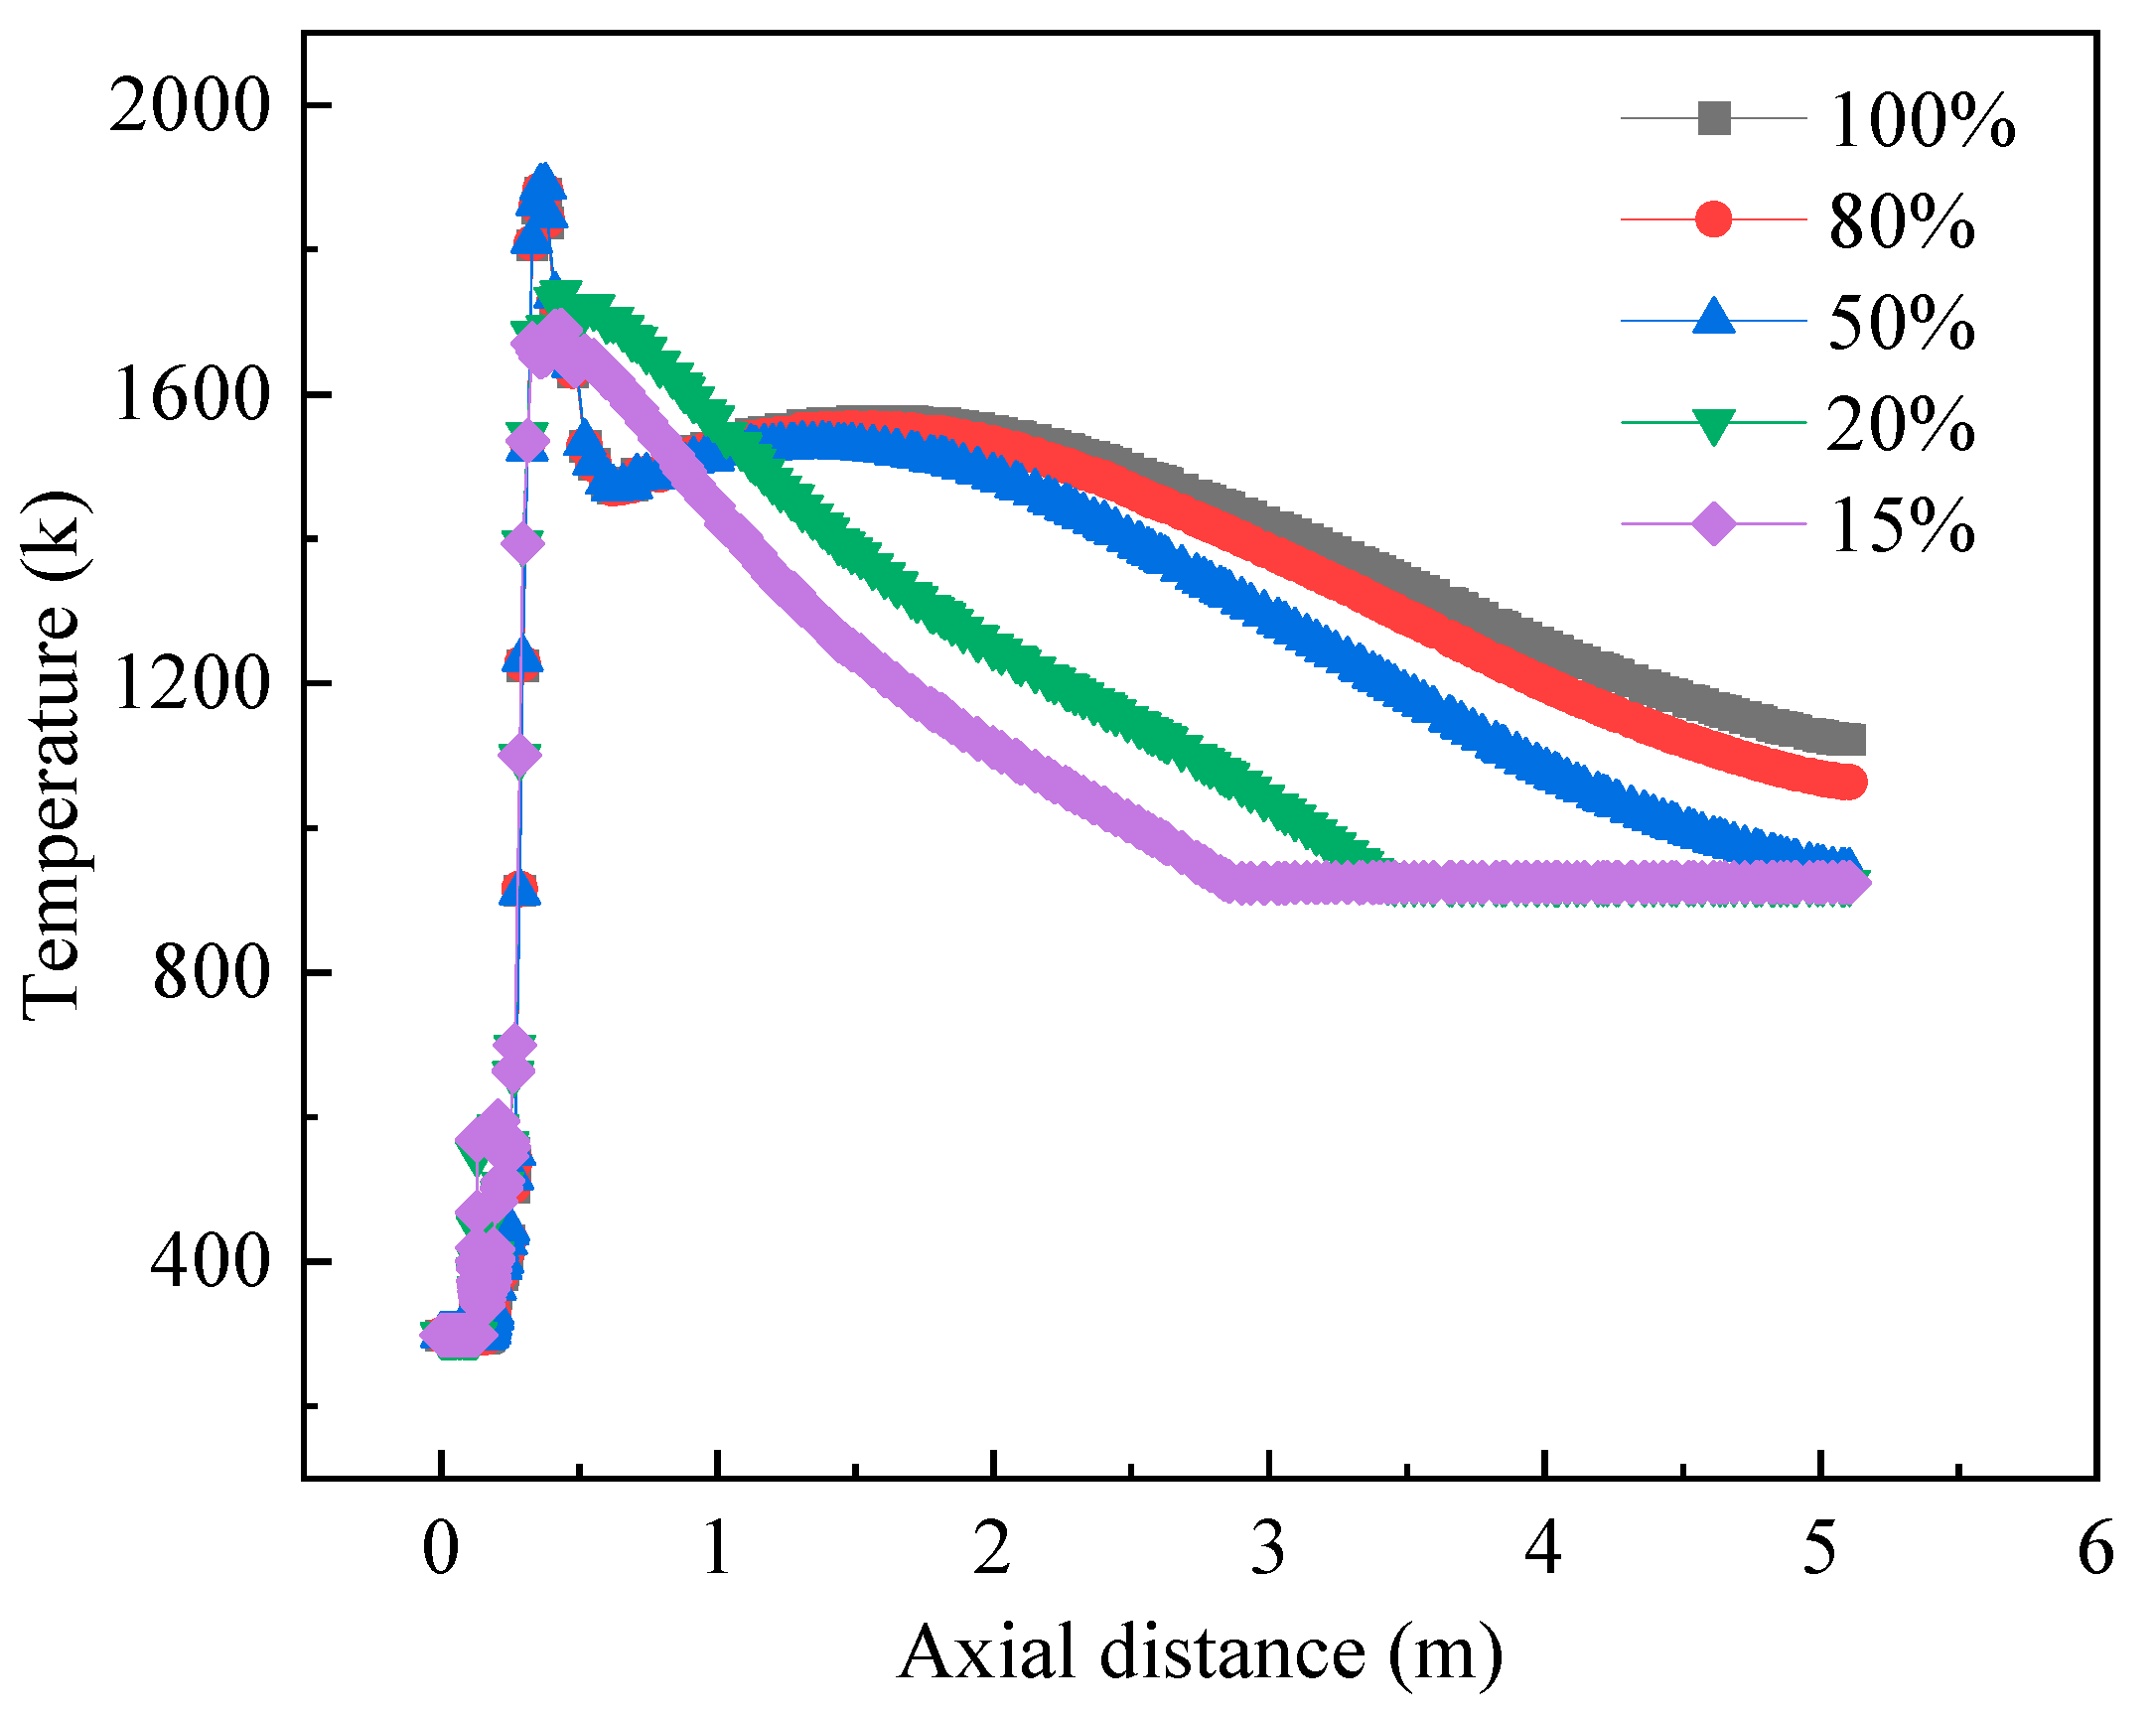
Using Φ = 0.8 as a representative condition, load reduction leads to contraction of the high-temperature region and shortening of the flame length (Figure 12 and Figure 13). When the load decreases to 50%, the high-temperature zone in the central furnace cross-section contracts significantly; at 20% and 15% loads, the temperature distribution becomes more uniform, and the outlet temperature decreases by 150 °C, compared to full load (Table A1).
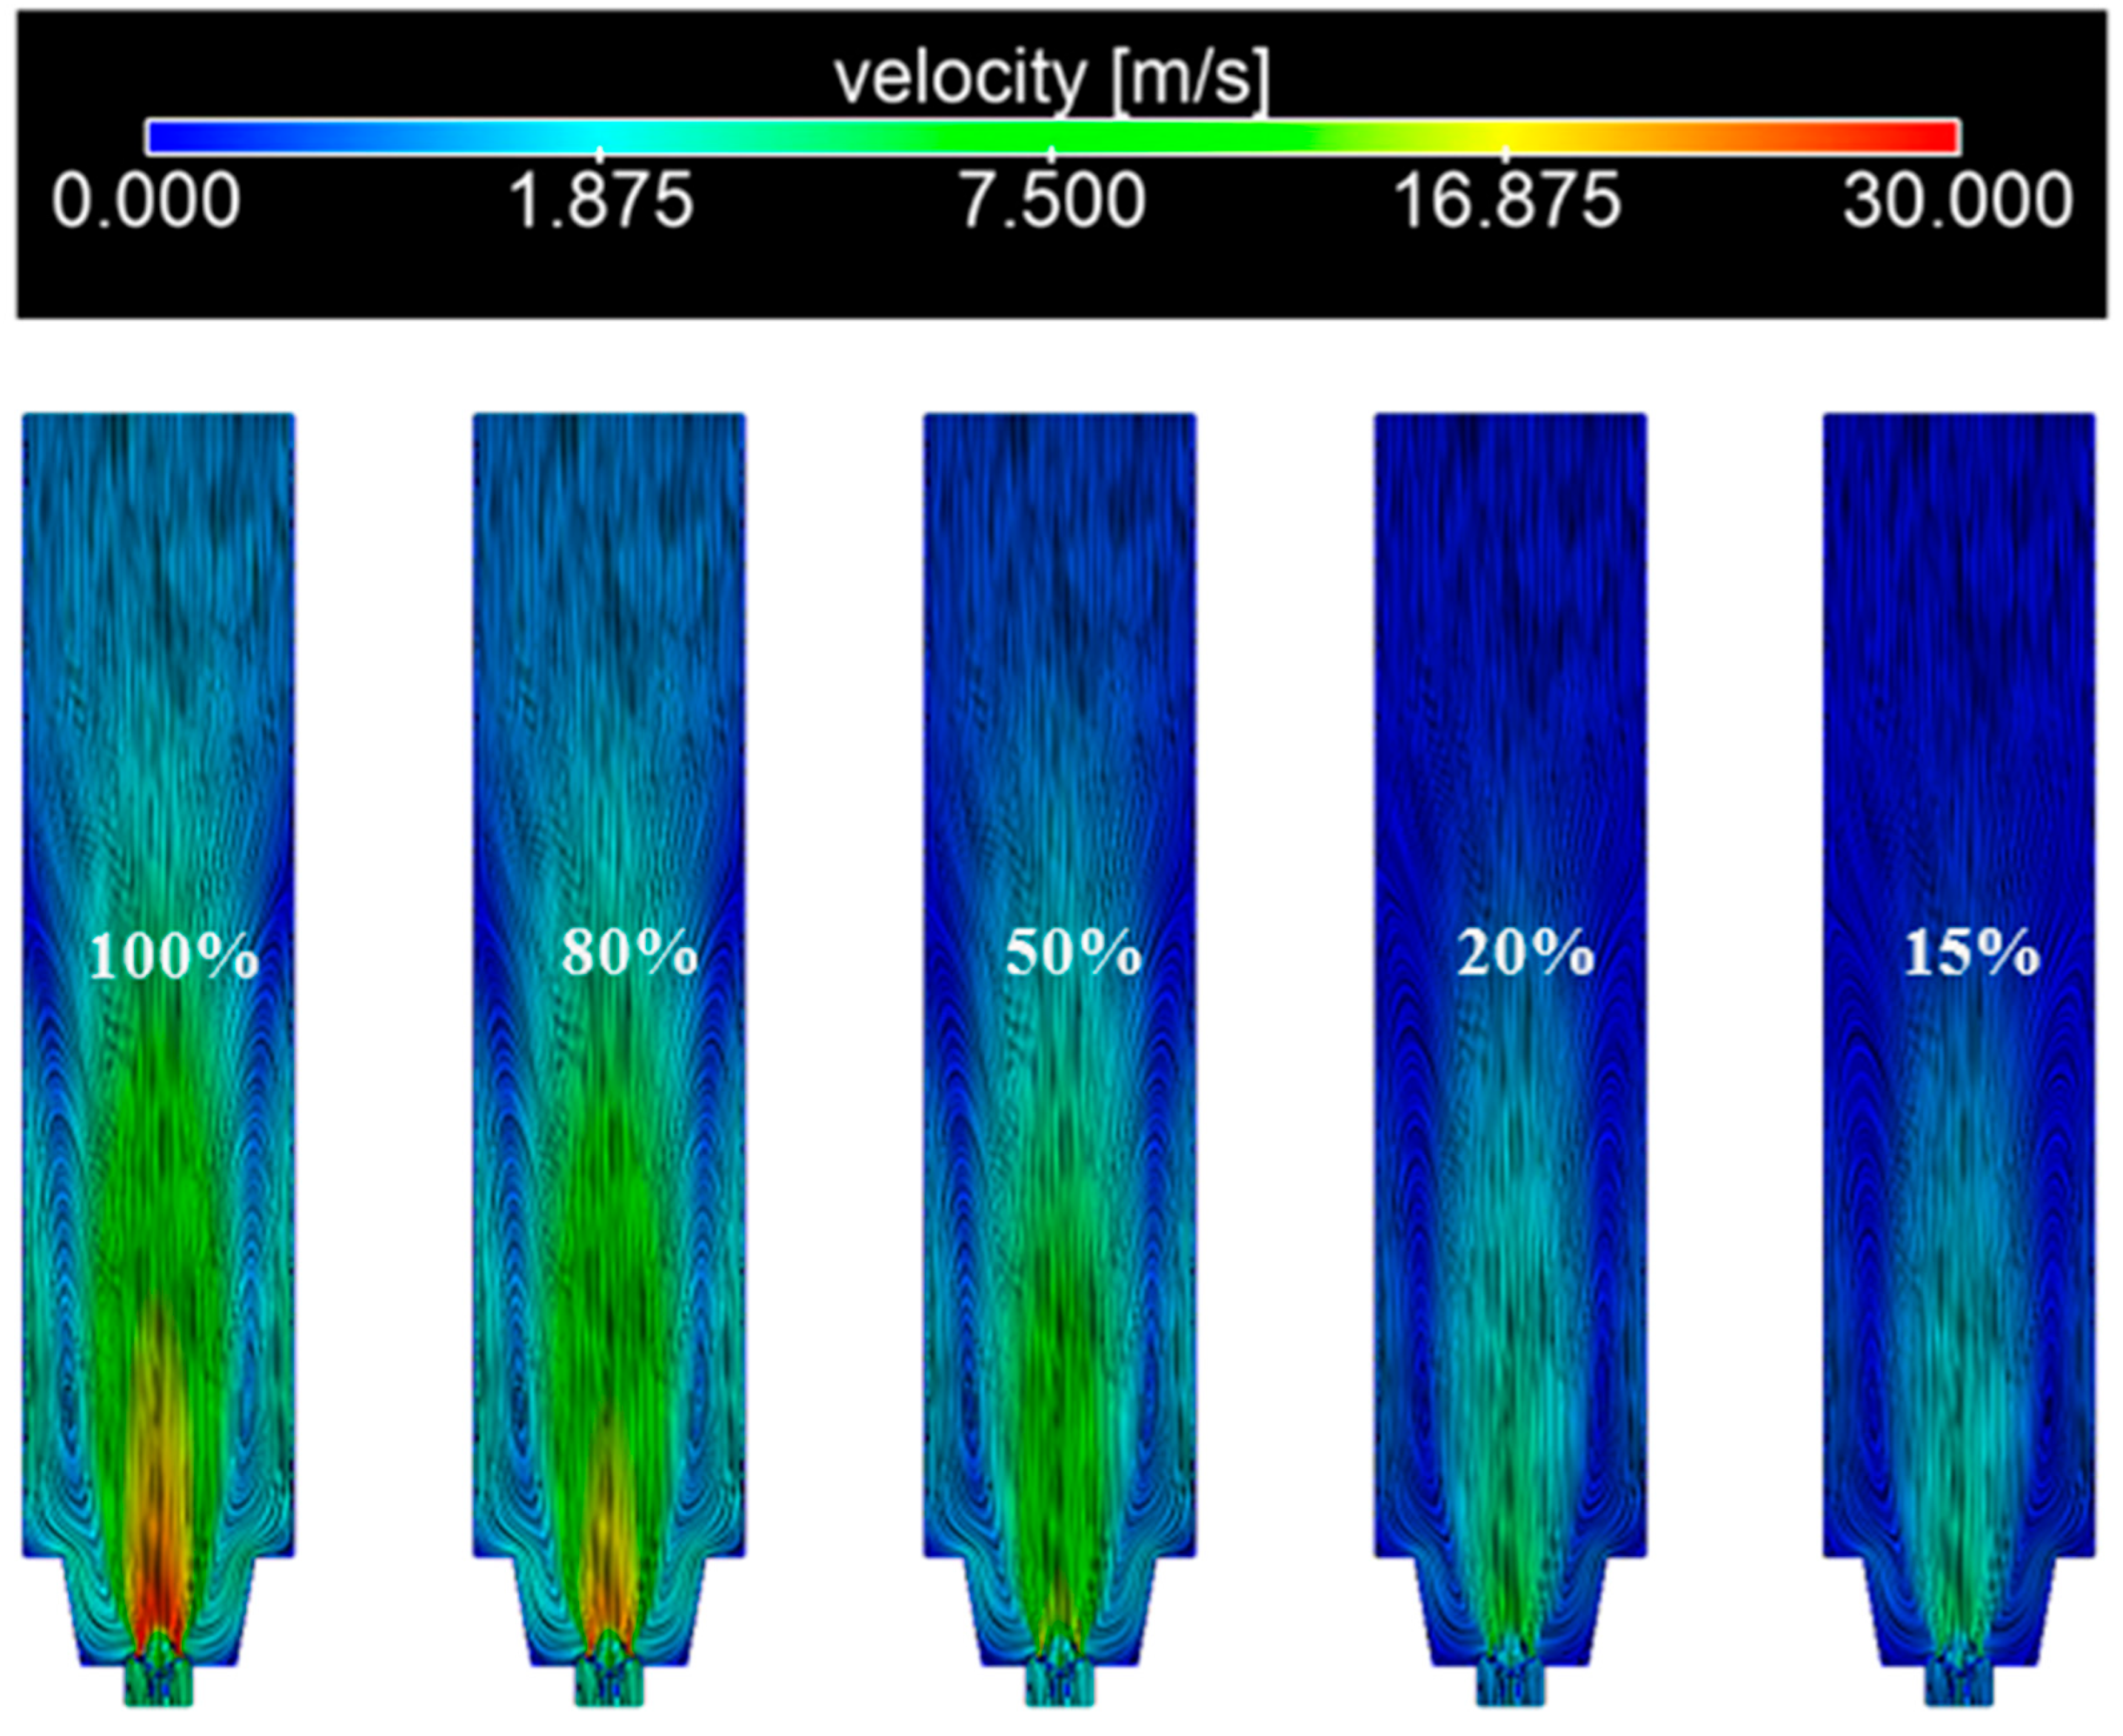
The velocity field analysis reveals a direct link between vortex structures and pollutant formation (Figure 14). A counterclockwise vortex forms near the burner outlet across all conditions, induced by the velocity gradient between the high-speed flow at the outlet and the lower-speed flow near the wall. As the load decreases, reduced fuel and inlet flow rates lead to weakened vortex intensity. At 50% load, a significant velocity decrease occurs at the burner outlet; at 20% load, velocity gradients disappear, resulting in a more homogeneous flow field. The weakening of these vortex structures directly impacts mixing intensity and flame stability, particularly at very low loads like 15%, where combustion oscillations may occur, requiring mitigation through burner design adjustments in practical applications.
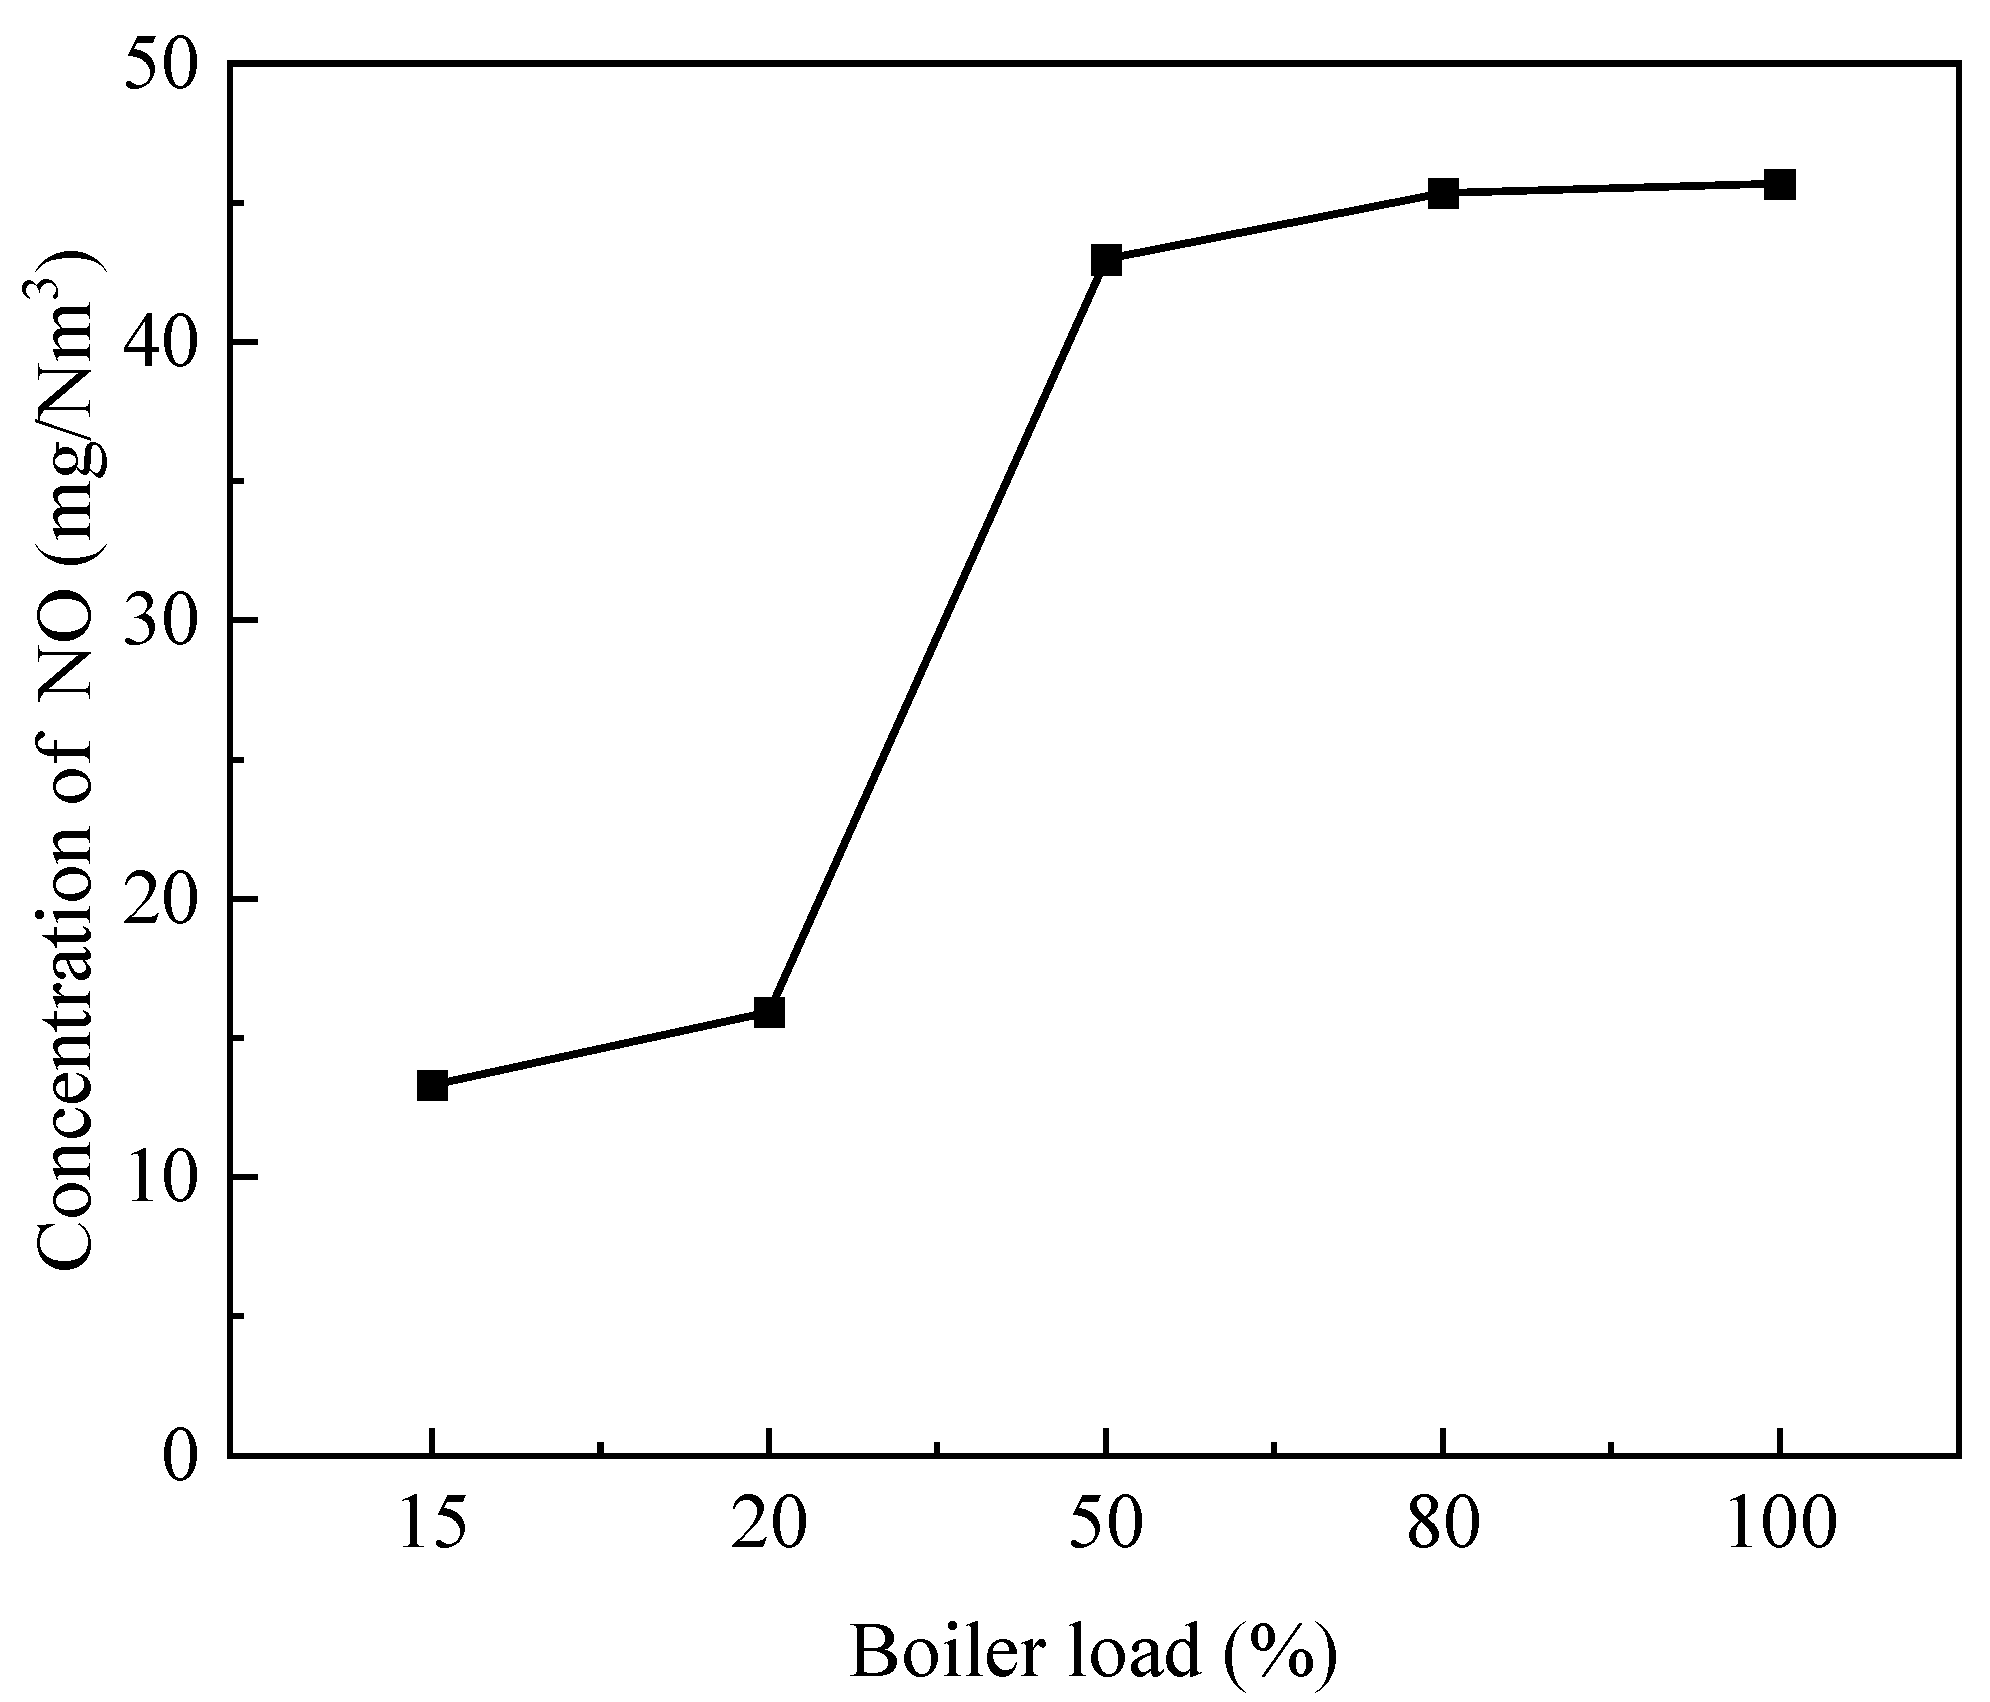
NO emissions show a strong negative correlation with load (Figure 15), with load reduction from 100% to 15% leading to an over 40% NO reduction. This decrease is directly linked to the furnace temperature drop shown in Figure 13, confirming the dominance of the thermal–NO pathway.
Notable simulation limitations include the steady-state assumption, neglect of soot formation, and limited applicability of GRI-Mech 3.0 at very high hydrogen-blending ratios (>30%). Furthermore, practical low-load operation (especially at 15%) requires consideration of thermal shock risks and combustion stability, recommending full-scale validation before implementation.

4. Conclusions

This study analyzed the combustion characteristics and pollutant emissions of hydrogen-enriched natural gas under different operating conditions through CFD simulations. The main conclusions are as follows:
Hydrogen blending linearly increases the flame temperature within the 25% range while reducing CO emissions but increasing NOx formation. Based on emission balance and current infrastructure constraints, 20% is recommended as the practical upper limit for operation. Specifically, a 20% blending ratio at Φ = 0.8 can achieve a 25% reduction in CO while limiting the NOx increase to below 18%.
The equivalence ratio exhibits competing effects on pollutant formation. Φ = 0.8 is recommended as the optimal compromise, achieving CO mole fractions <62.5 mg/Nm3 while maintaining NOx emissions below 100 mg/Nm3 (3.5% O2).
Load reduction effectively suppresses NOx formation, achieving 30% NO reduction (in mg/Nm3 (3.5% O2) at 50% load, providing clear environmental benefits for part-load operation. However, the weakened vortex structures at very low loads (e.g., 15%) may affect combustion stability, suggesting the need for combined swirler adjustments or staged combustion strategies in practical applications.
Through the multi-parameter-coupling analysis, this study extends the understanding beyond existing single-parameter studies, providing a quantitative design basis for the hydrogen retrofit of industrial boilers. Subsequent work will integrate material compatibility analysis and transient dynamics validation to support the safe implementation of higher blending ratios (>30%).

Author Contributions

Conceptualization, P.W. and N.F.; methodology, W.L., W.Z., N.F. and P.W.; validation, Y.L., Z.W. and C.S.; investigation, P.W., W.L. and W.Z.; data curation, N.F., M.X. and L.L.; writing—original draft preparation, P.W.; writing—review and editing, Y.Z.; supervision, Y.Z.; funding acquisition, Y.Z. All authors have read and agreed to the published version of the manuscript.

Funding

The research was supported by the project “Key Technology Research on Long Distance Hydrogen Mixing Transportation and Terminal Application of Natural Gas Pipeline” by State Power Investment Group Co., Ltd. (KYB12022QN02), and the Pilot Scale Model Technology “Unveiling and Commanding” Project of Shanxi Research Institute for Clean Energy, Tsinghua University (No. 2023JZ0501001).

Data Availability Statement

The original contributions presented in this study are included in the article. Further inquiries can be directed to the corresponding author.

Acknowledgments

We would like to express our sincere gratitude to State Power Investment Corporation Limited for its financial support, which provided a solid material foundation for this research. We are also deeply thankful for the arduous efforts of all the authors. During the research process, relevant authors offered administrative and technical support, actively assisting in equipment allocation, site arrangement, and other aspects. Additionally, some organizations and individuals donated physical materials, ensuring the accuracy and reliability of the experimental data.

Conflicts of Interest

Pengtao Wang, Yanghui Lu, and Meng Xu were employed by State Power Investment Corporation Research Institute Co., Ltd. (SPICRI). Wei Zheng and Liangliang Lv were employed by Inner Mongolia Huomei Hongjun Aluminum and Electric Co., Ltd. The remaining author declares that the research was conducted in the absence of any commercial or financial relationships that could be construed as a potential conflict of interest.

Appendix A

Table A1. Temperature at outlet, NO/CO concentrations.
Boiler LoadΦf(H2)Outlet Concentration (mg/Nm3, 3.5% O2)
TemperatureNOCO
1000.801073.81 42.734.4
51074.37 45.134.2
101074.57 46.834.1
151074.21 47.433.8
201075.05 49.133.7
251075.96 52.8642
1.001083.60 199638
51085.45 204633
101087.30 217629
151089.07 249624
201091.05 298619
251094.94 4633600
1.201107.13 4903570
51108.15 5093520
101108.27 5273480
151108.59 5723430
201108.72 6463380
251108.59 45.336.4
800.801013.88 45.536.2
51014.07 45.936
101014.31 50.635.8
151014.55 55.735.7
201014.81 56.134.8
251015.11 191642
1.001010.06 199638
51011.75 204633
101013.45 205629
151015.04 205624
201016.81 231619
251018.47 4873600
1.201032.57 4903570
51033.50 4963520
101033.55 4993480
151033.80 5083430
201033.86 5203380
251033.81 4336.4
500.80889.91 43.236.1
5890.32 4436
10890.75 45.135.8
15891.16 45.835.7
20891.57 4634.8
25891.97 174641
1.00901.67 178637
5901.65 180633
10902.53 181629
15903.50 183624
20904.55 187619
25906.11 5163600
1.20896.61 5293570
5897.56 5343520
10898.05 5353480
15898.96 5463430
20899.89 5493380
25900.82 15.91460
200.80923.75 15.91430
5926.36 16.31410
10927.31 16.81400
15928.34 18.51390
20929.45 19.21370
25930.66 21.35740
1.00784.30 22.15680
5785.39 22.95610
10787.76 23.85540
15790.24 255460
20793.03 26.15370
25795.98 29.87440
1.20636.76 30.87380
5636.98 31.87320
10637.50 32.77240
15638.20 357160
20639.16 39.97070
25640.41 13.31460
150.80923.75 14.91430
5926.36 15.71410
10927.31 19.21400
15928.34 23.51390
20929.45 241370
25930.66 21.85740
1.00784.27 24.35680
5785.37 25.55610
10787.74 275540
15790.22 28.95460
20793.01 30.45370
25795.95 33.87440
1.20613.68 35.37380
5615.35 36.47320
10618.42 37.47240
15621.67 38.37160
20625.31 39.77070
25629.20 46.134.4

References

  1. Yang, F.Y.; Wang, T.Z.; Deng, X.T.; Dang, J.; Huang, Z.Y.; Hu, S.; Li, Y.Y.; Ouyang, M.G. Review on Hydrogen Safety Issues: Incident Statistics, Hydrogen Diffusion, and Detonation Process. Int. J. Hydrogen Energy 2021, 46, 31467–31488. [Google Scholar] [CrossRef]
  2. Yu, J.; Park, J.; Kim, S.; Choi, Y.; Lee, S.H.; Lee, Y. Effect of Operating Conditions on the Characteristics of Flameless CH4 and H2 Combustion for Primary NO Reduction. Fuel 2024, 374, 132507. [Google Scholar] [CrossRef]
  3. Huang, M.M.; Li, R.C.; Xu, J.K.; Cheng, S.; Deng, H.X.; Rong, Z.Y.; Li, Y.; Zhang, Y.F. Effect of Equivalence Ratio and Staging Ratio on the Methane MILD Combustion in Dual-Stage Combustor. Fuel 2022, 307, 121903. [Google Scholar] [CrossRef]
  4. Cheng, L.; Li, W.L.; Peng, S.Y.; Chai, C.; Wang, W.B.; Tian, C.; Zhang, J.C.; Liu, L.Q.; Zhang, H.W.; Zhang, Y.X. Study of Combustion Characteristics of Hydrogen-Doped Natural Gas in Industrial Boilers. Int. J. Hydrogen Energy 2024, 92, 590–604. [Google Scholar] [CrossRef]
  5. Li, R.Z.; Zhang, Y.H.; Jia, Q.S.; Cao, M.T.; Zhang, W.Q.; Si, X.Y.; Shi, C.H. A Study of the Effect of Hydrogen on Methane Deflagration Characteristics in a Square Confined Space. Int. J. Hydrogen Energy 2024, 62, 947–958. [Google Scholar] [CrossRef]
  6. Zimont, V.L. Conceptual Limitations of the Probability Density Function Method for Modeling Turbulent Premixed Combustion and Closed-Form Description of Chemical Reactions’ Effects. Fluids 2021, 6, 142. [Google Scholar] [CrossRef]
  7. Lovella, Y.G.; Moya, I.H.; Jayasuriya, J.; Blondeau, J. Reynolds-Average Navier-Stokes Turbulence Models Assessment: A Case Study of CH4/H2/N2-Air Reacting Jet. Heliyon 2024, 10, e26956. [Google Scholar] [CrossRef]
  8. Hami, K. Turbulence Modeling a Review for Different Used Methods. Int. J. Heat Technol. 2021, 39, 227–234. [Google Scholar] [CrossRef]
  9. Jung, L.; Mages, A.; Sauer, A. Numerical Investigation and Simulation of Hydrogen Blending into Natural Gas Combustion. Energies 2024, 17, 3819. [Google Scholar] [CrossRef]
  10. Manatunga, M.; Christo, F.C.; Schlüter, J.; Shelyag, S. Evaluating the Steady Flamelet Assumption: Impacts on Flame Structure and NO Emissions in Hydrogen/Air Turbulent Jet Diffusion Flames. Combust. Sci. Technol. 2025, 1–23. [Google Scholar] [CrossRef]
  11. Wang, K.; Xu, R.; Parise, T.; Shao, J.; Movaghar, A.; Lee, D.J.; Park, J.W.; Gao, Y.; Lu, T.F.; Egolfopoulos, F.N.; et al. A Physics-Based Approach to Modeling Real-Fuel Combustion Chemistry-IV. HyChem Modeling of Combustion Kinetics of a Bio-Derived Jet Fuel and Its Blends with a Conventional Jet A. Combust. Flame 2018, 198, 477–489. [Google Scholar] [CrossRef]
  12. Gerasimov, I.E.; Bolshova, T.A.; Osipova, K.N.; Dmitriev, A.M.; Knyazkov, D.A.; Shmakov, A.G. Flame Structure at Elevated Pressure Values and Reduced Reaction Mechanisms for the Combustion of CH4/H2 Mixtures. Energies 2023, 16, 7489. [Google Scholar] [CrossRef]
  13. Xiao, J.; Liu, Q.M.; He, S.; Wang, S.M.; Zhang, Z.X. Numerical Simulation on Combustion Characteristics of Methane/Hydrogen Blended Fuel for Non-Premixed Conical Bluff Body Burner. Int. J. Hydrogen Energy 2024, 65, 50–60. [Google Scholar] [CrossRef]
  14. Panesar, A.; Allan, J.; Wylie, E. Medium Speed Lean Hydrogen Engine Modelling and Validation. Int. J. Hydrogen Energy 2025, 171, 151268. [Google Scholar] [CrossRef]
  15. Pan, H.J.T.; Geng, S.J.; Yang, H.; Zhang, G.H.; Bian, H.; Liu, Y.H. Influence of H2 Blending on NOx Production in Natural Gas Combustion: Mechanism Comparison and Reaction Routes. Int. J. Hydrogen Energy 2023, 48, 784–797. [Google Scholar] [CrossRef]
  16. Glanville, P.; Fridlyand, A.; Sutherland, B.; Liszka, M.; Zhao, Y.; Bingham, L.; Jorgensen, K. Impact of Hydrogen/Natural Gas Blends on Partially Premixed Combustion Equipment: NOx Emission and Operational Performance. Energies 2022, 15, 1706. [Google Scholar] [CrossRef]
  17. Yu, H.Y.; Díaz, A.; Lu, X.; Sun, B.H.; Ding, Y.; Koyama, M.; He, J.Y.; Zhou, X.; Oudriss, A.; Feaugas, X.; et al. Hydrogen Embrittlement as a Conspicuous Material Challenge-Comprehensive Review and Future Directions. Chem. Rev. 2024, 124, 6271–6392. [Google Scholar] [CrossRef] [PubMed]
  18. Ji, L.J.; Wang, J.H.; Zhang, W.J.; Wang, Y.C.; Huang, Z.H.; Bai, X.S. Structure and Thermoacoustic Instability of Turbulent Swirling Lean Premixed Methane/Hydrogen/Air Flames in a Model Combustor. Int. J. Hydrogen Energy 2024, 60, 890–901. [Google Scholar] [CrossRef]
  19. Zhang, Q.L.; Su, Y.; Liu, T.; Huang, H.T.; Guo, Y.J.; Li, Y.X. Application and Progress of Low-NOx Emission Technology for Gas Boilers. Chem. Eng. J. 2024, 52, 18–24. [Google Scholar] [CrossRef]
  20. Seddik, H.; Braiek, E.B. Efficient Noise Removing Based Optimized Smart Dynamic Gaussian Filter. Int. J. Comput. Appl. 2012, 51, 1–13. [Google Scholar] [CrossRef]
  21. Zhao, Q.N.; Liu, X.M.; Liu, F.; Xu, H.T.; Liu, Z.H.; Liao, X.W. Numerical Simulation on Emissions Mechanism of Nitrogen Oxides in Gas-fired Boilers Blended with Hydrogen. Chem. Ind. Eng. Prog. 2023, 42, 5637–5647. [Google Scholar] [CrossRef]
  22. NIST/SEMATECH. e-Handbook of Statistical Methods: 1.3.5.17.1. Grubbs’ Test for Outliers; National Institute of Standards and Technology (NIST): Gaithersburg, MD, USA, 2012. Available online: https://www.itl.nist.gov/div898/handbook/eda/section3/eda35h1.htm (accessed on 20 October 2025).
  23. Liu, L.M.; Xie, J.F.; Zhang, C.Z. Application and Enlightenment of Reference Oxygen Content in Emission Standards of Atmospheric Stationary Source Pollutants. Environ. Monit. China 2022, 38, 248–254. [Google Scholar] [CrossRef]
  24. Ziani, L.; Chaker, A.; Chetehouna, K.; Malek, A.; Mahmah, B. Numerical Simulations of Non-Premixed Turbulent Combustion of CH4-H2 Mixtures Using the PDF Approach. Int. J. Hydrogen Energy 2013, 38, 8597–8603. [Google Scholar] [CrossRef]
  25. Duan, H.; Huang, Y.; Mehra, R.K.; Song, P.; Ma, F. Study on Influencing Factors of Prediction Accuracy of Support Vector Machine (SVM) Model for NOx Emission of a Hydrogen Enriched Compressed Natural Gas Engine. Fuel 2018, 234, 954–964. [Google Scholar] [CrossRef]
  26. Dong, C.; Zhou, Q.L.; Zhang, X.G.; Zhao, Q.X.; Xu, T.M.; Hui, S.E. Experimental Study on the Laminar Flame Speed of Hydrogen/Natural Gas/Air Mixtures. Front. Chem. Sci. Eng. 2010, 4, 417–422. [Google Scholar] [CrossRef]
Figure 1. Physical modeling of boilers and burners, (a) burner; (b) gas boiler.
Processes 13 03477 g001
Figure 2. Meshing of geometric models, (a) gas boiler; (b) burner internal.
Processes 13 03477 g002
Figure 3. Grid-independent verification.
Processes 13 03477 g003
Figure 4. Axial variation of temperature in furnace chamber at different hydrogen-doping ratios, (a) complete profile; (b) magnified view of the region inside the red box.
Processes 13 03477 g004
Figure 5. Variation in average furnace outlet temperature and maximum furnace temperature with different hydrogen-doping ratios.
Processes 13 03477 g005
Figure 6. Axial variation in furnace CO concentration at different hydrogen doping ratios.
Processes 13 03477 g006
Figure 7. Axial variation of NO concentration in the furnace chamber with different hydrogen doping ratios, (a) complete profile, (b) magnified view of the region inside the red box.
Processes 13 03477 g007
Figure 8. Furnace center axis temperature variation at different equivalence ratios.
Processes 13 03477 g008
Figure 9. Average temperature at furnace outlet and center-axis temperature variation at different equivalence ratios.
Processes 13 03477 g009
Figure 10. Surface-averaged NO concentration at furnace outlet for different equivalence ratios.
Processes 13 03477 g010
Figure 11. Concentration along furnace center axis at different equivalence ratios, (a) CO; (b) O2.
Processes 13 03477 g011
Figure 12. Temperature distribution in center section of furnace at different loads.
Processes 13 03477 g012
Figure 13. Furnace center axis temperature variation at different loads.
Processes 13 03477 g013
Figure 14. Velocity field distribution in center section of furnace at different loads.
Processes 13 03477 g014
Figure 15. Average NO concentration at furnace exit surface at different loads.
Processes 13 03477 g015
Table 1. Boundary conditions for numerical simulation of hydrogen-enriched combustion.
Areas/mm2Hydraulic Diameters/m
Fuel-inlet1923.6280.014
Fuel-inlet 21017.8760.036
Air-inlet48,559.5980.152
Outlet890,818.2321.065
Table 2. Performance comparison of turbulence models for industrial-scale H2/CH4 combustion [8,9].
ModelVelocity Prediction ErrorTemperature PredictionComputational Time (Core-Hours/Case)
Modified k-ε 6–8%6–8%1200
RNG k-ε 9–11% 8–10%1300
RSM10–13% 9–12%2000
LES 4–6% 4–6% 2400
Table 3. Combustion boundary conditions.
Boiler LoadΦf(H2)Air Flow (m3/h)Air-Inlet Flow Rate (m/s)Flue-Inlet1 Flow Rate (m/s)Flue-Inlet2 Flow Rate (m/s)
1000.802489.0014.2451.1610.89
52482.3614.2053.0111.28
102475.2214.1654.9911.70
152467.5214.1257.1312.16
202459.2014.0759.4512.65
252450.1814.0261.9613.19
1.001991.2011.3951.1610.89
51985.8911.3653.0111.28
101980.1711.3354.9911.70
151974.0211.2957.1312.16
201967.3611.2559.4512.65
251960.1411.2161.9613.19
1.201659.339.4951.1610.89
51654.919.4753.0111.28
101650.159.4454.9911.70
151645.019.4157.1312.16
201639.479.3859.4512.65
251633.459.3461.9613.19
800.801991.2011.3940.938.71
51985.8911.3642.409.03
101980.1711.3343.999.36
151974.0211.2945.719.73
201967.3611.2547.5610.12
251960.1411.2149.5710.55
1.001592.969.1140.938.71
51588.719.0942.409.03
101584.149.0643.999.36
151579.219.0345.719.73
201573.899.0047.5610.12
251568.118.9749.5710.55
1.201327.477.5940.938.71
51323.927.5742.409.03
101320.127.5543.999.36
151316.017.5345.719.73
201311.577.5047.5610.12
251306.767.4849.5710.55
500.801244.507.1225.585.44
51241.187.1026.505.64
101237.617.0827.505.85
151233.767.0628.576.08
201229.607.0329.726.33
251225.097.0130.986.59
1.00995.605.7025.585.44
5992.945.6826.505.64
10990.095.6627.505.85
15987.015.6528.576.08
20983.685.6329.726.33
25980.075.6130.986.59
1.20829.674.7525.585.44
5827.454.7326.505.64
10825.074.7227.505.85
15822.514.7128.576.08
20819.734.6929.726.33
25816.734.6730.986.59
200.80497.802.8510.236.01
5496.472.8410.606.23
10495.042.8311.006.46
15493.502.8211.436.71
20491.842.8111.896.98
25490.042.8012.397.28
1.00398.242.2810.236.01
5397.182.2710.606.23
10396.032.2711.006.46
15394.802.2611.436.71
20393.472.2511.896.98
25392.032.2412.397.28
1.20331.871.9010.236.01
5330.981.8910.606.23
10330.031.8911.006.46
15329.001.8811.436.71
20327.891.8811.896.98
25326.691.8712.397.28
150.80373.352.147.674.51
5372.352.137.954.67
10371.282.128.254.84
15370.132.128.575.03
20368.882.118.925.24
25367.532.109.295.46
1.00298.681.717.674.51
5297.881.707.954.67
10297.031.708.254.84
15296.101.698.575.03
20295.101.698.925.24
25294.021.689.295.46
1.20248.901.427.674.51
5248.241.427.954.67
10247.521.428.254.84
15246.751.418.575.03
20245.921.418.925.24
25245.021.409.295.46
Table 4. Mixed fuel components.
Hydrogen-Enriched Natural Gas Componentsf(H2)
0.000.050.100.150.200.25
CH4 (%)96.0091.2086.4081.6076.8072.00
N2 (%)2.001.901.801.701.601.50
C2H6 (%)1.921.821.731.631.541.44
C3H8 (%)0.080.080.070.070.060.06
H2 (%)0.005.0010.0015.0020.0025.00
Table 5. Quantitative error comparison of key parameters.
Grid Density (Number of Cells)Peak Temperature Error (%) (Relative to Fine Grid)Radial Velocity Error (%) (Relative to Fine Grid)NO Mole Fraction Error (%) (Relative to Fine Grid)CO Mole Fraction Error (%) (Relative to Fine Grid)Grid Density (Number of Cells)Peak Temperature Error (%) (Relative to Fine Grid)
0.69 × 1063.84.55.24.90.69 × 1063.8
0.85 × 1060.91.81.51.20.85 × 1060.9
1.13 × 10⁶ (Fine Grid)0 (Reference)0 (Reference)0 (Reference)0 (Reference)1.13 × 10⁶ (Fine Grid)0 (Reference)
Disclaimer/Publisher’s Note: The statements, opinions and data contained in all publications are solely those of the individual author(s) and contributor(s) and not of MDPI and/or the editor(s). MDPI and/or the editor(s) disclaim responsibility for any injury to people or property resulting from any ideas, methods, instructions or products referred to in the content.