Abstract
As a key type of hydro-turbine unit in China, the Kaplan turbine plays a significant role in the national energy portfolio. Nevertheless, being a rotating machine, it unavoidably leaves a tip clearance between the runner blade tip and the chamber wall, which strongly disturbs the internal flow field. Based on experimental data, this study conducts numerical simulations to investigate how the blade-tip clearance affects the runner flow under various guide-vane openings and operating conditions. The results reveal that the leakage flow markedly modifies both the pressure and velocity distributions on the blades; however, its influence is weakest at the on-cam (combined) operating point. Frequency analysis shows that the pressure pulsation in the clearance region is dominated by 1 fn and 2 fn components, indicating that leakage vortices and runner rotation are the main sources of blade-tip pressure fluctuations. The findings provide valuable guidance for improving the economic efficiency, safety, and stable operation of Kaplan turbine units.
1. Introduction
Hydropower is a clean, zero-carbon, and renewable energy source. Compared with fossil fuels, it can significantly reduce emissions, save energy, and alleviate air pollution. Moreover, it offers high efficiency, low generation cost, mature technology, flexible start/stop, and rapid response to peak-load and frequency regulation; consequently, it has become the first-choice energy worldwide [1]. China leads the global small-hydro sector, accounting for 51% of world installed capacity below 10 MW and 29% of the total technical potential [2]. Kaplan turbines are therefore essential for exploiting this distributed resource. At the same head and output, Kaplan units are more compact and run at higher speed than Francis or Pelton alternatives [3,4]. Being rotating machinery, however, they unavoidably require a tip clearance between the runner blade tip and the chamber wall. The resulting leakage flow disturbs the mainstream, excites pressure pulsations, reduces efficiency, and may endanger stability [5,6]. Accurate resolution of the clearance flow is thus a prerequisite for high-efficiency, reliable operation.
To date, both experimental and numerical approaches have been employed to investigate Kaplan turbine stability. Experiments are widely adopted because of their inherent credibility [7,8,9]. Using laser Doppler anemometry, Amiri et al. [10] quantified the velocity field in the blade-tip and rim clearances under on-cam and off-cam conditions. Motycák et al. [11] applied PIV to compare the flow in a straight-end and a reshaped draft tube, demonstrating that the latter markedly improved the velocity profile, overall efficiency, and stability. Matsunuma et al. [12] utilised LDV at low Reynolds numbers to obtain mean and instantaneous velocities and turbulence intensities; they observed that the rotor rotation distorted the nozzle-wake and secondary vortices, and that strong interaction between the nozzle and rotor flows occurred within the rotor passage.
With the continuous growth of computing power, CFD is increasingly used as a complementary, or even alternative, tool [13,14,15]. Chen et al. [16] performed a numerical performance study of a low-head Kaplan turbine in which the gravity term was retained; they analysed its influence on streamlines, blade pressure distribution and head-loss in each component. Mohamed Murshid Shamsuddeen et al. [17] focused on tip-clearance cavitation, describing the formation physics of the tip-leakage vortex (TLV) and the attached cavity under three high-flow conditions. Dreyer et al. [18] examined the effect of clearance width on TLV trajectory and strength, concluding that even small changes in gap size can significantly alter the vortex core. Rivetti et al. [19] investigated the interaction between the blade channels and other turbine components; pressure histories recorded downstream of the guide vanes and at the draft tube inlet were used to validate their simulations. Hu et al. [20] carried out a numerical campaign for different runner eccentricities, analysing pressure-pulsation characteristics and axial thrust across a wide range of operating points.
However, the unique T-shaped spiral case and the on-cam operating strategy of Kaplan turbines render the internal flow highly three-dimensional and unsteady; tip-clearance effects are therefore more intricate than in other hydraulic machines. Accurate CFD is thus indispensable for revealing the underlying leakage mechanisms. In the present work, numerical simulations are coupled with scale-model tests to investigate clearance flow in a low-head Kaplan unit. By systematically varying guide-vane opening, blade angle, and unit speed, the influence of the blade-tip/scroll gap on runner velocity and pressure fields is quantified, enabling the selection of operating points with minimal disturbance. The findings provide a reliable basis for improving both the economic performance and the stable, safe operation of small-scale Kaplan power plants. This study primarily investigates the effects of varying unit rotational speeds, guide-vane openings, and blade angles on the flow characteristics within the clearance of Kaplan turbines, as well as their pressure-pulsation characteristics. This research aims to identify optimal operating conditions for the stable operation of Kaplan turbines. It holds significant practical importance for enhancing the economic efficiency, safety, and stable operation of power generation units.
2. Numerical Methodology
2.1. Computational Model of the Turbine
The computational domain replicates a model-scale Kaplan turbine whose spiral case features an innovative T-shaped cross-section and two additional piers compared with a conventional concrete casing. This configuration markedly improves the flow pattern, reduces local hydraulic losses and equalises the circumferential load. Similarly, the draft tube is equipped with twin piers to enhance the outlet flow, thereby contributing to a higher overall efficiency. Main design parameters are listed in Table 1. During modelling the real water-passage geometry was followed strictly to preserve every detail; the five constituent blocks—spiral case, stay vanes, guide vanes, and runner and draft tube—are shown in Figure 1a, while the runner assembly with the 0.4 mm tip clearance is detailed in Figure 1b.

Table 1.
Main design parameters of a Kaplan turbine.
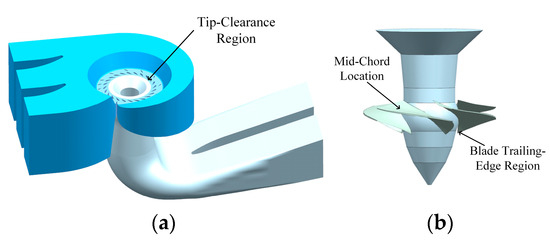
Figure 1.
Kaplan turbine model. (a) Full-flow-passage computational domain of the Kaplan turbine. (b) Runner model of the Kaplan turbine.
2.2. Mathematical Model
Mass-conservation equation:
The law of mass conservation requires that the mass entering and leaving a control volume per unit time be equal. In the present study water is treated as incompressible, so the continuity equation reduces to
where t is time, uᵢ the i component of velocity, and the Einstein summation convention is used.
Momentum conservation:
Momentum conservation states that the rate of change of momentum of a fluid particle is equal to the sum of all forces acting on it. The equation is expressed as:
where p denotes the static pressure, ρ is the fluid density, ν is the kinematic viscosity coefficient, f represents the body force per unit mass, and subscripts i and j indicate tensor coordinates (following Einstein summation convention).
The RNG k–ε turbulence model is a widely adopted approach for studying Kaplan turbines, proposed by Yakhot and Orszag, which is derived by renormalizing the eddy-viscosity coefficient of the standard k–ε model; it explicitly incorporates the effects of mean strain-rate on the turbulence field. While the production and destruction terms remain formally identical to those of the standard formulation, their coefficients are systematically modified through the RNG procedure, yielding improved predictions for flows with high streamline curvature, separation, and strong pressure gradients.
The transport equations for k and ε in the RNG k–ε model are, respectively, as follows:
In the RNG k–ε model the effective viscosity μeff is systematically modelled rather than being treated as a constant; the ε-equation is also recalibrated.
For high-Reynolds-number turbulence the renormalisation analysis gives:
In the RNG k–ε model an additional term R is introduced in the ε-equation to account for non-equilibrium strain effects. Its expression is:
where η = Sk/ε, η0 = 4.38, and β = 0.012.
With the corrected k and ε terms, the updated transport equations of the RNG k–ε model read as the following:
The turbulence-model constants are as follows:
To validate the effects of different turbulence models on impulse turbines, numerical simulations were conducted using the Standard k-ε, RNG k-ε, and SST k-ω turbulence models. The simulation results are presented in Table 2.

Table 2.
Comparison of different turbulence models.
Based on the analysis of the above table, the RNG k-ε turbulence model exhibits the smallest relative error, thereby validating the accuracy of the numerical simulations.
2.3. Grid Generation and Independence Verification
Before computation, the entire water passage is decomposed into a multitude of small control volumes, each governed by the flow equations, so that the global flow field can be obtained through coupling. Structured grids can capture geometric features with fewer cells while maintaining orthogonality and quality; they are also generated faster and allow boundary conditions to be imposed easily, markedly shortening both pre-processing and subsequent numerical solution times. Since the dominant flow in the present investigation develops essentially along the structural directions, structured grids are particularly advantageous for maintaining high orthogonality and reducing numerical diffusion. Consequently, the whole passage is discretised with structured hexahedral cells; the resulting grid is shown in Figure 2, Figure 3 and Figure 4.
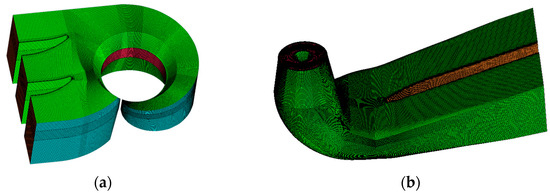
Figure 2.
Spiral casing and draft tube channel grid. (a) Spiral casing; (b) Draft tube.
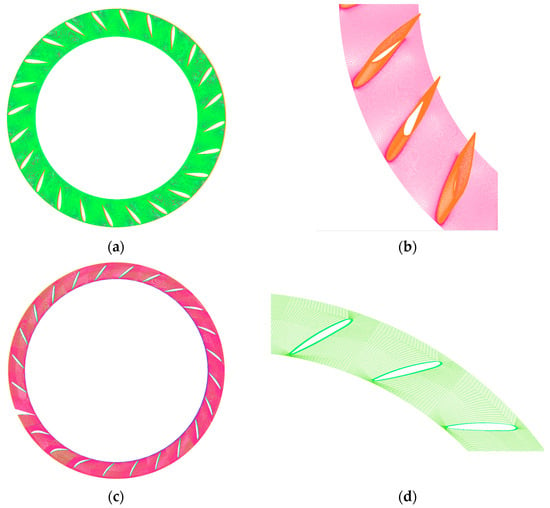
Figure 3.
Stay-vane and guide-vane tube channel grids. (a) Stay vane; (b) Details of the stay-vane grid; (c) Guide vane; (d) Details of the guide-vane grid.
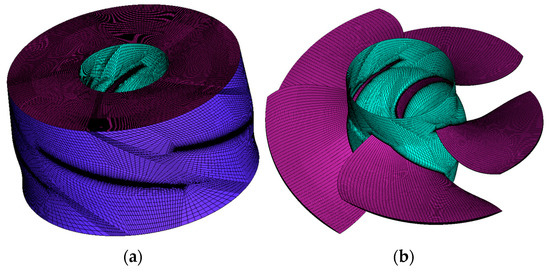
Figure 4.
Runner channel grid. (a) Runner; (b) Details of the runner grid.
A finer mesh does not necessarily guarantee higher accuracy. To identify the threshold beyond which further refinement no longer influences the solution, a grid-independence study was performed with overall turbine efficiency as the criterion. Nine structured grids—2.18, 3.64, 4.75, 5.82, 6.23, 7.85, 8.13, 9.46, and 10.23 million cells—were generated and evaluated at the on-cam operating point (blade angle 0°, guide-vane opening 28°). As shown in Figure 5, once the cell count exceeds 8.13 million the computed efficiency varies by less than 0.5% (★), and additional refinement produces negligible change. Consequently, the grid system with 8.13 million elements and 7.89 million nodes was adopted for all subsequent computations; the distribution among components is listed in Table 3.
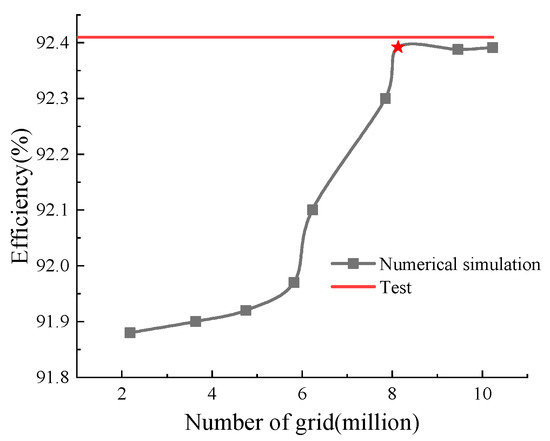
Figure 5.
Grid independence validation.

Table 3.
Count of the number of regional mesh.
2.4. Boundary Conditions and Time-Step Independence
The simulations were performed with the commercial CFD solver which is widely used for turbomachinery applications. A total-pressure condition was imposed at the spiral-case inlet, while a static-pressure condition was set at the draft tube outlet; rotor–stator coupling was accomplished by the General Grid Interface (GGI). For the steady stage, “None” was selected for stationary–stationary connections and the Frozen Rotor approach for stationary–rotating interfaces; convergence was declared when the RMS residuals of all conservation equations fell below 1 × 10⁻⁴.
Unsteady computations were subsequently carried out to capture pressure pulsations. To balance temporal resolution and computational expense, a time-step independence study was conducted. Three step sizes corresponding to 0.5°, 1°, and 3° of runner rotation were tested (Δt = 6.667 × 10⁻⁴ s, 1.333 × 10⁻³ s, and 4.0 × 10⁻³ s, respectively). Figure 6 compares the temporal signals of a monitor point on the runner at rated operating conditions. All three steps yield identical trends, but the 3° step slightly over-predicts the pressure amplitude, whereas the 0.5° and 1° steps give almost identical results. Consequently, the 1° step was chosen as the optimum. For all unsteady runs the RMS residual was required to drop below 1 × 10⁻⁵ to ensure solution accuracy.
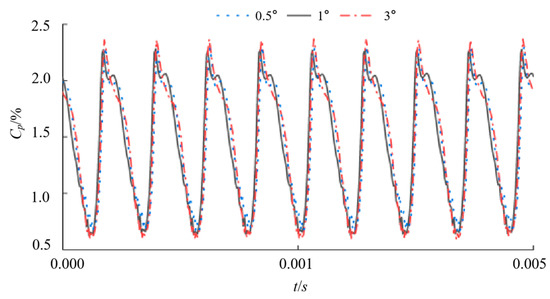
Figure 6.
Time step independence validation.
2.5. Experimental Validation
All experiments were conducted on the closed-loop test rig of the Key Laboratory of Fluid and Power Machinery, Ministry of Education, at Xihua University. The main components of the Kaplan turbine model facility include a high-pressure tank, the turbine test section, and a low-pressure tank. Figure 7 shows the Kaplan turbine test section, and Figure 8 presents a schematic diagram of the entire test-loop system.
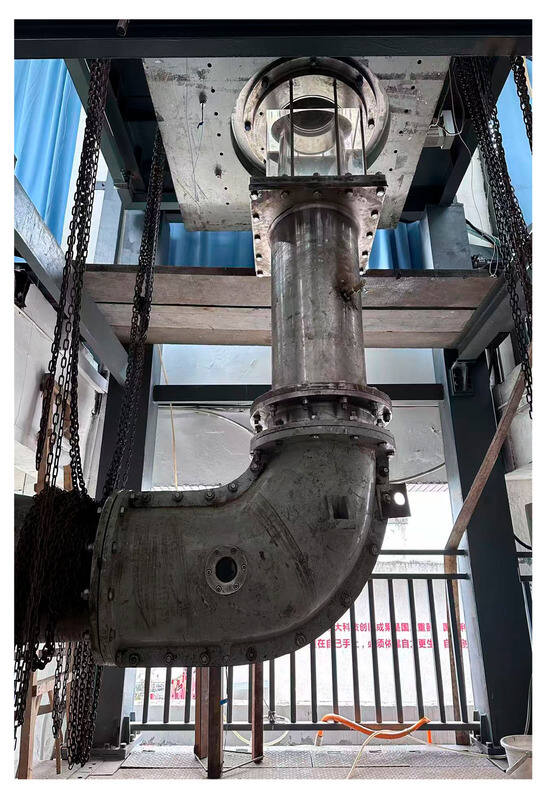
Figure 7.
Schematic diagram of the test section of the model Kaplan turbine.
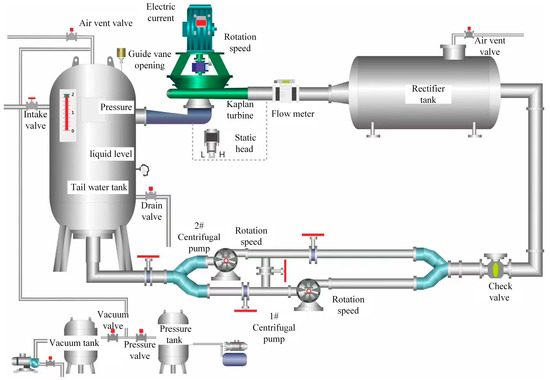
Figure 8.
Bench system.
The key components of the turbine were manufactured using CNC machining, strictly ensuring that the flow passage conditions conform to the design requirements. The structural materials of the turbine are made of stainless steel. However, to observe the internal flow patterns and cavitation phenomena in the turbine runner, the runner chamber section was replaced with transparent organic glass instead of stainless steel. Transparent test windows were installed on the organic glass part of the runner chamber to facilitate measurements of flow velocity and other parameters within the chamber.
During the model manufacturing process, the dimensional accuracy was strictly controlled, with relevant quality inspectors checking the dimensions, including the spiral case, draft tube, guide vanes, and assembly relationships. This ensured that the dimensional deviations of the model turbine did not exceed the tolerances specified by the standard.
The measurement system used during the model testing is crucial to the success of the model tests. The various measuring devices on the test rig were connected according to the requirements of the test operating conditions. The key parameters measured during the performance tests primarily include flow rate measured by an electromagnetic flowmeter, head measured by a differential pressure sensor, blade torque measured by a torque sensor/torquemeter, and draft tube pressure measured by an absolute pressure sensor. Prior to conducting the performance tests, all instruments and equipment used during the testing process were calibrated to ensure the accuracy of the final test results.
During the testing process, the entire experiment was primarily controlled through the workstation system. Changes in the test operating points were achieved by adjusting the pump speed to set the test head and adjusting the turbine speed to achieve the set speed for different conditions. The guide-vane opening for different conditions was adjusted using the guide-vane opening controls on the test control system. Adjusting the blade angle, however, due to simplifications in the model test rig, required dismantling the runner after completing all test points for one blade angle, adjusting the blade angle using a blade angle setting device, and then reinstalling it into the turbine. When the operating point was set on the computer control interface, the acquisition period was set to 20 s. The data collected over this 20 s period were time-averaged to obtain all the necessary data for calculating efficiency. During this test, the operating speed range of the model turbine was selected to be 120–190 r/min, and the unit discharge range was 500–2200 L/s.
The numerical results were compared with the experimental data to verify the accuracy of the simulations. Figure 9 shows the comparison between the computed and measured flow rates (Q) and unit speeds (n11) at the on-cam operating points for various guide-vane openings with the blades fixed at 0°. Good agreement confirms that the CFD model is reliable for subsequent analyses. There are reasons for discrepancies between numerical predictions and experimental data at certain operating points: actual water bodies may contain trace amounts of bubbles or impurities, whereas simulations treat water as pure and incompressible, neglecting potential effects such as cavitation and multiphase flow. Although computational models strictly replicate physical systems, experimental models incorporate real-world factors like manufacturing tolerances, assembly clearances, and surface roughness—elements difficult to fully replicate in numerical models. With efficiency variation below 0.5% after 8.12 million mesh elements, the requirement is met, validating the accuracy of the solution.
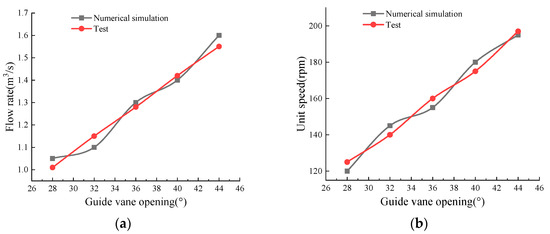
Figure 9.
Calculated and tested validation charts. (a) Flow rate comparison; (b) Unit speed comparison.
3. Investigation of the Flow Field Within the Blade-Tip Clearance of a Kaplan Turbine
To minimise leakage effects, the clearance is set to ≤1 ‰ of the runner nominal diameter D1 at the design stage. For the present model (D1 = 400 mm) the radial gap is therefore fixed at 0.4 mm. All computations are performed at the laboratory head of 3 m and cover the representative operating envelope: unit speeds n11 = 120, 130, 140, and 150 r/min; guide-vane openings α = 28–44° (2° increment); and blade angles φ = 0° and 8°, providing a comprehensive assessment of tip-clearance leakage on turbine performance.
3.1. Influence of the Tip Clearance on the Runner Flow Field Under Different Operating Conditions
Figure 10 and Figure 11 present the velocity vectors within the tip clearance at various operating points, and Figure 12 shows the corresponding streamline patterns; the leakage flow is clearly visible.
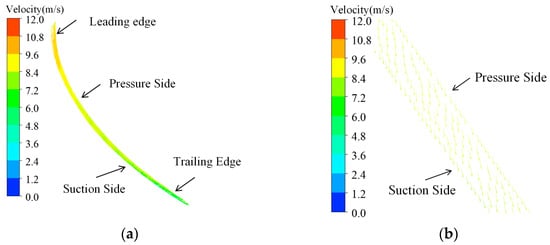
Figure 10.
Speed vector diagram in runner clearance. (a) Velocity-vector plot in the tip-clearance region. (b) Partial enlarged detail. (φ = 0°, α0 = 30°, n11 = 130 r/min).

Figure 11.
Speed vector diagram in runner clearance. (a) Velocity-vector plot in the tip-clearance region. (b) Close-up view at mid-chord location. (c) Close-up view near blade trailing-edge region. (φ = 8°, α0 = 38°, n11 = 140 r/min).
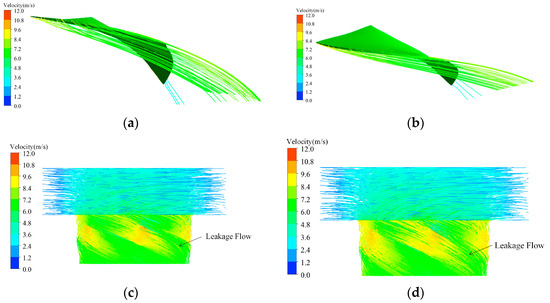
Figure 12.
Streamline diagram in runner clearance. (a) φ = 0°, α0 = 30°, n11 = 130 r/min; (b) φ = 8°, α0 = 38°, n11 = 140 r/min; (c) φ = 0°, α0 = 30°, n11 = 130 r/min; (d) φ = 8°, α0 = 38°, n11 = 140 r/min.
This reversal of leakage flow direction can be attributed to a shift in the local pressure gradient between the pressure side (PS) and suction side (SS). Under low flow conditions, the global pressure difference from PS to SS dominates, driving the leakage flow from PS to SS along the entire chord. However, at high flow rates and specific blade angles, the flow dynamics in the passage change significantly. The increased discharge enhances the centrifugal forces and the development of a passage vortex, which alters the local pressure distribution. In the rear part of the blade, the combined effect of the main passage vortex and the tip-leakage vortex (TLV) can create a local low-pressure zone on the pressure side near the trailing edge. This locally reverses the pressure gradient, prompting a back-flow from the suction side to the pressure side. This mechanism is similar to the ‘pressure-driven’ cross-flow observed in turbomachinery tip clearances under off-design conditions.
The velocity vectors show that, at small blade angles and low flow rates, the tip-leakage flow consistently runs from the pressure side to the suction side along the entire blade length. Once the flow rate exceeds a certain threshold, the front part of the blade retains this direction, whereas the rear part reverses, with fluid now migrating from the suction side back to the pressure side. To clarify the evolution of this reversed leakage and its accompanying vortex system, the runner was sliced along the ZX plane through its centre (Figure 13), and the vorticity distribution and development of vortical structures on this plane were examined in detail.
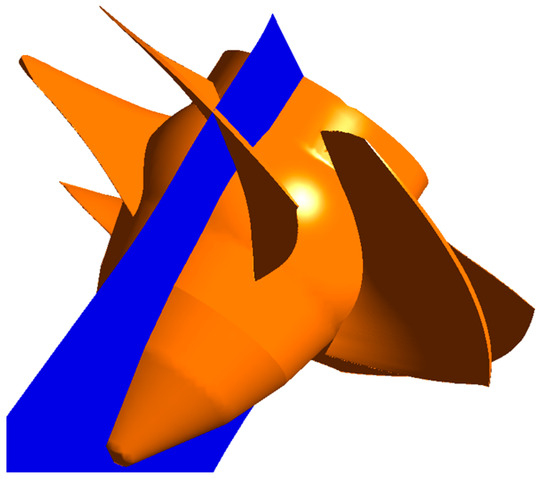
Figure 13.
Schematic of cross-section position.
The inverse relationship between vorticity and efficiency is fundamentally linked to the entropy generation caused by the tip-leakage vortices. The TLVs are regions of intense shear and turbulence, where the ordered kinetic energy is dissipated into heat and turbulent fluctuations, resulting in hydraulic losses. The ‘on-cam’ condition represents the optimal match between the guide vane and runner blade angles, which minimises flow incidence angles and the strength of secondary flows, including the TLV. As a result, the generation and intensity of the TLV are suppressed, leading to minimal entropy production and thus highest efficiency. Conversely, off-cam operations cause flow mismatching, which amplifies the secondary flows and strengthens the TLV, thereby increasing entropy generation and reducing efficiency (Figure 14).
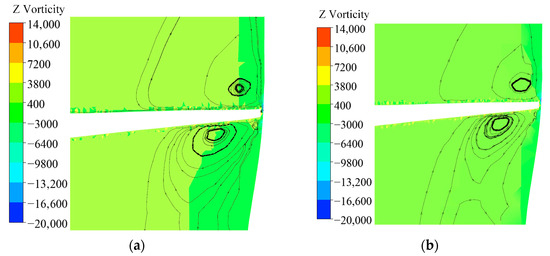
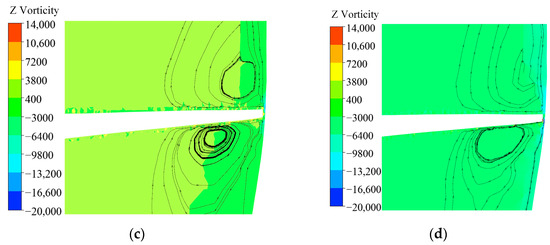
Figure 14.
Vortex diagram. (a) φ = 0°, α0 = 28°, n11 = 130 r/min; (b) φ = 0°, α0 = 30°, n11 = 130 r/min; (c) φ = 0°, α0 = 32°, n11 = 130 r/min; (d) φ = 0°, α0 = 34°, n11 = 130 r/min.
Figure 15 presents the pressure distribution on the pressure and suction sides of the Kaplan runner blades under various operating conditions. Several distinct regions can be identified whose pressure patterns vary markedly with the operating point: the pressure-side leading-edge zone A, the suction-side leading-edge zone B, and the blade-tip region C.
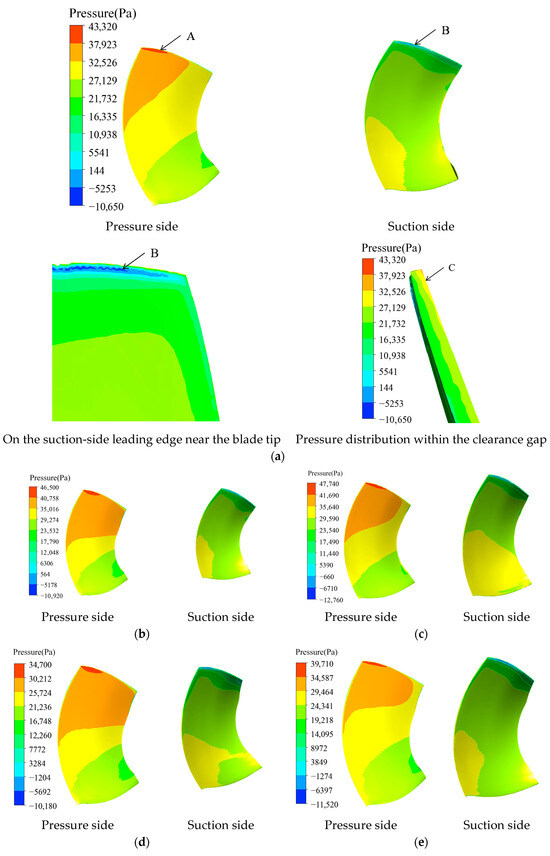
Figure 15.
The diagram of blade pressure distribution for different flow rates. (a) φ = 0°, α0 = 28°, n11 = 130 r/min; (b) φ = 0°, α0 = 30°, n11 = 130 r/min; (c) φ = 0°, α0 = 30°, n11 = 140 r/min; (d) φ = 8°, α0 = 36°, n11 = 110 r/min; (e) φ = 8°, α0 = 36°, n11 = 130 r/min.
At a blade angle of 0°, increasing the guide-vane opening from 28° to 30° causes the static pressure on the pressure side to rise continuously from hub to tip; the leading edge exhibits high values, and a local high-pressure patch appears at the tip adjacent to the clearance gap. Owing to the clearance, a local low-pressure zone develops on the suction side at the leading-edge region B, while the very tip of the blade head displays an irregular pressure pattern with alternating high- and low-pressure spots induced by the leakage flow.
For the operating point with 8° blade angle, 36° guide-vane opening, and unit speed n11 = 110 r/min, the pressure distribution on the suction side is noticeably non-uniform. When n11 is raised to 130 r/min the machine is at the on-cam condition and the pressure field becomes much more regular; as the unit speed (and therefore the discharge) is increased further, the extent of high-pressure regions on both pressure and suction surfaces diminishes.
Under low-discharge, low-speed conditions the turbine throughput is small, so the leakage flow rate through the tip clearance is also low and its influence on the blade pressure field is weak. As the turbine flow increases the clearance leakage increases correspondingly and the pressure distribution is more strongly affected. At small flows the leakage velocity is directed from the pressure side to the suction side along the whole chord, but once the flow exceeds a certain value the direction reverses over the lower part of the blade: the upper half of the clearance still shows pressure-to-suction leakage, whereas the lower half exhibits suction-to-pressure back-flow.
To quantify how the tip clearance disturbs the runner flow, a systematic numerical campaign was conducted over a wide operating range, focusing on velocity patterns on the pressure and suction sides. Figure 16 presents typical velocity contours: pressure side on the left, suction side on the right; the evolution of clearance leakage and its modulation of local velocity are clearly visible.
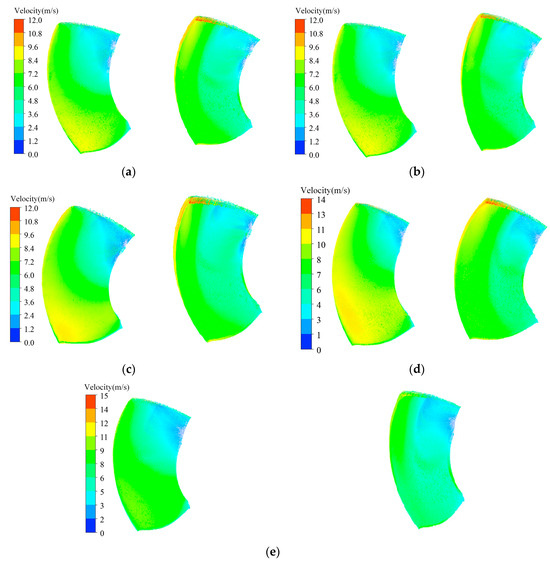
Figure 16.
The diagram of flow distribution. (a) φ = 0°, α0 = 28°, n11 = 130 r/min; (b) φ = 0°, α0 = 30°, n11 = 130 r/min; (c) φ = 0°, α0 = 30°, n11 = 140 r/min; (d) φ = 8°, α0 = 36°, n11 = 130 r/min; (e) φ = 8°, α0 = 36°, n11 = 150 r/min.
At φ = 0° (small blade angle) and low guide-vane opening and unit discharge, vortices appear near the hub on both blade surfaces. On the pressure side the vortex is stronger and its axis is almost normal to the blade surface, departing markedly from the mainstream-wise direction and therefore causing considerable disturbance. A weaker vortex of smaller size is also observed on the suction side, so its influence is less severe.
Keeping blade angle and opening fixed while increasing unit speed enlarges both the size and strength of the pressure-side hub vortex. Conversely, for the same speed, raising the guide-vane opening reduces the hub vortices on both surfaces. Likewise, increasing the blade angle itself diminishes the hub vortices. As discharge continues to grow the hub vortices on both the pressure and suction sides shrink progressively and finally almost disappear.
3.2. Blade-Surface Pressure Pulsation in the Tip Clearance Under Different Operating Conditions
To quantify how clearance leakage affects the blade’s transient loading, five equally spaced pressure monitor points were placed along the flow direction within the tip-gap region from leading to trailing edge (Figure 17). Their pressure fluctuation histories extracted from the unsteady simulations are used to evaluate, in a quantitative manner, the dynamic impact of gap flow on the blade pressure distribution under various operating conditions.
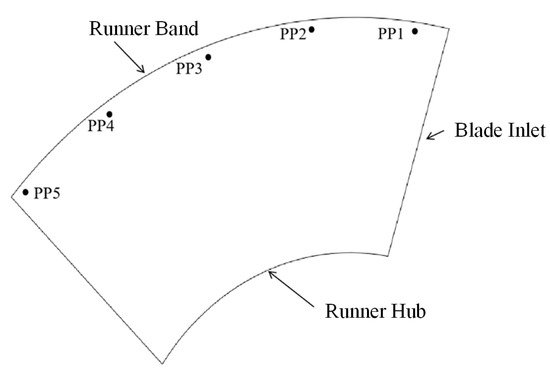
Figure 17.
Pressure pulsation monitoring point location diagram.
The pressure data recorded at the tip-clearance monitor points were post-processed; the amplitude of pressure pulsation is expressed by the pressure-pulsation coefficient Cₚ, defined as the following:
where Cp—pressure coefficient, %; pi—instantaneous pressure at point i, Pa; —time-averaged pressure over the sampling period, Pa; and H—net head, m.
After obtaining the pressure-pulsation coefficient, the time-domain signals were transformed into the frequency domain by Fast Fourier Transform (FFT) to further investigate the influence of the runner tip clearance on pulsation amplitude. Figure 18 presents the time history of Cp at monitor point PP1 (pressure-side, leading-edge) for three guide-vane openings at a blade angle of 0°; the signal is plotted from t = 1 s. All three traces exhibit clear periodicity and almost identical waveform shapes. It can be seen that the maximum values are all around 1, indicating the stability of the results. Among them, the 30° opening yields the smallest peak-to-peak amplitude of Cp, indicating the weakest pressure fluctuation at this on-cam operating point.
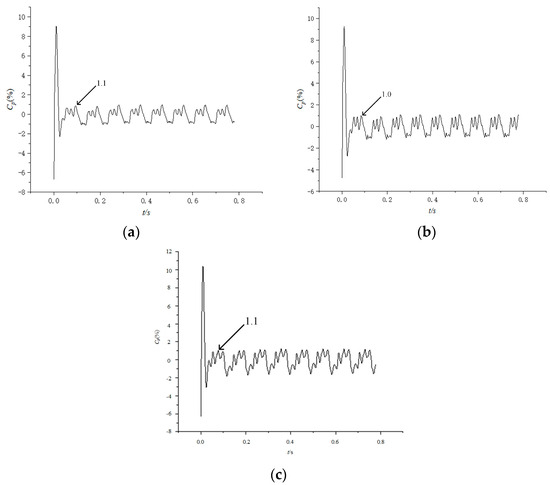
Figure 18.
Pressure fluctuation at monitor PP3 for different flow rates. (a) φ = 0°, α0 = 28°, n11 = 130 r/min; (b) φ = 0°, α0 = 30°, n11 = 130 r/min; (c) φ = 0°, α0 = 32°, n11 = 130 r/min.
The time-domain pressure signals used for the frequency analysis were obtained from the unsteady simulations. To perform the Fast Fourier Transform (FFT), the following parameters were applied:
Sampling Frequency: Corresponding to a sampling interval (Δt) of 1.333 × 10⁻³ s. This is consistent with the unsteady calculation time step of 1° of runner rotation, as established in Section 2.4. Signal Length and Duration: The analysis was performed on a time series spanning 1.0 s of physical time after the flow had reached a statistically stable periodic state. This duration was chosen to ensure adequate frequency resolution while capturing a sufficient number of flow cycles for reliable averaging. Number of Samples (N): With the given sampling frequency and duration, the total number of data points per signal was N = 750. Frequency Resolution (Δf): The frequency resolution, determined by Δf = fs/N. This resolution is sufficient to clearly distinguish the fundamental runner frequency and its lower-order harmonics, which were the primary focus of this study.
To investigate how the tip clearance influences pressure pulsation on the blade pressure side near the runner rim, the time-domain Cp signals recorded at each monitor point under various operating conditions were converted into the frequency domain by Fast Fourier Transform (FFT), as shown in Figure 19. The dominance of the 1 fn and 2 fn components in the pressure spectra can be attributed to two main physical mechanisms. The fn component is primarily associated with the potential effect of the blades passing fixed points and the periodic disruption of the leakage vortex as each blade rotates through the non-uniform pressure field created by the stay and guide vanes. The fn component, and higher harmonics, are directly linked to the periodic shedding and interaction of the Tip-Leakage Vortices (TLVs). As the TLV is convected downstream, it interacts with the main flow and adjacent blades, generating oscillations at twice the rotation frequency and beyond. The fact that higher harmonics are more prominent in the leading and mid-chord regions (PP1–PP3) indicates that the TLV is generated and undergoes its initial development in these areas, characterised by strong vortex shedding and breakdown. In contrast, the trailing-edge region (PP4 and PP5) is dominated by the 1 fn component because the TLV has either dissipated or moved away from the blade surface, leaving the rotational potential effect as the primary influence. In contrast, the spectra for PP4 and PP5 are dominated almost exclusively by 1 fn; higher harmonics are negligible. This indicates that the leakage vortex affects pressure pulsation mainly in the leading-edge and mid-chord regions of the blade tip, whereas the trailing-edge region is practically free of clearance-induced pulsation. It can be seen that the maximum value is 0.44, indicating the stability of the results.
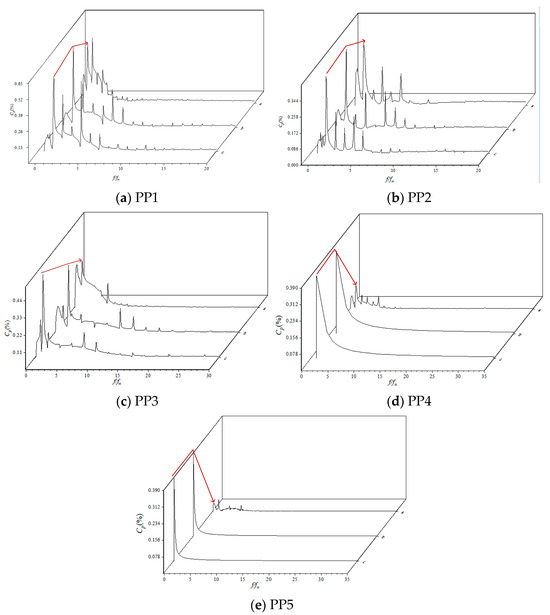
Figure 19.
Frequency spectra of pressure fluctuation. ((a) φ = 0°, α0 = 28°, n11 = 130 r/min. (b) φ = 0°, α0 = 30°, n11 = 130 r/min. (c) φ = 0°, α0 = 32°, n11 = 130 r/min).
4. Conclusions
This paper quantifies the influence of the blade-tip clearance on the internal flow of an axial-flow Kaplan turbine operating under on-cam conditions, delineates the extent and intensity of clearance-induced disturbances, and provides a scientific basis for future optimum design of such units. The main findings are summarised as follows:
- The tip clearance alters the local flow direction at the blade tip. At low discharge the leakage runs from the pressure side to the suction side, whereas at high discharge the rear part of the gap experiences a reverse flow from the suction side back to the pressure side.
- Under on-cam operation the blade pressure distribution is the most uniform, the turbine efficiency reaches its maximum, and the hub-corner vortices attain their minimum strength.
- Pressure-pulsation analysis shows that the peak Cp in the clearance region is about 1. The frequency spectrum is dominated by 1 fn and 2 fn, indicating that rotor rotation and clearance-leakage vortices are the main sources of blade-tip pressure fluctuation. The influence of these vortices is confined to the leading-edge and mid-chord portions of the tip clearance; the trailing-edge region is practically free of clearance-induced pulsation.
Author Contributions
Conceptualization, Z.L. (Zhenming Lai); Data curation, H.J.; Formal analysis, Z.L. (Zhen Li), J.L., Z.H. and K.X.; Investigation, Z.L. (Zhenming Lai) and Z.L. (Zhen Li); Methodology, X.L.; Project administration, X.L.; Resources, Z.L. (Zhenming Lai) and H.J.; Software, Z.L. (Zhen Li), J.L., Z.H. and K.X.; Supervision, Z.L. (Zhenming Lai); Validation, H.J.; Writing—original draft, Z.L. (Zhenming Lai), J.L. and K.X.; Writing—Review and Editing, X.L. All authors have read and agreed to the published version of the manuscript.
Funding
This research received no external funding.
Data Availability Statement
The original contributions presented in this study are included in the article. Further inquiries can be directed to the corresponding authors.
Conflicts of Interest
Author Zhenming Lai was employed by the company Power China Hydropower Development Group Co., Ltd. Author Hang Jiang was employed by the company CHN Energy Dadu River New Energy Investment Co., Ltd. Author Zhen Li was employed by Shiqiao Sub-district Office of the People’s Government. The remaining authors declare that the research was conducted in the absence of any commercial or financial relationships that could be construed as a potential conflict of interest.
References
- Wang, Z.; Zheng, Y.; Zhao, Y.; Tao, Y.; Hui, J. Development path and prospects for renewables becoming the dominant energy source under the carbon-neutral vision (Part 1). China Energy 2021, 43, 7–13. [Google Scholar]
- Chen, M. Overview of global small-hydropower development. China Power Enterp. Manag. 2017, 13, 88–89. [Google Scholar]
- Semenova, A.V.; Zakharov, A.V.; Seleznev, V.N.; Chernyshev, V.D. Adaptation of Kaplan Turbines for Operation Under New Conditions of Continuous Control: Secondary Frequency Regulation. Power Technol. Eng. 2025, 1–6. [Google Scholar] [CrossRef]
- Li, J.; Li, J.; Chen, Y.; Jin, H. Preliminary analysis of the causes for the loss of on-cam relationship in Kaplan turbines. Sichuan Water Power 2010, 29, 122–123. [Google Scholar]
- Ma, W.S. Simulation of the Whole Passagein Prototype Turbine and Analysis of Precisionin Calculation; China Agricultural University: Beijing, China, 2005; p. 3. [Google Scholar]
- Hu, Z.; Liu, Q.; Wang, X.; Fang, M.; Chen, T.; Tao, R.; Ding, J.; Zhu, D.; Xiao, R.; Wang, H. Prediction of runner eccentricity and Alford force of a Kaplan turbine based on variational mode decomposition. Energy Sci. Eng. 2024, 12, 1569–1591. [Google Scholar] [CrossRef]
- Zhang, Y.; Chen, T.; Li, J.; Yu, J. Experimental Study of Load Variations on Pressure Fluctuations in a Prototype Reversible Pump Turbine in Generating Mode. J. Fluids Eng. Trans. ASME 2017, 139, 74501. [Google Scholar]
- Yan, D.; Chen, S.; Ren, P.; Zhao, W.; Chen, X.; Liu, C.; Zhou, L.; Wang, Z. Vibration and Flow Characteristics of a 200 MW Kaplan Turbine Unit under Off-Cam Conditions. Machines 2024, 12, 586. [Google Scholar] [CrossRef]
- Ruprecht, A.; Heitele, M.; Helmrich, T. Numerical Simulation of a Complete Francis Turbine Including Unsteady Rotor/Stator Interactions; IAHR: Madrid, Spain, 2000. [Google Scholar]
- Amiri, K.; Mulu, B.; Cervantes, J.M. Experimental investigation of the interblade flow in a Kaplan runner at several operating points using laser doppler anemometry. J. Fluids Eng. 2015, 138, 21106. [Google Scholar] [CrossRef]
- Motycak, L.; Skotak, A.; Obrovsky, J. Analysis of the Kaplan turbine draft tube effect. IOP Conf. Ser. Earth Environ. Sci. 2010, 12, 12038. [Google Scholar] [CrossRef]
- Matsunuma, T. Unsteady Flow Field of an Axial-Flow Turbine Rotor at a Low Reynolds Number. J. Turbomach. 2007, 129, 360–371. [Google Scholar] [CrossRef]
- Pang, J.; Liu, H.; Liu, X.; Yang, H.; Peng, Y.; Zeng, Y.; Yu, Z. Study on sediment erosion of high head Francis turbine runner in Minjiang river basin. Renew. Energy 2022, 192, 849–858. [Google Scholar] [CrossRef]
- Liu, J.; Liu, X.; Chang, X.; Qin, B.; Pang, J.; Lai, Z.; Jiang, D.; Qin, M.; Yao, B.; Zeng, Y. Research on the mechanism of sediment erosion in the bucket of a large-scale Pelton turbine at a hydropower station. Powder Technol. 2025, 455, 120805. [Google Scholar] [CrossRef]
- Liu, J.; Liu, X.; Gang, Y.; Yao, B.; Xie, B.; Pang, J.; Lan, G.; Zhang, X. Study of multiphase flow and sediment erosion of large Pelton turbine bucket in sandy river. Phys. Fluids 2025, 37, 83384. [Google Scholar] [CrossRef]
- Chen, F.N.; Lei, H.M.; Ahn, S.H.; Fan, H.G.; Jiang, X.P.; Hu, J.W.; Zhang, J.; Luo, Y.Y.; Wang, Z.W. Numerical simulation of the performance of a low-head prototype Kaplan turbine. IOP Conf. Ser. Earth Environ. Sci. 2018, 163, 12070. [Google Scholar] [CrossRef]
- Shamsuddeen, M.M.; Park, J.; Choi, Y.-S.; Kim, J.-H. Unsteady multi-phase cavitation analysis on the effect of anti-cavity fin installed on a Kaplan turbine runner. Renew. Energy 2020, 162, 861–876. [Google Scholar] [CrossRef]
- Dreyer, M.; Decaix, J.; Münch, C.; Farhat, M. Mind the gap-tip leakage vortex in axial turbines. IOP Conf. Ser. Earth Environ. Sci. 2014, 22, 52023. [Google Scholar] [CrossRef]
- Rivetti, A.; Lucino, C.; Liscia, S.; Muguerza, D.; Avellan, F. Pressure pulsation in Kaplan turbines: Prototype-CFD comparison. IOP Conf. Ser. Earth Environ. Sci. 2012, 15, 62035. [Google Scholar] [CrossRef]
- Sirojuddin; Tony; Dewi, N.S.; Zahara, A.A.; Jumhur, A.A. Investigation of variation of inner blade height of the five blade runner on the kaplan turbine against turbine power. AIP Conf. Proc. 2024, 2836, 070007. [Google Scholar] [CrossRef]
Disclaimer/Publisher’s Note: The statements, opinions and data contained in all publications are solely those of the individual author(s) and contributor(s) and not of MDPI and/or the editor(s). MDPI and/or the editor(s) disclaim responsibility for any injury to people or property resulting from any ideas, methods, instructions or products referred to in the content. |
© 2025 by the authors. Licensee MDPI, Basel, Switzerland. This article is an open access article distributed under the terms and conditions of the Creative Commons Attribution (CC BY) license (https://creativecommons.org/licenses/by/4.0/).