Abstract
A greenhouse solar dryer was used to study the drying behavior of mesquite pods, and a radiation model for participating media was numerically solved to predict the air temperature in the dryer. The model was solved for a stationary state by considering the environmental conditions. The transfer coefficients were calculated for natural and forced convection. In the case of forced convection, an average airflow of 0.5668 m/s (SD = 0.1121) was provided over the trays. The weight of the pods, their temperature, air temperature, ambient temperature, relative humidity, and solar irradiation were recorded. The average heat transfer coefficients for natural and forced convection were 2.9294 W/m2 °C and 6.3772 W/m2 °C, respectively. The average mass transfer coefficients for natural and forced convection were 0.002987 kg/m2 s and 0.00601 kg/m2 s, respectively. The greenhouse dryer showed a high dependence on the weather conditions, showing important disturbances to air temperature. For the experiment with forced convection, a reabsorption of moisture was observed during the night; nevertheless, the final moisture content of the pods was below 0.05 g moisture/g dry matter, which was convenient for the subsequent grinding process. The radiation model correctly describes the average air temperature in the greenhouse volume. A reduction in thermal fluctuations will be important to improve the process.
1. Introduction
Mesquite trees are abundant in arid and semi-arid regions of the world [1,2,3], and flour for food applications can be obtained from them. Drying is a mandatory process for mesquite pods undergoing grinding because a low moisture content is required for this material [4]. High and intermediate moisture content in food powders result in greater powder cohesion and reduced flowability [5], which leads to a total loss of product. To ensure low moisture content in pods, it is essential to implement a scalable drying process.
Drying is an essential operation for the preservation of agricultural products; however, it consumes a large amount of energy. In industry, drying involves an energy consumption of up to 15% [6]; therefore, sustainable solutions are necessary to improve the performance of these processes. In recent years, greenhouse solar dryers have been studied to dry different foods. This technology absorbs the solar electromagnetic waves and transfers the energy to a moist fluid, creating the greenhouse effect [7]. In greenhouse solar dryers, a larger quantity of moist material can be dried; however, thermal fluctuations reveal high dependence on the environmental conditions. Greenhouse-type dryers are greenhouse structures whose walls are covered with a transparent or translucent material that allows solar radiation to pass through and enables the accumulation of heat inside the chamber [8]. According to [9,10] the variety of plastics and covering materials used in greenhouse-type dryers is essential for controlling internal conditions. These materials are selected primarily for their optical properties (transmissivity at different wavelengths) and thermal properties. The ability to insulate against cold, mechanical strength, material density, and the ability to transmit visible light are some important characteristics for selection. Polyethylene, polyvinyl chloride, glass, and polycarbonate have been used primarily.
Mesquite trees are present in various arid and semi-arid regions of the world, including Oaxaca, Mexico [1,2,4]. Flour can be obtained from the mesquite pods, which contain protein, fiber, sugar, and minerals [11]. These flours have important applications in the food industry and are an alternative food in marginalized communities. To avoid clumping problems during grinding, implementing a drying process is necessary. Sandoval Torres et al. [4] studied the drying process of mesquite pods, using a drying tunnel, controlling the temperature and the speed of air flow. The authors suggest an average drying temperature of 60 °C to reach appropriate final moisture contents. Drying mesquite requires several hours of processing, involving high energy consumption, which is a drawback. Therefore, alternatives that allow the use of clean energy must be investigated.
Greenhouse-type dryers use transparent or translucent covers (plastics, polycarbonates, glass, etc.), which enable the use of thermal radiation, in addition to protecting the products from the exterior elements [12]. It is known that open-air drying (solar or in the shade) has several drawbacks. These include rehydration at night or on rainy days, contamination by dust, insects, or fungi, low quality, and color changes, in addition to the formation of toxic substances due to the reabsorption of moisture from the material [13,14].
In [14] authors presented the drying performance of chilli in a parabolic greenhouse solar dryer (with a floor area of 8 × 20 m) in the climatic conditions of Ubon Ratchathani, Thailand. The authors report maximum air temperatures close to 60 °C when radiation levels were close to 900 W/m2. Natural drying in the sun took 5 days, while greenhouse drying required 3 days. The study conducted by [15] focused on the greenhouse drying of ginger (Zingiber cassumunar Roxb.), which is a food product cultivated in India, Indochina, and tropical Southeast Asia. The authors used a greenhouse dryer with a parabolic roof covered with polycarbonate and a concrete floor. In this experiment, the authors installed nine fans inside the greenhouse. The authors reported that the dryer reached air temperatures between 30 and 50 °C. Likewise, they justify the use of polycarbonate due to its transmissive properties, which are high for short wavelengths and low for thermal radiation.
The authors of [16] also examined the greenhouse solar drying of ganoderma fungi. The dryer uses a ventilation system assisted by photovoltaic cells, and they report a faster drying rate compared to open-air drying. As a cover, they use a 2 mm thick transparent plastic film. The fresh product had an initial moisture content of up to 275% (dry basis). In the dryer, air temperatures oscillated between 30 and 52 °C. The authors found that greenhouse drying accelerates the process and is much better than open-air drying; they also report that the ventilation system improved the drying rate.
Solar irradiation, air temperature, air flow velocity, and relative humidity are the most important parameters that influence greenhouse solar drying. Greenhouses can work in passive and active mode. In passive mode, natural convection generates the slight movement of the airflow (buoyancy effect), and in active mode, an external agent (usually a fan) increases the movement of the airflow inside the chamber. Increasing air velocity can accelerate the removal of moisture from the surface of materials by improving heat and mass transport coefficients. The stratification of air causes the moisture content of the samples at the end of drying to be heterogeneous. Greenhouses allow increasing production capacity and can be installed in sites close to the harvest or collection; however, a disadvantage of these systems is their dependence on the weather, which generates fluctuations and disturbances of the drying parameters [17].
Mathematical models and computer simulations are a powerful tool for analyzing drying processes, but there are few studies applied to greenhouse dryers. In [18], a solar greenhouse dryer with a capacity of 1 ton was studied. The authors used ordinary differential equations to describe the air temperature, product temperature, and concrete floor temperature. The predictions considered unidirectional flow and no stratification of the air in the dryer. In [19], the authors used simulations to predict the average air temperature, reporting that the average air temperature was higher for the forced convection system, which should be discussed, as the intensity of solar radiation should be considered. Ref. [15] analyzed a greenhouse-type dryer specifically designed for drying ginger. In this study, drying kinetics were modeled; however, the authors did not develop simulations for the air temperature in the chamber. The authors of [20] present computational simulations to predict the 3D airflow distribution in a greenhouse. The results showed that installing an air recirculation system into the greenhouse can increase the air velocity in the drying chamber from 0.71 m/s to 1.5 m/s.
Solar drying in a greenhouse has been applied to different products, such as red pepper [21], bananas [22], mushrooms (ganoderma) [16], tomatoes [23], herbs [24], chillies [12], ginger [15], and many other products; however, this is the first report about the greenhouse drying of mesquite pods. Moreover, we present simulations to predict the average air temperature by solving a radiative model for participating media (humid air).
Significant amounts of mesquite trees, which produce large quantities of pods, can be found in the State of Oaxaca and in various arid and semi-arid areas of the world. This work enhances the experimental and theoretical understanding of renewable energy.
2. Methodology
2.1. Experimental Setup
The experiments were carried out in the community of Santiago Suchilquitongo, Etla, (17°14′34″ N) in the central valley region of Oaxaca, Mexico. A greenhouse-type solar dryer with polycarbonate walls (transmissivity = 92%) and roof was used (Figure 1 and Figure 2). Inside the dryer, four drying trays were placed (0.85 m × 0.75 m); each tray has wooden frames and plastic meshes. An exhaust fan of 5 watts was located on the ceiling (radius of 0.255 m). A floor fan (diameter = 0.58 m) was placed near the concrete floor to remove the hot air. The concrete base was painted black to increase the absorption of solar radiation (Figure 1).
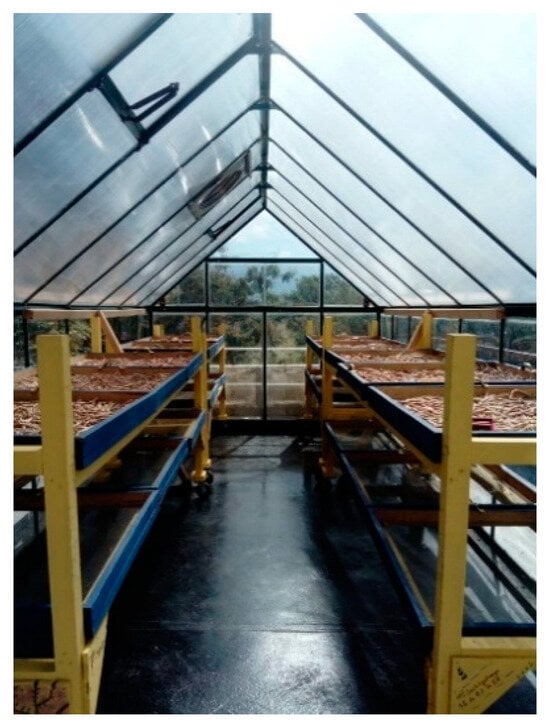
Figure 1.
Greenhouse solar dryer.
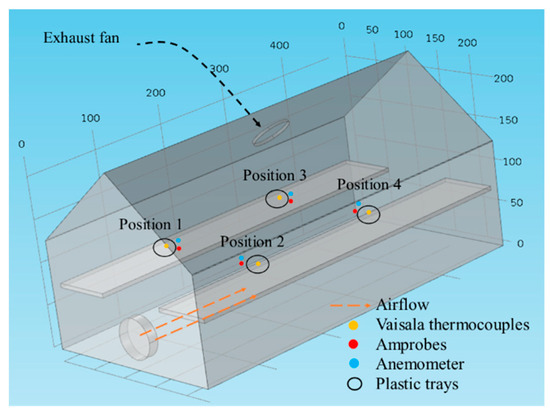
Figure 2.
Dimensions of the dryer and instrumentation.
Mesquite pods were collected in the community of Santiago Suchilquitongo, Oaxaca (Mexico). Pods were sorted and washed on the day of the drying experiment. Pods were washed with clean water and left to drain for 1/2 h before being placed in the dryer. The pods were distributed in 4 trays and placed in a thin-layer arrangement. To record the process variables, the following equipment was used: four VAISALA SP-1416-11V (Finland) temperature sensors to log the temperature of pods (±0.35 °C over −90 to +50 °C, operating range −95 to +70 °C) and four AMPROBE TR200-A loggers to log drying temperature and relative humidity (±0.6 °C for −20 °C to 50 °C; ±5% RH for −10 °C to 60 °C). An EXTECH AN340 anemometer (range 0.5 to 20 m/s, basic accuracy ±3%) was used for measuring airflow velocity. A Kipp & Zonen CMP3 pyranometer (sensitivity 24 to 32 μV/W/m) was used to record solar irradiance (W/m2), and an OHAUS navigator precision balance was used to measure the weight of the pods. To monitor the weight of the pods, four perforated plastic trays were used; four trays were monitored during the experiments. Two types of experiments were carried out, the first one with natural convection and the second with forced convection. In the case of the experiment with forced convection, the floor fan was placed as indicated in Figure 2.
To determine the initial moisture content of the pods, the oven method was used. Pods in ripening stage #3 were used. Random samples were taken and cut into small pieces. The small samples were placed in aluminum containers. The weights of the samples and aluminum containers were recorded. A VWR Scientific 1410 oven (Sheldon manufacturing Inc., Cornelius, OR, USA) with crossflow ventilation and contact heating was used. The oven operated at a temperature of 70 °C under vacuum. The fresh samples were placed in the oven for 24 h. The moisture content of the pods was calculated based on their initial and final weights. Six replicates were performed. The initial and final moisture content of the samples was determined by the following expression
where moisture content, .
weight of the fresh sample, [].
weight of the dry sample, [].
It is important to note that the moisture content of the pods depends on the time of year they were harvested, the region of harvest, the mesquite species, the pretreatment, and storage conditions. Moisture content determinations for each experiment were performed on different days. Likewise, weather conditions differed for each test.
2.2. Experiment with Natural Convection
A total of 19.3 kg of pods was cleaned, washed, and distributed in the trays inside the dryer. Pod temperature and weight were also recorded. AMPROBE sensors record information every 10 min and VAISALA sensors every minute. VAISALA sensors were inserted in the pods. The weight of the samples was recorded every half hour. For each experiment, the drying lasted two days. The data recorded from day 1 corresponds to the monitoring from 10 to 16 h, and the data from day 2 corresponds to the same period. To obtain full kinetics, the data from day 1 and day 2 were merged. The average moisture content of the pods was 0.4302 g moisture/g dry matter.
2.3. Experiment with Forced Convection
For this experiment, 18.67 kg of pods were prepared. The product was also distributed on the trays in a thin layer. The VAISALA sensors were inserted in the pods. An average air flow of 0.5668 m/s (SD = 0.1121) was supplied over the trays. The weight of the samples was recorded every half hour. Air velocity fluctuated throughout the dryer during the experiment, which is common in drying chambers, as stabilizing air flow is a complicated task. The average air speeds recorded in the four sampling zones were as follows: 0.6822 m/s (position 1), 0.6711 m/s (position 2), 0.4512 m/s (position 3), and 0.4478 m/s (position 4). The initial moisture content of pods was 0.2704 g·moisture/g·dry matter.
To analyze the drying curves, the drying kinetics were normalized, and a diffusive model was implemented:
The coefficients were estimated using Excel’s solver based on the experimental data.
2.4. Heat Transfer Coefficients
2.4.1. Natural Convection
The surface temperature of the pods and bulk air temperatures were used to calculate the air film temperature.
where temperature of the film, [°C].
temperature of the solid, [°C].
temperature of the bulk fluid, [°C].
The values of thermal conductivity (k), kinematic viscosity (v), and Prandtl (Pr) were obtained from [25].
The coefficient of volumetric expansion (β) of the air was calculated by assuming it to be an ideal gas, as follows:
According to [25], the characteristic length for a flat plate is calculated as follows:
where characteristic length [m].
area [m2].
perimeter of the plate [m].
The characteristic length of each tray is obtained by considering the area of the tray (0.6375 m2) and the perimeter of the tray (3.2 m). We obtain the properties of the air from [23] by considering the average temperature of the pod and the air surrounding the tray (film temperature).
We calculated the Rayleigh number using the following formula:
where
- acceleration due to gravity, [m/s2].
- coefficient of volumetric expansion, [1/K], ( for ideal gas).
- surface temperature, [°C].
- fluid temperature far enough from the surface, [°C].
- characteristic length of the geometric configuration, [m].
- kinematic viscosity of the fluid, [m2/s].
- Prandtl number [-].
Once the Rayleigh number was calculated, then we can obtain the Nusselt number [25]. When Rayleigh values range between 104 and 107, we used:
From the definition of the Nusselt number, we calculate the heat transfer coefficient (hT):
where Nusselt number, dimensionless.
termal conductivity of the film, [W/m2 °C].
hTnc: heat transfer coefficient for natural convection [W/m °C].
2.4.2. Forced Convection
The fluid motion enhances heat transfer considerably by removing the heated fluid from the surface of products. The film temperature was the average temperature of the pod and drying air, and at this temperature the values of thermal conductivity k, kinematic viscosity, and Prandtl number for the drying air were obtained from [25].
The average airflow velocity in each of the trays was considered; in this way the Reynolds number (Re) was calculated as follows:
where velocity of airflow, [m/s].
characteristic length, [m].
kinematic viscosity of the film, [m2/s].
The Nusselt number was calculated from the correlation for laminar flow, Re < 5 × 10⁵ [25] as follows:
For Pr > 0.6.
From expression (10) it is possible to obtain the heat transfer coefficient [W/m°C] for forced convection.
2.5. Mass Transfer Coefficients
To calculate the convective mass transfer coefficient (), the following expression was used:
where Sherwood number.
mass diffusivity, .
characteristic length, .
To calculate the mass diffusivity, we used the equation provided in reference [26]:
where
- T: moist air temperature in Kelvin (K).
- P: pressure of air [atm].
For the case of natural convection, the following expression for the Schmidt number was used:
- 104 > Gr·Sc < 107.
- Grashof number.
- Schmidt number.
For forced convection on a flat plate, we used the correlation:
For Re < 5 × 10⁵ and Sc > 0.5
where
- Sc: Schmidt number (dimensionless).
- Kinematic viscosity of the fluid, [m2/s].
- Mass diffusivity, [m2/s]
Radiation was excluded from the computing of heat and mass transfer coefficients.
3. Computational Simulation of Heat Transfer for Participating Media
A 3D computational simulation was implemented, considering a radiation model with a participating medium. This model considers mainly the absorption index and scattering of the humid air present in the drying chamber. It also considered the refractive index of the air, the temperature of the pods (considering the thin layer) placed on the trays, the transfer coefficients, and the temperature of the concrete floor. The mathematical model is represented by Equations (16) and (17). The participating media (domain) is affected by the boundary conditions; it means a heat flux is applied in the boundaries of air volume by considering the transmissivity of polycarbonate. We experimentally measured the irradiance that the polycarbonate walls receive. The greenhouse floor imposes temperature conditions at the time of measurement. At different simulation times, the irradiance was identified. The simulation was solved in a steady state, with 114,892 degrees of freedom, plus 19,699 internal elements. A steady-state simulation can be implemented by assuming that average temperature and air flow conditions do not change drastically from one minute to the next; in other words, we are talking about average conditions at a given moment, and then simulations are a representative condition of the system that is validated with experimental information. Likewise, steady-state 3D simulation has proven to be a powerful and efficient tool for evaluating spatial temperature in greenhouse-type systems [20]. For the numerical solution, we used the PARDISO solver, with a relative tolerance of 0.001 and an absolute tolerance of 0.1. The simulation solves the air temperature variable, which was compared to the experimental measurement points.
where
- = density of air [kg/m3].
- = heat capacity of air [J/kg °C].
- = velocity [m/s].
- = the ith discrete ordinate.
- k = absorption coefficient [m−1].
- = extinction coefficient [m−1].
- = the ith component of the radiative intensity.
- = the scattering coefficient [m−1].
- = the ith quadrature weight.
- = scattering phase function [-].
- and = discrete ordinate.
4. Results and Discussion
For the experiment in natural convection, data was recorded from 10:30 to 16:30 h during two consecutive days. The data logging was suspended during the afternoon and night. To observe the complete drying kinetics, the data recorded on day 1 was merged with the data from day 2.
Figure 3 shows the experimental curve and the model for the natural convection experiment. The model correctly reproduces the drying curve. Environmental conditions, which are variable and dependent on the climate, cause fluctuations in the experimental curve. The parameters estimated for this model were as follows: a = −1.38227, k = 0.76166, and b = 0.60061.
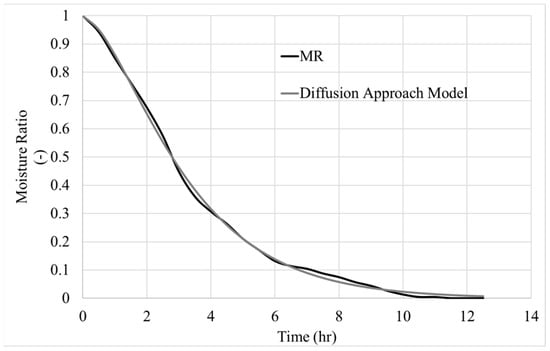
Figure 3.
Diffusion model for experiment with natural convection.
In the case of forced convection, it is important to note that the convection airflow passing through the trays is low, with an average air velocity of 0.5668 m/s (SD = 0.1121). In this experiment, a process of moisture reabsorption was observed after 6 h. This moisture absorption process is explained by the fact that the pods remain in the dryer overnight. This type of problem is recurrent in solar drying systems, especially in greenhouse-type dryers, since this type of process lasts 2–5 days, depending on weather conditions, and during the night, the food remains in the drying chamber. The proposed model (Figure 4) provides a comprehensive description of the drying kinetics. The reabsorption process is not reproduced, as it is an unusual event caused by the nature of the experiment. The parameters estimated for this model were as follows: a = 0.952273, k = 0.462585, and b = 0.
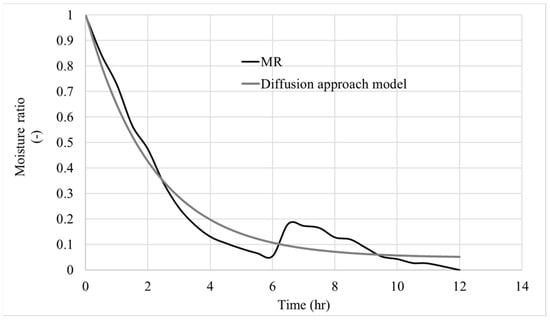
Figure 4.
Diffusion model for experiment with forced convection.
Figure 5 shows the drying kinetics and temperatures for the experiment with natural convection. For a better understanding of the phenomena, the average temperature of the pods and moisture content were also plotted. The initial moisture content of the pods placed in tray 4 showed a higher value compared to the other trays, which is caused by the heterogeneity of the pods. It was also observed that, throughout the drying process, the moisture content of the pods in tray 4 was higher compared to others, and their temperature was lower (dotted line) throughout the experiment. This data is evidence that the temperature distribution presents a stratified air, with small temperature differences developed at different positions. For trays 1 and 4, a slight increase in moisture content was observed at t = 6 h, due to rehydration (reabsorption of moisture) of the samples during the night. This is one of the drawbacks of greenhouse drying, especially when the samples remain for 2–4 days inside the dryer. In addition to the above, it is important to consider that these variations are greater when drying is implemented on rainy days. At night, an increase in RH is usually observed. It is also important to highlight that mesquite pods are a highly hygroscopic food [27]. Despite the slight moisture reabsorption, the drying conditions in the greenhouse facilitate the evaporation of residual moisture during the second day, resulting in a final moisture content of less than 0.05 g of moisture per g of dry matter. This final moisture content is convenient for the subsequent milling process.
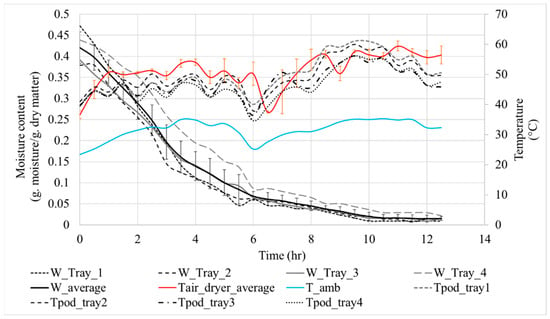
Figure 5.
Drying kinetics and temperatures for the experiment with the natural convection.
Data for the experiment with forced convection is presented in Figure 6. The initial weight of the pods was 18.67 kg. An average airflow of 0.5668 m/s (SD = 0.1121) was supplied over the trays. Figure 6 shows the drying kinetics and temperatures for this experiment. The experiment was also carried out in two days, and the procedure was similar to the experiment in natural convection; nevertheless, in this experiment, a larger perturbation in solar radiation was observed. During the night, the reabsorption of humidity was experimented with due to a significant increase in RH during the night (observe the curve at t = 6:30 h). During this experiment, a more intense adsorption (gray area) was observed due to a significant increase in relative humidity during the night, which is corroborated by the experimental data. There are slight differences between the drying kinetics, most likely due to differences in the distribution of airflow inside the greenhouse. It is well known that inside greenhouses, irregular airflow patterns are formed (stratification of air), for which different authors have addressed the issue [20,28,29]. This issue presents a recurring challenge in dryers, as achieving airflow homogenization is difficult due to several factors, including the geometry and size of the greenhouse, the type and power of the fan, the position of the fan exhaust, the orientation of the greenhouse, the outside air inlets, and the initial pressure. Despite these observations, the greenhouse dryer does provide air conditions to dehydrate the pods. The final moisture content of the samples was below 0.05 g·moisture/g·dry matter, which is convenient for their subsequent grinding.
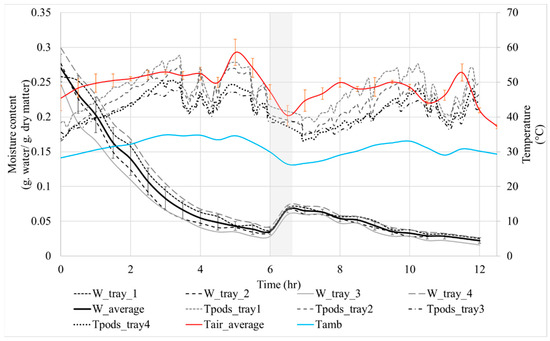
Figure 6.
Drying kinetics and temperatures for the experiment with forced convection.
Table 1 and Table 2 show the calculated heat and mass transfer coefficients. It is observed that the coefficients in the case of forced convection are slightly higher than the transfer coefficients in the case of natural convection, which is caused by an increase in airflow inside the greenhouse.

Table 1.
Mass transfer coefficient, hm.

Table 2.
Heat transfer coefficients.
Figure 7 shows two 3D computational simulations of the air temperature distribution in the dryer at steady state. We perform steady-state simulations considering that average temperature and air flow conditions do not change drastically from one minute to the next; in other words, we are talking about average conditions at a given moment. Likewise, the steady-state 3D simulation has proven to be a powerful and efficient tool for evaluating spatial temperature in greenhouse-type systems [20]. The figure on the left corresponds to a natural convection condition, and the second one to the forced convection condition. The simulations were conducted at various times, considering the experimental conditions of irradiance at time t and ambient temperature Tamb. The numerical data were compared with those recorded by the AMPROBE sensors placed in the different trays. These simulations correctly represent the air heating and facilitate understanding of the model. Experimental air temperature and simulations are presented in Figure 8 and Figure 9.
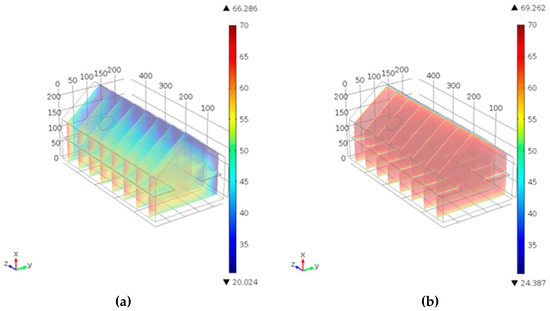
Figure 7.
(a) Simulation for natural convection at t = 4 h and solar irradiance = 860 W/m2. (b) Simulation for forced convection at t = 5 h and solar irradiance = 980 W/m2.
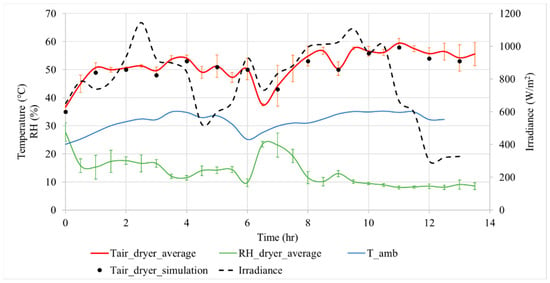
Figure 8.
Drying conditions for experiment with natural convection.
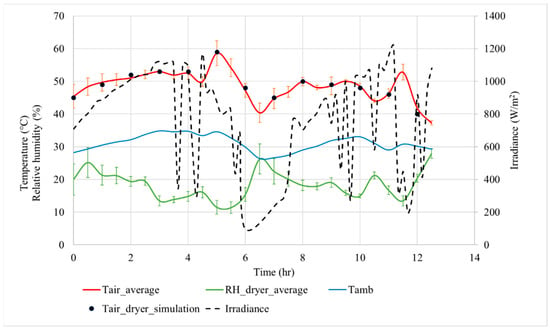
Figure 9.
Drying conditions for the experiment with forced convection.
The simulations represent the 3D temperature distribution in the volume of the drying chamber. It is important to note that the air flow over the trays for the forced convection experiment slightly increases the transfer coefficients. Solar irradiation patterns were different for the experiments. To compare the two drying scenarios more objectively, it is important to analyze the experimental irradiance data, the ambient temperature, the relative humidity in the drying chamber, the evolution of the average drying air temperature, and the simulated air temperature values. This is shown in Figure 8 and Figure 9.
For the experiment with natural convection, Figure 8 shows the average air temperature (red line) and the simulated results (black dots). Numerical results correspond to stationary solutions. The maximum air temperature in the dryer was T ≈ 60 and was recorded at t ≈ 11 h, when the value of solar irradiance was I ≈ 1000 W/m2. This information is very useful since it allows us to identify the fluctuations of the drying conditions, which confirm their high dependence on the weather. In this figure, the solar radiation data for the first day corresponds to the time interval of 0–6 h, while the data for the second day corresponds to 6–12 h. The blue line shows the ambient temperature (outdoor air temperature), which ranges between 25 and 35 °C. Relative humidity is affected by temperature; the green and blue lines correctly describe this dependence. The calculated value of RMSE for simulated air temperature is 1.2593 °C.
Figure 9 shows the data for the experiment with forced convection. Thermal perturbations were more evident due to important fluctuations in irradiation for two days, and a higher relative humidity was observed. The maximum recorded air temperature was ≈60 °C at t = 5 h (red line), when solar irradiance was 1190 W/m2. During these experiments, moments of cloudiness were observed, which influenced the air temperature. The green line illustrates how temperature influences the evolution of relative humidity. Numerical simulations accurately depict the experimental data. Each black point corresponds to the result obtained by the simulation in steady state, i.e., at a given time. The RSME for this simulation is 0.7242 °C. Simulations correctly describe the experimental average temperature data.
5. Conclusions
For the first time, experimental data on the solar drying of mesquite pods in a greenhouse solar dryer has been reported. The drying kinetics were modeled, and a computational simulation for participating media was solved to simulate the average air temperature in the dryer. The simulations correctly describe the 3D patterns of temperature. The experimental work allowed the visualization of the primary variables for experiments with natural and forced convection. The greenhouse dryer allowed for the dehydration of several kilograms of mesquite pods in two days. The mass and heat transfer coefficients were slightly higher for forced convection; however, on average, the drying time was similar because a very low air flow was supplied. For the experiment with forced convection, more perturbations on solar irradiation were observed. It is important to note that the radiation levels and ambient temperatures were different in each experiment, and these parameters have an effect on the drying kinetics and air temperature. We observed significant fluctuations in the drying air temperature in both experiments, indicating a strong reliance on weather conditions.
Since the experiments lasted 2 days, the pods remained in the dryer overnight, which caused a slight reabsorption of moisture; however, the operating conditions of the dryer allow reaching sufficiently low moisture contents (W < 0.05 g·moisture/g dry matter), which is important for the subsequent milling to obtain mesquite flour for food applications. This might be more problematic on rainy days. The participating media model computes the average temperature in a steady state and accurately describes the experimental data. Convection increased the transfer coefficients slightly, since the airflow over the trays was low.
Regarding the experiment with forced convection, it is important to investigate the effects of different variables, such as fan power, position and size of the fan, technical characteristics of fans, number of fans, and the extractor characteristics, variables that have an important effect on the performance of this operation. Further research is necessary to optimize greenhouse solar dryers. This paper provides important information that can be useful for academic and practical purposes.
Author Contributions
Conceptualization, S.S.-T., J.R.-R. and L.L.M.-L.; methodology, S.S.-T., L.L.M.-L. and L.G.B.-B.; software, S.S.-T., L.G.B.-B. and A.L.-O.; validation, S.S.-T., J.R.-R. and L.L.M.-L.; formal analysis, S.S.-T., J.R.-R. and L.L.M.-L.; investigation, S.S.-T., J.R.-R., L.L.M.-L. and A.L.-O.; resources, S.S.-T., J.R.-R. and L.L.M.-L.; data curation, S.S.-T., J.R.-R., L.L.M.-L. and L.G.B.-B.; writing—original draft preparation, S.S.-T., J.R.-R. and L.L.M.-L.; writing—review and editing, S.S.-T., J.R.-R., L.L.M.-L., L.G.B.-B. and A.L.-O.; visualization, S.S.-T., J.R.-R., L.L.M.-L. and A.L.-O.; supervision, S.S.-T., J.R.-R., L.L.M.-L. and L.G.B.-B.; project administration, S.S.-T.; funding acquisition, S.S.-T. and A.L.-O. All authors have read and agreed to the published version of the manuscript.
Funding
Authors acknowledge the Instituto Politécnico Nacional for SIP-IPN funding: Project ID codes SIP 20230794, SIP 20241532, and SIP 20250948.
Data Availability Statement
The article includes the original contributions presented in this study. Further inquiries can be directed to the corresponding author.
Acknowledgments
Thank you to Weaving Partnerships (“Tejiendo Alianzas A.C.”) and to the Community of Santiago Suchilquitongo (Minerva Cruz Vásquez, Richard Hanson, and Sarahi Garcia) for your kind attention and collaboration.
Conflicts of Interest
The authors declare no conflicts of interest.
References
- Meyer, D.; Becker, R.; Gumbmann, M.R.; Vohra, P.; Neukom, H.; Saunders, R.M. Processing, composition, nutritional evaluation, and utilization of mesquite (Prosopis spp.) pods as a raw material for the food industry. J. Agric. Food Chem. 1986, 34, 914–919. [Google Scholar] [CrossRef]
- Felker, P.; Takeoka, G.; Dao, L. Pod Mesocarp Flour of North and South American Species of Leguminous Tree Prosopis (Mesquite): Composition and Food Applications. Food Rev. Int. 2012, 29, 49–66. [Google Scholar] [CrossRef]
- de Gusmão, R.P.; Cavalcanti-Mata, M.E.R.M.; Duarte, M.E.M.; Gusmão, T.A.S. Particle size, morphological, rheological, physicochemical characterization and designation of minerals in mesquite flour (Proposis julifrora). J. Cereal Sci. 2016, 69, 119–124. [Google Scholar] [CrossRef]
- Torres, S.S.; Cravioto, D.L.; Ramírez, J.R.; Lagunas, L.L.M.; Bernal, L.G.B.; González, L.V.A. Drying technology of mesquite pods (Prosopis laevigata) and microstructural insights. Br. Food J. 2020, 122, 2953–2963. [Google Scholar] [CrossRef]
- Landillon, V.; Cassan, D.; Morel, M.-H.; Cuq, B. Flowability, cohesive, and granulation properties of wheat powders. J. Food Eng. 2008, 86, 178–193. [Google Scholar] [CrossRef]
- Mujumdar, A.S. (Ed.) Handbook of Industrial Drying, 4th ed.; CRC Press: Boca Raton, FL, USA, 2014. [Google Scholar] [CrossRef]
- Tiwari, G.N.; Tiwari, A.; Shyam. Handbook of Solar Energy: Theory, Analysis and Applications; Energy Systems in Electrical Engineering; Springer: Singapore, 2016. [Google Scholar] [CrossRef]
- Srinivasan, G.; Muthukumar, P. A review on solar greenhouse dryer: Design, thermal modelling, energy, economic and environmental aspects. Sol. Energy 2021, 229, 3–21. [Google Scholar] [CrossRef]
- Nijskens, J.; Deltour, J.; Coutisse, S.; Nisen, A. Radiation transfer through covering materials, solar and thermal screens of greenhouses. Agric. For. Meteorol. 1985, 35, 229–242. [Google Scholar] [CrossRef]
- Teitel, M.; Vitoshkin, H.; Geoola, F.; Karlsson, S.; Stahl, N. Greenhouse and screenhouse cover materials: Literature review and industry perspective. Acta Hortic. 2018, 1227, 31–44. [Google Scholar] [CrossRef]
- Torres, S.S.; López, L.G.R.; Lagunas, L.L.M.; Bernal, L.G.B.; Ramírez, J.R. Physicochemical Characterization of Mesquite Flour (Prosopis laevigata), Particle Size Distribution, Morphology, Isosteric Heat, and Rheology. In Food Processing and Preservation; IntechOpen: London, UK, 2022. [Google Scholar] [CrossRef]
- EL Khadraoui, A.; Hamdi, I.; Kooli, S.; Guizani, A. Drying of red pepper slices in a solar greenhouse dryer and under open sun: Experimental and mathematical investigations. Innov. Food Sci. Emerg. Technol. 2019, 52, 262–270. [Google Scholar] [CrossRef]
- Belessiotis, V.; Delyannis, E. Solar drying. Sol. Energy 2011, 85, 1665–1691. [Google Scholar] [CrossRef]
- Kaewkiew, J.; Nabnean, S.; Janjai, S. Experimental investigation of the performance of a large-scale greenhouse type solar dryer for drying chilli in Thailand. Procedia Eng. 2012, 32, 433–439. [Google Scholar] [CrossRef]
- Nimnuan, P.; Nabnean, S. Experimental and simulated investigations of the performance of the solar greenhouse dryer for drying cassumunar ginger (Zingiber cassumunar Roxb.). Case Stud. Therm. Eng. 2020, 22, 100745. [Google Scholar] [CrossRef]
- Vengsungnle, P.; Jongpluempiti, J.; Srichat, A.; Wiriyasart, S.; Naphon, P. Thermal performance of the photovoltaic-ventilated mixed mode greenhouse solar dryer with automatic closed loop control for Ganoderma drying. Case Stud. Therm. Eng. 2020, 21, 100659. [Google Scholar] [CrossRef]
- Prawiranto, K.; Carmeliet, J.; Defraeye, T. Physics-Based Digital Twin Identifies Trade-Offs Between Drying Time, Fruit Quality, and Energy Use for Solar Drying. Front. Sustain. Food Syst. 2021, 4, 606845. [Google Scholar] [CrossRef]
- Janjai, S.; Intawee, P.; Kaewkiew, J.; Sritus, C.; Khamvongsa, V. A large-scale solar greenhouse dryer using polycarbonate cover: Modeling and testing in a tropical environment of Lao People’s Democratic Republic. Renew. Energy 2011, 36, 1053–1062. [Google Scholar] [CrossRef]
- Purusothaman, M.; Valarmathi, T.N. Computational fluid dynamics analysis of greenhouse solar dryer. Int. J. Ambient Energy 2019, 40, 8. [Google Scholar] [CrossRef]
- Román-Roldán, N.I.; Yudonago, J.F.I.; López-Ortiz, A.; Rodríguez-Ramírez, J.; Sandoval-Torres, S. A new air recirculation system for homogeneous solar drying: Computational fluid dynamics approach. Renew. Energy 2021, 179, 1727–1741. [Google Scholar] [CrossRef]
- Kooli, S.; Fadhel, A.; Farhat, A.; Belghith, A. Drying of red pepper in open sun and greenhouse conditions.: Mathematical modeling and experimental validation. J. Food Eng. 2007, 79, 1094–1103. [Google Scholar] [CrossRef]
- Janjai, S.; Lamlert, N.; Intawee, P.; Mahayothee, B.; Bala, B.K.; Nagle, M.; Müller, J. Experimental and simulated performance of a PV-ventilated solar greenhouse dryer for drying of peeled longan and banana. Sol. Energy 2009, 83, 1550–1565. [Google Scholar] [CrossRef]
- Azam, M.M.; Eltawil, M.A.; Amer, B.M.A. Thermal analysis of PV system and solar collector integrated with greenhouse dryer for drying tomatoes. Energy 2020, 212, 118764. [Google Scholar] [CrossRef]
- Tham, T.C.; Ng, M.X.; Gan, S.H.; Chua, L.S.; Aziz, R.; Chuah, L.A.; Hii, C.L.; Ong, S.P.; Chin, N.L.; Law, C.L. Effect of ambient conditions on drying of herbs in solar greenhouse dryer with integrated heat pump. Dry. Technol. 2017, 35, 1721–1732. [Google Scholar] [CrossRef]
- Çengel, Y.A.; Ghajar, A.J. Heat and Mass Transfer: Fundamentals & Applications; McGraw Hill Education: New York, NY, USA, 2019; p. 1018. [Google Scholar]
- Marrero, T.R.; Mason, E.A. Gaseous Diffusion Coefficients. J. Phys. Chem. Ref. Data 1972, 1, 3–118. [Google Scholar] [CrossRef]
- Sandoval-Torres, S.; López, L.R.; Lagunas, L.M.; Ramírez, J.R.; Bernal, G.B. Physicochemical characterization of mesquite flours. In Proceedings of the 21th International Drying Symposium, Valencia, Spain, 11–14 September 2018; pp. 989–996. [Google Scholar] [CrossRef]
- Boulard, T.; Papadakis, G.; Kittas, C.; Mermier, M. Air flow and associated sensible heat exchanges in a naturally ventilated greenhouse. Agric. For. Meteorol. 1997, 88, 111–119. [Google Scholar] [CrossRef]
- Cui, Z.; Hu, W.; Zhang, Y.; Ji, T.; Li, W.; Guan, Y. Simulation research on airflow distribution performance of solar greenhouse heating system in northwest China. E3S Web Conf. 2022, 356, 01067. [Google Scholar] [CrossRef]
Disclaimer/Publisher’s Note: The statements, opinions and data contained in all publications are solely those of the individual author(s) and contributor(s) and not of MDPI and/or the editor(s). MDPI and/or the editor(s) disclaim responsibility for any injury to people or property resulting from any ideas, methods, instructions or products referred to in the content. |
© 2025 by the authors. Licensee MDPI, Basel, Switzerland. This article is an open access article distributed under the terms and conditions of the Creative Commons Attribution (CC BY) license (https://creativecommons.org/licenses/by/4.0/).