Abstract
This article takes the perspective of Hydrogen Load Aggregator (HLA) to optimize the declaration strategy of peak shaving market, improve the flexible regulation capability of power system and HLA economy as the research objectives, and proposes an optimization strategy method for HLA to participate in peak shaving market. Firstly, an improved Convolutional Neural Networks–Long Short-Term Memory (CNN-LSTM) time series prediction model is developed to address peak shaving demand uncertainty. Secondly, a bidding strategy model incorporating dynamic pricing is constructed by comprehensively considering electrolyzer regulation costs, market supply–demand relationships, and system constraints. Thirdly, a market clearing model for peak shaving markets with HLA participation is designed through analysis of capacity contribution and marginal costs among different regulation resources. Finally, the capacity allocation model is designed with the goal of minimizing the total cost of peak shaving among various stakeholders within HLA, and the capacity won by HLA in the peak shaving market is reasonably allocated. Simulations conducted on a Python3.12-based experimental platform demonstrate the following: the improved CNN-LSTM model exhibits strong adaptability and robustness, the bidding model effectively enhances HLA market competitiveness, and the clearing model reduces system operator costs by 5.64%.
1. Introduction
In the current context of the continuous advancement of global industrialization, the energy consumption structure dominated by fossil energy has triggered a series of severe environmental and energy problems. In 2020, China proposed the ‘3060 dual carbon goals’ [1]. The energy structure and the increasing demand for peak shaving capacity of the power grid due to the high proportion of new energy access are important challenges for China to achieve the ‘3060 dual carbon goals’. Hydrogen, as a clean energy source, has the advantages [2] of high energy density and long storage time. In addition, electrolytic hydrogen production technology, as the main means of hydrogen production, has the advantages [3,4] of fast response speed and zero carbon emissions. The participation of electrolytic hydrogen production technology in the power system peak shaving market can not only bring a large amount of peak shaving capacity to the power grid but also bring vitality to the peak shaving market and promote the process of China’s electricity marketization. Therefore, how to effectively promote the participation of electrolytic hydrogen production technology in the peak shaving market has become an urgent problem to be solved at present.
At present, there are many achievements in the research on the peak shaving market. Literature [5] proposed a trading mechanism tailored for high-penetration renewable energy systems in the electricity spot market, which not only encourages thermal power units to undertake flexibility retrofits but also fosters fair competition and equitable proceeds allocation among market participants. Literature [6] proposed a model aiming at the maximization of comprehensive revenue in diversified market-oriented decision-making of VPPs, an optimal operational strategy of the virtual power plant to participate in the joint markets of electricity spot and auxiliary service market is innovatively proposed. Literature [7] mentioned two aforementioned benefits of smart grid communications (distribution system markets and higher controllability) that are combined together to reduce the system daily peak. An optimization is performed on the time-of-use (TOU) pricing patterns, and a multimarket approach is proposed for peak shaving applications. Literature [8] aimed at the increasing burden of power system peaking caused by the integration of large-scale new energy generation into the grid and the imperfect participation mechanisms for peaking entities in the power market; this paper proposes an optimal dispatch method for multiple storage and thermal power units. Literature [9] proposed a scenario-based stochastic optimization scheme to make uncertainty-aware decisions is developed, considering both net-load and price uncertainty. The corresponding scheme is formulated as a linear program that can be solved efficiently even under a large number of scenarios. Literature [10] presents a novel optimization strategy designed to maximize the operational revenue of Virtual Power Plants (VPPs) by addressing the complexities of dual participation in power peak shaving and carbon markets. Literature [11] provided ancillary service resources such as frequency regulation and peak shaving. The virtual power plant aggregates the distributed energy scattered in the power grid through advanced communication, computing, dispatching, marketing, and other means, making it a “power generation system” that can be uniformly dispatched, and then follow the dispatching instructions and participate in the ancillary service market. Literature [12] proposed a time-of-use game bidding model for bilateral peak shaving transactions between new energy and thermal power in response to the problem that the consumption of peak shaving demand in the power market cannot be balanced with the economic benefits of peak shaving units. Literature [13], with the objective of minimizing peak shaving costs, quantified the peak shaving value of participating peak shaving units, and established a mathematical model of the peak shaving ancillary service market considering the participation of pumped storage power stations in peak shaving. Literature [14] broke down the photovoltaic output into the fluctuation suppression component and, with the goal of minimizing the peak shaving cost, established a model for optimizing the allocation of hydrogen storage in the distribution network with photovoltaic-hydrogen storage for peak shaving. Literature [15], considering the prediction error characteristics of wind power and load at different time scales, established a day-ago and intraday two-stage rolling regulation peak shaving model based on carbon capture power stations and virtual energy storage to fully utilize the different response speeds and peak shaving capabilities of various flexible loads. Literature [16], based on the current situation of the peak shaving market in Shaanxi Province, designed an electricity energy and peak shaving ancillary service clearance model considering the full participation of multiple types of entities. Literature [17] established a bidding model for frequency regulation from the perspective of energy storage and a joint clearing model for the frequency regulation market with the aim of minimizing the cost of frequency regulation. Li Junhui et al. in Literature [18] designed the energy storage–new energy–thermal power peak shaving market trading mechanism and thermal power unit quotation model, and proposed a multi-objective optimal dispatching method for energy storage–new energy–thermal power considering wind and solar curtailment in the electricity market environment. Literature [19] considered the peak shaving capacity of various types of market entities such as coal-fired units, wind farms, and energy storage, and established a day-before energy peak shaving joint market optimization model. Literature [20] constructed a multi-source joint deep peak regulating (DPR) model of wind, thermal, storage, and carbon capture under price-based demand response (PBDR) to address the peak shaving demand brought by the high proportion of new energy access due to insufficient peak shaving resources on both the source and load sides, and analyzed its characteristics. Literature [21] analyzed the clearing and pricing mechanism of energy storage in the peak shaving market in China and designed four quotation schemes for energy storage in the peak shaving market. However, the uncertainty of market demand can lead to significant errors in the power market clearing model and the quotation model of the participants.
Therefore, some studies have been conducted by scholars at home and abroad on the handling of the uncertainty problem. Literature [22] proposed a peak shaving demand prediction model based on ridge regression using ridge regression technology to predict the influence magnitudes of various factors of grid peak shaving demand. Literature [23] proposed a method for forecasting day-ahead peak and frequency regulation demand based on the three-parameter power-law model using the turbulence intensity model and the wind power three-parameter power-law model. Literature [24] proposed a combined prediction method based on the multi-index LSSVM method and the gray isodimensional information prediction method to deal with the uncertainty of power demand through the prediction method. Literature [25] proposed a prediction model based on an improved random forest combination, which predicted the output of renewable energy equipment and the cooling, heating, and power load demand of users from a long time scale based on screening similar day sample sets. Literature [26] obtained the wind–solar combined output probability using sequence operation theory and provided probability backup constraints in the form of chance constraints to address the uncertainty of wind–solar output. Literature [27], in response to the uncertainty of photovoltaic output, simulated the uncertainty of photovoltaic prediction error using the probability density function fitted with kernel density estimation and historical sampling data. Literature [28] described the uncertainty of wind and photovoltaic output using Latin hypercube sampling and scene reduction methods. The above-mentioned scholars used machine learning for prediction, opportunity-constrained methods, or probability-based simulations to deal with uncertainty problems, but machine learning, opportunity-constrained, and simulation methods had greater errors in dealing with uncertainty problems compared to the actual situation compared to deep learning networks.
Despite considering the handling of uncertainty factors, researchers mostly studied the clearing and quotation mechanisms of existing peak shaving resources participating in the peak shaving market or the addition of hydrogen storage to the original peak shaving market-related mechanisms, but did not study the quotation strategies and clearing models of electrolytic hydrogen production participating in the peak shaving market that takes into account multiple types of peak shaving resources.
Therefore, this paper considers the uncertainty of peak shaving demand in the peak shaving market, proposes an improved CNN-LSTM time series prediction model, and on the basis of the prediction, designs the declaration strategy and clearing model of the HLA-involved peak shaving market taking into account multiple types of peak shaving resources, and establishes the internal capacity allocation model of hydrogen load aggregation based on the clearing results. The main work of this paper is as follows:
(1) An improved CNN-LSTM time series prediction model is proposed in response to the uncertainty of the next day’s peak demand. Multi-scale feature fusion and attention mechanisms are incorporated during the model construction process to integrate information at different levels and dynamically focus on key features, jointly enhancing the model’s ability to capture data.
(2) Construct a declaration strategy model with dynamic quotations, taking into account the cost of electrolyzer peak shaving, the supply and demand relationship in the peak shaving market and system-related constraints, and in combination with the prediction results.
(3) Design a peak shaving market clearing model with HLA participation by analyzing the capacity contribution and marginal cost of different peak shaving resources.
(4) With the aim of minimizing the total cost of peak shaving for each stakeholder within HLA, design an allocation model to rationally allocate the capacity that HLA acquires in the peak shaving market.
(5) Take a regional peak shaving market as an example to verify the validity of the proposed model through simulation analysis.
2. The Mechanism of HLA’s Participation in the Peak Shaving Market
Traditional participants in peak shaving ancillary services in the electricity market include thermal power units, pumped storage power stations, electrochemical energy storage power stations, etc. Electrolytic hydrogen production, as a new player in peak shaving ancillary services, needs competitive quotations that are closely related to peak shaving costs if it wants to be highly competitive in the peak shaving market. At present, there is a lot of analysis [29,30,31,32] on the costs of each traditional player and electrolyzer participating in peak shaving ancillary services, which will not be elaborated one by one in this article.
2.1. The Transaction Organization and Transaction Process of the Two-Stage Peak Shaving Market
With the development of electrolytic hydrogen production technology, electrolytic hydrogen production technology will become a key force in the peak shaving market. Therefore, this paper will focus on the HLA participation in the peak shaving market, which consists of multiple stakeholders with electrolytic hydrogen production facilities.
Based on the existing peak shaving market rules in China, the transaction process for HLA to participate in the intraday peak shaving ancillary service market is proposed:
(1) Publish the information. During operating days, the dispatch center publishes information such as peak shaving capacity, time periods, and passage conditions.
(2) Pre-day bidding. Before 11:00, HLA formulates the day-before bidding strategy based on the projected hydrogen load capacity sent by internal participants and the information published by the external peak shaving market. Then HLA reports the peak shaving bidding capacity and time periods to the dispatch center. The dispatch center determines the market exit count in a uniform marginal clearing manner and publishes the transaction results.
(3) Internal distribution. HLA calculates peak shaving costs based on the operating conditions of each of its internal main units, allocates peak shaving capacity based on the peak shaving costs, and publishes the allocation results as well as the market winning prices.
(4) Market settlement. After the operation date, settle the peak shaving fee and fines. When the actual peak shaving capacity is greater than the bidding capacity, the settlement is based on the bidding capacity. However, HLA will be penalized when it is less than 80% of the bid capacity. Penalties are calculated based on the unfinished portion.
(5) Internal settlement. After the market settlement, distribute the benefits to each stakeholder within HLA according to their contributions based on the results of the market settlement. If a fine is imposed due to a particular stakeholder, that stakeholder shall bear the fine.
2.2. HLA’s Strategy for Participating in the Peak Shaving Market
As a newcomer to the peak shaving market, HLA’s strategy for participating in the peak shaving market remains vacant. This article designs the declaration strategy for HLA’s participation in the peak shaving market from the perspective of HLA:
2.2.1. Peak Shaving Demand Forecasting Model
During the operation of the peak shaving market, market participants quote for the peak shaving demand of the next day’s peak shaving market. However, the uncertainty of the peak shaving demand brings significant errors to the market peak shaving, which may cause counter-peak shaving. Therefore, this paper uses an improved CNN-LSTM to predict the peak shaving demand for the next day.
- (1)
- Long Short-Term Memory network principles [33]
Long Short-Term Memory (LSTM) is an improved recurrent neural network structure whose core structure consists of three gated units: the forgetting gate, the input gate, and the output gate.
is the forgetting gate, which determines the retention ratio of cell states through the sigmoid function:
In the formula, is the sigmoid activation function; is the hidden state at the previous moment; is the current input; and are, respectively, the weights of the forgetting gate and the bias term.
is the input gates, which control the amount of update for new information as follows:
In the formula, is candidate memory; is the tanh activation function; and are, respectively, the weights of the input gate and the bias term; and are the weights and bigotry terms of candidate memory, respectively.
Memory update:
is the output gate, which adjusts final state output as follows:
In the formula, and are the weights and bigotry terms of the output gate, respectively.
- (2)
- Multi-scale feature fusion
This model uses a multi-scale fusion architecture of parallel convolutional branches and feature concatenation. Among them, the multi-branch convolutional structure consists of short-term feature extraction and medium-term feature extraction. The formula for multi-branch convolutional structures and feature concatenation is as follows:
Short-term feature extraction:
Mid-term Feature extraction:
Feature stitching:
In the formula, is the short-term feature vector of the output; is the weight matrix of the short-term convolution kernel, with representing the convolution window offset; is the normalized demand value of the input sequence at time t + i; is the bias vector of the short convolutional layer; is the mid-term feature vector of the output; is the weight matrix of the mid-term convolution kernels; is the bias vector of the intermediate convolutional layer; is the fused multi-scale feature matrix; is the modified linear unit activation function; represents concatenation operations along the channel dimension.
- (3)
- Multi-head attention mechanism
The multi-head attention mechanism [34] is an innovation based on the attention mechanism by dividing the three matrices of query (Q), key (K), and value (V) into several small chunks, each called a “head”. Each “head” performs a self-attention operation independently, then concatenates the results of all “heads” together and performs a specific transformation to obtain the final output.
The multi-head attention mechanism is used to dynamically adjust the distribution of feature weights. The calculation process can be expressed as
In the formula, Q, K, and V, respectively, refer to the Query, Key, and Value matrices.
- (4)
- Early Stop Strategy
Early Stopping strategies [35] are regularized by monitoring validation set losses. The patience coefficient (patience) is set and the training is terminated when the validation loss does not improve for patience epochs. The specific implementation uses the optimal loss comparison mechanism. If the current validation loss valloss < bestlossloss, update best and reset the counter. Otherwise, the counter increments. In conjunction with the ReduceLROnPlateau learning rate scheduler, automatically reduce the dynamic learning rate when validation losses stagnate.
- (5)
- CNN-LSTM time series prediction model
The CNN-LSTM time series prediction model is shown in Figure 1.
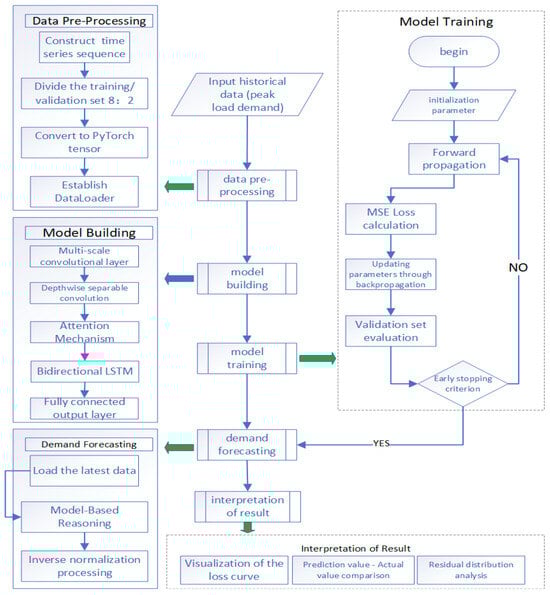
Figure 1.
Improved CNN-LSTM time series prediction model.
The process is as follows:
- (1)
- Enter historical data
- With a time resolution of 1 h, input the 30-day continuous peak shaving demand sequence;
- Each sample contains 24 h full cycle data to form a (days × 24)-dimensional feature matrix.
- (2)
- Data preprocessing
- Time series reconstruction;
- Data standardization;
- Dataset partitioning: Split the training set in an 8:2 ratio;
- Tensor transformation;
- Data loading: Build an iterative loader of batch size 4, with the training set randomly shuffled.
- (3)
- Model building
- Feature extraction layer;
- Time Series Modeling Layer: Multi-head Attention mechanism, LSTM units (Hidden layer 50 nodes, tanh gating);
- Cascading: CNN output dimensionally transformed input attention-LSTM module.
- (4)
- Model training
- Iterative optimization: Use a maximum training round of 200 epochs;
- Dynamic learning rate: Initial value 0.001;
- Early stop mechanism: Termination without improvement for 10 consecutive epochs of validation loss;
- Weight preservation: Always retain the model parameters corresponding to the best validation loss.
- (5)
- Demand forecasting
- Enter the latest 24 h standardized data;
- Forward propagation for predicted values;
- Reverse normalization processing;
- Output the demand forecast sequence for the next 24 h.
- (6)
- Result Analysis
2.2.2. HLA Declaration Strategy Mechanism
HLA participates in the peak shaving market with the aim of maximizing revenue and capacity utilization. Combined with predictive data and the aforementioned mathematical model, an electricity market bidding optimization model based on dynamic programming and dynamic quotation offset (EPS) is proposed, as shown in Figure 2.
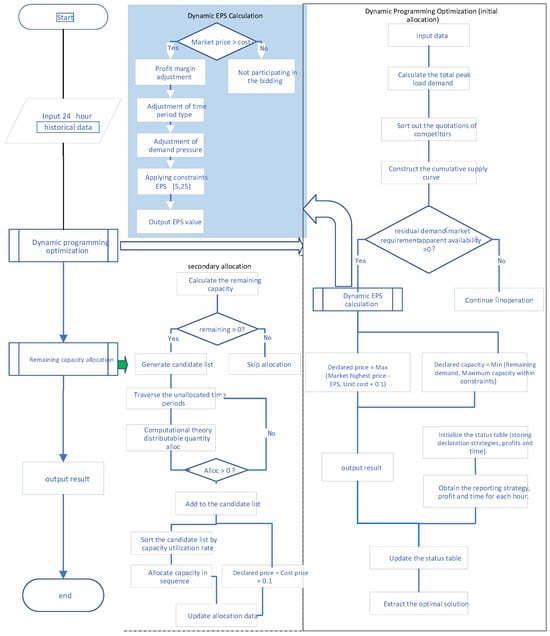
Figure 2.
Optimization model for HLA reporting strategy.
The process is as follows:
- Enter data:
- (1)
- Market environment data;
- (2)
- Electrolyzer peak shaving cost parameters and calculation.
- Dynamic quotation:
Triple peak shaving EPS factor calculates EPS, before obtaining the quote;
Here are the formulas for EPS calculation and their explanation:
The calculation of EPS (price offset) is based on a multi-factor dynamic adjustment model in the dynamic_eps function: First, it checks whether market_price is higher than cost, returning 0 if there is no profit margin; then, using base_eps = 10.0 as the base value, it determines eps_factor according to the profit margin where margin = (market_price-cost)/cost (0.8 for high profit, 1.0 for medium profit, 0.6 for low profit); subsequently, it combines the time period type distinguished by hour_type (0.7 for peak hours, 1.2 for off-peak hours) and the demand pressure reflected by demand_ratio = D/total_demand (multiplied by 1 + 2 × demand ratio); finally, the result is constrained within the [5.0, 25.0] range through max (5.0, min (eps, 25.0)), forming a dynamic pricing strategy that balances competitiveness and profitability. Through parameter sensitivity analysis, it has been found that the current EPS strategy is highly sensitive to the base EPS value and demand multiplier, with parameter adjustments causing profit fluctuations of ±15–25%. Meanwhile, the model shows moderate sensitivity to time slot factors and profit margin thresholds, indicating a moderate overfitting risk. Although the current parameter configuration performs well with specific case data, its effectiveness heavily depends on the case-specific market structure and demand patterns. When facing different competitor strategies or changing demand environments, the model may fail to maintain optimal performance. Therefore, it is necessary to adopt parameter adaptation mechanisms and cross-scenario validation to enhance the model’s generalization capability and robustness.
- 3.
- Hourly profit projections
- (1)
- Bidding analysis: First, rank the bids of other bidders in ascending order. Then calculate the cumulative capacity curve. Finally, look for the critical point of the demand gap.
- (2)
- Dynamic decision logic:
- When there is a remaining demand, first call dynamic_eps to calculate the quote offset. Then, generate the bid price: max (critical price −eps, cost price +0.1). Finally, the allocation takes the smaller value of the remaining demand versus the capacity limit.
- Generate a triplet of hourly allocation, profit, and quote.
- 4.
- Global optimization of allocation
- (1)
- Dynamic programming: By maintaining a state dictionary to record the maximum profit and distribution path at different capacities, the state space is expanded hour by hour, always retaining the optimal solution at each capacity point, and ultimately the state with the maximum total profit is selected as the optimal bidding scheme.
- (2)
- Remaining capacity allocation: First, collect the candidate list of unallocated time periods. Then, sort by capacity utilization. Finally, allocate the remaining capacity in sequence to the periods with the highest utilization rate.
- 5.
- Output the result.
2.3. Electrolytic Cell
2.3.1. Cost Analysis
During peak shaving, electrolyzers generate cell life degradation, water consumption, and electricity costs, which in turn result in cell life degradation costs, water consumption costs, and electricity costs.
The continuous operation of the electrolyzer leads to the degradation of the electrolyzer’s lifespan. Currently, it is difficult to conduct an accurate mathematical modeling of the degradation of the electrolyzer’s lifespan directly. Most studies indirectly reflect the degradation of the lifespan by measuring the voltage changes in the electrolyzer through experiments. This is because during the operation of the electrolyzer, irreversible losses occur in the catalytic layer, the membrane resistance increases, and the overvoltage of the electrolyzer increases. Under the condition that the flow rate of the output hydrogen remains constant, the current needs to be kept constant, and an increase in the operating voltage indicates a decrease in the hydrogen production efficiency of the electrolyzer. When the working voltage of the electrolyzer rises to the maximum working voltage, the electrolyzer needs to be replaced to ensure system efficiency. Relevant studies have shown that when parameters such as temperature and pressure are determined, the voltage change in the electrolyzer is closely related to its power fluctuation.
The continuous operation of the electrolyzer leads to the degradation of the electrolyzer’s lifespan. Currently, it is difficult to conduct an accurate mathematical modeling of the degradation of the electrolyzer’s lifespan directly. Most studies indirectly reflect the degradation of the lifespan by measuring the voltage changes in the electrolyzer through experiments. This is because, during the operation of the electrolyzer, irreversible losses occur in the catalytic layer, the membrane resistance increases, and the overvoltage of the electrolyzer increases. Under the condition that the flow rate of the output hydrogen remains constant, the current needs to be kept constant, and an increase in the operating voltage indicates a decrease in the hydrogen production efficiency of the electrolyzer. When the working voltage of the electrolyzer rises to the maximum working voltage, the electrolyzer needs to be replaced to ensure system efficiency. Relevant studies have shown that when parameters such as temperature and pressure are determined, the voltage change in the electrolyzer is closely related to its power fluctuation.
When the electrolyzer is running smoothly, there will be a certain degree of life de cay. In the case of input fluctuating power supply, the frequent fluctuations of the input power of the electrolyzer and the frequent start–stop of the electrolyzer will accelerate its life decay. Based on these characteristics, the degradation of electrolytic cell efficiency is used to reflect the degradation of electrolytic cell life, considering the degradation of electrolytic cell life under three typical operating conditions: stable operation, fluctuating operation, and start–stop. When running smoothly, the efficiency decay coefficient of the electrolyzer is very small. When operating with fluctuations, the greater the fluctuations, the greater the corresponding efficiency attenuation. Starting and stopping have the greatest impact on the lifespan of the electrolyzer.
2.3.2. Cost Model
- (1)
- Life wear cost
Among them,
In the formula, T is the running period (dividing one day into 24 time periods, that is, T = 24); is the life loss cost of the electrolytic cell within one scheduling cycle; for the rated operating life of the electrolyzer; for the configuration cost of the electrolyzer; , , and are, respectively, the amount of efficiency degradation of the electrolytic cell during smooth operation, fluctuating operation, and start-up and shutdown; , , and are the efficiency attenuation coefficients of the electrolytic cell during stable operation, fluctuating operation, and start-up/shutdown, respectively. Take, respectively, , , and . , which is a 0–1 variable, represents the on–off status of the electrolytic cell; it is 1 when it is on and 0 when it is off. and are the rated efficiency and the limit efficiency of the electrolyzer; is the rated efficiency attenuation coefficient of the electrolytic cell. Take . are, respectively, the total efficiency decay and the total equivalent life decay of the electrolytic cell within one scheduling cycle.
- (2)
- Cost of water consumption
In the formula, is the water consumption cost of the electrolyzer within one scheduling cycle; is the real-time water price; for the mass of water consumed by the electrolyzer over a scheduling cycle; for the mass of water consumed per unit mass of hydrogen; for the conversion efficiency of the electrolyzer; for the operating power of the electrolyzer at time t; is the volume of hydrogen per unit mass at standard atmospheric pressure.
- (3)
- Electricity cost
In the formula, is the cost of electricity; is the electricity price.
3. Two-Stage Peak Shaving Model
3.1. Peak Shaving Market Clearing Model
3.1.1. Objective Function
The clearing model for HLA-containing peak shaving markets aims to minimize the total peak shaving cost for system operators:
In the formula, is the profit coefficient of each market participant (x can be represented as thermal power unit, hydrogen load aggregator as hyd, pumped storage power as pum, electrochemical energy storage as bat); is the winning price of the thermal power unit l at time t, is the winning capacity of the thermal power unit l at time t; for the winning bid price of HLA at time t, for the winning bid capacity of HLA at time t; for the winning price of HLA at time t, for the winning capacity of pumped storage power stations at time t; for the winning price of electrochemical energy storage at time t, for the winning capacity of electrochemical energy storage at time t.
3.1.2. Constraints
- (1)
- Peak shaving capacity equality constraints
In the formula, is the peak shaving capacity requirement at time t of the next day.
- (2)
- Unit operating equation constraints
In the formula, are, respectively, the operating power of thermal power units, HLA, pumped storage power stations, and electrochemical energy storage; , , , are, respectively, the operating power of thermal power units, HLA, pumped storage power stations, and electrochemical energy storage before participating in the peak shaving market.
- (3)
- Constraints related to thermal power units
- Operational constraints for thermal power units
In the formula, and are the minimum and maximum technical outputs of the thermal power unit at time t, respectively.
- b.
- Climbing constraint for thermal power units
In the formula, and are the climbing rate and landslide rate of the thermal power unit, respectively.
- c.
- Quotation constraints for thermal power units
In the formula, is the average load rate of the thermal power unit, the average load rate = power generated by the start-up unit/capacity of the start-up unit × 100%.
- (4)
- Hla-related constraints
- Electrolyzer operation constraints
In the formula, is the total operating power of the electrolytic cell inside HLA; and are, respectively, the minimum and maximum technical outputs of the electrolytic cells of all the main bodies within HLA at time t; represents the hydrogen production of all the electrolyzers within HLA during the t period; represents the hydrogen production efficiency of the electrolyzer.
- b.
- Capacity constraints for hydrogen storage tanks
Among them,
In the formula, is the real-time capacity of the hydrogen storage tanks of all entities within HLA; is the maximum storage capacity of hydrogen storage tanks used by all HLA entities to participate in the peak shaving market.
- c.
- Quotation constraints for HLA
In the formula, and are the lower and upper limits of the hydrogen load declared price, respectively.
- (5)
- Electrochemical energy storage constraints
- Charge and discharge power constraints
In the formula, and are, respectively, the charging power and discharging power of the electrochemical energy storage, and is the rated power of the electrochemical energy storage.
- b.
- Energy storage state constraints
Considering that overcharging and overdischarging of electrochemical energy storage can significantly reduce the battery’s cycle life, it is necessary to limit the state of charge (SOC) of the energy storage:
where and are the current energy state and rated energy state of the electrochemical energy storage, respectively; and are the charging efficiency and discharging efficiency, respectively; and are the minimum and maximum capacities of electrochemical energy storage, respectively.
- c.
- Quotation constraints for electrochemical energy storage:
In the formula, and are the lower and upper limits of the declared price for electrochemical energy storage, respectively.
- (6)
- Constraints related to pumped storage power stations
- a.
- Capacity constraints for pumped storage power stations:
In the formula, and are the conversion coefficients of water and electricity when pumping water and generating electricity, respectively; is the initial water volume of the upper reservoir of the pumped storage power station; and are, respectively, the maximum and minimum storage capacity of the upper reservoir; and are, respectively, the maximum and minimum storage capacity of the lower reservoir; and are, respectively, the power when pumping water and generating electricity.
- b.
- Pumping power constraints for pumped storage stations:
- c.
- Quotation constraints for pumped storage power stations:
In the formula, and are the highest and lowest quotations for pumped storage power stations, respectively.
3.2. HLA Capacity Allocation Model
3.2.1. Objective Function
In the formula, is the unit peak shaving cost of the electrolytic hydrogen production unit l; I is the number of hydrogen loads inside HLA; it is the peak shaving capacity of the electrolyzer of the main body i inside HLA at time t.
3.2.2. Constraints
- (1)
- Peak shaving capacity equality constraints
- (2)
- Electrolyzer operating power constraints
In the formula, and represent the maximum and minimum peak shaving capacities of the electrolytic cell with the main body l inside HLA at time t.
- (3)
- Hydrogen storage tank capacity constraint
In the formula, is the storage capacity of the hydrogen storage tank of the inner body i of HLA at time t; and are, respectively, the maximum and minimum storage capacities of the hydrogen storage tank of HLA internal entity i at time t.
3.3. Two-Stage Liquidation Model
Currently, the methods for solving mathematical models can be mainly classified into two categories: commercial solvers and heuristic algorithms. Among them, commercial solvers can only solve relatively simple mathematical models and have insufficient code flexibility, requiring the use of other software in combination; for the research on heuristic algorithms, it has become relatively mature, but the solution results can only approach the optimal solution. In response to the above problems, this paper constructs a two-stage peak shaving clearing model, and the flow of the two-stage peak shaving clearing model is shown in Figure 3.
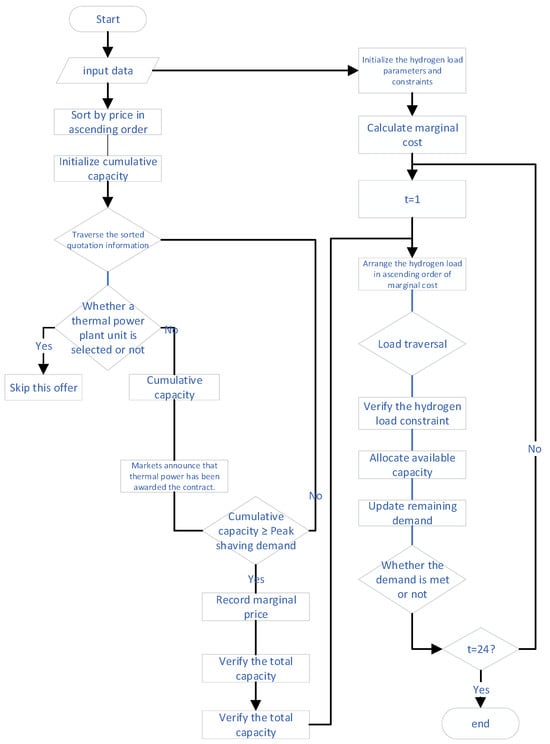
Figure 3.
Two-stage peak load clearing model.
The main process flow is as follows:
- (1)
- Input data: Input the 4-quota curves of 3 thermal power units on a typical day, the quota curve of the pumped storage power station, the quota curve of the electrochemical energy storage, the quota curve of the hydrogen load aggregator, and the relevant parameters for the hydrogen load peak shaving cost.
- (2)
- Marginal clearing algorithm:
- (a)
- Collect all valid quotations (filter out invalid segments where capacity/price is 0);
- (b)
- Sort by price in ascending order (preferentially select the low-cost units);
- (c)
- Accumulate capacity until the demand is met, and each thermal power unit is only allowed to win one segment per hour;
- (d)
- The price of the last quota that meets the demand is set as the marginal price;
- (e)
- Verify whether the total capacity matches the demand to prevent calculation errors.
- (3)
- Result display and output the winning results of the hydrogen load aggregator.
- (4)
- Capacity allocation algorithm:
- (a)
- Calculate the peak shaving cost, including the degradation cost of the electrolyzer (including three loss modes: operation, fluctuation, and start-stop), power cost, and water consumption cost;
- (b)
- Pre-calculate the marginal cost of all hydrogen loads for all hours;
- (c)
- Greedy allocation: select the load with the lowest marginal cost for priority allocation per hour;
- (d)
- Constraint verification: verify whether the allocation meets the maximum power limit and hydrogen storage capacity limit;
- (e)
- Output the allocation result.
- (5)
- Output all results: clearing results of the peak shaving auxiliary service market, internal capacity allocation results of the hydrogen load aggregator.
4. Case Analysis
This paper takes the data of a regional peak shaving ancillary service market as an example, with a time resolution of 1 h, to obtain the unit information and quotation information of thermal power units G1 (200 MW)/G2 (200 MW)/G3 (150 MW), pumped storage power stations (100 MW), and electrochemical energy storage (100 MW), as well as the clearing results of this peak shaving ancillary service market. Specifically, as shown in Figure 4, HLA is now joining the peak shaving ancillary services market for filing. HLA is composed of three stakeholders with electrolytic hydrogen production facilities (the XTH stakeholder corresponds to hydrogen load x), where hydrogen load 1 has an electrolytic cell with an installed capacity of 20 MW and is equipped with a hydrogen storage tank of 30,000 standard cubic meters; hydrogen load 2 has an installed capacity of 25 MW electrolyzers and is equipped with 30,000 standard cubic meters of hydrogen storage tanks; hydrogen load 3 has an installed capacity of 60 MW electrolyzers and is equipped with 90,000 standard cubic meters of hydrogen storage tanks. Each stakeholder has its operational mandate before participating in the peak shaving market, as shown in Figure 5. The remaining technical parameters are shown in Table 1, and the economic parameters are shown in Table 2.
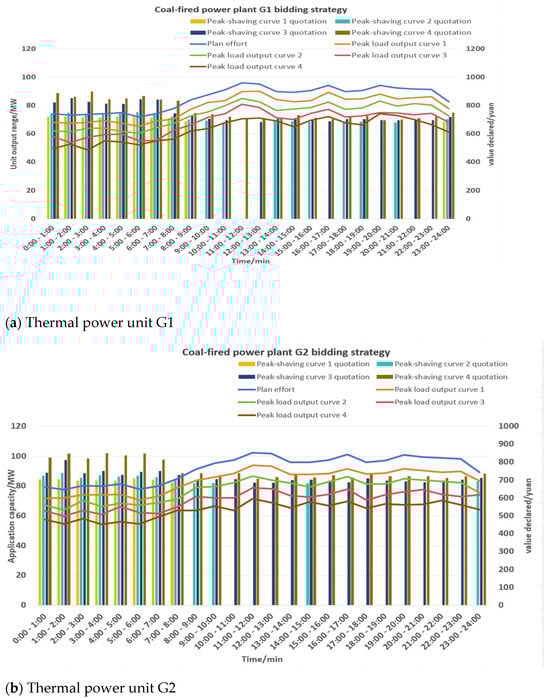
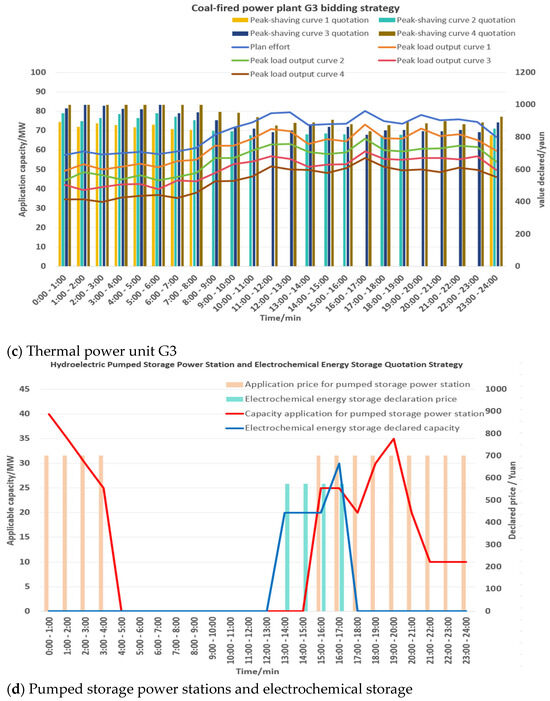
Figure 4.
The declaration status and clearing results of each participant in the original peak shaving market.
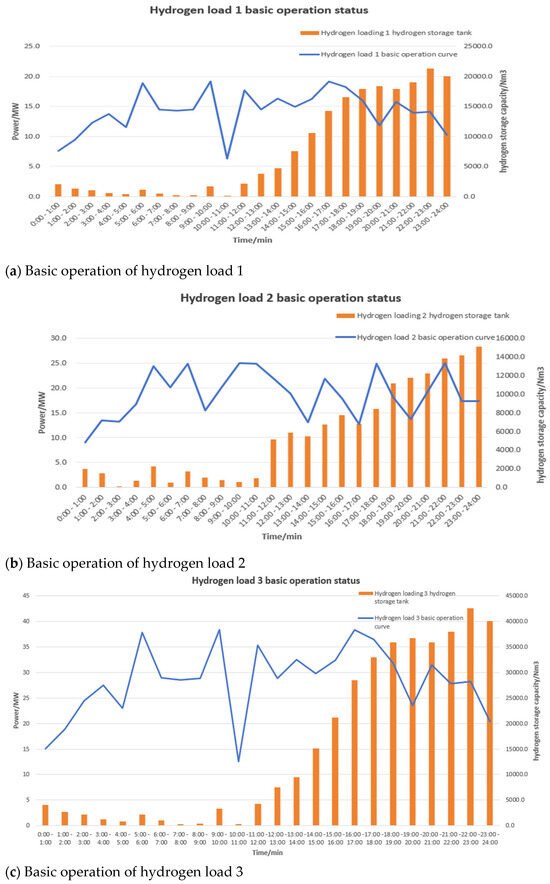
Figure 5.
The basic operation of each hydrogen load within the hydrogen load polymerization.

Table 1.
Technical parameters.
Table 2.
Economic parameters.
4.1. Verification and Comparison of Predictions
To quantitatively analyze the prediction results of the prediction model, the mean square error (MSE) was used as the loss value during the prediction process and recorded, and the root mean square error (RMSE), mean absolute error (MAE), and symmetric mean absolute percentage error (MAPE) were used as evaluation indicators. A comparative analysis of the proposed prediction model CNN-LSTM with traditional prediction models LSTM, support vector machine (SVM), and extreme learning machine (ELM).
The forecast results of the peak shaving demand are shown in Figure 6, and the results of the quantitative analysis of the forecast results based on the above three evaluation indicators are shown in Table 3. As shown in Figure 6, it can be easily observed from boxes 1 to 5 that the traditional LSTM deviates at 6:00, 9:00, 11:00, 12:00, 18:00, 19:00, and 21:00, respectively. The extreme learning machine’s predictions between 1:00 and 6:00, as well as 11:00 and 14:00, deviated significantly from the actual results. As shown in Table 3, the RMSE of CNN-LSTM is 3.700, which is 17.3% lower than that of the optimal traditional model SVM (4.474). For the rest of the metrics, CNN-LSTM was superior. Experimental results show that the improved CNN-LSTM time series prediction model has stronger adaptability and robustness in the prediction task, and the improved CNN-LSTM time series prediction model proposed in this paper is superior to the traditional models (LSTM, SVM, ELM).
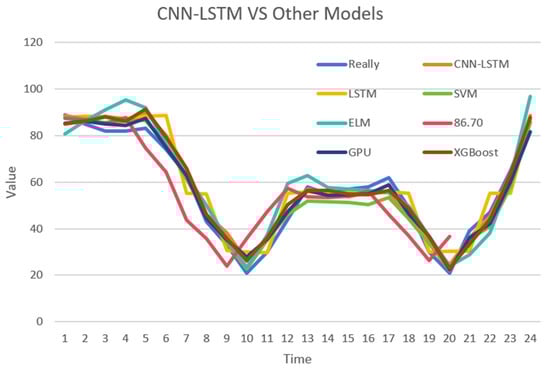
Figure 6.
Forecast results of peak shaving demand day.
Table 3.
Predictive model performance comparison.
4.2. Case Analysis of HLA’s Participation in Peak Shaving Market Before and After
4.2.1. Before HLA Participation
The clearing results of the peak shaving market before HLA participation are shown in Figure 7. The area indicated by the blue dots is the shortage of peak shaving capacity, indicating that the declared capacity of the peak shaving market during this period cannot meet the peak shaving demand. Due to the early hours of 4:00 to 7:00, the vast majority of electrical equipment is on standby or off, resulting in a large peak shaving demand during this period. However, the flexibility resources in the region, affected by the basic operating conditions and economic benefits, cannot provide more peak shaving capacity during this period, resulting in a peak shaving capacity shortage of 17.4 MW from 4:00 to 5:00. From 5:00 to 6:00, there is a shortage of 40 MW, and from 23:00 to 24:00, there is a shortage of 10.9 MW, totaling 68.3 MW. The shortfall in peak shaving capacity would reduce the flexibility of the region’s power system and lead to power curtailment.
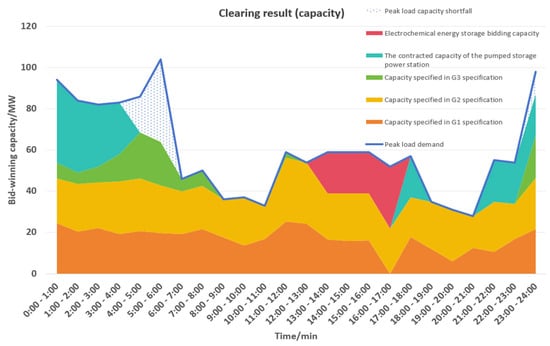
Figure 7.
The shaving market clearing results before HLA participation.
4.2.2. After HLA Participation
The reporting strategies for thermal power units, pumped storage power stations and electrochemical energy storage to participate in the peak shaving market are shown in Figure 8.
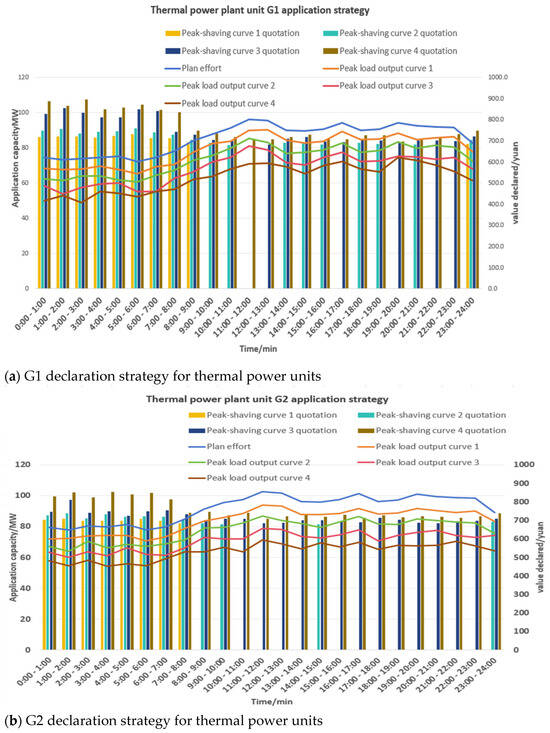
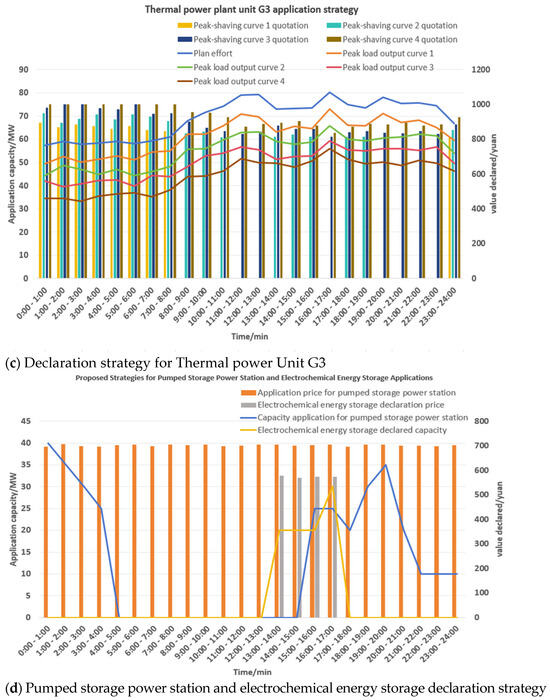
Figure 8.
The declaration strategies of thermal power units, pumped storage power stations, and electrochemical energy storage.
As shown in Figure 9, the HLA declaration strategy optimization model (quotation model, the same below) did not choose to actively declare excessive capacity during the 6:00 to 8:00 and 18:00 to 21:00 periods due to intense market competition and smaller profit margins compared to other periods. Due to the shortage from 4:00 to 7:00, the market competition is low and the profit margin is high. The quotation model declared appropriate peak shaving capacity during this period and declared at a higher quotation to ensure more profit. From 16:00 to 17:00 and from 21:00 to 23:00, despite the lower profit margins, there is less competition in the market, which ensures the maximum utilization rate of HLA’s internal peak shaving capacity and guarantees revenue. The quotation model declared more capacity in these two periods.
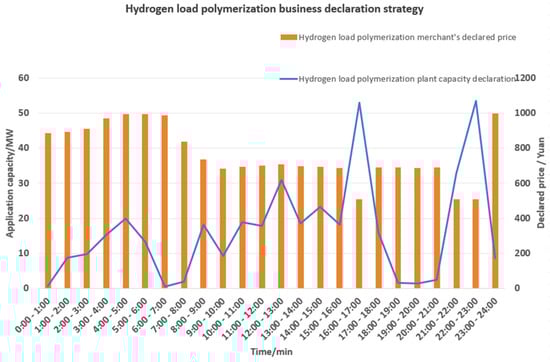
Figure 9.
Reporting strategy of HLA.
The clearing results of the peak shaving market after HLA participation are shown in Figure 10. After the participation of readily available HLA, the peak shaving capacity of the peak shaving market in the region is almost sufficient to meet the peak shaving demand. Based on the analysis of the simulation results, it was found that there was a capacity shortfall of only 0.4 MW from 23:00 to 24:00, accounting for 0.47% of the peak shaving demand during this period, reducing the capacity shortfall by 85.9 MW, with a reduction rate as high as 99.5%. Compared with before HLA participation, new flexibility resources were injected into the power system in the region, enhancing the stability of the power system.
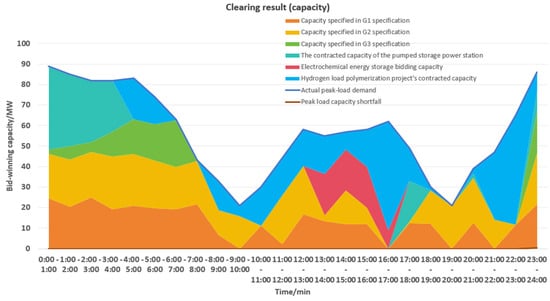
Figure 10.
The shaving market clearing results after HLA participation.
The HLA winning bid situation is shown in Figure 11. The quotation model declared a total peak shaving capacity of 394 MW, with a capacity utilization rate of 100%, and the winning bid capacity was 321.3 MW, accounting for 81.5% of the total declared capacity. A total of 24 time slots were declared, and 20 time slots were awarded, with a winning success rate of 83.3%. Among them, there were 12 time slots where all declared capacity was awarded, as well as 18 time slots where winning capacity accounted for more than 50% of declared capacity. The model received a total compensation of 192,891.55 yuan for winning bids on that day. Among them, the three periods with the highest winning bid prices were 4:00 to 5:00, 5:00 to 6:00, 23:00 to 24:00, at 993.7, 993.8, and 993.7, respectively. The declared capacities were 20 MW, 13.3 MW, and 8.5 MW, respectively, and all of them were awarded. The full-day peak shaving costs of the system operators and the full-day earnings of each participant were further analyzed. As shown in Table 4, the system operator’s full-day peak shaving cost was reduced by 58,268.31 yuan, with a reduction of 5.64%. The revenue of thermal power units G1, G2, and G3 decreased by 69,630.55 yuan, 108,811.29 yuan, and 8434.72 yuan, respectively, by 21.93%, 26.95%, and 7.79%, respectively. The revenue of pumped storage power stations decreased by 47,798.8 yuan, or 32.45 percent. Revenue from electrochemical energy storage dropped by 16,484.5 yuan, or 29.37 percent. HLA gained 192,891.55 yuan after participating in the peak shaving market. It can be seen that the design of the quotation model is successful, and the declaration strategy proposed by the quotation model is competitive in the peak shaving market.
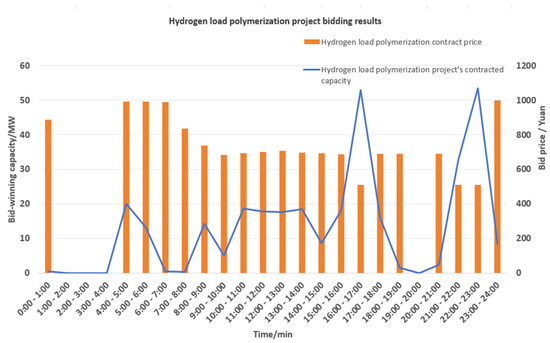
Figure 11.
Winning bid result of HLA.
Table 4.
System operator costs and benefits for all participants.
4.2.3. Analysis of HLA Internal Capacity Allocation Results
The HLA internal capacity allocation results are shown in Figure 12. The HLA capacity allocation model allocates all the peak shaving capacity obtained from the peak shaving market to the three internal hydrogen loads. Among them, hydrogen load 1 is allocated 23.37 MW, with a profit of 18,721.9 yuan, and hydrogen load 2 is allocated 49.46 MW, with a profit of 33,281.82 yuan. Hydrogen load 3 is allocated 212.7 MW, generating a profit of 140,887.8 yuan. As can be seen from Figure 5c, hydrogen load 3 reserved 49,970.7 standard cubic meters of hydrogen storage space before participating in peak shaving ancillary services, making more adequate preparations for participating in peak shaving ancillary services and thus obtaining more benefits. Internal capacity allocation and benefits of HLA are shown in Table 5.
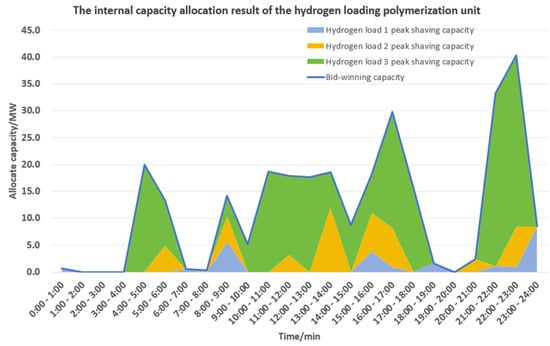
Figure 12.
Internal capacity allocation results of HLA.
Table 5.
Internal capacity allocation and benefits of HLA.
5. Conclusions
This paper designs an improved time series prediction model for predicting peak shaving demand from the perspective of HLA, a declaration strategy model for peak shaving markets involving HLA and taking into account multiple types of peak shaving resources, and a clearing model. The following conclusions were obtained through simulation verification:
(1) The improved CNN-LSTM time series prediction model proposed in this paper has stronger adaptability and robustness in the prediction task, and it is known that it is superior to traditional models (LSTM, SVM, ELM) according to the analysis of evaluation indicators.
(2) The declaration strategy model of the peak shaving market involving multiple types of peak shaving resources with HLA participation can fully consider the contribution of peak shaving capacity of other traditional peak shaving resources and the marginal cost of the market to formulate market-competitive declaration strategies.
(3) The clearing model of the peak shaving market involving HLA, which takes into account multiple types of peak shaving resources, can effectively solve the problem of insufficient peak shaving capacity in the peak shaving market and reduce the peak shaving cost of the peak shaving market system operator by 5.64%.
(4) The HLA internal capacity allocation model can reasonably allocate the peak shaving capacity that HLA acquires from the electricity market internally to ensure that the total cost of HLA internal peak shaving is minimized.
The study in this paper provides an effective theoretical reference for the model design of HLA participation in the peak shaving market. The next step of research will delve into the game model of HLA in the peak shaving market.
Author Contributions
Conceptualization, Z.H.; methodology, T.S.; writing—original draft preparation, L.G.; writing—review and editing, Z.L. All authors have read and agreed to the published version of the manuscript.
Funding
This research was funded by Major project of the National Natural Science Foundation of China, grant number 62192753 and 52307207.
Data Availability Statement
Data are contained within the article.
Conflicts of Interest
Author Libo Gu was employed by the company Nanjing Water Group Co., Ltd. The remaining authors declare that the research was conducted in the absence of any commercial or financial relationships that could be construed as a potential conflict of interest.
Abbreviations
The following abbreviations are used in this manuscript:
| HLA | Hydrogen Load Aggregator |
| CNM-LSTM | Convolutional Neural Networks–Long Short-Term Memory |
| PBDR | Price-Based Demand Response |
| DPR | Deep Peak Regulating |
References
- Zhao, G.; Qian, G.; Wang, S.; Ding, Q.; Zhu, H. Analysis on green and low-carbon development path for power industry to realize carbon peak and carbon neutrality. Huadian Technol. Publ. House 2021, 43, 11–20. (In Chinese) [Google Scholar]
- Jing, P.; Xu, G.; Zhao, B.; Yang, C.; Wang, L.; Jin, Y.; Xiao, Y. Large-scale Energy Storage Technology for Global Energy Internet. Smart Grid 2015, 3, 486–492. (In Chinese) [Google Scholar]
- Zhang, H.; Yuan, T.; Tan, J. Medium and Long-term Forecast of Hydrogen Load in Unified Energy System. Proc. CSEE 2021, 41, 3364–3372+3662. (In Chinese) [Google Scholar]
- Cai, G.; Kong, L.; Xuan, Y.; Sun, B. Overview of Research on Wind Power Coupled with Hydrogen Production Technology. Autom. Electr. Power Syst. 2014, 38, 127–135. (In Chinese) [Google Scholar]
- Wu, B.; Fu, Y.; Wu, Y.; Zhou, Y. Electricity Spot Market Trading Mechanism Considering Renewable Energy Curtailment and Peak Shaving Compensation. In Proceedings of the 2025 2nd International Conference on Smart Grid and Artificial Intelligence (SGAI), Changsha, China, 21–23 March 2025; pp. 1298–1304. [Google Scholar] [CrossRef]
- Ma, Y.; Chen, Y.; Tang, J.; Qiu, W.; Chen, X.; Li, J.; Lin, Z. Optimal Operational Strategy of Virtual Power Plant Considering the Participation in the Joint Markets of the Electricity Spot and Auxiliary Service Market. In Proceedings of the 2023 6th International Conference on Energy, Electrical and Power Engineering (CEEPE), Guangzhou, China, 12–14 May 2023; pp. 1586–1590. [Google Scholar] [CrossRef]
- Manoochehri, H.; Fereidunian, A. A multimarket approach to peak-shaving in Smart Grid using time-of-use prices. In Proceedings of the 2016 8th International Symposium on Telecommunications (IST), Tehran, Iran, 27–28 September 2016; pp. 707–712. [Google Scholar] [CrossRef]
- Li, B.; Xu, S.; Fu, J.; Fu, X.; Wang, Y.; Zhu, X.; Li, C.; Li, J. Optimal Scheduling of Multiple Energy Storage-Thermal Power Units under Electricity Market. In Proceedings of the 2024 IEEE 4th New Energy and Energy Storage System Control Summit Forum (NEESSC), Hohhot, China, 29–31 August 2024; pp. 255–260. [Google Scholar] [CrossRef]
- Tziovani, L.; Hadjidemetriou, L.; Timotheou, S. Energy Storage Arbitrage and Peak Shaving in Distribution Grids Under Uncertainty. In Proceedings of the 2022 IEEE PES Innovative Smart Grid Technologies Conference Europe (ISGT-Europe), Novi Sad, Serbia, 10–12 October 2022; pp. 1–5. [Google Scholar] [CrossRef]
- Fan, Y.; Zhang, P.; Luo, L.; Cao, Y.; Wang, N.; Chen, Y.; Yang, J.; Qin, Z. Operational Strategy of Virtual Power Plant for Participating in Coupled Peak-Shaving and Carbon Markets. In Proceedings of the 2024 IEEE PES 16th Asia-Pacific Power and Energy Engineering Conference (APPEEC), Nanjing, China, 25–27 October 2024; pp. 1–6. [Google Scholar] [CrossRef]
- Lan, G.; Zhang, Z.; Guo, M.; Lan, L.; Lyu, R.; Wang, S. Research on Virtual Power Plants Participating in Ancillary Service Market. In Proceedings of the 2022 2nd International Conference on Electrical Engineering and Control Science (IC2ECS), Nanjing, China, 16–18 December 2022; pp. 979–985. [Google Scholar]
- Zhao, S.; Song, J.; Wang, A.; Li, Z. Power Spot Market Operation Optimization Considering Time-Sharing Bidding Game of New Energy-Thermal Power Bilateral Peak-Load Trading. Acta Energiae Solaris Sin. 2024, 45, 153–161. (In Chinese) [Google Scholar] [CrossRef]
- Zhang, Z.; Cong, W.; Liu, S.; Li, C.; Qi, S. Auxiliary service market model considering the participation of pumped-storage power stations in peak shaving. Front. Energy Res. 2022, 10, 915125. [Google Scholar] [CrossRef]
- Zhang, K.; Yang, X.; Zhang, H.; Yang, C.; Zhang, L. A Study on the Optimal Configuration of Hydrogen Energy Storage in the distribution Network Considering Photovoltaic-Energy Storage Coupling Participating and Peak Shaving. Power Syst. Clean Energy 2023, 39, 95–103+112. (In Chinese) [Google Scholar]
- Zou, Y.; Hu, Z.; Zhou, S.; Luo, Y.; Han, X.; Xiong, Y. Day-ahead and intraday two-stage optimal dispatch considering joint peak shaving of carbon capture power plants and virtual energy storage. Sustainability 2024, 16, 2890. [Google Scholar] [CrossRef]
- He, F.; Zhou, Q.; Zhang, Y.; Wang, B.; Hu, X.; Li, G. The Joint Peak Regulation-Electricity Clearing Model Considering Multiple Types of Subjects. Power Syst. Clean Energy 2024, 40, 48–55. (In Chinese) [Google Scholar]
- Yu, H.; Dong, S.; Lu, Z.; Zhou, Y.; Wen, G.; Zhang, Y.; Gao, Y.; Li, X. Bidding Strategy of Energy Storage Participating in the Auxiliary Market of Peak and Frequency Modulation in New Power System. Electr. Power 2023, 56, 48–60. (In Chinese) [Google Scholar]
- Li, J.; An, C.; Li, C.; Zhang, Z.; Liu, R. Multi-Objective Optimization Scheduling Method Considering Peak Regulating Market Transactions for Energy Storage-New Energy-Thermal Power. Trans. China Electrotech. Soc. 2023, 38, 6391–6406. (In Chinese) [Google Scholar] [CrossRef]
- Zhang, X.; Gao, X.; Zhu, J.; Chen, P.; Guo, Y.; Lu, C. Joint Optimization of Day-Ahead Energy and Peak Regulation Considering Multi-Type Market Entities. Acta Energiae Solaris Sin. 2024, 45, 357–366. (In Chinese) [Google Scholar] [CrossRef]
- Yu, H.; Zhang, M.; Xu, J.; Dong, Y.; Weng, J. Low-Carbon Economic Dispatching Strategy of Virtual Power Plant Participating in Electricity Market Considering Carbon Trading and Demand Response. J. Shanghai Univ. Electr. Power 2023, 39, 211–218. (In Chinese) [Google Scholar]
- Qi, L.; Zheng, W.; Zou, Q.; Song, J.; Chen, M.; Dai, X. Research on the Offer Strategy of Energy Storage Participation in the Deep Peaking Auxiliary Market. Sci. Technol. Ind. 2023, 23, 55–59. (In Chinese) [Google Scholar]
- Zhang, Y.; Min, L.; Tian, K.; Fan, L.; Hu, C. Research on Peak Shaving Demand Forecasting of Power Grid Based on Ridge Regression. Hydropower Pumped Storage 2021, 7, 74–76. (In Chinese) [Google Scholar]
- Pan, M. Research on the Trading Mechanism of the Day-Ahead Peak and Frequency Regulation Ancillary Services Market with Large-Scale Wind Power. Master’s Thesis, Harbin Institute of Technology, Harbin, China, 2020. [Google Scholar]
- Zhang, A. Medium and Long-Term Power Demand Forecasting Based on a Multi-Indicator Model. Master’s Thesis, Changsha University of Science & Technology, Changsha, China, 2013. (In Chinese). [Google Scholar]
- Yang, J. Research on the Two-Stage Operation Optimisation of an Integrated Energy System Taking into Account Source-Load Fluctuations. Master’s Thesis, North China Electric Power University (Beijing), Beijing, China, 2021. (In Chinese). [Google Scholar]
- Shi, X.; Xing, H.; Wang, H.; Huang, C.; Zhao, J. Low-carbon optimal scheduling of wind-solar-to-hydrogen ammonia synthesis system based on opportunity constraints. High Volt. Eng. 2025, 1–14. (In Chinese) [Google Scholar] [CrossRef]
- Yang, L.; Wu, F.; Song, X.; Shi, L.; Lin, K.; Hong, F. Data-Driven Chance-Constrained Schedule Optimization of Cascaded Hydropower and Photovoltaic Complementary Generation Systems for Shaving Peak Loads. Sustainability 2023, 15, 16916. [Google Scholar] [CrossRef]
- Lei, K.; Chang, J.; Wang, X.; Guo, A.; Wang, Y.; Ren, C. Peak shaving and short-term economic operation of hydro-wind-PV hybrid system considering the uncertainty of wind and PV power. Renew. Energy 2023, 215, 118903. [Google Scholar] [CrossRef]
- Lin, L.; Tian, X. Analysis of Deep Peak Regulation and Its Benefit of Thermal Units in Power System with Large Scale Wind Power Integrated. Power Syst. Technol. 2017, 41, 8. (In Chinese) [Google Scholar] [CrossRef]
- Li, J.; Dong, F.; Guo, Q.; Luo, X.; Hao, Q.; Li, Q.; Zhu, X.; Li, C. Quantitative Assessment of the Integrated Efficiency of Pumped Storage Power Stations Considering Peak Shifting Characteristics. J. Glob. Energy Interconnect. 2024, 7, 567–578. [Google Scholar]
- Zhu, Y. Economic Evaluation of Large-Scale Energy Storage Technology for Multi-Energy Coupled Power Generation SYSTEM. Master’s Thesis, Zhejiang University, Zhejiang, China, 2024. (In Chinese). [Google Scholar]
- Chen, Y.; Chen, J.; Zhang, W.; Ni, C.; Zhao, B. Optimal scheduling strategy of distributed electric-thermo-hydrogen system considering lifetime decay characteristics of electrolytic cell and battery. Electr. Power Autom. Equip. 2023, 43, 135–142. [Google Scholar]
- Hochreiter, S.; Schmidhuber, J. Long short-term memory. Neural Comput. 1997, 9, 1735–1780. [Google Scholar] [CrossRef] [PubMed]
- Vaswani, A.; Shazeer, N.; Parmar, N.; Uszkoreit, J.; Jones, L.; Gomez, A.N.; Kaiser, L.; Polosukhin, I. Attention is all you need. arXiv 2017, arXiv:1706.03762. [Google Scholar]
- Caruana, R. Multitask learning. Mach. Learn. 1997, 28, 41–75. [Google Scholar] [CrossRef]


Disclaimer/Publisher’s Note: The statements, opinions and data contained in all publications are solely those of the individual author(s) and contributor(s) and not of MDPI and/or the editor(s). MDPI and/or the editor(s) disclaim responsibility for any injury to people or property resulting from any ideas, methods, instructions or products referred to in the content. |
© 2025 by the authors. Licensee MDPI, Basel, Switzerland. This article is an open access article distributed under the terms and conditions of the Creative Commons Attribution (CC BY) license (https://creativecommons.org/licenses/by/4.0/).