Abstract
Volcanic rocks are rich in high-quality oil and gas and represent a key future exploration target. However, bottom water coning in complex reservoirs severely reduces extraction efficiency. This study uses numerical simulation to analyze how permeability, oil layer thickness, interlayers, and horizontal well parameters affect water coning. Results indicate that a permeability ratio of 0.02 delays water breakthrough and increases displacement efficiency by 20%. An oil–water volume ratio of 20 improves displacement efficiency and stabilizes water cut rise. Recovery increases by 15% when the oil layer exceeds 25 m in thickness, with coning expanding significantly at 35 m. A 200 m interlayer can reduce water cut rise by 30%. Optimal well spacing of 300–400 m increases recovery by 10–15%, while a horizontal section of 300–500 m improves reserve recovery. Placing the well 35 m from the top of the layer slows water cut rise.
1. Introduction
Located in the central Gurbantunggut Desert, the Shixi Carboniferous reservoir in the Junggar Basin is a deeply buried, high-temperature, high-pressure fault-block reservoir controlled by structural features [1,2]. The reservoir exhibits low permeability, low porosity, and strong heterogeneity, classifying it as a low-permeability reservoir where conventional extraction methods prove largely ineffective. Severe water coning has significantly compromised production performance, resulting in early water breakthroughs and low recovery rates [3,4,5]. Consequently, addressing water coning in the Shixi Carboniferous formation has become an urgent priority. This study employs numerical simulation to optimize development parameters, enhance production efficiency, extend the high-efficiency production period, and ultimately improve both recovery factor and output.
‘Bottom water coning’ is a phenomenon in bottom water oil and gas reservoirs where a drop in wellbore pressure causes bottom water to break through into the well [6,7,8]. The core issue in the development of bottom water reservoirs is to control bottom water coning and maximize the extension of the water-free oil production period of oil wells, thereby increasing cumulative oil production and recovery efficiency [9,10,11]. Regarding the study of low-water conditions in reservoirs, numerous research findings have been published. Armenta et al. [12,13,14] investigated nonlinear seepage flow in low-permeability reservoirs, artificial water injection for water control and production stabilization, and the three-zone seepage mode in shale oil reservoirs. Their studies indicate that fracture stress sensitivity and the development of bedding fractures influence seepage characteristics, while artificial water injection can effectively suppress bottom water coning. Wang et al. [15]’s study experimentally demonstrates that nitrogen injection via horizontal wells can suppress bottom water coning and enhance oil recovery by obstructing water flow channels. In the study of seepage characteristics in low-permeability oil and gas fields, Siemek et al. [16,17] reviewed the multi-scale mechanisms and numerical models of unsaturated flow in fractured media and proposed strategies for enhancing water flooding efficiency by improving the ternary pore structure in low-permeability sandy conglomerate reservoirs. In Liu et al. [18]’s research, the mechanisms underlying bottom water coning were investigated using both simulation and experimental approaches. By producing fluids from the oil and water zones, water breakthrough was effectively delayed, thereby improving crude oil recovery.
Due to its unique bottom water characteristics, bottom water reservoirs are influenced by numerous factors and are prone to water coning during production, leading to a rapid increase in water cut and affecting oil recovery [19,20,21]. Scholars worldwide have conducted in-depth research on the mechanism of water coning in bottom water reservoirs. For example, Ma et al. [22] proposed a numerical simulation-based method to predict the water injection in bottom water reservoirs, studying the dynamic characteristics of water cones and providing theoretical support for the development of such reservoirs. Additionally, Wu et al. [23] explored the mechanisms for enhancing oil recovery in edge–bottom water reservoirs and summarized the effectiveness of different oil displacement technologies in controlling water coning. Shan et al. [24] conducted a study on a homogeneous sandstone bottom water reservoir. By integrating numerical simulation with reservoir engineering methods, he analyzed the key factors influencing water coning formation and proposed effective strategies for water coning control. These studies offer valuable insights into the development of similar reservoirs worldwide. Numerical simulation technology is a crucial tool for studying bottom water coning. Chi et al. [25,26,27] investigated the development patterns of water coning in bottom water reservoirs, optimized production strategies, and analyzed factors influencing oil displacement efficiency, providing new ideas for enhancing oil recovery. Al-Obaidi et al. [28,29,30] employed theoretical derivations, physical and numerical simulations, and orthogonal experiments to reveal the influence mechanism of bottom water coning on water cut rise in horizontal wells. They proposed optimization methods for parameters such as permeability and perforation degree, as well as solutions to improve simulation accuracy. Chen et al. [31,32,33] combined mathematical modeling, numerical simulation, and orthogonal experiments to clarify the mechanism of edge and bottom water intrusion and the oil–water flow pattern. They also evaluated the specific impacts of factors such as permeability and crude oil viscosity on oil recovery efficiency. Research shows that the efficiency of bottom water replacement is significantly affected by geological characteristics and development strategies. However, relying solely on a single technology makes it difficult to meet water control needs throughout the entire life cycle of a reservoir. Therefore, further studies are still needed on the effects under the synergistic influence of multiple technologies.
This study focuses on investigating the mechanisms of bottom water reservoirs. Based on governing equations, this study delves into the formation and development mechanisms of bottom water coning. It also provides a systematic analysis of the coupling mechanisms between geological factors, development parameters, and their combined effects on the dynamic evolution of coning and ultimate recovery efficiency. Through numerical simulation approaches, we reveal the influence patterns of key geological parameters—including permeability ratio, oil layer thickness, and interlayer distribution—on coning behavior. Furthermore, we optimize critical development parameters such as horizontal well length and vertical placement. The research outcomes provide both theoretical foundations and technical support for developing similar bottom water reservoirs.
2. Physical Simulation Model
2.1. Fundamentals of the Model
The core feature of the model is to reduce computational complexity by simplifying the fluid phase relationships while maintaining engineering accuracy. The evolution of the phase field is governed by a set of coupled partial differential equations (PDEs), which are usually derived based on fluid mechanics principles. The core of the equations consists of mass conservation equations for oil, gas, and water phases, combined with Darcy’s law to describe the flow behavior. The specific governing equations are as follows.
① Darcy’s law
where represents the oil phase seepage velocity, represents absolute permeability, represents the relative permeability of the oil phase, is the oil phase viscosity, is the gradient operator, and where is the oil phase pressure, is the oil phase density, is the acceleration due to gravity, and is the depth. Darcy’s law forms for the gas phase and the water phase are similar; only the corresponding parameters need to be replaced. Equation (1) describes the flow velocity of a fluid in a porous medium driven by a pressure gradient.
② Mass conservation equation
Equation (2) is the mass conservation equation for oil, gas, and water, respectively, where represents porosity and represents the saturation of each phase. In the gas-phase mass conservation equation, the first term on the left side represents the total rate of change of the mass of free and dissolved gases. The second item represents the total amount of dissolved gas that flows freely and with the oil phase.
③ Boundary condition control equations
where represents the oil–water capillary pressure and represents the oil–gas capillary pressure.
2.2. Geological Model Construction
Figure 1 illustrates the establishment of the 3D model. The numerical simulation model is built with a grid of 80 × 80 × 50. The horizontal grid size of 10 m × 10 m can effectively represent inter-well interference and the planar fluid flow patterns; the vertical grid thickness is 0.9 m, with a total thickness of 45 m. By subdividing the layers, the model improves the resolution of reservoir heterogeneity and the process of bottom water coning.
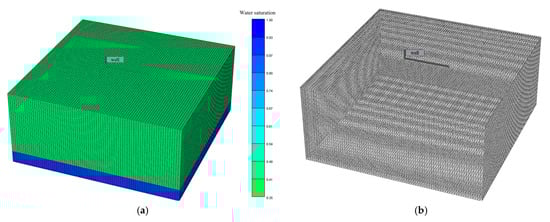
Figure 1.
Establishment of a 3D model. (a) Geometric model, (b) mesh generation.
2.3. Model Parameters
Table 1 shows the parameters of the horizontal well model. In this simulation, the permeability range of the reservoir is set to 0.02–0.3. The purpose is to accurately characterize the low-permeability matrix widely distributed in volcanic reservoirs, which determines the overall development effectiveness, rather than the locally rare high-permeability ‘sweet spots’. On this basis, combined with the actual production data of the target block, key parameters such as bottom water energy, reservoir thickness, and interlayer size were comprehensively determined. This parameter system ensures that the simulation model has good geological representativeness, thereby providing a reference with practical engineering significance for the optimization of development plans.

Table 1.
Parameters of horizontal well model.
2.4. Water Coning Mechanism
Figure 2 shows a schematic diagram of the seepage model during the bottom water coning process. In the development of bottom water reservoirs, oil wells are usually drilled only into the upper oil-bearing layers of the reservoir. During production, an upward water cone often forms near the wellbore at the oil–water interface. As the oil well production rate increases, this water cone continues to rise, and its tip eventually reaches the wellbore. Before oil production begins, the oil–water interface usually remains in a relatively stable horizontal plane. In Figure 2, Pw represents the pressure inside the wellbore, Pc represents the capillary pressure, H represents the height of the water cone, and r is the horizontal distance from the center of the wellbore to a specific point in the reservoir. Where V1 represents the total fluid flow rate, V1v represents the vertical component of the fluid flow velocity, and θ represents the angle between the direction of the flow velocity and the horizontal direction.
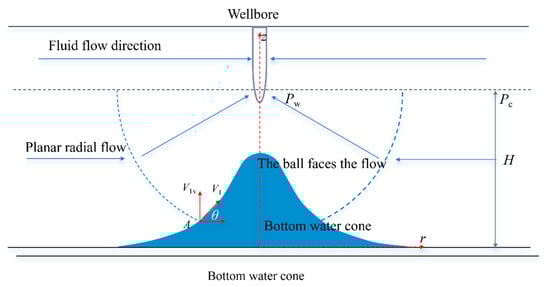
Figure 2.
Schematic diagram of the seepage model at the water quality point of the bottom water cone.
3. Results
3.1. Analysis of Geological Factors
3.1.1. Permeability Ratio
The permeability ratio is used to measure the range of differences in permeability between the oil layer and the bottom water layer, specifically referring to the ratio of the permeability of the reservoir layer to that of the bottom water layer. To explore the impact of the permeability ratio on bottom water coning, four groups of different permeability ratio levels were set, ranging from 0.02 to 0.30. Through the construction of a corresponding conceptual model and numerical simulation, the morphological changes in bottom water coning under different ratio conditions were obtained. Meanwhile, the dynamic data of recovery factor and water cut were also acquired.
According to the simulation results in Figure 3, all four permeability ratios exhibit the phenomenon of bottom water coning. While the overall trend remains consistent, at a permeability ratio of 0.02, the radius of the bottom water cone is larger. In this scenario, the water sweep range is broader, indicating a more pronounced bottom water coning effect. When the permeability ratio increases to 0.30, the water cone radius decreases significantly, and the area affected by bottom water also diminishes. This phenomenon suggests that a lower permeability ratio is more likely to trigger notable bottom water coning. This also helps expand the coverage of bottom water drive, thereby enhancing development efficiency.
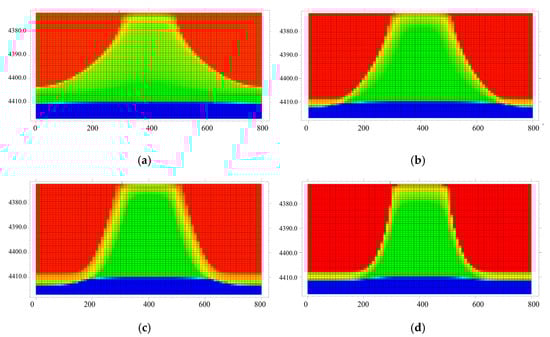
Figure 3.
Plot of permeability ratio versus water cone distribution characteristics: (a) 0.02, (b) 0.08, (c) 0.15, (d) 0.3.
The relationship between water cut, recovery factor, and water cone rise height over time is illustrated in Figure 4. It can be seen from the curve in Figure 4a that as the permeability ratio decreases, the recovery degree at the same water cut level increases. From the dot line Figure 4b, it is observed that as the permeability ratio decreases, the water cone rises higher within the same period. When the permeability ratio is small, the vertical permeability decreases, and the bottom water coning speed is also suppressed. This extends the effective displacement time of crude oil, thereby helping to improve the recovery rate.
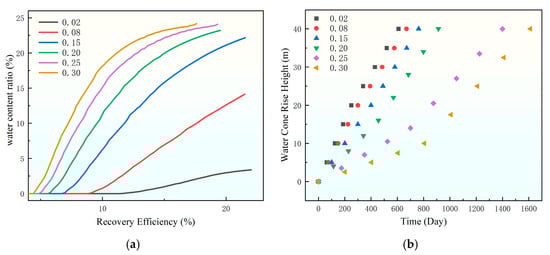
Figure 4.
Influence curve of permeability ratio on water content ratio. (a) Chart of the change in recovery degree with moisture content, (b) water cone rise height.
3.1.2. Bottom Water Drive Energy
Bottom water energy is a parameter that measures the strength of bottom water drive, directly affecting water coning trends and reservoir development performance. To thoroughly investigate the specific impact of this factor on the bottom water coning process, this study established five different levels of bottom water energy, corresponding to bottom-water-volume-to-oil-volume ratios of 5 times, 10 times, 20 times, 50 times, and 100 times, respectively. Numerical simulation analysis was then conducted based on these conditions.
The relationship between bottom water energy and water cone distribution characteristics is illustrated in Figure 5. When the bottom water energy is only 5 times, the driving capacity is significantly insufficient. The oil well exhibits a rapid increase in water cut shortly after production begins, and the bottom water coning process becomes particularly severe. Water breakthrough occurs before the crude oil is fully displaced, resulting in a low recovery factor and noticeably inhibited overall development performance. The energy of bottom water gradually increases, especially when the ratio rises to 10 times or more. At this point, the bottom water possesses strong and sustained driving capacity, enabling it to maintain relatively stable production conditions in oil wells. At this stage, the impact of bottom water coning on recovery efficiency weakens significantly. The oil displacement process becomes more stable, and the rate of water cut increase slows down.
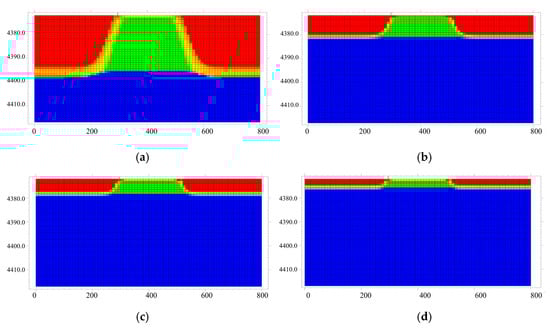
Figure 5.
Diagram of the relationship between bottom water energy and water cone distribution characteristics: (a) 5 times, (b) 10 times, (c) 20 times, (d) 100 times.
The variation relationship between bottom water energy and water cut is demonstrated in Figure 6. As the curve shows, the water cut exhibits a continuous upward trend with increasing bottom water energy. In the initial stage, the growth of water cut is relatively gradual. However, once the bottom water energy reaches a certain intensity, the rate of water cut increase accelerates significantly. When the bottom water energy exceeds 20 times, the slope of the curve gradually decreases and eventually stabilizes. This trend shows that stronger bottom water drive enhances displacement efficiency, bringing more formation water with the oil. The flattening curve later indicates the driving effect stabilizes once reaching a certain level.
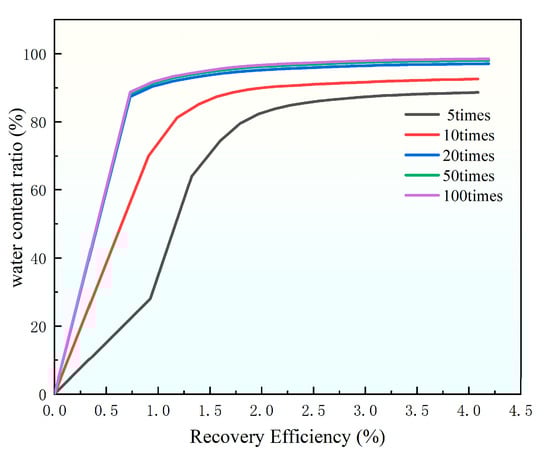
Figure 6.
Effect curve of bottom water energy on water content ratio.
3.1.3. Oil Layer Thickness
As a critical geological parameter, oil layer thickness significantly influences bottom water coning and reservoir development outcomes. To systematically investigate the mechanism of thickness variation on coning behavior, this study established four oil layer thickness levels, 15 m, 20 m, 25 m, 30 m, and 35 m, and conducted numerical simulation analysis based on these configurations.
The distribution patterns of water cones under different oil layer thicknesses are illustrated in Figure 7. As oil layer thickness increases, water cone volume generally expands, and bottom water coning behavior becomes significantly more pronounced. This reflects how oil layer thickness provides critical spatial conditions for the vertical migration of water bodies. In the 15 m thin oil layer, the water cone exhibits a convergent shape with limited spatial extent and weak coning tendency. When the thickness increases to 20 m and 25 m, the water cone volume and coning range show stepwise growth. In contrast, the 35 m-thick oil layer demonstrates a sharp surge in water cone volume and a rapid expansion of the coning area, with a particularly notable acceleration in growth rate once the thickness exceeds 25 m. This phenomenon occurs because thick oil layers not only reduce the vertical flow resistance of bottom water but also alter the pressure distribution pattern, thereby accelerating water cone development. Conversely, thin oil layers restrict fluid migration due to limited vertical space. The study reveals that oil layer thickness, by regulating vertical flow space and pressure gradients, serves as a key geological factor influencing water cone development. Moreover, its controlling effect undergoes an abrupt enhancement when the thickness exceeds 25 m.
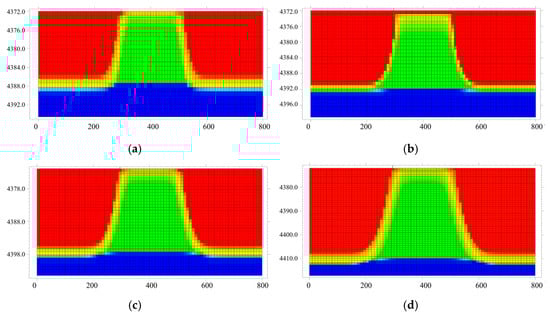
Figure 7.
Relationship between oil layer thickness and water cone distribution characteristics: (a) 15 m, (b) 20 m, (c) 25 m, (d) 35 m.
As shown in Figure 8, under conditions of identical water content, the oil layer thickness exhibits a significant positive correlation with the recovery factor. The recovery efficiency of oil layers with different thicknesses varies significantly. For instance, oil layers thicker than 20 m exhibit a rapid increase in recovery degree during the low water cut stage, with a steep initial slope, indicating high initial oil recovery efficiency. In contrast, oil layers thinner than 10 m show a slower growth in recovery degree and a gentler slope, reflecting the particularly significant influence of bottom water coning. Thick layers delay water breakthrough by increasing the wellbore-to-interface distance and enhancing gravitational resistance to water coning. Thin layers experience rapid water breakthroughs with weak gravity effects, accelerating water cut rise and limiting recovery. Oil layer thickness is therefore critical to recovery efficiency, with thick layers enabling more effective development.
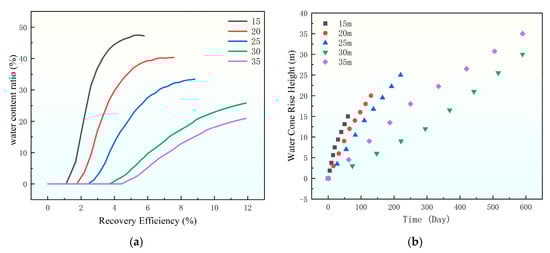
Figure 8.
Influence curve of oil layer thickness on water content ratio. (a) Chart of the change in recovery degree with moisture content, (b) water cone rise height.
3.1.4. Interlayer Size
The distribution characteristics of bottom water coning exhibit a distinct pattern under varying interlayer sizes (X-direction length), as shown in Figure 9. With increasing interlayer length along the X-direction, the distribution range of water cones progressively expands, demonstrating that interlayer size is a key controlling factor for coning behavior. When the interlayer size is 0 m, the water cone distribution appears most concentrated. At 50 m, the distribution area expands by approximately 40% compared to the initial state. Further increasing the size to 100 m results in a 70% expansion relative to the baseline. However, once the size exceeds 150 m, the growth rate significantly diminishes to less than 10%, indicating that the influence of interlayer size approaches saturation. This phenomenon may be closely related to the obstructive effect of interlayers on fluid flow. Smaller interlayer sizes, such as 0 m, cause less interference to the fluid, resulting in a more concentrated water cone distribution. As the size increases, the interlayer’s barrier effect strengthens, diverting water cones to a broader area. Beyond a critical threshold (150 m), the impact on fluid flow stabilizes, and subsequent changes in water cone distribution become marginal.
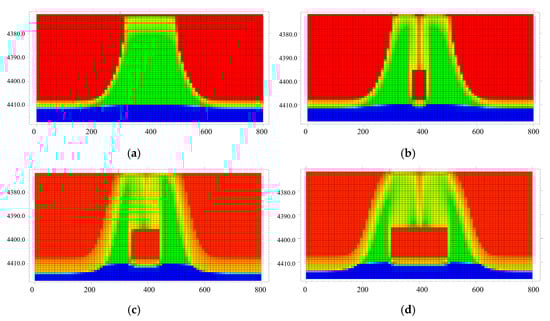
Figure 9.
Diagram of the relationship between the size of the interlayer and the distribution characteristics of the water cone: (a) 0 m, (b) 50 m, (c) 100 m, (d) 200 m.
At equal water cut levels, the recovery factor shows an upward trend as the X-direction interlayer length increases, as seen in Figure 10. The underlying mechanism primarily lies in the impermeable interlayer’s ability to effectively restrict the rapid advancement of bottom water toward the wellbore. When interlayer dimensions are sufficiently large, bottom water is forced to traverse extended flow paths to reach the wellbore, resulting in significantly constrained coning velocity. This delayed water breakthrough consequently slows the water cut rise rate and enhances ultimate oil recovery. In conclusion, interlayer size exerts substantial influence on bottom water coning behavior, establishing itself as one of the critical geological factors governing coning dynamics.
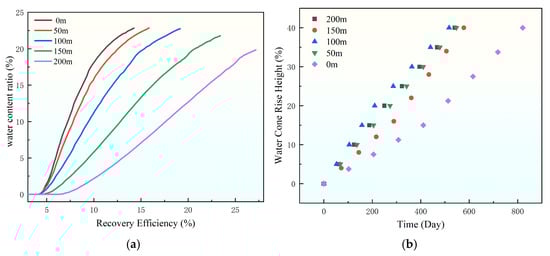
Figure 10.
The influence of the size of the interlayer on water content ratio. (a) Chart of the change in recovery degree with moisture content, (b) water cone rise height.
3.2. Engineering Impact
3.2.1. Well Spacing
The length of the horizontal section, as a critical parameter in horizontal well development, exerts significant influence on bottom water coning behavior and reservoir production performance. To thoroughly investigate the specific effects of horizontal section length on bottom water coning, we designed five distinct horizontal well length scenarios (100 m, 200 m, 300 m, 400 m, and 500 m) for numerical simulation analysis.
The relationship between well spacing and water coning distribution characteristics is illustrated in Figure 11. As the length of the horizontal section increases, the water cone consistently exhibits an upward coning trend, but its specific characteristics vary significantly. When the horizontal section length is 100 m, the water cone is small and convergent as shown in Figure 11a. When increased to 200 m, the scale of the water cone expands slightly but remains relatively limited as shown in Figure 11b. At lengths of 300 m and 500 m, the water cone not only increases in height but also shows significant lateral expansion as shown in Figure 11c,d. In the stage from 100 m to 300 m, the increase in water cone height and volume accounts for about 70% of the total change, representing the main development stage. Beyond 300 m, the increase slows down to 30%, indicating that water cone expansion tends to stabilize. A longer horizontal section reduces the pressure gradient and flow resistance near the wellbore, thereby exacerbating the bottom water coning effect. In conclusion, the length of the horizontal section is positively correlated with the water cone morphology, but beyond a certain length, the expansion rate of the water cone decreases significantly.
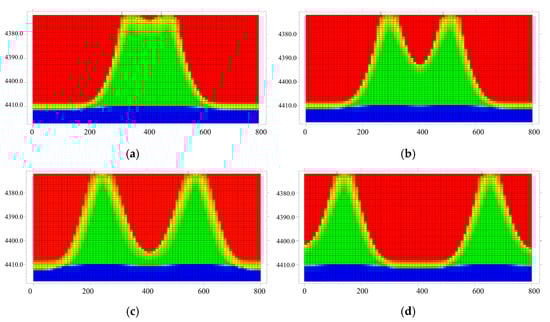
Figure 11.
Relationship between well spacing and water cone distribution characteristics: (a) 100 m, (b) 200 m, (c) 300 m, (d) 500 m.
The recovery factor and water cut variation curves over time under different horizontal well section lengths are presented in Figure 12. It can be observed from the figure that, at the same water cut, a longer horizontal well section leads to a higher recovery degree. This is primarily because a longer horizontal well section increases the contact area between the well and the reservoir, as well as the single-well controlled reserves, thereby improving the recovery degree. The length of the horizontal section significantly affects bottom water coning and overall development efficiency. This is primarily because it determines the contact area between the well and the reservoir, as well as the reserves controlled by a single well. A longer horizontal well section expands the contact area, allowing more crude oil to be produced. The extended horizontal section also slows water cut increase by lengthening the coning path for bottom water.
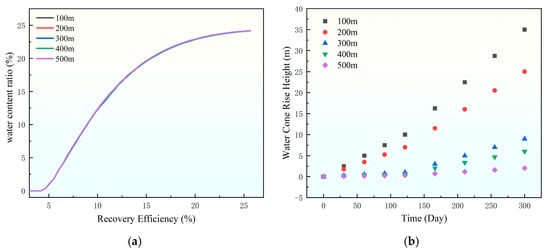
Figure 12.
Effect curve of well spacing on water content ratio. (a) Chart of the change in recovery degree with moisture content, (b) water cone rise height.
3.2.2. The Vertical Position of the Horizontal Well Section
The relationship between the vertical position of the horizontal well section and water coning distribution characteristics is illustrated in Figure 13. The vertical position of the horizontal well section refers to its relative distance from the oil–water contact, which is one of the key factors influencing bottom water coning and development performance. To investigate the specific impact of the vertical position of the horizontal well section on bottom water coning, we use the ratio of the distance from the horizontal well section to the oil–water interface to the oil layer thickness to characterize its position. Five different vertical positions were studied: 15 m, 20 m, 25 m, 30 m, and 35 m. When the horizontal well section is positioned lower, the water cone morphology is relatively small. However, as the vertical position increases, the water cone morphology expands significantly. This result indicates that the closer the horizontal well section is to the top of the oil layer, the more pronounced the bottom water coning effect becomes, leading to a larger water cone.
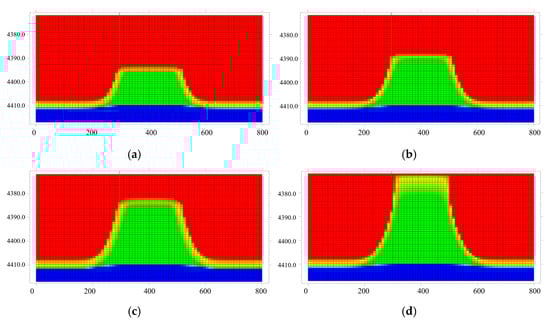
Figure 13.
Diagram of the relationship between the vertical position of the horizontal well section and the distribution characteristics of the water cone: (a) 15 m, (b) 20 m, (c) 25 m, (d) 35 m.
The influence of the vertical position in the horizontal section on the water cut is shown in Figure 14. When the horizontal well section is closer to the top of the oil layer, the gravity and resistance that bottom water coning needs to increase, resulting in slower coning velocity and a more gradual rise in water cut. This allows the well to maintain a higher recovery factor over a longer period. However, if the horizontal well section is too close to the top, it may lead to lower initial productivity. Therefore, the vertical position of the horizontal well section is one of the key factors affecting bottom water coning and development performance.
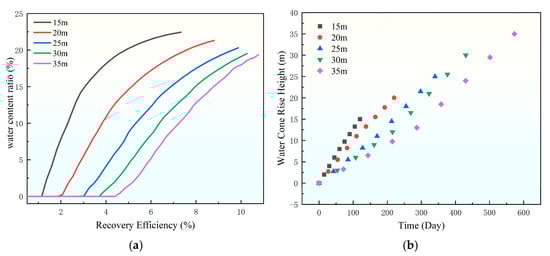
Figure 14.
The influence curve of the vertical position of the horizontal well section on water content ratio. (a) Chart of the change in recovery degree with moisture content, (b) water cone rise height.
4. Discussion
Research findings show that the bottom water coning process in volcanic reservoirs is controlled by both geological characteristics and engineering parameters. Numerical simulation results can provide multidimensional and quantitative technical references for actual development plans. In terms of permeability application, multiple simulations were conducted for permeability ratios ranging from 0.02 to 0.3. Lower vertical permeability can slow down the upward movement of bottom water. It delays water breakthrough time and enhances oil recovery. This pattern offers clear guidance for well placement in low-permeability volcanic reservoirs. In practice, prioritizing well placement in areas with lower vertical permeability can effectively extend the water-free production period. It also significantly improves the economic benefits of single-well development. Regarding interlayer control, simulations confirm that multiple interlayers within the reservoir can block the vertical advancement of bottom water. This thereby increases ultimate recovery. When the interlayer length exceeds 150 m, the inhibitory effect on bottom water coning tends to stabilize. This quantitative threshold provides key guidance for utilizing and modifying interlayers in development plan design. For example, in areas with developed interlayers, well pattern layout can be optimized accordingly. This avoids cost waste caused by excessive modifications.
Furthermore, specific simulation data, such as water breakthrough times under different permeability conditions and water cut change rates for various interlayer lengths, can be directly used for pre-assessment of reservoir development plans. These data, along with trend conclusions like the influence patterns of geological parameters on coning morphology, help engineers accurately predict bottom water coning risks. Based on development dynamics, production parameters can be adjusted promptly. This enables efficient control throughout the entire reservoir development cycle. These simulation-based engineering implications emphasize the importance of fully considering geological complexity in development strategy design. They provide actionable technical pathways for the efficient development of similar volcanic bottom water reservoirs.
However, this study has certain limitations. The numerical model employed exhibits representativeness, but it relies on simplified assumptions and idealized conditions. In practice, reservoirs are generally more complex. They are characterized by greater heterogeneity, fracture development, and dynamic fluid interactions. Future research should integrate field data. Such data includes core analysis, well logging data, and production history. The goal is to calibrate and optimize the model. Furthermore, multiphase flow analysis should be combined with rock mechanics and chemical flooding methods. This combination will facilitate a more comprehensive understanding of bottom water coning in complex reservoir environments. It will also help to control this phenomenon effectively.
5. Conclusions
This study provides an in-depth investigation of multiple influencing factors in bottom water coning development technology for tight oil reservoirs on the subject of bottom water coning in horizontal wells and its control mechanisms. A systematic analysis was conducted on the coupling mechanism between geological heterogeneity, development parameters, and the dynamic evolution of bottom water coning as well as recovery efficiency.
(1) Geological factors significantly control bottom water coning. As the permeability difference between the oil layer and the aquifer decreases, water breakthrough delays and displacement efficiency improves. Enhanced aquifer energy, such as a water–oil volume ratio of 20, stabilizes water cut increase. Greater oil layer thickness improves ultimate recovery but may expand water coning sweep. Larger interlayers prolong coning paths, effectively restraining water cut rise.
(2) Optimization of horizontal well development parameters is crucial. Although increasing the wellbore length can enhance single-well controlled reserves, it may also aggravate bottom water coning. Positioning the wellbore closer to the top of the oil layer increases coning resistance and delays water cut rise. Optimizing well spacing to 300–400 m balances reserve recovery and coning control, improving recovery efficiency by 10–15%.
(3) Reservoir heterogeneity and development parameters are significantly coupled. The bottom water coning process is dynamically influenced by multiple factors. It is essential to holistically consider geological characteristics such as permeability, oil layer thickness, and interlayer distribution, along with the synergy of engineering parameters like well spacing and section length. Isolated analysis based on a single factor should be avoided.
(4) This study has certain limitations. Specifically, the proposed model is still based on idealized conditions and lacks validation with more realistic and detailed field data. Therefore, future research could focus on using actual core samples and field data to improve the model, thereby enhancing its applicability and accuracy in guiding the efficient development of tight oil reservoirs prone to bottom water coning.
Author Contributions
Data Curation and Formal Analysis: X.L.; Funding Acquisition; Investigation; Writing—Review and Editing: L.Y.; Conceptualization: X.D.; Methodology: J.S.; Supervision; Validation: K.G.; Resources: L.Z.; Project Administration: L.W.; Writing—Original Draft: Y.S. All authors have read and agreed to the published version of the manuscript.
Funding
This research received no external funding.
Data Availability Statement
The original contributions presented in this study are included in the article. Further inquiries can be directed to the corresponding author.
Conflicts of Interest
Authors Xiaoshan Li and Xiang Dai were employed by the Development Department, Xinjiang Oilfield Company, Petro China. Authors Junqiang Song, Kaifang Gu, Lifeng Zhang and Li Wang were employed by the Exploration and Development Institute, Xinjiang Oilfield Company, Petro China. The remaining authors declare that the research was conducted in the absence of any commercial or financial relationships that could be construed as a potential conflict of interest.
References
- Sun, S.; Yang, S.; He, W.J.; Zheng, M.; Zou, Y.; Huang, L.; Zhao, Y.; Song, W. Structural deformation and its implication for hydrocarbon accumulation in the Wuxia fault belt, northwestern Junggar basin, China. Open Geosci. 2023, 15, 20220452. [Google Scholar] [CrossRef]
- Zhang, X.; Feng, B.; Yu, J.; Yang, P.; Zeng, S. Experimental Study of Water Flooding in Low Permeability Reservoirs Considering Longitudinal Heterogeneity. J. Energy Sci. Technol. 2024, 3, 19. [Google Scholar]
- Liu, X.P.; Yuan, B.; Dai, C.L.; Li, Y.; Han, M. A novel analytical simulation method of utilization of surfactant-active nanoparticles for well injection enhancement in low-permeability reservoirs. J. Shenzhen Univ. Sci. Eng. 2021, 38, 563–571. [Google Scholar] [CrossRef]
- Yang, L.; Wang, H.K.; Xu, H.J.; Guo, D.; Li, M. Experimental study on characteristics of water imbibition and ion diffusion in shale reservoirs. Geoenergy Sci. Eng. 2023, 229, 212167. [Google Scholar] [CrossRef]
- Yang, L.; Ge, H.K.; Shi, X.; Cheng, Y.; Zhang, K.; Chen, H.; Shen, Y.; Zhang, J.; Qu, X. The effect of microstructure and rock mineralogy on water imbibition characteristics in tight reservoirs. J. Nat. Gas Sci. Eng. 2016, 34, 1461–1471. [Google Scholar] [CrossRef]
- Wang, Q.; Zhu, B.; Shen, J.; Glover, P.W.J.; Lorinczi, P.; Han, H. Quantifying Controls on Threshold Pressure During CO2 Injection in Tight Gas Reservoir Rocks. Energy Fuels 2022, 36, 6292–6304. [Google Scholar] [CrossRef]
- Yang, L.; Yang, D.; Zhang, M.Y.; Meng, S.; Wang, S.; Su, Y.; Long, X. Application of nano-scratch technology to identify continental shale mineral composition and distribution length of bedding interfacial transition zone-A case study of Cretaceous Qingshankou formation in Gulong Depression, Songliao Basin, NE China. Geoenergy Sci. Eng. 2024, 234, 212674. [Google Scholar] [CrossRef]
- Yang, L.; Yang, D.; Li, Y.X.; Cai, J.; Jiang, X. Nanoindentation study on microscopic mineral mechanics and bedding characteristics of continental shales. Energy 2024, 312, 133614. [Google Scholar] [CrossRef]
- Wang, K.; Zhou, W.S.; Li, K.; Liu, C.; Geng, Y.; Pan, Y.; Pang, G.; You, Q. Study on water cone behavior in heavy oil reservoir with bottom water through numerical simulation. Energy Sources Part A Recovery Util. Environ. Eff. 2020, 42, 1809–1820. [Google Scholar]
- Yu, G.M.; Zhang, Y.Z.; Lu, Y.; Zhang, W.-X.; Guo, K.-L.; Li, S.-W.; He, J.-H. Application and Effect Factors of Artificial Barrier in Heavy Oil Reservoir with Bottom Water. In Proceedings of the International Conference on Energy Development and Environmental Protection (EDEP 2016), Sanya, China, 21–23 November 2016. [Google Scholar]
- Zhang, J.Y.; Tang, Y.; Wang, H.F.; Huang, L.; Liao, F.; Liu, Y.; Chen, Y. Study on the Mechanism of Water Blocking in Tight Sandstone Gas Reservoirs Based on Centrifugal and Nuclear Magnetic Resonance Methods. Energies 2022, 15, 6680. [Google Scholar] [CrossRef]
- Armenta, M. Mechanisms and Control of Water Inflow to Wells in Gas Reservoirs with Bottom-Water Drive. Ph.D. Thesis, Louisiana State University and Agricultural & Mechanical College, Baton Rouge, LA, USA, 2003. [Google Scholar]
- Jie, D.; Wang, M.X.; Luo, W.J. The Research of the Effect of Barrier Layer on the Development of Bottom Water Reservoirs in Streamline Simulation. In Proceedings of the 2015 International Forum on Energy, Environment Science and Materials, Shenzhen, China, 25–26 September 2015; Atlantis Press: Zhengzhou, China, 2015; pp. 70–76. [Google Scholar]
- Zhang, T.; Wang, B.R.; Zhang, L.H.; Qiao, X.-Y.; Zhang, L.; Guo, J.-J.; Thanh, H.V. Inter-layer interference for multi-layered tight gas reservoir in the absence and presence of movable water. Pet. Sci. 2024, 21, 1751–1764. [Google Scholar] [CrossRef]
- Wang, Y.W.; Liu, H.Q.; Chen, Z.X.; Wu, Z.; Pang, Z.; Dong, X.; Chen, F. A visualized investigation on the mechanisms of anti-water coning process using nitrogen injection in horizontal wells. J. Pet. Sci. Eng. 2018, 166, 636–649. [Google Scholar] [CrossRef]
- Siemek, J.; Stopa, J. A simplified semi-analytical model for water-coning control in oil wells with dual completions system. J. Energy Resour. Technol. 2002, 124, 246–252. [Google Scholar] [CrossRef]
- Yao, C.; Yan, R.F.; Zhou, F.; Zhang, Q.; Niu, G.; Chen, F.; Cao, W.; Wang, J. A Novel Method to Calculate Water Influx Parameters and Geologic Reserves for Fractured-Vuggy Reservoirs with Bottom/Edge Water. Energies 2024, 17, 2822. [Google Scholar] [CrossRef]
- Liu, K.; Zhu, W.Y.; Pan, B. Laboratory evaluation on oil-soluble resin as selective water shut-off agent in water control fracturing for low-permeability hydrocarbon reservoirs with bottom aquifer. Geoenergy Sci. Eng. 2023, 225, 211672. [Google Scholar] [CrossRef]
- Qiu, H.M.; Zhu, S.Y.; Duan, H.D. A Study of Potential Water-Sand Inrush Based on Physical Model Experiments and Numerical Simulations. Mine Water Environ. 2024, 43, 540–599. [Google Scholar] [CrossRef]
- Liu, Z.; Chen, D.; Gao, Z.; Wu, Y.; Zhang, Y.; Fan, K.; Chang, B.; Zhou, P.; Huang, W.; Hu, C. 3D geological modeling of deep fractured low porosity sandstone gas reservoir in the Kuqa Depression, Tarim Basin. Front. Earth Sci. 2023, 11, 1171050. [Google Scholar] [CrossRef]
- Pan, Y.; Wang, K.; Tang, C.Y.; Li, K.; Liu, H. Research on the water production tracking method of horizontal well in heavy oil reservoir with bottom water. Lithosphere 2022, 2021, 2593788. [Google Scholar] [CrossRef]
- Ma, Y.Q.; Liu, B.L.; Liu, X.L.; Wu, C.; Pei, S.; Chen, Y.; Xiu, J. Water Invasion Prediction Method for Edge–Bottom Water Reservoirs: A Case Study in an Oilfield in Xinjiang, China. Processes 2023, 11, 919. [Google Scholar] [CrossRef]
- Wu, Y.Z.; Zhang, Y.; Wang, J.; Ma, Y.; Song, Z.; Zeng, X.; Cao, A. Study on the mechanism of improved oil recovery by nitrogen foam flooding in bottom water reservoirs. Front. Energy Res. 2023, 11, 1120635. [Google Scholar] [CrossRef]
- Shan, W.Y.; Zhang, X. The Research for Delaying the Bottom Water Coning in Horizontal Wells Application Balance Screen Pipe. Adv. Mater. Res. 2013, 734, 1480–1483. [Google Scholar] [CrossRef]
- Chi, J. Water Cone Dynamic Prediction of Bottom Water Reservoir Considering Oil-Water Interface Dynamic Chance. Chem. Technol. Fuels Oils 2021, 57, 415–431. [Google Scholar] [CrossRef]
- Li, K.; Zhang, J.Q.; Zhu, G.J.; Zhou, W.; Wang, K.; Liang, H. A new method for calculating the characteristic shape of the water ridge under horizontal production wells in marine sandstone heavy oil reservoirs with bottom water. Chem. Technol. Fuels Oils 2021, 57, 690–697. [Google Scholar] [CrossRef]
- Tan, J.; Liu, Y.X.; Li, Y.L.; Liu, C.-Y.; Mou, S.-R. Study on oil displacement efficiency of offshore sandstone reservoir with big bottom water. J. Pet. Explor. Prod. Technol. 2021, 11, 3289–3299. [Google Scholar] [CrossRef]
- Al-Obaidi, D.A.; Al-Mudhafar, W.J.; Hussein, H.H.; Rao, D.N. Experimental influence assessments of water drive and gas breakthrough through the CO2-assisted gravity drainage process in reservoirs with strong aquifers. Fuel 2024, 370, 131873. [Google Scholar] [CrossRef]
- Oladeji, D.O. Optimization Strategies Proposed for Improving Well Performance and Pressure Transient Analysis in Bottom Water Reservoirs. Master’s Thesis, University of Regina, Ottawa, ON, Canada, 2011. [Google Scholar]
- Nashawi, I.S.; Al-Anzi, E.H.; Hashem, Y.S. A depletion strategy for an active bottom-water drive reservoir using analytical and numerical models-field case study. J. Heat Transf. 2009, 131, 101008. [Google Scholar] [CrossRef]
- Chen, D.; Yang, F.L.; Li, H.M.; Wei, C.; Yang, M.; Zhao, X.; Dai, L.; Li, J. Study on Water Intrusion Flow Model of the Tight Gas Reservoir. Chem. Technol. Fuels Oils 2024, 60, 297–308. [Google Scholar] [CrossRef]
- Jiang, T.W.; Sun, H.D.; Xiao, X.J.; Zhu, S.; Ouyang, W.; Tang, Y. Multi-scale flow mechanism and water control strategy of ultra-deep multi-porosity fractured tight sandstone gas reservoirs. Front. Energy Res. 2022, 10, 977439. [Google Scholar] [CrossRef]
- Sharma, P.; Kumar, M.; Gupta, D.K. 3D numerical simulation of clastic reservoir with bottom water drive using various ior techniques for maximizing recovery. J. Pet. Explor. Prod. Technol. 2019, 9, 1075–1087. [Google Scholar] [CrossRef]


Disclaimer/Publisher’s Note: The statements, opinions and data contained in all publications are solely those of the individual author(s) and contributor(s) and not of MDPI and/or the editor(s). MDPI and/or the editor(s) disclaim responsibility for any injury to people or property resulting from any ideas, methods, instructions or products referred to in the content. |
© 2025 by the authors. Licensee MDPI, Basel, Switzerland. This article is an open access article distributed under the terms and conditions of the Creative Commons Attribution (CC BY) license (https://creativecommons.org/licenses/by/4.0/).