Abstract
To accurately diagnose the potential faults such as jamming and incomplete opening and closing of high-voltage disconnectors during long-term operation, this paper proposes a fault diagnosis method based on the fusion of time-frequency domain energy features of the body-side vibration signal. This method extracts short-term energy in the time domain and the marginal spectral energy of the sub-signals processed by variational mode decomposition (VMD) as features in the frequency domain, and constructs a feature set that can effectively represent different states through feature fusion. This enables the distinction between six states, namely normal closing, normal opening, closing jam, opening jam, closing not in place, and opening not in place. On this basis, the particle swarm optimization (PSO) algorithm is adopted to optimize the hyperparameters of the support vector machine (SVM), and the fault diagnosis model is obtained. The fault simulation experiment was conducted on the ZF12B type disconnector, and the experimental results show that the recognition accuracy of the proposed method reaches 98.33%, which is superior to the compared method, verifying the effectiveness and superiority of the proposed method.
1. Introduction
Gas-insulated metal-enclosed switchgear (GIS) has been widely used in power systems, especially in high-voltage power grids [1,2], because of its advantages such as small footprint, high reliability and long maintenance period. However, with the increase in running time, the problem of abnormal mechanical structure of GIS equipment is gradually exposed [3,4]. According to statistics, mechanical failure—the most important type of failure—accounts for 70% of the total failures of the disconnector [5]. These mechanical faults are usually caused by latent mechanical defects, and if not diagnosed and treated in time, they can easily evolve into electrical faults, posing a serious threat to the safe and stable operation of the power grid [6,7]. Therefore, it is very important to diagnose the mechanical defects of the disconnector in time by condition monitoring and fault diagnosis technology to ensure the safe operation of the power grid [8,9].
The disconnector is the most frequently operated unit in GIS. In the process of long-term operation, the disconnector is prone to mechanism jams, resulting in the opening or closing not being in place, which can easily cause serious equipment heating, even causing the equipment to burn. When the opening is not in place, it can easily lead to the breakdown of the disconnector port and even cause accidents involving personal injuries. The common signals for mechanical status monitoring of the disconnector are the motor current [10,11,12] and vibration signal [13,14,15], but the motor current can only reflect the state of the output side of the motor; it cannot easily and directly reflect the separation of the disconnector contacts. The same applies to the vibration signal on the mechanism side, which can only reflect the state of the mechanism side. However, the vibration signal on the body side can directly reflect the contact and separation state of the disconnector contacts.
Many scholars have studied the mechanical fault diagnosis technology of the disconnector from different angles [16,17,18]. A time-frequency analysis method for the GIS vibration signal based on adjacent mode noise suppression is proposed [19], which can effectively highlight the defect characteristics, and multi-objective diagnosis is realized by integrating a random forest and dual-channel composite parallel output structure. A load adaptive matching diagnosis model is constructed to improve the diagnosis accuracy [3], and the mechanical vibration simulation and detection platform for GIS equipment is constructed to simulate the mechanical vibration defects of disconnectors in different contact states. Reference [20] proposes a GIS electrical contact state monitoring method based on VMD and Hilbert marginal spectral energy entropy. By establishing a multi-physical coupling model to simulate vibration signals and building an experimental platform to obtain data, GIS electrical contact state online monitoring is realized. GIS mechanical status recognition and defect diagnosis technology based on self-excited vibration of a combined circuit breaker is proposed in [5], and the GIS mechanical fault diagnosis capability is improved. In reference [21], a GIS shell vibration detection system is designed to distinguish the disconnector state. By using a fast convolutional neural network algorithm based on deep learning, signal features can be automatically extracted and feature dimensions reduced by optimizing the network structure and training methods. Reference [22] applies acoustic imaging technology to the field of GIS mechanical defect detection. The sound pressure sensor matrix is designed to obtain the sound intensity cloud image, and the eigenvalue is extracted by the gray co-occurrence matrix. Diagnostic methods have been constructed to identify multiple mechanical defects of disconnectors.
To accurately identify early defects such as inadequate opening and closing and movement jams of disconnectors, this study takes the vibration signal on the body side as the analysis object. Firstly, the signal features are extracted from both the time domain and the frequency domain dimensions: The time domain features cover the short-term energy peak and the occurrence time, as well as the total motion time. The frequency-domain characteristics are based on the sub-signals of the vibration signal processed by VMD, and are characterized by the Hilbert marginal spectral energy. Subsequently, based on the extracted features, the SVM classification model optimized by the PSO algorithm is adopted to effectively distinguish six operating states, namely normal closing, normal opening, closing jam, opening jam, closing not in place, and opening not in place. The process of fault diagnosis is shown in the Figure 1. Based on this, this paper takes the 126 kV three-phase common box disconnector as a specific case for research, verifying the effectiveness of the proposed method.
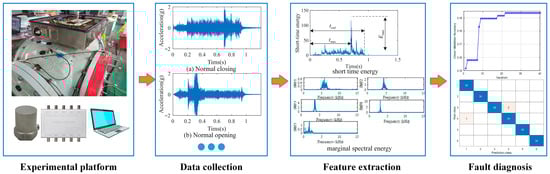
Figure 1.
The process of fault diagnosis.
The contribution of this paper lies in the proposed method, which is conducive to the timely detection of early defects in the disconnector, thereby avoiding overheating or explosion accidents caused by improper closing, as well as insulation breakdown and even personal injury accidents caused by improper closing. These benefits will enable the disconnector to operate more safely and stably.
2. Methods
2.1. Feature Extraction Method
2.1.1. Short-Time Energy Analysis
The opening and closing motion of the high-voltage disconnector is realized by the motor and the mechanical transmission system. The mechanical vibration signal generated during the movement contains rich information and can reflect the working state of the opening and closing motion of the disconnector. The vibration signal energy of the disconnector is distributed at different times and frequencies. The purpose of short-term energy analysis is to observe the energy change of the vibration signal in the local time range, so as to extract the characteristics of the signal and use them to characterize the operating state of the disconnector.
The basic flow of short-term energy analysis is as follows: First, the vibration signal is mapped to a new space by a specific exponential function, so that the energy distribution characteristics of the vibration signal can be highlighted and the contrast of key information in the vibration signal can be effectively enhanced. Second, the movable window function is used to weight the signal to realize the fine analysis of the local characteristics of the signal. The movable window function slides on the signal with a specific step length. Each slide selects a local fragment of the signal for the weighting operation and calculates the energy value of the vibration signal inside the sliding window. With the sliding window, the short-term energy of the whole time domain analysis of the vibration signal is obtained.
For the vibration signal x(n) collected by the disconnector in the process of opening and closing motion, the sliding window function selected is w(n), and the length of the window function is N; then, the short-term energy calculation method of the vibration signal is
The purpose of the window function w(k − n) is to extract the vibration signal for a short period of time according to a certain weighting rule, and calculate the energy of the vibration signal in the window. By changing the value of n, the short-term energy at different times can be obtained, so as to obtain the change in the signal short-term energy with time.
2.1.2. Improved Hilbert Marginal Spectrum Energy
Hilbert marginal spectrum energy reflects the energy distribution of the disconnector vibration signal at different frequencies. By analyzing the marginal spectrum energy, we can understand the contribution degree of each frequency component to the total energy in the vibration signal, so as to identify the main frequency components in the signal and the frequency range of energy concentration. When there is a fault or defect in the operation of the disconnector, different fault types can cause the vibration signal to have an energy anomaly at a specific frequency. Therefore, the Hilbert marginal spectrum energy can be used to extract the fault characteristics of the disconnector switching system and realize the monitoring and fault diagnosis of its operating state.
The traditional Hilbert marginal spectrum energy calculation method is based on EMD; Hilbert transformation is performed on the IMFs obtained from EMD decomposition, and then marginal spectrum energy is calculated. However, EMD has the problem of mode aliasing, and the frequency components of each IMF decomposed by this method are complex, so the calculated marginal spectral energy cannot effectively represent the vibration intensity under specific frequency components.
Therefore, this paper proposes a marginal spectrum energy calculation method based on VMD and the Hilbert transform. The VMD method introduces a bandwidth constraint term into the variational model, so that each decomposed IMF has a clear bandwidth limit, thus effectively avoiding the mode aliasing phenomenon, and each IMF can more accurately reflect the different characteristic scales of the signal. It also makes the Hilbert marginal spectrum energy based on VMD more accurately reflect the vibration intensity under different frequency components.
The calculation method for marginal spectrum energy based on VMD and the Hilbert transform is as follows: First, the vibration signal x(t) can be decomposed by VMD with the number of layers K, and the IMFs with frequency components separated from each other, which can be expressed as follows:
where uk(t) are the IMFs from VMD decomposition; Ak(t) is the instantaneous amplitude; φk(t) is the instantaneous phase. Then, the original vibration signal x(t) and each of the IMFs satisfy the following constraint relation:
The bandwidth of each IMF can be estimated as follows:
Based on this, the following variational problem can be constructed according to the minimum sum of the estimated bandwidths of the IMFs:
Then, by combining the constraint Formulas (3) and (5), the variational problem with constraints can be obtained. For the constrained variational problem, the optimal solution can be obtained by introducing the Lagrange functional. The quadratic penalty factor α is introduced to ensure the accuracy of the reconstructed signal. The Lagrange operator λ(t) is introduced to ensure the strictest constraints, and the constrained variational problem is changed into the unconstrained variational formula as follows:
The optimal solution of the Lagrange expression can be found by iterating ukn+1, ωkn+1, and λn+1 alternately. The iterative relationship of the three parameters is as follows:
In the process of iteration, when the relative error of each IMF second-order norm is less than the threshold ε, the iteration stops, that is:
Through the above formula, the time series {uk} and the center frequency ωk of each IMF can be obtained by VMD of vibration signal x(t), and the process of VMD is completed.
The Hilbert transform is applied to each IMF obtained from VMD:
On this basis, the analytic signal is constructed as follows:
The original vibration signal can be reconstructed by adding up the IMFs and taking the real part:
Then, the instantaneous amplitude of the IMFs is as follows:
The instantaneous phase of the signal is
The instantaneous frequency is
In this way, the Hilbert spectrum of the signal can be obtained, which describes the magnitude of the instantaneous amplitude of the signal at different times and frequencies.
By integrating the Hilbert spectrum over time, the amplitude of the signal at different frequencies can be obtained, that is, the Hilbert marginal spectrum is
where T is the length of the signal in the time axis, and further, the Hilbert marginal spectral energy of the signal is
2.1.3. Process of Feature Extraction
The vibration signal of a disconnector contains rich state information on its operation process. Feature extraction in the time domain and frequency domain is a common method for vibration signal analysis. Combined with the features of disconnector vibration signals, this paper extracts the features of vibration signals from the time domain and frequency domain, respectively, and then splices and fuses the features to form a multi-domain feature set of vibration signals, which is used to identify the opening and closing operation state of disconnector. Compared with a single feature extraction in the time domain or frequency domain, this multi-domain feature fusion analysis method can extract the information of vibration signals more comprehensively, enhance the analysis ability of vibration signals, and improve the accuracy of fault diagnosis.
The flow chart of the feature extraction method proposed in this paper is shown in Figure 2.
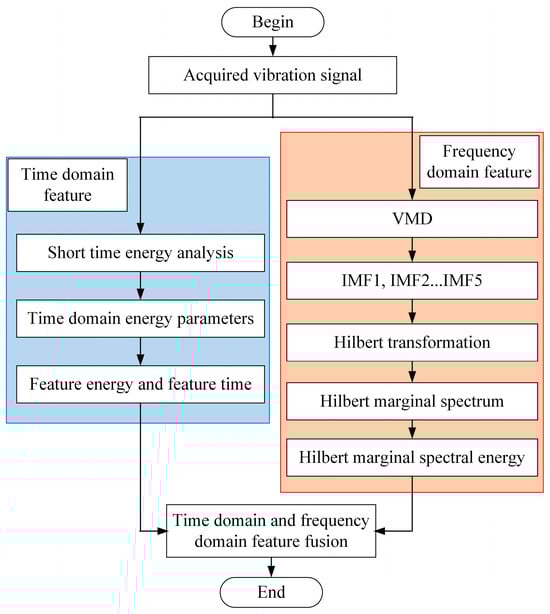
Figure 2.
Flow chart of the feature extraction method.
In terms of time domain feature extraction, the short-term energy calculation is carried out on the acquired vibration signal. According to the distribution of short-term energy in the time domain, the start time and end time of the start-and-close movement are extracted, as well as the short-term maximum energy and its occurrence time. The start-and-close time and end-time of the start-and-close movement represent the total time of the start-and-close movement. Combined with the occurrence time of the maximum short-term energy, it can be determined whether there is a fault where the switching is not in place, and then the position of the occurrence time of the maximum short-term energy in the whole movement time interval can be distinguished from the switching operation. Frequency domain feature extraction: After the original vibration signal is decomposed by VMD, several IMFs with relatively single frequency components are obtained. The Hilbert transform is performed on each IMF, and corresponding analytic signals are constructed. The Hilbert spectrum is obtained by calculating instantaneous amplitude and instantaneous frequency, and the Hilbert marginal spectrum is obtained by integrating the Hilbert spectrum with time. That is, the distribution of vibration signal intensity under different frequency components and then the Hilbert marginal spectral energy are calculated as the frequency domain feature. Finally, the time-domain and frequency-domain features are merged to obtain the feature set of vibration signals for fault diagnosis.
2.2. Fault Diagnosis Method
2.2.1. SVM Method
In the actual operation process, the disconnector is in the static state for a long time, the opening and closing action data are limited, and the use of complex data-driven methods is limited. SVM still has reliable classification accuracy under the condition of small samples. In this paper, SVM is selected to recognize the action process and state of the disconnector, and six categories of normal closing, normal opening, closing jam, opening jam, closing not in place, and opening not in place are distinguished.
The core goal of SVM is to find an optimal hyperplane in the feature space, separate different classes of samples, and maximize the interval between the hyperplane and each class of samples. A given training data set D is studied as
where N is the number of training samples, x is the feature space, and y is the classification label. For linearly separable data, this hyperplane can clearly divide different categories of samples, and the sample data meet the following condition:
In this case, the classification hyperplane is
By solving the extreme value problem under the following constraints, the distance between different classes can be maximized:
Most of the data in engineering are linearly indivisible. For such data, relaxation factor ξ is introduced to allow some sample points to violate the interval constraint. At this point, the optimization problem becomes
where C is the penalty coefficient, used to balance the penalty of maximizing the interval and misclassifying the sample.
For nonlinear divisible problems, by introducing kernel function K(xi, xj), the data are mapped to the high-dimensional feature space, so that the data become linearly divisible in the high-dimensional space. Kernel functions commonly include the polynomial kernel function, radial basis kernel function, Gaussian kernel function, sigmoid kernel function, etc. By adjusting parameters in the kernel function, models of different complexity can be trained to adapt to classification problems of different complexity.
During SVM model training, the penalty coefficient and kernel function parameters need to be specified in advance. The values of these key parameters determine the effect of SVM model training and must be carefully determined. According to the characteristics of disconnector action data, polynomial kernel function is selected in this paper, and PSO is used to optimize the penalty coefficient and kernel function parameters, so as to improve the SVM model training effect.
2.2.2. PSO Method
PSO treats the solution space of an optimization problem as a search space, and each solution is treated as a particle in the search space. These particles travel at a certain speed in the search space, constantly adjusting their position to find the optimal solution. During flight, the particles adjust their speed and direction according to the individual optimal solution and the global optimal solution. Specifically, each particle has its own position and velocity, the position represents the particle’s current state in the solution space, and the velocity determines the direction and step size of the particle’s movement. The particle updates its speed and position in each iteration based on the individual optimal solution, the global optimal solution, and the current velocity.
PSO can be implemented as follows:
- Initialization: Randomly initialize the position and speed of each particle in the search space. At the same time, determine the key parameters required by the particle swarm optimization algorithm, including the number of particles, the number of iterations, the inertia weight, and the learning factor.
- Fitness calculation: The corresponding fitness value is calculated according to the current position of each particle, which is an indicator to characterize the quality of the solution represented by the particle. The specific calculation of fitness depends on the optimization problem to be solved.
- Update the individual optimal solution and the global optimal solution: Compare the current fitness value of each particle with its historical optimal fitness value, and update the position corresponding to the better fitness value to the current position. At the same time, the global optimal position is found among the individual optimal positions of all particles, and the global optimal position is updated.
- Update the speed and position of the particles: Follow the formula below to update the speed and position of each particle. Speed update formula:
Location update formula:
Through the above iteration, the optimal solution of penalty coefficient and kernel function parameters in SVM training can be obtained, and the performance of SVM training can be improved.
2.2.3. PSO-SVM Method
PSO is used to optimize the model parameters of SVM, including penalty coefficient and kernel function parameters, in order to improve the diagnostic performance of SVM. The process of fault diagnosis using PSO-SVM in this paper is shown in Figure 3.
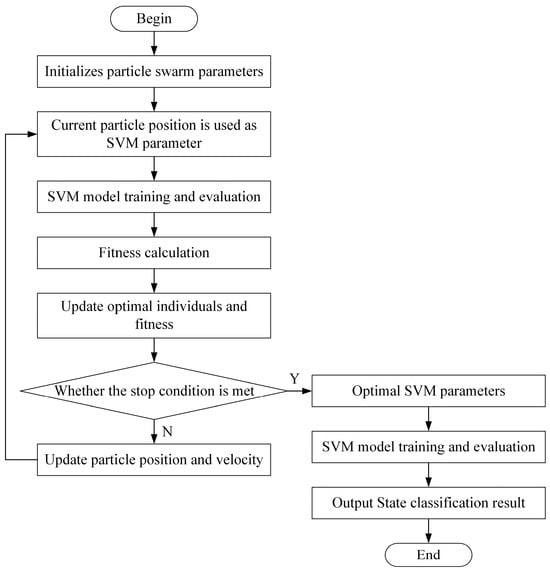
Figure 3.
Process of fault diagnosis using PSO-SVM in this paper.
The implementation steps of the fault diagnosis method based on PSO-SVM are as follows:
- Initialize particle swarm parameters;
- The current particle swarm position parameters are used as SVM model parameters for model training and evaluation, and the fitness corresponding to the current particle swarm position parameters is calculated;
- Update the optimal individual and the optimal fitness according to the comparison between the current fitness and the fitness corresponding to the historical particle swarm position parameters;
- Determine whether the optimization process meets the stop condition, that is, whether the maximum number of iteration steps is reached or the error condition is met. If the stop condition is not met, the particle swarm position and velocity parameters are updated, and steps 2 to 4 are repeated. If the condition is met, the current particle swarm parameters are output as the optimal model parameters of SVM;
- The optimal model parameters are used for SVM training and evaluation, and the final SVM training results can be obtained;
- Extract features according to the vibration signal of the disconnector and input them into the trained SVM model to obtain state classification results.
To further demonstrate the overall process of the proposed feature extraction and fault diagnosis method for high-voltage disconnectors, we also list the pseudo-code, as shown in Algorithm 1.
| Algorithm 1 Pseudo-code for feature extraction and fault diagnosis methods |
| Feature Extraction Require: Sample number of training faults n; Sample number of test faults m; Short time energy analysis 1. Obtaining time domain features according to Formula (1) Improved Hilbert marginal spectrum energy 2. Obtaining frequency domain features according Formulas (2)–(19) 3. Merging the time-frequency domain features to get the fault feature set Fault diagnosis 4. Input the fault feature set into the SVM model for training 5. Meanwhile, Formulas (20)–(24) are optimized using Formulas (25) and (26) 6. Obtaining trained PSO-SVM fault diagnosis model |
3. Case Study and Result Analysis
3.1. Data Acquisition
The data acquisition and experiment system built in this paper is shown in Figure 4. The experimental object is the ZF12B-126 disconnector. The motor operating mechanism is adopted, and the operating mechanism outputs rotating motion, drives the insulated column to drive the moving contact movement, and realizes opening and closing operation. The signal test system is composed of vibration sensor, data acquisition device, and upper mechanism. The integrated electronics piezoelectric (IEPE) vibration sensor (with a range of ±5 g) adopted in the experimental system collects the vibration signals on the body side during the opening and closing process. Data acquisition was carried out using the HD2408 device produced by Qichuang Mofei Electronic Technology Co., Ltd., Beijing, China. HD2408 recorded the signal with high fidelity at a sampling frequency of 64 kHz. All signal processing (including VMD, Hilbert transform, and short-term energy analysis) and the construction of the fault diagnosis model (PSO-SVM) were carried out on the MATLAB R2021a platform.
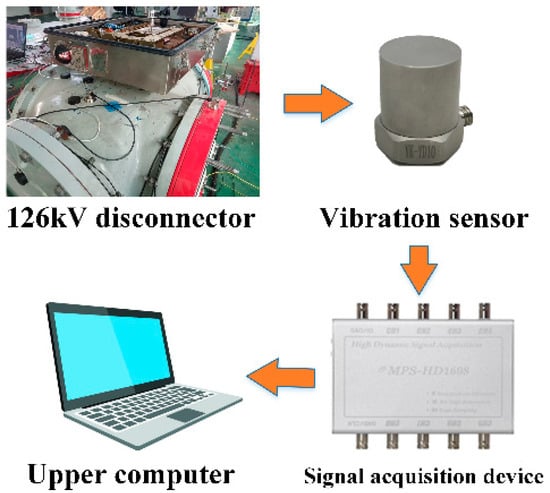
Figure 4.
Data acquisition and experiment system built in this paper.
The key performance of the disconnector in actual operation is that the opening and closing are in the right place to ensure sufficient overtravel in the closing operation and adequate safety distance in the opening operation, so as to achieve reliable current through the closed position and safe voltage isolation at the open position. On the other hand, due to long-term static and lubrication failure, the disconnector may show jammed defects in operation, affecting the speed and time of opening and closing, and may also cause the failure of opening and closing in place in serious cases. Therefore, the study in this paper considers the following six states: normal closing, normal opening, closing jam, opening jam, closing not in place, and opening not in place. Typical time-domain waveforms of vibration signals corresponding to the six states are shown in Figure 5.
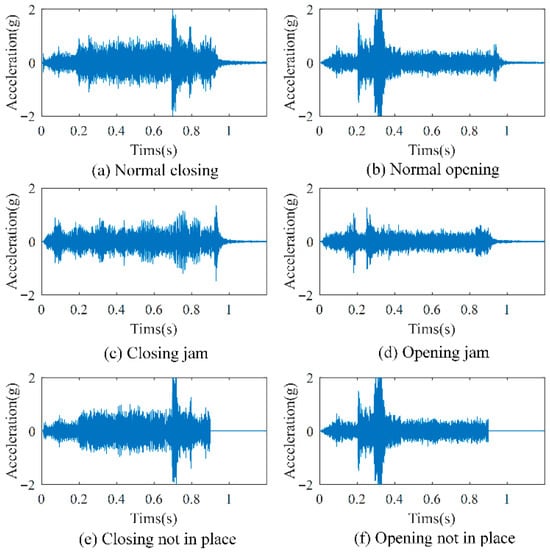
Figure 5.
Typical time-domain waveforms of vibration signals corresponding to the six states.
3.2. Feature Extraction
Feature extraction is the key link of disconnector fault diagnosis. The feature extraction method proposed in this paper is described below by taking a normal closing signal (as shown in Figure 5a) as an example.
In terms of time-domain feature extraction, it is necessary to first calculate the short-term energy of the vibration signal, extract its short-term energy maximum (Emax) as the time-domain energy feature, and then extract the moment of the short-term energy maximum (tmax) and the moment of the motion stop (tend) as the time features, which together constitute the time-domain feature of the vibration signal, as shown in Figure 6.
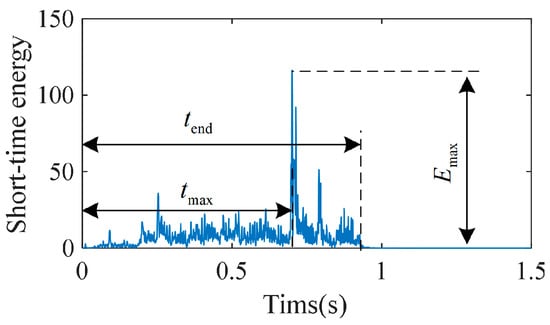
Figure 6.
Time domain features of vibration signal based on short-time energy.
The above methods and principles are used to calculate the six switching conditions discussed in this paper, and the results are shown in Table 1.

Table 1.
Time domain feature extraction of vibration signal.
It can be seen that the time-domain characteristics can distinguish these six working conditions to a certain extent. In order to obtain better distinguishing effects, it is necessary to integrate the time-domain features and frequency-domain features.
In the aspect of frequency-domain feature extraction, in order to illustrate the advantages of the VMD method in the improved Hilbert marginal spectral energy calculation, the VMD and EMD methods are used to process the vibration signals, respectively, and then compared. The VMD processing results for the original vibration signal and the spectrum of each IMF are shown in Figure 7.
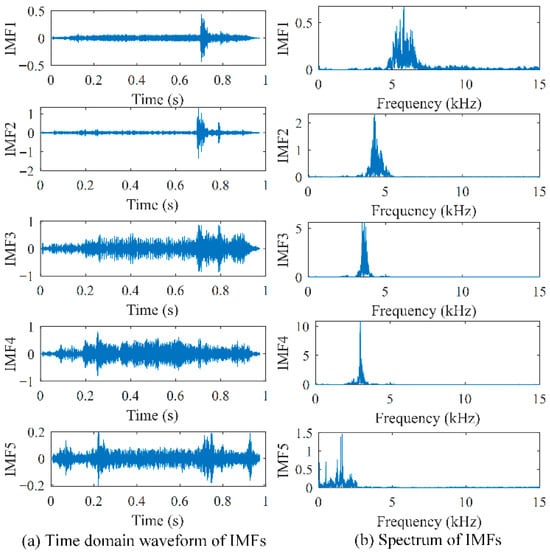
Figure 7.
VMD processing results for vibration signal.
It should be noted that the selection of the number of VMD modes and the penalty factor is a challenge. Regarding the number of modes, we determine it by observing the center frequencies of the IMFs decomposed under different K values. When the K value is too small (such as K = 3 or 4), modal confusion will occur, that is, one IMF will contain multiple components of different frequencies. When the value of K is too large (such as K = 6 or 7), redundant false modes without actual physical meaning will be generated, and their center frequencies will be very close to the existing modes. When K = 5, the frequency distribution of each IMF center is uniform, and there is no overlap. We believe that the best decomposition effect has been achieved at this time. In addition, regarding the penalty factor, we conducted a sensitivity analysis on the values of α at 1000, 2000, 5000, etc. We found that within this range, the change in α had no significant impact on the final shape and central frequency of the IMFs. Therefore, we ultimately adopted the commonly used setting of α = 2000.
The EMD processing results for the original vibration signal and the spectrum of each IMF are shown in Figure 8. In order to facilitate comparison, only the five IMFs with relatively large energies in EMD are shown in the figure.
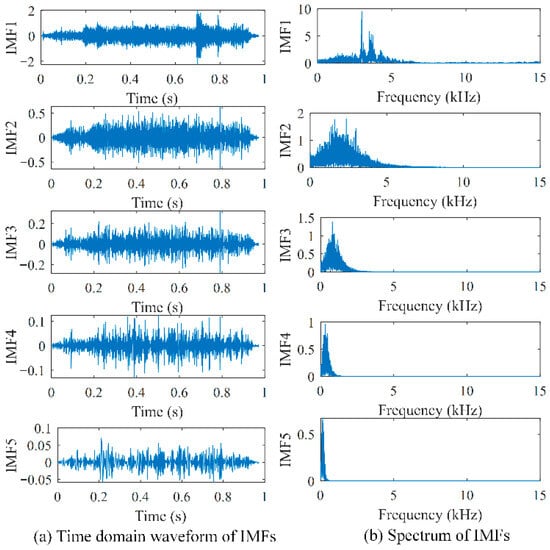
Figure 8.
EMD processing results for vibration signal.
From the IMFs of the two methods and their corresponding spectral graphs, it can be seen that the VMD method can effectively separate the frequency components of vibration signals and avoid the frequency aliasing problem in the EMD method. At the same time, the IMFs of the VMD method can better characterize the time-domain morphology, such that the impact characteristics at the rigid junction can be described more clearly. Therefore, the improved Hilbert marginal spectrum energy proposed in this paper, that is, the use of VMD instead of EMD for signal decomposition, can better separate different frequency components of vibration signals, thus laying a good foundation for the calculation of marginal spectrum energy in different frequency bands.
On the basis of VMD processing of the vibration signals, the Hilbert transformation can be carried out for each IMF, and the instantaneous frequency and instantaneous amplitude can be calculated by constructing analytic signals, and then the marginal spectrum of each IMF is calculated, as shown in Figure 9. On this basis, the marginal spectrum energy corresponding to the vibration signal of each IMF can be calculated.
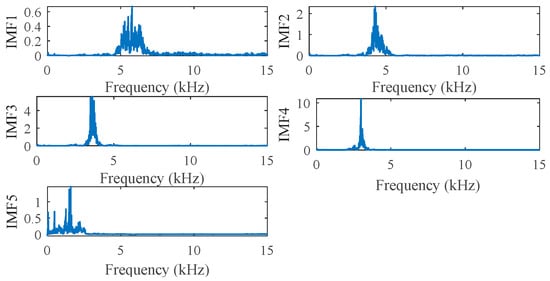
Figure 9.
The marginal spectrum of each IMF.
The marginal spectral energy of the six switching conditions discussed in this paper is calculated by the above methods and principles, and the results are shown in Figure 10. It can be seen that the marginal spectrum energy characteristics can distinguish these six conditions to a certain extent.
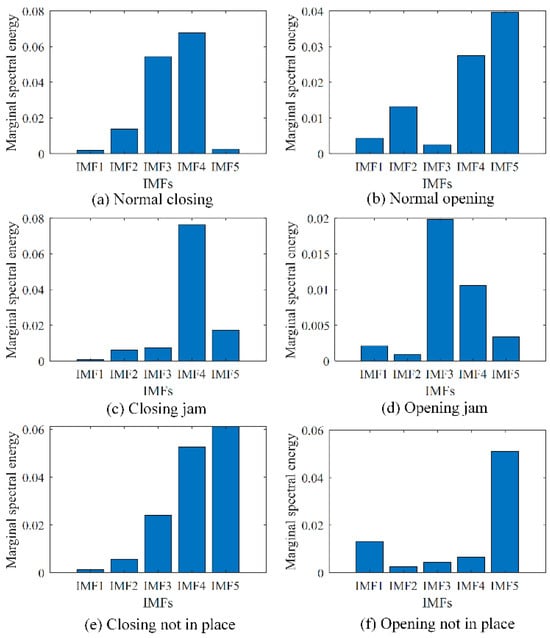
Figure 10.
Comparison of marginal spectrum energy characteristics of six vibration signals in different states.
To more clearly demonstrate the effectiveness of the feature extraction method, we chose the t-SNE algorithm for visualization. The original data visualization is shown in Figure 11, and the visualization of feature extraction is shown in Figure 12. The samples of the original signals are confused with each other and lack distinctiveness. After feature extraction, the six types of samples have completed their respective clustering, with clear boundaries visible, fully demonstrating the effectiveness of the feature extraction method.
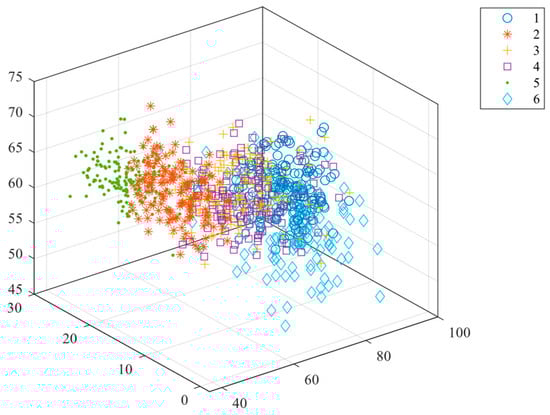
Figure 11.
Visualization diagram of the original signal.
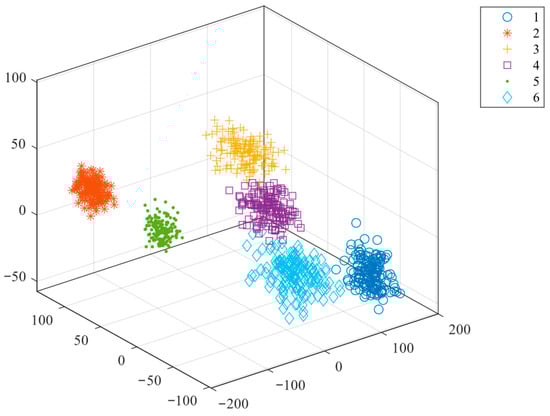
Figure 12.
Visualization diagram of feature extraction.
3.3. Fault Diagnosis and Result Analysis
Aiming at the six states of the opening and closing operation of the high-voltage disconnector discussed in this paper, namely, normal closing (Class 1), normal opening (Class 2), closing jam (Class 3), opening jam (Class 4), closing not in place (Class 5), and opening not in place (Class 6), simulation experiments were carried out on the experimental platform built. For each state, 150 groups of data samples were collected, and a total of 900 samples were obtained. The energy features in the time domain and frequency domain were extracted according to the above mentioned methods. The energy features together with the state labels constituted the state data set. According to the principle of cross-validation, 80% of the data samples were taken as training samples and put into the PSO-SVM training state recognition model. PSO-SVM solved the nonlinear separable problem by introducing a penalty coefficient and kernel function. For the characteristics of disconnector action data, a polynomial kernel function was selected in this paper, and its expression is as follows:
where xi and xj represent two vectors in the sample space; γ is an adjustment parameter, which controls the influence range of data mapped to high-dimensional space. Too large γ will make the model pay too much attention to local data, resulting in overfitting; too small γ will make the model pay too much attention to global data, resulting in underfitting. r is the constant offset term. d is the order of the polynomial. PSO is used to optimize the penalty coefficient and kernel function parameters, so as to improve the SVM model training effect.
The convergence curve of PSO fitness is shown in Figure 13, from which we can see that the fitness value reached stability at the twenty-second step of iteration. The iterative process of the hyper-parameters is shown in Figure 14. The optimization results are as follows: C = 190.658, γ = 0.012, r = 9.48, d = 5. This set of optimization parameters is used to train and test the state classification model, and the test results are shown in Figure 15. It can be seen that the state recognition accuracy has reached 98.33%.
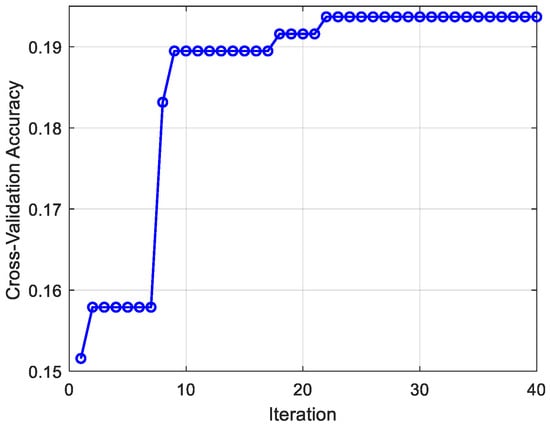
Figure 13.
Convergence curve of PSO fitness.
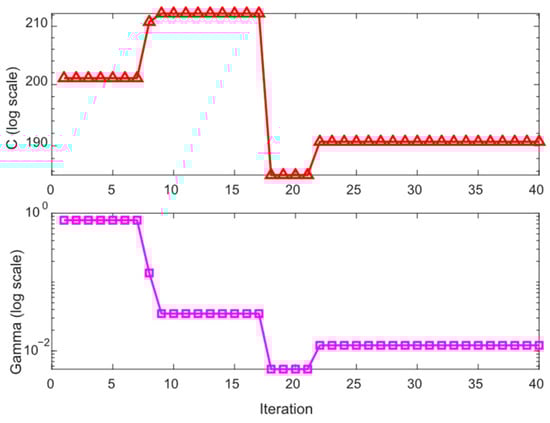
Figure 14.
The hyper-parameter C and γ varies with iterations.
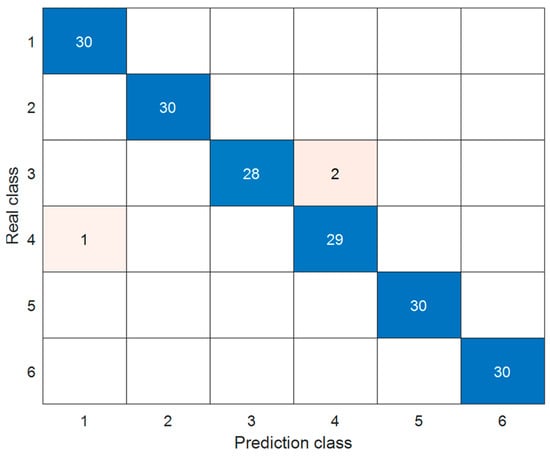
Figure 15.
The confusion matrix of the test set.
The above classification results illustrate the following conclusion: (1) The method based on the fusion of time-domain short-time energy characteristics and frequency-domain marginal spectral energy features can accurately extract the action process information of high-voltage disconnectors; (2) The SVM state classification method optimized by PSO can accurately distinguish the six action states of disconnectors and achieve the expected effect.
To further demonstrate the superiority of the proposed method, we selected several fault diagnosis algorithms commonly used for disconnectors for comparison, namely: feature selection and Random Forest (FS-RF), SVM, Back Propagation Neural Network (BPNN), Dynamic Time Warping and K-Nearest Neighbors (DTW-KNN), One-Dimensional Convolutional Neural Network (1D-CNN), and Convolutional Neural Network—Long Short-Term Memory Network (CNN-LSTM). The fault diagnosis results are shown in Table 2. There are a total of six categories in this experiment, and each category contains 30 test samples. The data in the table show the number and percentage of samples correctly identified by each method. SVM can complete basic state classification, but its performance in multi-category fault classification is slightly poor. BPNN and FS-RF can handle multi-classification problems normally, but are prone to fall into the traps of local optimum and overfitting, leading to misclassification. DTW-KNN can accurately classify the vast majority of fault samples, and there will be no overfitting problem. The 1D-CNN model has difficulty effectively capturing the dependencies between long-distance time steps in vibration signals. The CNN-LSTM model has a complex structure and numerous parameters; under the condition of small sample data, it is extremely prone to overfitting, resulting in a decline in its generalization ability. The proposed method performs the best among the seven methods and can effectively identify the operating status of the disconnector.
Table 2.
Diagnostic results from different methods.
To illustrate the engineering applicability of the proposed method in terms of computational efficiency, we evaluated the computational efficiency of the trained classification model using experimental test data. For the 10 sets of action data tested during the opening and closing process of the disconnector, the computational times of the classification model were all less than 1 s, which is much shorter than the time interval of disconnector actions in actual engineering. The computational efficiency of this model meets the engineering requirements.
4. Conclusions
- The mechanical fault diagnosis method for high-voltage disconnectors based on multi-domain feature fusion of body-side vibration signals is proposed. The vibration signals of the body side are less affected by the vibration of the operating mechanism and can better reflect the motion state and position change of the moving contact, which has special advantages in diagnosing the improper opening and closing of the disconnector body.
- The method based on the fusion of short-time energy features and marginal spectral energy features is proposed. The short-time energy features include the maximum short-term energy, the time point of the maximum short-term energy, and the time point of the end of movement, and the marginal spectral energy features include the marginal spectral energy of IMFs after VMD processing of vibration signals. Experiment shows that this feature extraction method can effectively distinguish different action states of disconnectors.
- The fault identification method based on PSO-SVM was studied to identify the six states mentioned, including normal closing, normal opening, closing jam, opening jam, closing not in place, and opening not in place. The state recognition accuracy reached 98.33%, which is superior to the accuracy of several other commonly used methods.
Author Contributions
Conceptualization, S.Z.; methodology, S.Z. and P.C.; software, S.Z. and X.L.; validation, F.Y. and Q.D.; experiments and data curation, X.L. and Q.D.; writing—original draft preparation, S.Z. and F.Y.; writing—review and editing, P.C.; project administration, X.L. All authors have read and agreed to the published version of the manuscript.
Funding
This research was funded by China Southern Power Grid technology project, grant number 0666002024030103GY00010.
Data Availability Statement
The data presented in this study are available on request from the corresponding author. The data are not publicly available due to privacy or ethical restrictions.
Conflicts of Interest
Authors Shijian Zhu, Peilong Chen, Xin Li, and Qichen Deng were employed by the company Electric Power Research Institute, Guizhou Power Grid Co., Ltd. The remaining authors declare that the research was conducted in the absence of any commercial or financial relationships that could be construed as a potential conflict of interest.
References
- Zhang, Z.; Hao, Y.; Peng, J.; Yang, L.; Gao, C.; Wang, G.; Zhou, F.; Yang, Y.; Cao, H.; Li, L. A Three-Factor Accelerated Aging Test Platform of Thermal, Mechanical Compression, Pressured SF 6, and a Leakage Test System for GIS O-Ring Seals. IEEE Trans. Instrum. Meas. 2021, 70, 1–11. [Google Scholar]
- Han, X.; Li, J.; Zhang, L.; Pang, P.; Shen, S. A Novel PD Detection Technique for Use in GIS Based on a Combination of UHF and Optical Sensors. IEEE Trans. Instrum. Meas. 2018, 68, 2890–2897. [Google Scholar] [CrossRef]
- Xia, Y.; Li, Z.; Xi, Y.; Wu, G.; Peng, W.; Mu, L. Accurate Fault Location Method for Multiple Faults in Transmission Networks Using Travelling Waves. IEEE Trans. Ind. Inform. 2024, 20, 8717–8728. [Google Scholar] [CrossRef]
- Schichler, U.; Koltunowicz, W.; Endo, F.; Feser, K.; Giboulet, A.; Girodet, A.; Hama, H.; Hampton, B.; Kranz, H.-G.; Lopez-Roldan, J. Risk Assessment on Defects in GIS Based on PD Diagnostics. IEEE Trans. Dielectr. Electr. Insul. 2013, 20, 2165–2172. [Google Scholar] [CrossRef]
- Ma, H.; Liu, B.; Xu, H.; Chen, B.; Ju, P.; Zhang, L.; Qu, B. GIS Mechanical State Identification and Defect Diagnosis Technology Based on Self-excited Vibration of Assembled Circuit Breaker. IET Sci. Meas. Technol. 2020, 14, 56–63. [Google Scholar] [CrossRef]
- Zhong, Y.; Hao, J.; Liao, R.; Wang, X.; Jiang, X.; Wang, F. Mechanical Defect Identification for Gas-Insulated Switchgear Equipment Based on Time-Frequency Vibration Signal Analysis. High Volt. 2021, 6, 531–542. [Google Scholar] [CrossRef]
- Zhong, Y.; Hao, J.; Ding, Y.; Liao, R.; Xu, H.; Li, X. Novel GIS Mechanical Defect Simulation and Detection Method Based on Large Current Excitation with Variable Frequency. IEEE Trans. Instrum. Meas. 2022, 71, 1–15. [Google Scholar] [CrossRef]
- Feng, J.; Sun, L.; Chen, W.; Su, Y.; Shu, Y.; Zhao, L. Vibration Characteristics of GIS Isolating Switch under Different Operating Conditions. High Volt. Eng. 2021, 47, 4314–4322. [Google Scholar]
- Kemeng, L.I.; Fuguo, C.; Hui, Y.; Huan, Y.; Aijun, Y.; Xiaohua, W.; Mingzhe, R. Intelligent Diagnosis for Mechanical Faults of High Voltage Disconnector Based on Attitude Sensor. Power Syst. Technol. 2023, 47, 3781–3790. [Google Scholar]
- Tao, P.; Chaohui, L.V.; Yi, D.U.; Feng, L.; Sheng, D. Mechanical Fault Diagnosis of High Voltage Disconnector Based on Motor Current Detection. In Proceedings of the 2019 IEEE 3rd Information Technology, Networking, Electronic and Automation Control Conference (ITNEC), Chengdu, China, 15–17 March 2019; pp. 1726–1729. [Google Scholar]
- Qiu, Z.; Ruan, J.; Huang, D.; Huang, Y. Mechanical Fault Diagnosis of High Voltage Outdoor Disconnector Based on Motor Current Signal Analysis. In Proceedings of the 2014 International Conference on Power System Technology, Chengdu, China, 20–22 October 2014; pp. 1193–1198. [Google Scholar]
- Zhang, Z.; Liu, C.; Wang, R.; Li, J.; Xiahou, D.; Liu, Q.; Cao, S.; Zhou, S. Mechanical Fault Diagnosis of a Disconnector Operating Mechanism Based on Vibration and the Motor Current. Energies 2022, 15, 5194. [Google Scholar] [CrossRef]
- Abdollah, M.; Razi-Kazemi, A.A. Intelligent Failure Diagnosis for Gas Circuit Breakers Based on Dynamic Resistance Measurements. IEEE Trans. Instrum. Meas. 2018, 68, 3066–3077. [Google Scholar] [CrossRef]
- Yang, Q.; Ruan, J.; Zhuang, Z.; Huang, D. Fault Identification for Circuit Breakers Based on Vibration Measurements. IEEE Trans. Instrum. Meas. 2019, 69, 4154–4164. [Google Scholar] [CrossRef]
- Yuan, Y.; Ma, S.; Wu, J.; Jia, B.; Li, W.; Luo, X. Frequency Feature Learning from Vibration Information of GIS for Mechanical Fault Detection. Sensors 2019, 19, 1949. [Google Scholar] [CrossRef] [PubMed]
- Zhou, T.; Ruan, J.; Liu, Y.; Peng, S.; Wang, B. Defect Diagnosis of Disconnector Based on Wireless Communication and Support Vector Machine. IEEE Access 2020, 8, 30198–30209. [Google Scholar] [CrossRef]
- Zhou, T.; Ruan, J.; Yang, Z.; Liu, Y. Mechanical Defect Detection of Porcelain Column High-Voltage Disconnector Based on Operating Torque. Int. J. Adv. Robot. Syst. 2020, 17. [Google Scholar] [CrossRef]
- Liu, K. Mechanical Fault Diagnosis of High Voltage Disconnector Based on Intelligent Live Test Technology. In Proceedings of the 2020 3rd International Conference on Electron Device and Mechanical Engineering (ICEDME), Suzhou, China, 1–3 May 2020; pp. 138–140. [Google Scholar]
- Zhong, Y.; Hao, J.; Lliu, Q.; Li, Y.; Li, X.; Liao, R.; Jiang, X. Novel Diagnosis Method for GIS Mechanical Defects Based on an Improved Lightweight CNN Model with Load Adaptive Matching. IEEE Trans. Ind. Inform. 2023, 19, 11041–11051. [Google Scholar] [CrossRef]
- Cao, C.; Wang, J.; Wang, Q.; Li, Y.; Li, Z.; Zhang, J. Monitoring Method for GIS Electrical Contact State Based on VMD-Hilbert Marginal Spectrum Energy Entropy. IEEE Access 2025, 13, 48096–48105. [Google Scholar] [CrossRef]
- Zhang, K.; Zhang, Y.; Wu, J.; Li, Z. Quick Identification of Open/Closed State of Gis Switch Based on Vibration Detection and Deep Learning. Electronics 2023, 12, 3204. [Google Scholar] [CrossRef]
- Xiong, Q.; Zhao, J.; Guo, Z.; Feng, X.; Liu, H.; Zhu, L.; Ji, S. Mechanical Defects Diagnosis for Gas Insulated Switchgear Using Acoustic Imaging Approach. Appl. Acoust. 2021, 174, 107784. [Google Scholar] [CrossRef]


Disclaimer/Publisher’s Note: The statements, opinions and data contained in all publications are solely those of the individual author(s) and contributor(s) and not of MDPI and/or the editor(s). MDPI and/or the editor(s) disclaim responsibility for any injury to people or property resulting from any ideas, methods, instructions or products referred to in the content. |
© 2025 by the authors. Licensee MDPI, Basel, Switzerland. This article is an open access article distributed under the terms and conditions of the Creative Commons Attribution (CC BY) license (https://creativecommons.org/licenses/by/4.0/).