Abstract
The esterification of glycerol with acetic acid to produce acetylglycerols was investigated both in the absence of a catalyst and using several commercial FAU zeolites with varied acid site concentrations and pore structures. Specifically, ultra-stable Y zeolite (H-USY, CBV720; Si/Al: 15), ammonium Y zeolite (NH4-Y, CBV300, Si/Al: 2.6), and Na-Y zeolite (CBV100, Si/Al: 2.6) were tested to evaluate their catalytic performance in this reaction. In addition, two control catalysts were assessed under identical conditions: a commercial acidic ion-exchange resin (Amberlyst 15, A15) and a homogeneous acid catalyst (p-toluenesulfonic acid, PTSA). The catalytic performance of both the ultra-stable Y zeolite (CBV720) and Amberlyst 15 resin was comparable to the best results previously reported for solid catalysts. Furthermore, a comprehensive examination of acidity and accessibility was conducted to better understand their behavior. As expected, PTSA exhibited higher yields but also showed common drawbacks associated with homogeneous catalysts, such as corrosion and difficulties in separation. From an environmental perspective, and considering potential reuse cycles, the CBV720 zeolite delivered promising results during five consecutive tests. Its levels of conversion and selectivity were comparable to those obtained with Amberlyst 15, making it a viable alternative for future studies.
1. Introduction
Biodiesel is an alternative fuel that is highly desirable from a sustainability point of view because of its renewable origin [1]. It can be used in static engines and motor vehicles, either directly or blended with conventional diesel fuel. Its use offers several advantages. First, it has a lower environmental impact (lower CO2 emissions because its production comprises a closed carbon cycle [2]). Second, biodiesel is produced from renewable raw materials like vegetable oils through transesterification of triglycerides with methanol over a basic catalyst. As a result of this process, glycerol can be obtained in significant yields, around 10% of the total volume of biodiesel produced [3]. Increased production and demand have led to a surplus of glycerol in the market, reducing its price and affecting the economics of biodiesel production. Considering also that the generated glycerol contains impurities (crude glycerol), such as methanol, soaps and water, the market value was US cent 8.81–19.84 per kilogram of crude glycerol in 2014 and almost close to US cent 59.52–90.39 per kilogram of pure glycerol [4]. The market values of glycerol up to 2024 remained within this range (around US cent 16.5 per kilogram of crude glycerol and close to US cent 90.0 per kilogram of pure glycerol) [5]. On the other hand, purification costs are relatively high, limiting its utilization in food additives, cosmetics, and surfactants [6]. However, glycerol’s availability represents an opportunity to obtain several value-added chemicals via highly selective catalytic conversion [3,7,8].
Given these challenges with crude glycerol utilization, researchers have explored new pathways to add value to this byproduct. An interesting option is the production of additives such as diacetylglycerols (1,2-DAG and 1,3-DAG) and triacetylglycerol (TAG). These compounds have several applications, including improving viscosity and low-temperature performance of petroleum fuels and biodiesel (such as pour point and cold filter plugging point). TAG may also serve as an antiknock additive for gasoline [7] and can enhance viscosity while meeting EN14214 and ASTM D6751 standards for flash point and oxidation stability [9,10,11]. Finally, a comprehensive review indicates that TAG’s use as a fuel additive is associated with environmental and economic benefits [12].
With respect to DAG and TAG production, two acetylating reactants have been studied: acetic acid (HAc) and acetic anhydride (Ac2O). Ac2O yields high selectivity for TAG [13], but presents higher risks and costs related to handling, transport, storage and equipment. Moreover, Ac2O is a raw material for narcotic production. It is classified as contraband in most countries, which prohibits its use even for research purposes. It increases cost and limits supply; thus, acetic acid, being more readily available, is generally preferred [14].
Esterification of glycerol with acetic acid and other acids in the liquid phase proceeds through three consecutive reaction steps. Acetic acid (HAc) is successively added to glycerol (Gly), first forming monoacetylglycerols (1-MAG and 2-MAG), then diacetylglycerols (1,2-DAG and 1,3-DAG), and finally producing triacetylglycerol (TAG), with water generated as a by-product at each stage. Esterification studies with other alcohols demonstrate similar mechanisms on acidic solid catalysts, beginning with acid adsorption and followed by nucleophilic attack from the alcohol’s hydroxyl group on the carboxylic group [15].
In summary, these reactions are acid-catalyzed in both homogeneous and heterogeneous systems. Homogeneous catalysis with strong acids demonstrates high efficiency, following the Fischer esterification pathway. Notably, the reaction may proceed even without an external catalyst upon mere mixing of reactants; thus, experimental outcomes should always be benchmarked against control tests to account for potential autocatalysis by acetic acid. Since these reactions are reversible and controlled by thermodynamic equilibrium, developing catalysts that achieve high glycerol conversions and favor production of highly acetylated esters (DAG and TAG) remains challenging.
Currently, this reaction is performed industrially without catalysts or with homogeneous liquid acid catalysts such as p-toluene sulfonic acid (PTSA), H3PO4, H2SO4, and HCl [16]. Homogeneous acids cause issues like reactor corrosion, harmful waste generation, and catalyst loss due to incomplete separation. To mitigate these issues, various heterogeneous acid catalysts have been explored, including alkyl-sulfonic acid functionalized SBA-15, commercial resins, functionalized mesostructured solids, and carbon-based catalysts [17,18,19,20,21,22,23,24,25].
Recent comprehensive reviews by Hameed et al. [14] and Pérès et al. [26] have assessed the state of catalytic acetylation of glycerol. These works emphasize the ongoing need for new catalytic solids and more detailed studies, due to challenges such as side-product formation, issues arising from poorly structured pore channels, catalyst deactivation or thermal degradation, and the leaching of functional groups. The performances of the main catalysts are presented in Table 1
Beyond traditional acid catalysts, zeolitic materials have also been explored due to their unique pore structure. Some studies have investigated glycerol acetylation using both commercial and modified zeolites such as H-ZSM-5, H-BEA, and H-Y. These studies show lower catalytic activity compared to other acidic solids due to no adequate zeolite selection from the point of view of active site accessibility and hydrophilic character [18,27,28,29,30,31]. Despite this, H-Y zeolites have been widely employed for esterification with various alcohols and acids. For instance, H-Y zeolite catalyst CBV780 (Si/Al:40) showed high efficiency in the esterification of oleic acid with methanol, achieving a 98% conversion rate and promising recyclability [32]. Additionally, it was found that low-silica Y zeolites (silicon-to-aluminum ratios of 2 and 5) are susceptible to dealumination by lactic acid under reaction conditions, rendering them unsuitable as catalyst supports [33]. In addition, other studies have examined H-USY zeolite for esterifying levulinic acid with different alcohols [34,35], fatty acids with methanol using CBV300, CBV720, and H-Y zeolites [36,37,38], and acetic acid with n-butanol using heteropolyacid-modified CBV300 zeolite [39].

Table 1.
Solid Catalysts performances in the glycerol acetylation with acetic acid.
Table 1.
Solid Catalysts performances in the glycerol acetylation with acetic acid.
| Catalyst | HAc/Gly a | Temp (°C) | Time (h) | X (%) | S (%) b | Recycles | Ref |
|---|---|---|---|---|---|---|---|
| A15 | 9/1 | 110 | 4.5 | 97.1 | 92.2 | Not Performed | [25] |
| H-USY | 78.4 | 26.2 | Not Performed | ||||
| H-ZSM-5 | 85.6 | 33.4 | Not Performed | ||||
| A15 | 6/1 | 105 | 4.0 | 98.6 | 25.0 * | Not Performed | [18] |
| H-Y | 6/1 | 105 | 4.0 | 80.9 | 3.2 * | Not Performed | |
| H-ZSM-5 | 6/1 | 105 | 4.0 | 75.7 | 2.5 * | Not Performed | |
| Sulf-SBA-15 | 6/1 | 120 | 4.5 | 100 | 70.0 | Not Performed | [40] |
| H-ZSM-5 AT | 6/1 | 120 | 91.0 | 52.0 | Not Performed | ||
| PMo3_Na-USY | 15/1 | 120 | 3 | 68.0 | 61.0 | 5 | [23] |
| PW2_AC | 15/1 | 120 | 3 | 86.0 | 74.0 | 4 | [24] |
a Molar Ratio, b Selectivity to D.A and T.A, * Selectivity to T.A.
Moreover, zeolites have also been studied for other value-added transformations of glycerol. Research has demonstrated the use of H-Beta and H-Y zeolites in processes such as glycerol etherification and acetalization [40,41]. These findings highlight the versatility of zeolitic materials as catalysts in the conversion of glycerol into higher-value chemicals. However, it should be noted that glycerol acetylation has not been specifically examined in these cases. Among the variety of catalytic solids explored, Faujasite zeolites remain less investigated with respect to glycerol acetylation.
Previous works by the authors [42] demonstrated that the conversion of glycerol to MAG can be catalyzed by MFI zeolites, but subsequent transformation to DAG and TAG is hindered by the porous structure, obtaining results no better than a blank test. Development of mesoporosity by alkaline treatment over these catalysts [43] affected the availability of acid sites required by the reaction, reporting no improvements in the activity. Then, H-ZSM-5 exhibited poor performance owing to its porous structure. Further tests with mesoporous materials [42,44] showed that the intrinsic activity of the sites of sulfonic silica is comparable to sulfuric acid, though the increment in the load of sites led to steric hindrances, which were less pronounced in well-ordered SBA-15 catalysts. Considering their pore size and stability, as well as their widespread use in industrial catalytic processes, FAU zeolites are good candidates for this reaction. Although CBV720 zeolite displays moderate acidity, it offers suitable porosity and hydrophobicity. Our aim is to enhance hydrophobicity and accessibility to active sites compared with zeolites previously studied [18,27,31]. Finally, A15, which has been identified as one of the most active catalysts in the literature, was included in the study as a reference catalyst and evaluated under the same reaction conditions as the zeolites
Despite prior research, a comprehensive comparison of homogeneous and heterogeneous catalysts for this reaction remains unavailable. In the present contribution, two Y zeolites were examined, and their catalytic performance was compared to that of a commercial resin (A15). The reusability of these catalysts was assessed by conducting two consecutive recycles, with one selected Y-zeolite catalyst subjected to five additional recycle tests to establish its stability. Furthermore, p-toluene sulfonic acid, a widely used industrial homogeneous catalyst for this reaction, was tested as a control, with its performance directly contrasted with those of the heterogeneous catalysts.
2. Materials and Methods
2.1. Materials
Several commercial zeolites supplied by Zeolyst® (Kansas City, KS, USA) were selected: Protonic ultra-stable Y zeolite, H-USY (CBV720; Si/Al: 15); Ammonium Y zeolite, NH4-Y (CBV300, Si/Al: 2.6) and Sodium Y zeolite, Na-Y (CBV100, Si/Al: 2.6). Amberlyst-15 (A15), a commercial resin obtained from Sigma Aldrich (Sofia, Bulgaria), was also tested as a benchmark for comparison. For the catalytic tests the following compounds from Sigma-Aldrich were used: glycerol (>99.0%), glacial acetic acid (>99.8%) and p-toluene sulfonic acid (PTSA). Before its catalytic evaluation, NH4-Y zeolite was calcined at 823 K for 5 h (2 °C min−1) in a muffle furnace overnight to obtain the corresponding H-Y zeolite.
2.2. Characterization Techniques
A comprehensive set of analytical methods was employed to characterize the physicochemical properties of the catalysts. These included N2 adsorption–desorption isotherms at 77 K, transmission electron microscopy (TEM) combined with energy dispersive X-ray spectroscopy (EDX), scanning electron microscopy (SEM), and X-ray diffraction (XRD) analyses. The acidity of the materials was assessed via temperature-programmed desorption (TPD) of pyridine and collidine, as well as Fourier-transform infrared spectroscopy (FTIR).
The textural properties of the solids were determined from N2 adsorption–desorption isotherms at 77 K obtained at the technical services of the University of Alicante (SSTTI-UA) using a Quantachrome AUTOSORB-6 equipment (Anton Paar, Graz, Austria). Structural characterization of the zeolites was conducted with powder XRD on a SEIFERT 2002 instrument (Mannheim, Germany) using CuKα (λ = 1.5418 Å) radiation. The study was carried out using wide-angle XRD in the 2.5 < 2θ < 50 range, using a scanning velocity of 1° min−1. The powders were mixed with graphite as an internal standard to determine the crystallinity of the samples. The intensity of the peak at 2θ = 26.5° of the graphite was used to normalize the diffraction patterns, and relative crystallinity was calculated using the peak at 2θ = 16° of the zeolite.
The morphology and microstructure of the samples were examined by TEM at the SECEGRIN facility of CCT-CONICET Santa Fe, and by SEM at SSTTI-UA. TEM imagery was obtained with a JEOL JEM-2100 Plus microscope (Akishima, Japan) equipped with a LaB6 gun. Samples were suspended in ethanol and then two drops were deposited over a copper-grid. Bright-field images were obtained under a voltage of 200 kV. Image processing was performed with Gatan Microscopy Suite version 3.6.0 under a free license. For further analysis of calcined zeolite cross-sections, samples were embedded in Spurr resin and sectioned into 80 nm slices using an RMC MTXL ultramicrotome (Boeckeler, Tucson, AZ, USA). Then, TEM images were captured with a JEOL JEM-1400 Plus transmission electron microscope (Akishima, Japan) operating at 120 kV, with a resolution of 0.38 nm between points and a line resolution of 0.20 nm and equipped with a GATAN ORIUS image acquisition camera (Las Positas Blvd. Pleasanton, CA, USA). SEM images were obtained using a Hitachi S-3000N microscope equipped with a scintillator-photomultiplier secondary electron detector (3.5 nm resolution), a semiconductor backscattered electron detector (5 nm resolution), and a Bruker XFlash 3001 X-ray detector (Billerica, MA, USA) for microanalysis.
To evaluate the quantity and strength of acid sites, pyridine TPD measurements were performed. Collidine (2,4,6-trimethylpyridine), a bulkier base, was used in parallel to determine the accessibility of acid sites in the zeolites. The nature of acid sites was further investigated by collecting FTIR spectra (INCAPE-CONICET) following pyridine and collidine saturation, using a Shimadzu Prestige 21 spectrometer (Kyoto, Japan). Additional details regarding experimental procedures are provided in Appendix B.
2.3. Catalytic Tests
All catalytic reactions were performed at atmospheric pressure within a 250 mL three-neck flask, equipped with stirring and heated using an oil bath controlled by a thermocouple and a PID controller. The reaction temperature was maintained at 393 K. To ensure the retention of water and acetic acid vapors, a condensing column was utilized. The experimental procedure involved heating the mixture of glycerol and solid catalyst to the desired temperature, followed by injection of acetic acid into the system. Three different acetic acid to glycerol molar ratios were explored: 12/1, 6/1, and 3/1. The zeolites were calcined at 823 K for 5 h prior to use, and the dry A15 was kept in an oven at 353 K to avoid moisture adsorption.
Tests were conducted under two main conditions: (i) maintaining a constant solid catalyst to glycerol mass ratio of 2 g catalyst per 100 g glycerol, and (ii) using a fixed acid sites per gram of glycerol feed ratio (9.5 × 10⁻² mmol/g glycerol), applicable for A15, CBV720 zeolite, and PTSA. Due to the diffusional limitations of the microporous CBV300 zeolite, it was tested at approximately five times this feed ratio. The reuse of both zeolites and the resin was studied in different catalytic cycles. After each cycle, the catalysts were separated by centrifugation and regenerated by thoroughly washing them with ethanol and then air dried at 105 C for 12 h.
To determine the glycerol conversion and products selectivity, samples were collected every 30 min, filtered and analyzed by gas chromatography (Shimadzu GC-2010, Kyoto, Japan) equipped with a flame ionization detector (FID), AOC-20i autosampler (Shimadzu, Kyoto, Japan), and a BP20 column (30 m × 0.25 mm × 0.25 μm, Sprockhövel, Germany).
Glycerol conversion (X) and product selectivity (Sα) were calculated with the following equations:
The specific activity of the acid sites for glycerol conversion under the defined reaction conditions was assessed using the turn-over frequency (TOF, h−1). TOF was calculated by dividing the number of moles of glycerol converted per mole of catalyst (acid sites) and the reaction time.
Catalysts classified as “used” were those subjected to reaction for 24 h. Following the reaction, these catalysts were filtered, centrifuged, washed, and dried. For zeolite solids, an additional gradual calcination at 823 K for 5 h (1° min−1) was performed to complete the post-reaction treatment.
3. Results
3.1. Structure Characterization
Figure 1 presents the N2 adsorption–desorption isotherms at 77 K for the CBV300 and CBV720 zeolites, as well as the A15 resin. Using these isotherms, the corresponding textural parameters were calculated and are summarized in Table 2. The fresh zeolites (with solid and empty red circles representing adsorption and desorption branches, respectively) display Type I isotherms which are characterized by high nitrogen uptake at low relative pressures (P/P° < 0.2) characteristic of microporous materials. The absence of hysteresis cycle in CBV300 isotherm (Figure 1A) indicates the low number of defects of this zeolite and the absence of mesoporosity [45,46]. In the case of the CBV720 sample (Figure 1B), a significant increase in N2 adsorption is observed at relative pressures between 0.80 and 0.95, indicating the existence of large mesopores alongside the micropores. These features result from the steaming process performed by the supplier [47]. At even higher relative pressures (above 0.95), both materials exhibit additional adsorption, which is attributed to interparticle condensation. As anticipated, the A15 resin’s isotherm (Figure 1C) demonstrates the typical profile of a macroporous material.
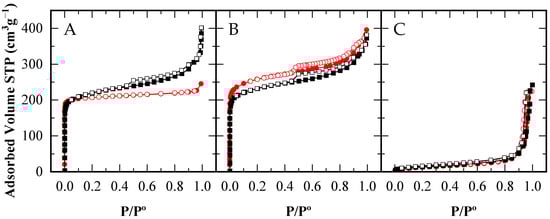
Figure 1.
N2 Adsorption–desorption isotherms of CBV300 (A), CBV720 (B) and A15 (C), for the fresh catalysts ( ) and after their use in reaction (■□). Adsorption branches in filled symbols (
 ) and desorption branches in open symbols (
 ).
).
) and after their use in reaction (■□). Adsorption branches in filled symbols () and desorption branches in open symbols ().
Table 2.
Textural and acidity results.
When examining the zeolites after catalytic use (solid and empty black squares for adsorption and desorption branches, respectively), a distinct change in behavior emerges. The used CBV720 zeolite retains an isotherm profile very similar to that of the fresh material, except for a slight reduction in micropore volume (see Table 2). In comparison, the CBV300 zeolite exhibits a modest increase in N2 adsorption at P/P° > 0.1. These findings indicate that under reaction conditions, (i) a small blocking of the microporosity occurs in the CBV720 zeolite, which is not totally recovered after the calcination step; and (ii) the CBV300 zeolite develops modified porosity, likely caused by the acetic acid and water present in the reaction mixture—a phenomenon previously reported for low-Si/Al-ratio zeolites exposed to acidic solutions [32].
XRD patterns for the CBV300 and CBV720 zeolites, both before and after the reaction, are shown in Figure 2. For each sample, graphite was added as an internal standard, allowing normalization of the diffraction data by referencing the most intense graphite peak [(0 0 2) at 26.55° 2θ]. The XRD results confirm that all samples exhibit the faujasite (FAU) framework, with no other crystalline phases detected. Importantly, this FAU structure persisted throughout the catalytic testing process. Notably, the CBV720 zeolite demonstrated consistent crystallinity before and after the reaction, showing no significant changes. In contrast, the CBV300 zeolite experienced a decrease in crystallinity of approximately 10% following the reaction. This observation suggests that the zeolite with the higher aluminum content in its framework was more susceptible to alteration under the tested reaction conditions. This is consistent with the N2 isotherm results.
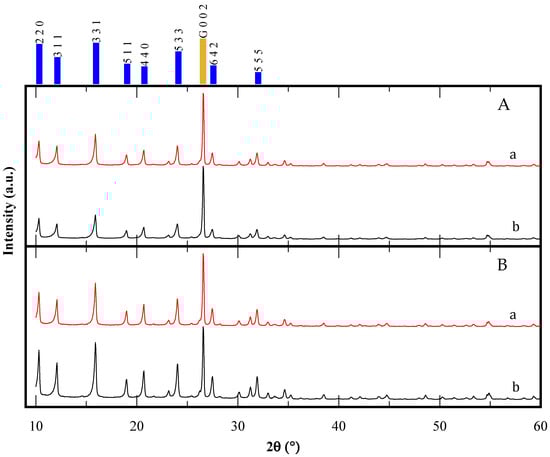
Figure 2.
XRD patterns of CBV300 (A) and CBV720 (B); before (a) and after (b) use in reaction. The main peaks of FAU simulated pattern are indicated in blue, while the gold bar corresponds to graphite internal standard.
To further investigate the morphology of the samples, transmission electron microscopy (TEM) images for both zeolites and scanning electron microscopy (SEM) images for the A15 resin were obtained. First, an exploratory analysis was performed (refer to Appendix A, Figure A1). The TEM micrograph of the H-USY zeolite (Figure A1B) revealed the presence of mesopores generated by the steaming process, consistent with findings from the N2 adsorption isotherm. In contrast, these mesopores were absent in the CBV300 zeolite, as shown in Figure A1A. SEM analysis of the A15 resin revealed that it is composed of spherical particles ranging from 300 to 800 μm in diameter (Figure A1C).
To better distinguish morphological differences between the two zeolites, TEM micrographs of ultramicrotomed samples were also taken and are presented in Figure 3.
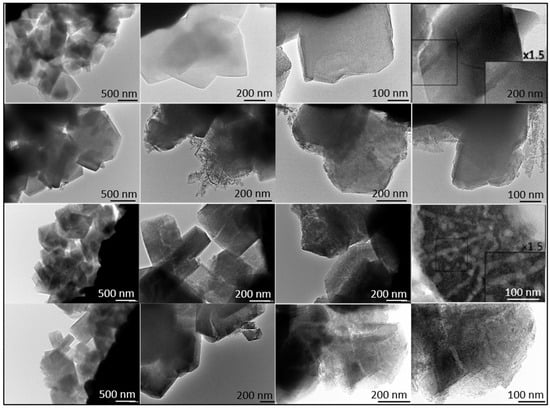
Figure 3.
TEM Images of CBV300 before (Row I) and after use in reaction (Row II). TEM Images of CBV720 before (Row III) and after use in reaction (Row IV). Ultramicrotomed CBV300 (Row I, column 4) and CBV720 (Row III, column 4).
Additional TEM analysis was conducted on zeolites after their use in reaction. The results indicated that CBV720 retained its morphological features (see rows III and IV in Figure 3), whereas the used CBV300 zeolite displayed the presence of external aggregates, suggesting the potential formation of segregated extra-framework aluminum species (see rows I and II in Figure 3). This hypothesis was supported by Energy Dispersive X-ray (EDX) analysis at both general and specific locations on the samples. For CBV720, EDX quantification revealed an average Si/Al ratio of approximately 20, with a homogeneous distribution observed for both the calcined and the used material. In contrast, the calcined and used CBV300 samples showed average Si/Al ratios of about 2.58 and 3.04, respectively, with a more heterogeneous distribution. These results indicate a decrease in bulk aluminum content for CBV300. Furthermore, EDX analysis of the surface aggregates in the used CBV300 sample showed Si/Al ratios between 0.23 and 0.70, confirming the preferential segregation of aluminum in this material.
All mentioned TEM micrographs, accompanied by the EDX maps of Si and Al and spectra of selected regions, are shown on Figure A2 in Appendix A.
In conclusion, the presence of excess acetic acid and water generated during the reaction can interact with the aluminum atoms in the CBV300 zeolite framework. This interaction may induce a certain degree of dealumination, which in turn alters the porosity of the material—as observed in both TEM and N2 adsorption measurements—and results in a decreased degree of crystallinity as observed in XRD spectra.
3.2. Acidity Characterization
3.2.1. Temperature-Programmed Desorption (TPD) of Pyridine and Collidine
The acidity profiles of both zeolites, before and after reaction, were investigated using temperature-programmed desorption (TPD) of pyridine and collidine. This analysis is summarized in Table 3 and Figure 4. The FAU structural model features supercages with a free diameter of 1.12 nm, each interconnected by four windows with a free diameter of 0.730 nm [48]. Given the kinetic diameters of pyridine (0.533 nm) and collidine (0.740 nm), these molecules exhibit varying degrees of accessibility to the microporous acid sites. For the commercial CBV300 and CBV720 solids, approximately 60% and 70% of acid sites, respectively, were accessible to collidine (as shown in Table 2, Col/Py (%)).
Table 3.
Amount of acid sites determined by TPD with different probe molecules, for zeolites before and after reaction.
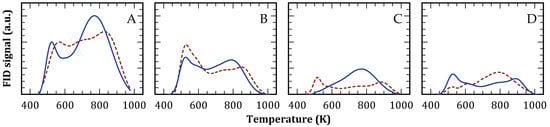
Figure 4.
Pyridine (continuous) and collidine (dashed) TPD profiles. CBV300 before (A) and after use in reaction (B); CBV720 before (C) and after use in reaction (D).
After reaction, CBV720 maintained nearly 90% of acid sites accessible to pyridine (Table 3 and Figure 4C,D, continuous line), whereas CBV300 retained only 66% (Table 3 and Figure 4A,B, continuous line). This reduction aligns with the modifications in porosity and crystallinity previously observed. Importantly, the quantity of acid sites accessible to collidine remained largely unchanged for both zeolites, indicating that the acid sites lost during reaction were predominantly located in micropores inaccessible to collidine. Further examination of the TPD profiles revealed that CBV300, following reaction, preferentially lost acid sites of medium and high strength (T > 673 K), most of which were situated in positions accessible to pyridine. In contrast, CBV720 preserved its pyridine desorption profile with minimal changes after reaction.
3.2.2. Pyridine FTIR Studies
OH Region
The FTIR spectra of CBV300 and CBV720 zeolites in the OH stretching region are illustrated in Figure 5. For CBV720, the spectrum displays three distinct and intense OH stretching bands at 3744, 3628, and 3566 cm−1. Both lower-frequency bands show components at their lower-frequency sides. This pattern is characteristic of ultrastable Y-type (USY) zeolites [49,50], while the other two bands correspond to “structural” hydroxyl groups: high-frequency (HF) OH groups in the supercages (3628 cm−1) and low-frequency (LF) OH groups in the sodalite cages (3566 cm−1). The low-frequency shoulders near 3600 and 3550 cm−1 are associated with HF and LF species interacting with residual extra-framework (EF) material [51]. The CBV300 sample exhibits a much weaker silanol band at 3742 cm−1, along with a split band at 3689 and 3678 cm−1 in the region typically assigned to OH groups on extra-framework material. Finally, two bands are found at 3636 and 3551 cm−1, possibly due to two components, in the region of zeolitic hydroxyl groups. The Na-Y sample displayed extremely weak bands at 3741 and 3684 cm−1, suggesting that only a minimal amount of external silanol groups and OHs on extra-framework species is present. Bands due to bridging OHs in the supercage (HF) and sodalite cage (LF) are absent, indicating complete cation exchange by sodium ions.
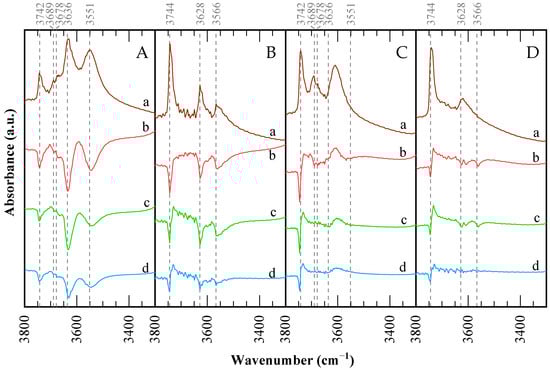
Figure 5.
FTIR spectra in the hydroxyl region for the catalysts: (A) CBV300, (B) CBV720, (C) used CBV300, (D) used CBV720. (a) Spectra after outgassing of the sample. Difference spectra after pyridine saturation and posterior desorption at: (b) 423 K; (c) 573 K; and (d) 673 K.
Upon comparing the catalysts before and after use, LF bands disappear entirely, and HF bands decrease in intensity and shift to lower frequencies. Conversely, silanol and extra-framework aluminum (EFAL) bands intensify. This suggests that aluminum is extracted from the framework, forming defects and EFAL species, which interact with the remaining sites and cause the observed shifts in absorption bands. CBV300 demonstrates a greater reduction in HF and LF bands, consistent with its larger loss of crystallinity, increased mesoporosity, and TEM-EDX findings.
Pyridine Adsorbed Region
Figure 6 shows the FTIR surface acidity study of the CBV300 and CBV720 samples, by using pyridine as a probe molecule. Spectra were recorded after three outgassing steps at 423, 573 and 673 K. The pyridine species present after the first step were considered to correspond to the total amount of acid sites. After the second step, the remaining pyridine was assigned to “medium” and “strong” sites, having desorbed the pyridine from the “weak” sites. Finally, sites corresponding to pyridine species still found after outgassing at 673 K are assumed to be the “strong” fraction. The number of sites corresponding to each fraction was determined by subtracting the associated values (Table 4). This method ensured accurate representation of the distribution across all fractions and provided a clear quantitative basis for subsequent analysis. At each step, quantification was carried out according to the procedure described by Ivanova et al. [52].
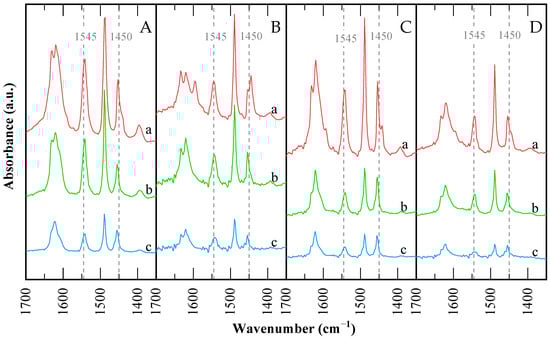
Figure 6.
FTIR spectra in the pyridine region for the catalysts: (A) CBV300, (B) CBV720, (C) used CBV300, (D) used CBV720. Difference spectra after pyridine saturation and posterior desorption at: (a) 423 K; (b) 573 K; and (c) 673 K.
Table 4.
Acid sites characterization: Lewis and Brønsted sites concentrations determined by FTIR analyses of adsorbed pyridine.
The spectra feature bands at 1633–1631 cm−1 (vibrational mode 8a) and 1545 cm−1 (mode 19a) [53], assigned to pyridinium ions formed by protonation of pyridine on Brønsted acid sites. Bands at 1622–1624 and 1452–1455 cm−1 correspond to very strong Lewis acid sites, typical of alumina and silica-alumina materials [54,55]. Comparing the two protonic zeolites, the relative intensities of pyridinium and molecular pyridine bands reveal that Brønsted sites are more prominent in H-USY (CBV720) than in H-Y (CBV300).
The Na-Y (CBV100, not depicted) sample contains only Lewis acid sites, in greater quantity than the protonic zeolites. While these Lewis sites are considered “strong,” they are weaker than those in the protonic zeolites and are mainly associated with Na+ and Al3⁺ cations.
In Table 4, it is observed that CBV300 has a similar number of strong Lewis and Brønsted sites, with Brønsted sites predominating in medium and weak strengths—over 80% combined—while the strong fraction dominates among Lewis sites. CBV720 exhibits a higher proportion of strong sites for both Brønsted and Lewis acidity, with Brønsted sites prevailing across all strengths (Br/Lw ratios 3.54–3.76). The overall trend for total (Lewis + Brønsted) strong acid site density is CVB300 > CVB720 > CVB100. Among the protonic zeolites, CBV300 has more Brønsted and Lewis acid sites than CBV720, which reflects its higher Al content, but both have similar amounts of strong Brønsted sites.
The presence of Lewis sites on CBV300 zeolite is likely due to extra-framework material, as the 3698 and 3678 cm−1 bands indicate OH groups on EFAL (Figure 5). For CBV720, the existence of Lewis acid sites is not straightforward, given the low framework Al content and the lack of EFAL in the OH region, though active Lewis sites have been previously reported in USY [46,56,57]. Weak Brønsted sites are mostly silanols. Quantification results summarized in Table 4 indicate that the Br/Lw ratio from pyridine-FTIR is higher for CBV720 than CBV300, and about 54% of Brønsted sites in CBV720 are strong, compared to just 18% in CBV300. In addition, acid sites accessible to collidine are around 80% in CBV720 and 30% in CBV300.
After reaction, both catalysts show a decrease in the total number of acid sites, particularly strong sites, with a corresponding increase in weak sites. The Br/Lw ratio drops to approximately 1.2, indicating a more substantial loss of Brønsted than Lewis sites, consistent with the changes in OH groups observed earlier. Notably, CBV720 loses strong Brønsted sites but gains a slight increase in strong Lewis sites, suggesting some transformation of acid sites and the possible formation of EFAL or defects. Overall, Brønsted sites are converted into Lewis sites, and both types are weakened and diminished.
3.3. Reactions Catalyzed by Acetic Acid (Autocatalytic)
A series of experiments was conducted to evaluate conversion and selectivity in the absence of an added catalyst, relying solely on acetic acid to provide the necessary protons for acetylation. Three tests were performed using molar HAc/Gly ratios of 3/1, 6/1, and 12/1. These experiments measured glycerol conversion (see Figure A3A and Table A1 in Appendix A), as well as selectivity toward MAG, DAG, and TAG (Figure A3B–D). For all reactions, the same volume was maintained.
Initially, reaction rates appeared similar across all ratios. However, after several minutes, the test with the highest acetic acid content (12/1, represented by the blue curve) exhibited an accelerated reaction rate, with acetic acid acting as the catalyst. After 24 h, complete conversion (100%) was achieved only in the 12/1 test; nevertheless, high conversions were also obtained with the other ratios, reaching 95.5% for 6/1 and 91.2% for 3/1 (see Table A1 and Figure A2a).
In terms of selectivity toward MAG, DAG, and TAG, the highest selectivity to TAG was observed in the reaction with the greatest amount of acetic acid, consistent with previous literature [8,15]. Selectivity data at two specific glycerol conversions (10% and 80%), as well as final selectivity values, are summarized in Table A2 and Figure 7. The time-course evolution of selectivity is illustrated in Figure A3B–D. At low conversion (10%), product selectivity showed little variation between tests (Figure 7A). At higher conversion (80%), selectivity for TAG and DAG increased in the reaction with the lowest glycerol content (12/1 HAc/Gly molar ratio), as depicted in Figure 7B.
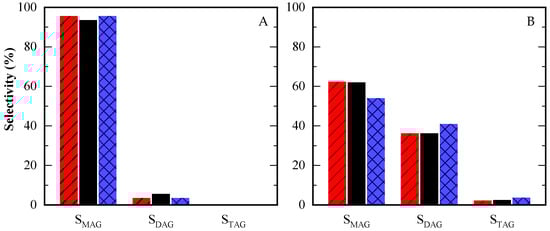
Figure 7.
Selectivity towards different products at equal glycerol conversion level: 10% (A) and 80% (B) for HAc/Gly molar ratio = 3/1 (red, streaked); 6/1 (black) and 12/1 (blue, squared).
3.4. Reactions Catalyzed by Solid Acids
Following the exploration of autocatalytic reactions, it was observed that while the catalytic results achieved with a 12/1 acetic acid to glycerol molar ratio were slightly superior, such a high molar ratio is not applicable for the industrial process not only by reagent costs but due to the difficulty of the separation of the unreacted HAc. Therefore, an increased acetic acid requirement not only would affect the overall economics but also possess challenges for practical application. To address the cost and efficiency concerns, the catalytic behavior of three different solid acids was evaluated by using an acetic acid to glycerol molar ratio of 6/1, aiming to optimize the process by balancing catalytic performance and economic and operational feasibility.
Each catalyst was tested at a fixed dosage, corresponding to 2 wt.% of the initial glycerol mass. Results from these experiments are illustrated in Figure A4, Appendix A.
Among the catalysts, A15 demonstrated significantly higher activity than both zeolites, attributed to its higher amount of acid sites. The catalytic performance of the zeolites was comparable to that observed in the autocatalytic tests, which is likely due to their lower number of acid sites and the relatively small catalyst-to-glycerol mass ratio. Notably, CBV720, despite being less acidic than CBV300 ([H+] CBV720 ≈ 1/5 [H+] CBV300), achieved slightly superior performance. This enhancement is most likely related to the presence of mesopores, which facilitate diffusion and minimize transport limitations.
To assess whether the acid sites of the catalysts were equally effective, experiments were conducted with A15 and CBV720, ensuring the same number of acid sites per gram of initial glycerol. For CBV300, which showed reduced activity compared to CBV720, the same mass was used as for CBV720, resulting in a fivefold increase in the total concentration of acid sites. This allowed for evaluation of whether an excess of acid sites could compensate for limited accessibility, potentially leading to similar activity levels.
When the number of acid sites was standardized, the performance of CBV720 and A15 was nearly indistinguishable (see Figure 8A), indicating that the diffusivity of reactants and products was comparable in both catalysts, despite the smaller pore size in the zeolite versus the resin. In contrast, CBV300 still exhibited lower activity, even with a fivefold increase in acid site concentration, suggesting that not all its acid sites were accessible to the reactants.
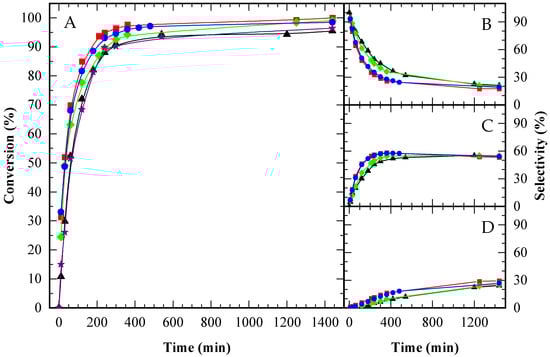
Figure 8.
Glycerol conversion (A) and selectivity towards MAG (B), DAG (C) and TAG (D) over time for CBV300 (♦), CBV720 (⬤), Amberlite ( ), CBV100 (★), and the autocatalytic run (▲), under an equal acid load of 9.5 x 10⁻² mmol H+ (g glycerol)−1. HAc/Gly molar ratio: 6/1.
), CBV100 (★), and the autocatalytic run (▲), under an equal acid load of 9.5 x 10⁻² mmol H+ (g glycerol)−1. HAc/Gly molar ratio: 6/1.
The selectivity profiles for all catalysts revealed a typical sequence of consecutive reactions (Figure 8B–D). Initially, MAG was the predominant product, but as the reaction progressed, its selectivity decreased while that of DAG and TAG increased. After DAG selectivity reached its maximum, the rate of TAG formation slowed. In the final stages, all three catalysts converged to exhibit similar selectivity profiles, indicating that the ultimate product distribution was governed by chemical equilibrium.
To further investigate the contribution of the zeolitic support relative to its Brønsted acidity, a sodium zeolite (CBV100) was used as a control. The catalytic activity of CBV100 was found to be nearly identical to that observed in the autocatalytic reaction. This result indicates that the advancements seen with acid zeolites, specifically CBV720 and CBV300, are attributable exclusively to their Brønsted acidity. While CBV100 possessed a significant number of Lewis acid sites, these did not notably influence the reaction outcome.
The reaction was also conducted using p-toluene sulfonic acid as a homogeneous liquid catalyst, at a dosage of 9.5 × 10⁻² mmol H+ per gram of glycerol. This allowed a direct comparison between heterogeneous and homogeneous catalysis. The homogeneous catalyst demonstrated both higher initial activity and greater turnover frequency (TOF) at 30 min compared to the heterogeneous systems. Nevertheless, the final conversion and product selectivity observed with the homogeneous catalyst were comparable to those achieved with the A15 and CBV720 catalysts, as detailed in Table A3. Beyond catalytic performance, heterogeneous reactions offer notable advantages, particularly in terms of environmental impact and ease of catalyst separation.
3.5. Comparison Between Heterogeneous and Homogeneous Catalysts
To provide a thorough comparison, glycerol conversion was evaluated at different concentrations of p-toluenesulfonic acid (PTSA) used as the catalyst. Measurements were taken at 10, 30, and 60 min, with PTSA concentrations ranging from 0 to 0.024 mol H+ L−1. These results enabled the construction of calibration curves to correlate the activity of various catalytic solids with the equivalent concentration of acidic PTSA sites needed to achieve similar conversion levels. The calibration curve at 10 min was selected for its high degree of linearity (see Figure 9A).
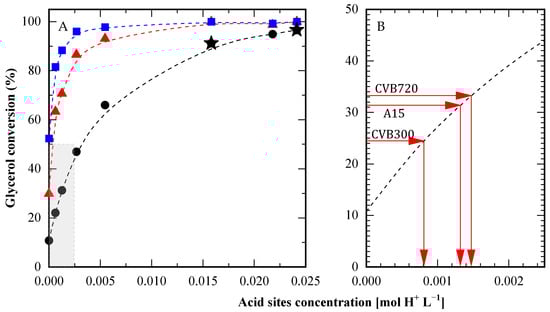
Figure 9.
Comparison between solid acids and PTSA. (A) Conversion at 10 min (●), 30 min (▲) and 60 min (■) obtained with different concentrations of p-toluene sulfonic acid (PTSA) and at 10 min with sulfuric acid (★). (B) Equivalent PTSA concentration for different solid catalysts in order to obtain the same conversion at 10 min, according to the curve from shaded area in panel (A). HAc/Gly molar ratio: 6/1.
For example, CBV300, at an experimental acid site concentration of 0.102 mol L−1, achieved a 24.5% glycerol conversion at 10 min. According to Figure 9B, this same conversion could be reached with just 0.00082 mol L−1 of PTSA. Applying this analysis to CBV720 and A15 (each with an experimental proton concentration of approximately 0.0204 mol L−1), the observed activity corresponded to 0.0014 mol L−1 of PTSA, which was significantly higher than CBV300. Notably, this value is twenty times smaller than the actual concentration of acidic sites present in the solids. In summary, the activity level demonstrated by the solids could be matched using PTSA with only a twentieth of the proton concentration found in the solid catalysts. This observation highlights that, although the solid catalysts exhibited considerable activity, their performance remained considerably lower than that of the homogeneous catalyst. Nonetheless, this drawback can be compensated by the fact that solid catalysts can be easily separated from the reaction media and then reused.
The reusability of A15, CBV720, and CBV300 was evaluated and is illustrated in Figure 10 (A, B, and C, respectively). All three solid catalysts demonstrated comparable trends in conversion and selectivity between their initial use and subsequent reuse. While a slight decrease in catalytic activity was noted after recycling, the differences remained minimal. Based on the results from XRD analysis, surface area measurements, and acidity studies, this minor decline in performance can be attributed to the loss of a small fraction of the acid sites on the solid catalysts.
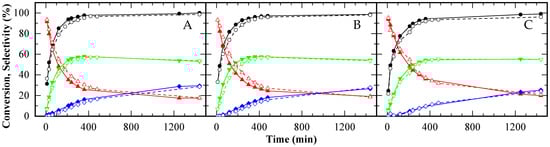
Figure 10.
Glycerol conversion (●○) and selectivity towards MAG (▲△), DAG ( ) and TAG (
 ) for A15 (A), CBV720 (B) and CBV300 (C). First test (solid symbols, continuous lines) and reuse test (empty symbols, dashed lines). HAc/Gly molar ratio: 6/1, 9.5 × 10⁻² mmol H+ (g glycerol)−1.
) and TAG () for A15 (A), CBV720 (B) and CBV300 (C). First test (solid symbols, continuous lines) and reuse test (empty symbols, dashed lines). HAc/Gly molar ratio: 6/1, 9.5 × 10⁻² mmol H+ (g glycerol)−1.
Finally, to assess CBV720 catalyst stability, five consecutive reaction tests were performed. Figure 11A,B show results at 5 and 24 h. Throughout the five catalytic cycles, both glycerol conversion and product selectivities were consistently preserved, indicating satisfactory catalyst performance over repeated use. Minor decreases in the quantity of the solid catalyst were observed. These diminutions were attributed to issues arising during the sampling process, rather than catalyst degradation. During the consecutive tests, the amounts of acetic acid and glycerol were modified as needed to ensure that the acid site-to-glycerol mass ratio remained constant. This adjustment was essential for maintaining uniform reaction conditions across all cycles
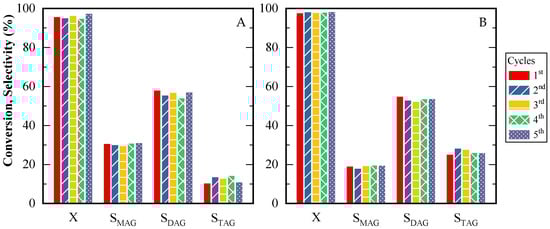
Figure 11.
Glycerol conversion and products selectivity for CBV720 during five cycles. (A) Time reaction: 5 h; (B) Time reaction: 24 h. HAc/Gly molar ratio: 6/1, 9.5 × 10⁻² mmol H+ (g glycerol)−1.
4. Discussion
The results demonstrate that glycerol acetylation with acetic acid, even without a catalyst, can achieve substantial activity and high selectivity toward the most acetylated products—DAG and TAG—when conducted under reflux conditions at 393 K. These values further improved with higher initial HAc/Gly molar ratios, leading to complete glycerol conversion and selectivity for DAG and TAG close to 90%.
Introducing a solid catalyst increased catalytic activity, although final selectivity levels were only slightly higher than those seen in the autocatalytic reaction. This suggests that selectivity is largely governed by thermodynamic equilibrium. Comparing solid catalysts revealed that A15 performed better than the CBV720 zeolite when added in equal mass ratios (catalyst/glycerol). However, when the amount of acid sites per gram of glycerol was considered, CBV720 matched the performance of A15, showing that the acid sites within this hierarchical zeolite were accessible to reactants and had similar strength.
Previous studies on zeolites have shown that the catalytic results for H-Y and H-ZSM-5 were only comparable to the autocatalytic reaction due to an inadequate choice of zeolite [18,27,31]. The hydrophilic nature of the catalyst surface can result in active site deactivation due to water formation during esterification, which may cause leaching of active components into the reaction medium. In the present work, the CBV720 catalyst, with its hydrophobic surface from a high Si/Al ratio, resists water-related deactivation and is effective for glycerol acetylation. In addition, their porous structure prevents catalyst deactivation shown by other solid catalysts by partial blockage of active sites by glycerol or glycerides within the pore structure of catalysts. In this paper, the selected CBV720 zeolite has a higher Si/Al ratio than previous works; it is more hydrophobic, allowing the exit of the water molecules from the channels and probably preserving the acidity of the sites. These cited differences explain the better results obtained.
Conversely, CBV300 failed to reach similar conversion rates, even with a fivefold increase in acid site concentration per gram of glycerol, likely due to restricted accessibility to its acid sites.
We would expect that diffusion problems would be worse on CBV300 due to their microporosity. On the other hand, the water formed upon esterification may be more harmful to their acid sites, affecting their activity to catalyze the reaction. As CBV300 has a lower Si/Al ratio than CBV720, it is more hydrophilic, not allowing the exit of the water molecules from the channels and probably affecting the acidity of the sites
In summary, the study shows that achieving a catalyst with overall performance comparable to the commercial resin (A15) depends on loading a comparable amount of accessible acid sites, and an adequate pore structure and hydrophobicity. The lower activity of CBV300 appears to stem from limited accessibility. Nonetheless, selectivity for DAG and TAG was above 90%.
The investigation into p-toluene sulfonic acid revealed that using homogeneous catalysts could match the activity and selectivity of heterogeneous systems (A15 or CBV720), but with twenty times fewer protons. This is attributed to the higher mobility of the free acid and the transport limitations imposed by the pore network in the solids. Despite this, solid catalysts offer important advantages in terms of environmental impact and ease of final separation. Furthermore, CBV720 catalyst can be reused, maintaining their activity and selectivity across at least five cycles. There are no studies that analyze the reusability of H-Y zeolites in glycerol acetylation.
Regarding the kinetics, the autocatalytic reaction requires 24 h to reach a yield of 75% of DAG+TAG. Under equal amount of acid sites, that level is reached at 18.8 h with CBV300, while CBV720 and A15 require approximately 12.5 and 10 h, respectively. With PTSA, this time is reduced to only 30 min. For comparison, mesoporous SBA-15 requires 60 to 250 min (1 to 4.2 h) to reach that reaction advance [44], with an activity closer to PTSA. Clearly, the pore network of the zeolites imposes some restrictions on the mobility of the molecules, although this effect is not as marked in faujasites as it was seen in MFI, where the activity was close to the blank test [42,43].
MFI zeolites have two different types of channels, straight-circular (5.3 × 5.6 Å) and sinusoidal-elliptical (5.1 × 5.5 Å), while FAU zeolites have supercages of 11.2 Å diameter, connected by 7.3 Å openings [48]. Therefore, the pores in the latter are big enough to allow the molecules to react, but impose diffusive restrictions that hinder the reaction rate.
On the contrary, SBA-15 has cylindrical mesopores of 90–100 Å, in an hexagonal-2D arrangement, and A15 has macropores of approximately 300 Å. Since the nature of the acid sites is similar, the comparatively inferior catalytic activity of the resin can be attributed to its much higher site density due to its lower surface area. In consequence, the proximity of the sites is conducive to steric hindrances, where an adsorbed molecule obstructs nearby sites as well, reducing the number of effectively available sites. It is worth noticing that esterification proceeds via an Eley-Rideal mechanism, where the acid is first protonated and then reacts with the alcohol group via a nucleophilic attack; in consequence, neighboring sites are not required [58].
As a conclusion, in order to reach catalytic activity with a solid acid, that could be comparable to the activity of a homogeneous acid such as PTSA, the accessibility as well as the density of the sites are to be taken into account. Although FAU improves these properties with respect to MFI and reaches an activity comparable to A15, they fall short of achieving the activity of homogeneous and some mesoporous catalysts.
Finally, the selectivity for triacetin is constrained by water produced during the three acetylation steps. Improvements could come from employing catalytic systems that continuously remove water or use an entrainer, as previous studies have shown [59,60]. Another promising approach is the use of catalytic solids that both supply acid sites and absorb the water produced. For example, expanded polyethylene functionalized with sulfonic groups has demonstrated superior results in the esterification of oleic acid with ethanol [61]. Exploring these alternative processes will be a focus for future research.
Author Contributions
Conceptualization, L.G.T., L.V. and H.P.D.; methodology, L.G.T., E.d.O.J. and N.L.P.; formal analysis, L.G.T., L.V., N.L.P. and H.P.D.; investigation, L.G.T. and L.V.; resources, B.O.D.C. and H.P.D.; data curation, L.G.T. and H.P.D.; writing—original draft preparation, L.G.T.; writing—review and editing, B.O.D.C. and H.P.D.; visualization, L.G.T., E.d.O.J., N.L.P. and B.O.D.C.; supervision, H.P.D.; project administration, B.O.D.C. and H.P.D.; funding acquisition, B.O.D.C. and H.P.D. All authors have read and agreed to the published version of the manuscript.
Funding
This research was funded by ANPCyT, project PICT 2018-0364; CONICET, postdoctoral fellowship 2018-12020170400013CO; and Universidad Nacional del Litoral, project CAI+D 2020 50620190100153LI and CAI+D 2024 85520240100031LI.
Data Availability Statement
Dataset available on request from the authors.
Acknowledgments
The authors thank CONICET for financing the postdoctoral stay of H. Decolatti at the University of Alicante. J. García Martínez is acknowledged for providing access to the laboratory facilities for this research and for his valuable discussion and feedback on the results. H. Decolatti expresses sincere appreciation to J. García Martínez and their team for the kindness and support extended during their stay.
Conflicts of Interest
The authors declare no conflicts of interest. The funders had no role in the design of the study; in the collection, analyses, or interpretation of data; in the writing of the manuscript; or in the decision to publish the results.
Appendix A
Table A1.
Autocatalytic Reactions: Glycerol conversion.
Table A1.
Autocatalytic Reactions: Glycerol conversion.
| Reagents Molar Ratio HAc/Gly | X (%) (5 h) | X (%) (24 h) |
|---|---|---|
| 3/1 | 84.6 | 91.2 |
| 6/1 | 91.0 | 95.5 |
| 12/1 | 98.7 | 100.0 |
Table A2.
Autocatalytic Reactions: DAG and TAG selectivity.
Table A2.
Autocatalytic Reactions: DAG and TAG selectivity.
| Reagents Molar Ratio HAc/Gly | X: 10 % | X: 80 % | Final | ||
|---|---|---|---|---|---|
| Time (min) * | SDAG + STAG (%) | Time (min) * | STAG + SDAG (%) | SDAG + STAG (%) | |
| 3/1 | 13 | 4.0 [0] | 240 | 39.3 [3.45] | 61.3 [10.8] |
| 6/1 | 10 | 6.0 [0] | 240 | 39.6 [5.10] | 78.8 [24.1] |
| 12/1 | 4 | 4.0 [0] | 120 | 45.6 [4.76] | 92.3 [45.9] |
* Time (in minutes) to get this glycerol conversion. [ ] TAG selectivity.
Table A3.
TOF and Selectivity. HAc/Gly molar ratio 6/1.
Table A3.
TOF and Selectivity. HAc/Gly molar ratio 6/1.
| TOF (h−1) (t = 30 min) | X (%) (t = 30 min) | X (%) (t = 24 h) | STAG (%) (t = 24 h) | SDAG + STAG (%) (t = 24 h) | |
|---|---|---|---|---|---|
| A15 | 120.5 | 52.00 | 100 | 29.42 | 82.50 |
| CBV720 | 113.3 | 48.70 | 98.50 | 27.71 | 80.90 |
| PTSA | 231.5 | 98.30 | 100 | 31.62 | 84.90 |

Figure A1.
TEM images of CBV300 (A) and CBV720 (B). SEM image of A15 (C).
Figure A1.
TEM images of CBV300 (A) and CBV720 (B). SEM image of A15 (C).

Figure A2 summarizes the EDX results for the zeolites before and after being used in reaction. Figure A2a presents the micrograph of fresh CBV300 with its corresponding mapping of Si and Al, as well as the atomic percentage in zone 1. From these values, we were able to quantify a Si/Al molar ratio of 2.55, which is similar to the theoretical value.
Figure A2b–d correspond to the CBV300 zeolite after reaction. In Figure A2b, a mapping of six zones (spectra 17 to 22) was performed, and the results from zones 19 and 20 are shown, while Figure A2c presents the result calculated by summing all six zones. In this case, the average Si/Al ratio is 2.83, indicating a slight decrease in the proportion of aluminum. Figure A2d shows the analysis in zone 35 on the surface of the same particle. In this instance, the atomic percentages vary, with the Si/Al molar ratio being higher in the spectrum (Si/Al = 0.7).
Figure A2e shows the EDX results for fresh CBV720, and Figure A2f,g show those for the used sample. In this case, no zones with variability in the Si/Al ratio were found. All the zones analyzed allowed us to calculate a Si/Al molar ratio of approximately 20.


Figure A2.
TEM images, accompanied by the EDX maps of Si and Al and spectra of selected regions for fresh CBV300 (a), used CBV300 (b–d), fresh CBV720 (e) and used CBV720 (f–g).
Figure A2.
TEM images, accompanied by the EDX maps of Si and Al and spectra of selected regions for fresh CBV300 (a), used CBV300 (b–d), fresh CBV720 (e) and used CBV720 (f–g).


Figure A3.
Glycerol conversion (A) and selectivity towards MAG (B), DAG (C) and TAG (D) over time for HAc/Gly molar ratio = 3/1 (■); 6/1 (▲) and 12/1 (●).
Figure A3.
Glycerol conversion (A) and selectivity towards MAG (B), DAG (C) and TAG (D) over time for HAc/Gly molar ratio = 3/1 (■); 6/1 (▲) and 12/1 (●).


Figure A4.
Glycerol conversion (A) and selectivity towards MAG (B), DAG (C) and TAG (D) over time for an autocatalytic run (▲) and catalyzed by CBV300 (◆), CBV720 (●) and Amberlite (■), under an equal mass load of 2 g catalyst (100 g Gly)−1. HAc/Gly molar ratio: 6/1.
Figure A4.
Glycerol conversion (A) and selectivity towards MAG (B), DAG (C) and TAG (D) over time for an autocatalytic run (▲) and catalyzed by CBV300 (◆), CBV720 (●) and Amberlite (■), under an equal mass load of 2 g catalyst (100 g Gly)−1. HAc/Gly molar ratio: 6/1.

Appendix B
Appendix B.1. Textural Properties—Procedure Details
Approximately 100 mg of sample was used, which was previously degassed (5 × 10⁻⁵ bar) at 523 K for 8 h (CVB720, CBV100 and CVB300) or at 353 K for 12 h (A15). Adsorption data was analyzed using the software QuadraWinTM (version 6.0) of Quantachrome Instruments. Cumulative pore volumes were calculated using the DFT method (NL-DFT adsorption branch model). The total pore volume was obtained at the plateau of the cumulative adsorption pore volume plot at a relative pressure (P/P°) of 0.95. Micropore volume was determined as the volume adsorbed at pore sizes < 2 nm, and mesopore volume was calculated by subtracting the micropore volume from the total pore volume [45]. The zeolites after reaction were carefully calcined at 823 K for 5 h, before their adsorption-desorption analyses.
Appendix B.2. Pyridine-TPD and FTIR Procedure Details
Appendix B.2.1. Temperature-Programmed Desorption (TPD) Measurements
To evaluate both the quantity and strength of acid sites in the solids, pyridine temperature-programmed desorption (TPD) measurements were employed. For each run, approximately 10 mg of catalyst was placed between quartz wool inside a quartz tube. The catalysts underwent in situ pretreatment with a nitrogen flow (30 mL min−1) at 623 K for one hour. After cooling to room temperature, three consecutive saturation steps were conducted using pure pyridine. Subsequently, a pure nitrogen stream was introduced, and the temperature was raised to 423 K, holding for one hour to remove physically adsorbed pyridine.
The TPD experiment, performed at INCAPE-CONICET, consisted of heating the sample at a rate of 12 K min−1 in nitrogen flow from 423 to 1023 K. Pyridine released from the sample cell was directed through a methanation reactor, where a hydrogen stream and a nickel catalyst quantitatively converted pyridine to methane (CH4). The resulting methane was continuously detected by an FID detector. A similar procedure was applied using the bulkier base collidine (2,4,6-trimethylpyridine) to quantify the accessibility of acid sites in the various solids.
Appendix B.2.2. FTIR Measurements
To distinguish the nature of acid sites present in the samples, FTIR spectra were measured following saturation with pyridine. Brønsted and Lewis acid sites were identified via adsorption bands at approximately 1545 cm−1 and 1450 cm−1, respectively. All spectral measurements were performed on a Shimadzu Prestige 21 spectrometer, acquiring data in the 4000–1000 cm−1 range at a resolution of 4 cm−1.
Each sample was prepared as a self-supporting wafer (30 mg, 16 mm diameter) and placed in a thermostated cell equipped with CaF2 windows, connected to a vacuum line. The samples were evacuated for eight hours at 673 K, after which the background spectrum was taken at room temperature. Pyridine vapors (Sintorgan, 99% purity) were then introduced, saturating the system to 46 mmHg at room temperature. IR spectra for each sample were recorded after pyridine desorption, achieved by evacuation for one hour at 423, 573, and 673 K. For each condition, spectra were collected at room temperature both before pyridine adsorption and after desorption. The final IR spectrum was obtained by subtracting the two spectra. For collidine adsorption, spectra were measured only after desorption at 423 K.
References
- Khan, H.M.; Ali, C.; Iqbal, T.; Yasin, S.; Sulaiman, M.; Mahmood, H.; Raashid, M.; Pasha, M.; Mu, B. Current scenario and potential of biodiesel production from waste cooking oil in Pakistan: An overview. Chin. J. Chem. Eng. 2019, 27, 2238–2250. [Google Scholar] [CrossRef]
- Bozbas, K. Biodiesel as an alternative motor fuel: Production and policies in the European Union. Renew. Sust. Energ. Rev. 2008, 12, 542–552. [Google Scholar] [CrossRef]
- Zhou, H.; Beltramini, J.N.; Fan, Y.X.; Lu, G.Q. Chemoselective catalytic conversion of glycerol as a biorenewable source to valuable commodity chemicals. Chem. Soc. Rev. 2008, 37, 527–549. [Google Scholar] [CrossRef]
- Nomanbhay, S.; Hussein, R.; Ong, M.Y. Sustainability of biodiesel production in Malaysia by production of bio-oil from crude glycerol using microwave pyrolysis: A review. Green Chem. Lett. Rev. 2018, 11, 135–157. [Google Scholar] [CrossRef]
- Bansod, Y.; Ghasemzadeh, K.; D’Agostino, C. Techno-economic assessment of biodiesel-derived crude glycerol purification processes. RSC Sustain. 2025, 3, 2605–2618. [Google Scholar] [CrossRef]
- Kenkel, P.; Holcomb, R. Feasibility of On-Farm or Small Scale Oilseed Processing and Biodiesel Production in Integration of Agricultural and Energy Systems. In Proceedings of the Farm Foundation Conference, Oak Brook, IL, USA, 12–13 February 2008. [Google Scholar]
- Rahmat, N.; Abdullah, A.Z.; Mohamed, A.R. Recent progress on innovative and potential technologies for glycerol transformation into fuel additives: A critical review. Renew. Sust. Energ. Rev. 2010, 14, 987–1000. [Google Scholar] [CrossRef]
- Bagheri, S.; Julkapli, N.; Dabdawb, W.; Mansouri, N. Biodiesel -Derived Raw Glycerol to Value-Added Products: Catalytic Conversion Approach. In Handbook of Composites from Renewable Materials, 1st ed.; Thakur, V.K., Thakur, M.K., Kessler, M.R., Eds.; John Wiley and Sons: Hoboken, NJ, USA, 2017; Volume 3, pp. 309–365. [Google Scholar] [CrossRef]
- Garcia, E.; Laca, M.; Perez, E.; Garrido, A.; Peinado, J. New class of acetal derived from glycerin as a biodiesel fuel component. Energy Fuels 2008, 22, 4274–4280. [Google Scholar] [CrossRef]
- EN 14214; Automotive Fuels - Fatty acid Methyl Esters (FAME) for Diesel Engines - Requirements and Test Methods. European Committee for Standardization (CEN): Brussels, Belgium, 2019.
- ASTM D6751; Standard Specification for Biodiesel Fuel Blend Stock (B100) for Middle Distillate Fuels. American Society for Testing and Materials (ASTM): West Conshohocken, PA, USA, 2001.
- Mukhopadhyay, P.; Chakraborty, R.; Singh, S. Triacetin additive in biodiesel to reduce air pollution: A review. Environ. Chem. Lett. 2022, 20, 1193–1224. [Google Scholar] [CrossRef]
- Konwar, L.J.; Mäki-Arvela, P.; Begum, P.; Kumar, N.; Thakur, A.J.; Mikkola, J.-P.; Deka, R.C.; Deka, D. Shape selectivity and acidity effects in glycerol acetylation with acetic anhydride: Selective synthesis of triacetin over Y-zeolite and sulfonated mesoporous carbons. J. Catal. 2015, 329, 237–247. [Google Scholar] [CrossRef]
- Okoye, P.; Abdullah, A.; Hameed, B. A review on recent developments and progress in the kinetics and deactivation of catalytic acetylation of glycerol—A byproduct of biodiesel. Renew. Sust. Energ. Rev. 2017, 74, 387–401. [Google Scholar] [CrossRef]
- Mufrodi, Z.; Rochmadi, S.; Budiman, A. Chemical Kinetics for Synthesis of Triacetin from Biodiesel Byproduct. Int. J. Chem. 2012, 4, 101. [Google Scholar] [CrossRef]
- Khramov, M. Process for Production and Purification of Triacetin. US Patent 5777157, 7 July 1998. [Google Scholar]
- Melero, J.; van Grieken, R.; Morales, G.; Paniagua, M. Acidic Mesoporous Silica for the Acetylation of Glycerol: Synthesis of Bioadditives to Petrol Fuel. Energy Fuels 2007, 21, 1782–1791. [Google Scholar] [CrossRef]
- Liao, X.; Zhu, Y.; Wang, S.-G.; Li, Y. Producing triacetylglycerol with glycerol by two steps: Esterification and acetylation. Fuel Process. Technol. 2009, 90, 988–993. [Google Scholar] [CrossRef]
- De Canck, E.; Dosuna-Rodríguez, I.; Gaigneaux, E.M.; Van Der Voort, P. Periodic Mesoporous Organosilica Functionalized with Sulfonic Acid Groups as Acid Catalyst for Glycerol Acetylation. Materials 2013, 6, 3556–3570. [Google Scholar] [CrossRef]
- Ghoreishi, K.; Asim, N.; Yarmo, M.; Samsudin, M. Mesoporous phosphated and sulphated silica as solid acid catalysts for glycerol acetylation. Chem. Pap. 2014, 68, 1194–1204. [Google Scholar] [CrossRef]
- Chamack, M.; Mahjoub, A.; Akbari, A. Zirconium-modified mesoporous silica as an efficient catalyst for the production of fuel additives from glycerol. Catal. Commun. 2018, 110, 1–4. [Google Scholar] [CrossRef]
- Khayoon, M.S.; Hameed, B.H. Acetylation of glycerol to biofuel additives over sulfated activated carbon catalyst. Bioresour. Technol. 2011, 102, 9229–9235. [Google Scholar] [CrossRef]
- Ferreira, P.; Fonseca, I.M.; Ramos, A.M.; Vital, J.; Castanheiro, J.E. Esterification of glycerol with acetic acid over dodecamolybdophosphoric acid encaged in USY zeolite. Catal. Commun. 2009, 10, 481–484. [Google Scholar] [CrossRef]
- Ferreira, P.; Fonseca, I.M.; Ramos, A.M.; Vital, J.; Castanheiro, J.E. Acetylation of glycerol over heteropolyacids supported on activated carbon. Catal. Commun. 2011, 12, 573–576. [Google Scholar] [CrossRef]
- Malaika, A.; Kozłowski, M. Glycerol conversion towards valuable fuel blending compounds with the assistance of SO3H-functionalized carbon xerogels and spheres. Fuel Process. Technol. 2019, 184, 19–26. [Google Scholar] [CrossRef]
- Kong, P.S.; Aroua, M.; Daud, W.; Lee, H.; Cognet, P.; Pérès, Y. Catalytic role of solid acid catalysts in glycerol acetylation for the production of bio-additives: A review. RSC Adv. 2016, 6, 68885–68905. [Google Scholar] [CrossRef]
- Zhou, L.; Al-Zaini, E.; Adesina, A. Catalytic characteristics and parameters optimization of the glycerol acetylation over solid acid catalysts. Fuel 2013, 103, 617–625. [Google Scholar] [CrossRef]
- Bedogni, G.; Acevedo, M.; Aguzín, F.; Okulik, N.; Padró, C. Synthesis of bioadditives of fuels from biodiesel-derived glycerol by esterification with acetic acid on solid catalysts. Environ. Technol. 2018, 39, 1955–1966. [Google Scholar] [CrossRef]
- Almas, Q.; Sievers, C.; Jones, C. Role of the mesopore generation method in structure, activity and stability of MFI catalysts in glycerol acetylation. Appl. Catal. A-Gen. 2019, 571, 107–117. [Google Scholar] [CrossRef]
- Dalla Costa, B.; Decolatti, H.; Legnoverde, S.; Querini, C. Influence of acidic properties of different solid acid catalysts for glycerol acetylation. Catal. Today 2017, 289, 222–230. [Google Scholar] [CrossRef]
- Goncalves, V.L.C.; Pinto, B.P.; Silva, J.C.; Mota, C.J.A. Acetylation of glycerol catalyzed by different solid acids. Catal. Today 2008, 133–135, 673–677. [Google Scholar] [CrossRef]
- Gomes, G.C.; Zalazar, M.F.; Arroyo, P.A. New Insights into the Effect of the Zeolites Framework Topology on the Esterification Reactions: A Comparative Study from Experiments and Theoretical Calculations. Top. Catal. 2022, 65, 871–886. [Google Scholar] [CrossRef]
- Shen, H.; Zhou, Y.; Wen, G.; Xu, L.; Ding, Q.; Guan, Y.; Yang, Z.; Sun, Y.; Gao, X.; Zhang, J.; et al. Cs exchanged 12-tungstophosphoric acid supported on high-silica mesoporous Y zeolites for synthesis of ethyl lactate via catalytic esterification. Biomass Bioenerg. 2022, 165, 106552. [Google Scholar] [CrossRef]
- Chaowamalee, S.; Yan, N.; Ngamcharussrivichai, C. Propylsulfonic Acid-Functionalized Mesostructured Natural Rubber/Silica Nanocomposites as Promising Hydrophobic Solid Catalysts for Alkyl Levulinate Synthesis. Nanomaterials 2022, 12, 604. [Google Scholar] [CrossRef]
- Gautam, P.; Barman, S.; Ali, A. Catalytic Synthesis of Energy-rich Fuel Additive Levulinate Esters from Levulinic Acid using Modified Ultra-stable Zeolite Y. Chem. Eur. 2022, 7, e202203044. [Google Scholar] [CrossRef]
- Zhang, R.; Xu, S.; Raja, D.; Binti Khusni, N.; Liub, J.; Zhang, J.; Abdulridha, S.; Xiang, H.; Jianga, S.; Guan, Y.; et al. On the effect of mesoporosity of FAU Y zeolites in the liquid-phase catalysis. Micropor. Mesopor. Mat. 2019, 278, 297–306. [Google Scholar] [CrossRef]
- Dal Pozzo, D.M.; Azevedo dos Santos, J.A.; Seabra Junior, E.; Ferreira Santos, R.; Feiden, A.; Melegari de Souza, S.N.; Burgardta, I. Free fatty acids esterification catalyzed by acid Faujasite type zeolite. RSC Adv. 2019, 9, 4900–4907. [Google Scholar] [CrossRef]
- Prinsen, P.; Luque, R.; González-Arellano, C. Zeolite catalyzed palmitic acid esterification. Micropor. Mesopor. Mat. 2018, 262, 133–139. [Google Scholar] [CrossRef]
- Freitas, E.F.; Araújo, A.A.L.; Paiva, M.F.; Dias, S.C.L.; Dias, J.A. Comparative acidity of BEA and Y zeolite composites with 12-tungstophosphoric and 12-tungstosilicic acids. Mol. Catal. 2018, 458, 152–160. [Google Scholar] [CrossRef]
- Baroi, C.; Mahto, S.; Niu, C.; Dalai, A.K. Biofuel production from green seed canola oil using zeolites. App. Catal. A-Gen. 2014, 469, 18–32. [Google Scholar] [CrossRef]
- Jiang, Y.; Zhou, R.; Ye, B.; Hou, Z. Acetalization of glycerol over sulfated UiO-66 under mild condition. J. Ind. Eng. Chem. 2022, 110, 357–366. [Google Scholar] [CrossRef]
- Tonutti, L.G.; Decolatti, H.P.; Querini, C.A.; Dalla Costa, B.O. Hierarchical H-ZSM-5 zeolite and sulfonic SBA-15: The properties of acidic H and behavior in acetylation and alkylation reactions. Micropor. Mesopor. Mat. 2020, 305, 110284. [Google Scholar] [CrossRef]
- Tonutti, L.G.; Vergara, L.; Querini, C.A.; Dalla Costa, B.O. On the Location and Accessibility of Active Acid Sites in MFI Zeolites Modified by Alkaline Treatment. Processes 2024, 12, 2567. [Google Scholar] [CrossRef]
- Tonutti, L.G.; Dalla Costa, B.O.; Decolatti, H.P.; Mendow, G.; Querini, C.A. Determination of kinetic constants for glycerol acetylation by particle swarm optimization algorithm. Chem. Eng. J. 2021, 424, 130408. [Google Scholar] [CrossRef]
- Sing, K.S.W.; Everett, D.H.; Haul, R.A.W.; Moscou, L.; Pierotti, R.A.; Rouquerol, J.; Siemieniewska, T. Reporting physisorption data for gas/solid systems with special reference to the determination of surface area and porosity (Recommendations 1984). Pure Appl. Chem. 1985, 57, 603–619. [Google Scholar] [CrossRef]
- Rac, V.; Rakic, V.; Miladinovic, Z.; Stosic, D.; Auroux, A. Influence of the desilication process on the acidity of HZSM-5 zeolite. Thermochim. Acta 2013, 567, 73–78. [Google Scholar] [CrossRef]
- Sachse, A.; Grau-Atienza, A.; Jardim, E.O.; Linares, N.; Thommes, M.; García-Martínez, J. Development of Intracrystalline Mesoporosity in Zeolites through Surfactant-Templating. Cryst. Growth Des. 2017, 17, 4289–4305. [Google Scholar] [CrossRef]
- Baerlocher, C.; McCusker, L.B.; Gies, H.; Marler, B. Database of Zeolite Structures. Available online: https://www.iza-structure.org/databases/ (accessed on 22 September 2025).
- Anderson, M.W.; Klinowski, J. Zeolites treated with silicon tetrachloride vapour. IV. Acidity. Zeolites 1986, 6, 455–466. [Google Scholar] [CrossRef]
- Montanari, T.; Finocchio, E.; Busca, G. Infrared Spectroscopy of Heterogeneous Catalysts: Acidity and Accessibility of Acid Sites of Faujasite-Type Solid Acids. J. Phys. Chem. C 2011, 115, 937–943. [Google Scholar] [CrossRef]
- Daniell, W.; Topsøe, N.-Y.; Knözinger, H. An FTIR Study of the Surface Acidity of USY Zeolites: Comparison of CO, CD3CN, and C5H5N Probe Molecules. Langmuir 2001, 17, 6233–6239. [Google Scholar] [CrossRef]
- Nesterenko, N.S.; Thibault-Starzyk, F.; Montouilliout, V.; Yushchenko, V.V.; Fernandez, C.; Gilson, J.-P.; Fajula, F.; Ivanova, I.I. The use of the consecutive adsorption of pyridine bases and carbon monoxide in the IR spectroscopic study of the accessibility of acid sites in microporous/mesoporous materials. Kinet. Catal. 2006, 47, 40–48. [Google Scholar] [CrossRef]
- Castellà-Ventura, M.; Akacem, Y.; Kassab, E. Vibrational Analysis of Pyridine Adsorption on the Brønsted Acid Sites of Zeolites Based on Density Functional Cluster Calculations. J. Phys. Chem C. 2008, 112, 19045–19054. [Google Scholar] [CrossRef]
- Busca, G. Spectroscopic characterization of the acid properties of metal oxide catalysts. Catal. Today 1998, 41, 191–206. [Google Scholar] [CrossRef]
- Kassab, E.; Castellà-Ventura, M. Theoretical Study of Pyridine and 4,4‘-Bipyridine Adsorption on the Lewis Acid Sites of Alumina Surfaces Based on Ab Initio and Density Functional Cluster Calculations. J. Phys. Chem. B 2005, 109, 13716–13728. [Google Scholar] [CrossRef]
- Yasuda, H.; Sato, T.; Yoshimura, Y. Influence of the acidity of USY zeolite on the sulfur tolerance of Pd–Pt catalysts for aromatic hydrogenation. Catal. Today 1999, 50, 63–71. [Google Scholar] [CrossRef]
- Arribas, M.A.; Martinez, A. The influence of zeolite acidity for the coupled hydrogenation and ring opening of 1-methylnaphthalene on Pt/USY catalysts. Appl. Catal. A-Gen. 2002, 230, 203–217. [Google Scholar] [CrossRef]
- Jiang, Y.; Li, X.; Zhao, H.; Hou, Z. Esterification of glycerol with acetic acid over SO3H-functionalized phenolic resin. Fuel 2019, 255, 115842. [Google Scholar] [CrossRef]
- Reddy, P.S.; Sudarsanam, P.; Raju, G.; Reddy, B.M. Selective acetylation of glycerol over CeO2–M and SO42−/CeO2–M (M = ZrO2 and Al2O3) catalysts for synthesis of bioadditives. J. Ind. Eng. Chem. 2012, 18, 648–654. [Google Scholar] [CrossRef]
- Kale, S.; Umbarkar, S.B.; Dongare, M.K.; Eckelt, R.; Armbruster, U.; Martin, A. Selective formation of triacetin by glycerol acetylation using acidic ion-exchange resins as catalyst and toluene as an entrainer. Appl. Catal. A-Gen. 2015, 490, 10–16. [Google Scholar] [CrossRef]
- Vieira Grossi, C.; de Oliveira Jardim, E.; de Araújo, M.H.; Montero Lago, R.; da Silva, M. Sulfonated polystyrene: A catalyst with acid and superabsorbent properties for the esterification of fatty acids. Fuel 2010, 89, 257–259. [Google Scholar] [CrossRef]


Disclaimer/Publisher’s Note: The statements, opinions and data contained in all publications are solely those of the individual author(s) and contributor(s) and not of MDPI and/or the editor(s). MDPI and/or the editor(s) disclaim responsibility for any injury to people or property resulting from any ideas, methods, instructions or products referred to in the content. |
© 2025 by the authors. Licensee MDPI, Basel, Switzerland. This article is an open access article distributed under the terms and conditions of the Creative Commons Attribution (CC BY) license (https://creativecommons.org/licenses/by/4.0/).