Abstract
Predicting carbon emissions is important in various sectors, including environmental management, economic planning, and energy policy. Traditional forecasting models typically require extensive training data to achieve high accuracy. However, carbon emission data are usually available on an annual basis, which is insufficient for effectively training conventional forecasting models. To address this challenge, this paper introduces an innovative carbon emissions prediction model that integrates Fibonacci attenuation particle swarm optimization (FAPSO) with the gated recurrent unit (GRU). The FAPSO algorithm is used to optimize the hyperparameters of the GRU, thereby alleviating the decline in prediction accuracy that conventional recurrent neural networks often face when dealing with limited training data. To evaluate the effectiveness of the FAPSO-GRU model, we tested it using carbon emission data from Hainan Province. Compared to the conventional GRU model, the FAPSO-GRU model achieved a significant reduction in the mean absolute error (42.27%), root mean square error (42.38%), and mean absolute percentage error (43.06%). Furthermore, we validated the FAPSO-GRU model with real data from Beijing, Guangdong, Hubei, Hunan, and Shanghai. The experimental results convincingly demonstrate that the proposed model provides a highly accurate solution for carbon emission prediction tasks, effectively addressing the limitations posed by limited training data.
1. Introduction
The need to reduce carbon emissions has become of utmost importance due to the growing global climate change crisis, primarily driven by the increase in carbon emissions as mentioned in [1]. This presents significant challenges in attempting to limit emissions and maintain a stable economic growth trajectory. Carbon emissions have far-reaching impacts on both the environment and the economy. Ecologically, they play a central role in driving global climate changes by releasing large amounts of carbon dioxide and other greenhouse gases, ultimately leading to a rise in the Earth’s average temperature, as discussed in [2]. Consequently, this sets off a chain of environmental issues, including higher sea levels, increased occurrences of extreme weather events, and disruptions to ecosystems, all of which have adverse effects on biodiversity, ecosystem functionality, and human society.
On the flip side, efforts to reduce carbon emissions have significant economic implications. Firstly, climate change affects critical natural resources like agriculture, fisheries, and forestry, which in turn has cascading effects on food production, supply chains, healthcare costs, and labor productivity. Secondly, the increase in natural disasters and extreme weather events leads to losses and damages that harm infrastructure, homes, and property, thereby negatively impacting the economy.
Moreover, the shift toward a low-carbon economic model requires investments in clean energy, sustainable technologies, and improvements in carbon emission efficiency, as discussed in [3]. This transition not only drives technological advancements but also stimulates green innovation and necessitates changes in energy consumption patterns. These changes create new job opportunities and contribute to economic growth.
The pursuit of sustainable development increasingly relies on the adoption of green technologies, as highlighted in [4]. Predicted global energy demands are set to rise significantly, especially in developing economies. However, it is crucial to note that unless we embrace eco-friendly technologies, meeting this energy demand through conventional sources will come at the cost of worsening emissions, as discussed in [5].
In summary, carbon emissions have a profound impact on both the environment and the economy. Therefore, reducing carbon emissions is a paramount initiative that not only safeguards ecosystems but also promotes sustainable economic growth. Shifting toward a low-carbon economy and adopting sustainable development models provide a promising path to align the objectives of economic expansion and ecological preservation.
China, as one of the world’s largest energy consumers and carbon emitters, as mentioned in [6], has the formidable task of curbing carbon emissions. The Chinese government’s pledge to achieve carbon neutrality by 2060 has sparked intense global discussions, underscoring China’s role as a responsible key player in global climate governance, as highlighted in [7]. Given this context, conducting scenario projections for carbon emissions carries substantial significance. These projections provide valuable insights into future trends and the potential consequences of carbon emissions, thereby aiding in the development of effective policies and informed decision-making.
Current research on carbon emission projections encompasses a wide range of areas, including policy development and planning, resource allocation, investment decisions, corporate strategy, risk management, international collaboration, and responses to climate change.
In the context of policy formulation and planning, carbon emission forecasts provide essential data to governments and organizations, assisting in the evaluation of current emission levels and the establishment of reduction targets and policy measures, as discussed in [8]. These insights enable policymakers to develop long-term emission reduction strategies, which may involve initiatives such as transitioning to cleaner energy sources, implementing carbon pricing strategies [9], and introducing emission reduction measures [10].
Furthermore, research like that presented in [11] delves into the impact of carbon taxes on China’s efforts to reduce emissions. These studies suggest policy approaches such as combining carbon tax collection with carbon trading, implementing dynamic adjustment mechanisms, maintaining tax neutrality, and actively promoting carbon reduction initiatives.
In the realm of resource allocation and investment decisions, carbon emission projections play a crucial role in identifying industries and sectors that are likely to experience fluctuations in carbon emissions. This information guides the allocation of resources and investment choices. Investors can assess both risks and opportunities across various industries, aligning their investments with the transition towards a low-carbon economy.
Moreover, carbon emission projections hold significant value for businesses, particularly in terms of corporate strategy and risk management. Companies can use these forecasts to evaluate the carbon footprint of their business models and products, as discussed in [12]. This information helps in formulating strategies and setting sustainability goals aimed at reducing emissions [13]. Additionally, understanding future trends in carbon emissions equips companies to navigate the carbon market more effectively, including associated risks, as mentioned in [14], thereby mitigating any adverse impacts.
On the international stage, carbon emission projections play a pivotal role in the context of global cooperation and responses to climate change. These projections enable countries to evaluate the overall trajectory of global carbon emissions and develop policy frameworks for international collaboration in climate action. Additionally, carbon emission projections facilitate the monitoring and assessment of emissions and carbon sinks, thereby advancing global emission reduction targets.
For example, in [15], the SGM(1,1,m) model was utilized to forecast carbon emissions for 30 Chinese provinces from 2020 to 2025, using provincial carbon emission data. Meanwhile, ref. [16] examined the carbon emission and carbon sink performance of marine fisheries.
In conclusion, carbon emission projections are of paramount importance for governments, organizations, businesses, and the international community. They serve as a fundamental tool for decision-making and planning, allowing us to effectively address the challenges of climate change, promote sustainable development, and move closer to achieving a low-carbon economy.
Forecasting future carbon emissions is a complex macro-level undertaking that revolves around scenarios and models. Various tools and methodologies are commonly employed for this purpose, including greenhouse gas inventories, modeling, scenario analysis, energy system models, climate–economic models, and data-driven models.
Long short-term memory (LSTM) networks are highly effective for time series prediction due to their ability to capture long-term dependencies and handle sequential data, making them applicable across diverse domains such as finance and meteorology. Nevertheless, their inherent complexity, computational demands, and tendency to overfit, particularly when data are limited, present significant challenges. The gated recurrent unit (GRU) [17] model was chosen to solve the carbon emission prediction problem due to its capability to effectively handle sequential and time-series data. Carbon emission data often exhibit temporal dependencies and patterns that need to be captured for accurate forecasting. GRUs, types of recurrent neural networks (RNNs), are specifically designed to retain and process information over long sequences, making them well-suited for this task.
Modeling and scenario analysis are widely used methods that use mathematical and statistical techniques to predict future emissions under different assumptions and scenarios. These models consider factors like economic growth, energy demand, technological advancements, and policy measures. For instance, in [18], the SSA-LSTM algorithm was employed to create carbon emission regression prediction models for coal-fired power plants. However, these models rely on assumptions and simplified frameworks that may not fully account for uncertainties, and their accuracy depends on data quality and adaptability to real-world conditions.
Energy system models analyze the relationship between energy supply, demand, transition, and carbon emissions. They simulate various energy sources and predict their impact on emissions by varying parameters and assumptions. For example, in [19], the ROGM-AFSA-GVM model was introduced to predict the carbon emissions transfer network resulting from the exchange of intermediate products between industries. However, these models often rely on assumptions and may not fully capture complex markets and technological dynamics. Additionally, they require substantial data and expertise.
Climate–economic models combine climate change and economic growth, forecasting the effects of economic activities and emission reduction policies on both emissions and the economy. Common models include DICE and PAGE. For instance, in [20], the relationship between the digital economy and carbon emissions was analyzed, highlighting the impact of the digital economy on emissions. These models are valuable for evaluating the cost-effectiveness of emission reduction policies but have limitations due to their assumptions and simplified economic behavior models. Their accuracy depends on data quality and reliability.
Data-driven models, which are becoming increasingly important in carbon emission forecasting, leverage historical and real-time data with machine learning and data analytics techniques. They consider factors such as economic indicators, energy consumption, and population growth. For example, in [1], carbon emission trends were predicted based on carbon emission data and neural network models. Data-driven models excel in handling complex nonlinear relationships and trends but rely heavily on data quality and proper data handling and selection. Handling long-term projections and uncertainties can be challenging.
Particle swam optimization (PSO) [21] is a powerful method for the parameter training of artificial intelligence models. To enhance the optimization ability, Guo [22] combined the twining bare bones strategy with standard PSO. In 2023, Guo [23] proposed a cross-memory feature for PSO. Also, naturally inspired methods such as hermit crab optimization [24] demonstrate outstanding performance in single-objective optimization problems.
The primary objective of this article is to address the challenge of predicting carbon emissions using limited annual data and to overcome the difficulties faced by traditional algorithms under these circumstances. Traditional forecasting models typically require extensive training data to achieve high accuracy, but carbon emission datasets are usually sparse and inadequate for this purpose. Moreover, conventional algorithms often exhibit poor prediction accuracy when dealing with insufficient data. To tackle these issues, a novel prediction model that integrates Fibonacci attenuation particle swarm optimization (FAPSO) with the gated recurrent unit (GRU) is proposed. This model leverages the FAPSO algorithm to optimize the hyperparameters of the GRU, thereby enhancing prediction accuracy despite the limited data. Through this approach, a more accurate and efficient solution for carbon emission forecasting is provided, contributing to better-informed decision-making in environmental management, economic planning, and energy policy. The proposed model was rigorously tested using real-world carbon emission data from multiple provinces, demonstrating its effectiveness and significant potential to improve prediction performance compared to conventional methods. The main contributions of this work are listed below.
(1) A The Fibonacci attenuation method is proposed to enhance the exploratory capacity of the original PSO. The combination of FA and PSO endows the method with a stronger ability to escape from local optimality.
(2) The FAPSO is combined with the GRU model.
2. Materials and Methods
The Fibonacci attenuation particle swarm optimization gated recurrent unit (FAPSO-GRU) model is proposed in this section.
2.1. GRU Models
The gated recurrent unit (GRU) [17] is a recurrent neural network (RNN) architecture for processing and modeling sequential data, such as text, audio, and time series. It is an improved recurrent neural network architecture designed to solve the long-term dependency problem that exists in traditional RNNs while mitigating the gradient vanishing problem. A GRU consists of the following key components:
Hidden state (): Like a traditional RNN, a GRU maintains a hidden state vector at each time step (t) that encodes information from previous time steps. This hidden state is updated at each time step and serves as a memory of the network.
Update gate (): The update gate is responsible for determining how much of the previous hidden state should be retained and how much should be replaced with new information from the current input. It takes into account the current input and the previous hidden state and produces an update gate activation value between 0 and 1.
Reset gate (): The reset gate determines how much of the previous hidden state should be forgotten or reset based on the current input. It also considers the current input and the previous hidden state, producing a reset gate activation value between 0 and 1.
Candidate hidden state (): This is a candidate hidden state that is computed based on the current input and the reset gate. It represents the new information that can potentially replace part of the previous hidden state.
The computations in a GRU can be summarized with Equation (1).
where represents the input at time step t; , , and are weight matrices specific to each gate; and sigmoid and tanh are activation functions. The GRU’s ability to selectively update and reset its hidden state allows it to capture long-range dependencies in sequential data while mitigating some of the vanishing gradient problems associated with traditional RNNs. This makes GRUs a popular choice for various sequential data tasks in deep learning [17]. The general structure of the GRU is shown in Figure 1.
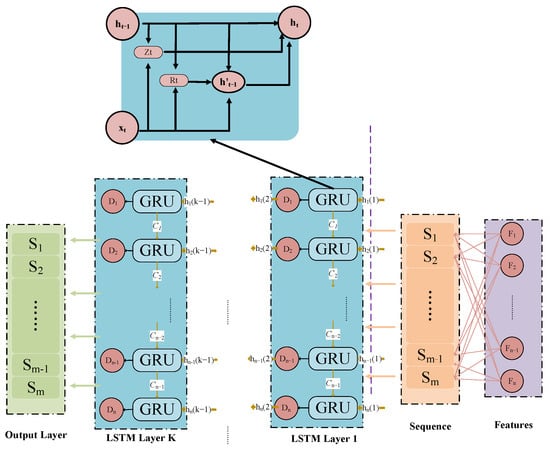
Figure 1.
The structure of GRU.
2.2. Fibonacci Attenuation Particle Swarm Optimization
PSO [21] operates by simulating the behavior of a swarm of particles in a multi-dimensional search space. Each particle represents a potential solution to the optimization problem. The primary idea behind PSO is that particles adjust their positions in the search space based on their own experience and the collective experience of the swarm. Particle swarm optimization (PSO) is a potent optimization algorithm, but like all techniques, it has its limitations and challenges. Here are some of these issues:
(1) Premature convergence: PSO can prematurely converge to suboptimal solutions, particularly in complex, multimodal optimization problems. This occurs when the swarm is trapped in local optima, struggling to break free.
(2) Limited global exploration: Despite its proficiency in exploiting promising areas of the search space, PSO may encounter difficulties in comprehensive global exploration. It may not effectively explore diverse solution regions in certain scenarios.
(3) Parameter sensitivity: PSO’s performance hinges on parameter settings, such as acceleration constants, inertia weight, and population size. Determining the appropriate parameter values can be challenging and problem-specific.
(4) Stagnation: Stagnation is a phenomenon where PSO particles converge towards similar positions and velocities, diminishing swarm diversity. This constrains the algorithm’s ability to explore new regions within the search space.
To solve these problems, a Fibonacci attenuation strategy is proposed for PSO. Different from the standard PSO, the next position of a particle is calculated by Equation (2).
where is the Fibonacci sequence, t is the number of iterations, is the position of the th particle in the tth iteration, v is the velocity of the th particle in the tth iteration, is the optimal position of the th particle after t iterations, is the global best position after t iterations, represents the oscillation coefficient of the tth evolution, and and are factors of learning. w is the weight of the velocity, and is a random number from 0 to 1.
2.3. The Process of FAPSO-GRU
In the FAPSO-GRU model, the input and output data are first normalized −1 to 1. Then, the appropriate FAPSO parameters are selected. When entering the FAPSO iteration, the position of each individual is trained as the GRU parameters. Once reaching the maximum number of iterations, the best solution is output. Finally, the best solution is trained as the GRU training parameter and outputs the result of the CO2 emission prediction. The flowchart of the DAPSO-LSTM is shown in Figure 2.
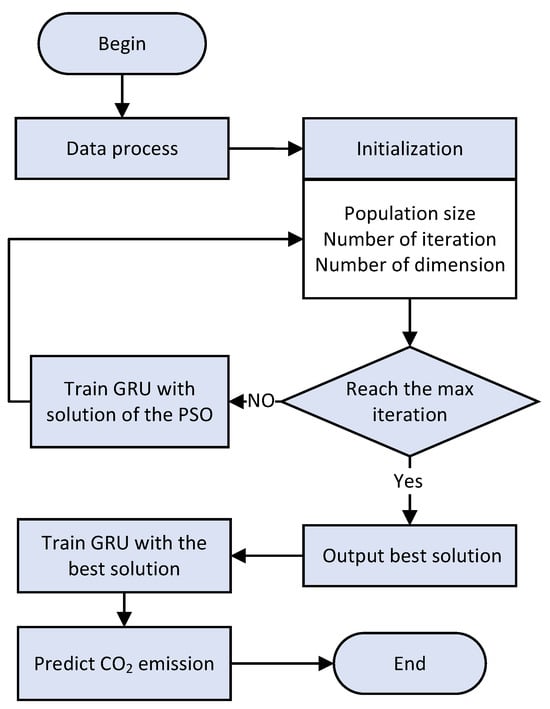
Figure 2.
The flowchart of FAPSO-GRU.
3. Experiments and Results
3.1. Data Preparation
After gaining a preliminary understanding, we identified that CO2 emissions are influenced by numerous factors, each varying in its impact strength. However, it is important to note that all these factors have some level of influence on CO2 emissions. Consequently, we specifically selected 20 factors from China’s Statistical Yearbook to forecast the total CO2 emissions in Hainan Province for the period spanning 1997 to 2019. The total CO2 emission data for Hainan Province were sourced from the China carbon accounting databases (CEADs). These 20 factors encompass Hainan’s gross domestic product (GDP), GDP per capita, GDP growth index, GDP growth index per capita, gross agricultural output value, gross forestry output value, gross fishery output value, gross animal husbandry output value, number of diesel engines used in agriculture and irrigation, number of large and medium-sized tractors, number of small-sized tractors, automobile production, power generation, hydroelectricity generation, electric power consumption, passenger transportation, resident population count, operational railroad mileage, highway route mileage, and national GDP.
To build the prediction model, we employed data from 1997 to 2015 as the training set, and data from 2016 to 2019 served as the test set to evaluate the model’s predictive performance.
3.2. FAPSO-GRU Results
To verify the performance of FAPSO-GRU in predicting the total CO2 emissions in Hainan Province, we selected GRU, LSTM, and PSO-GRU as the control group of the experiment. As PSO is an optimizer, some of the parameters of PSO-GRU and FAPSO-GRU were different from GRU with LSTM. However, to ensure the fairness of the experiment, we made sure that the parameters were equal except for the optimization object parameter. The specific details of the parameters are shown in Table 1. Population size represents the number of particles involved in the evolution process, and the number of iterations indicates the number of times the algorithm iterates. To intuitively demonstrate the error between the prediction results and the true values of FAPSO-GRU and the control group in the training and test sets, we show the training and testing results for each algorithm as shown in Figure 3.

Table 1.
Specific details of GRU, LSTM, PSO-LSTM, FAPSO-LSTM parameters.
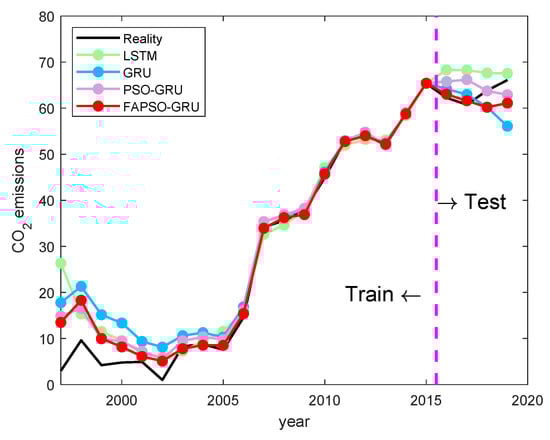
Figure 3.
The forecasting results of Hainan.
From Figure 3, it is clear that the GRU training results in the period from 1997 to 2006 are significantly different from the true values. As time progresses, the GRU results in the training set are significantly more accurate. The prediction results for 2016 and 2017 in the test set are not much different from the true values and have the same trend. However, the data for 2018 and 2019 exhibit a larger deviation from the truth.
The results of the FAPSO-GRU and the control group on the test set and the error from the true value are shown in Table 2. Among these, the FAPSO-GRU exhibits the smallest prediction errors in 2016 and 2017 (1.21% and 1.40%, respectively). It is not as good as some of the control group algorithms in terms of prediction errors for 2018 and 2019.
Table 2.
The results of the FAPSO-GRU and the control group on the test set and the error from reality.
For the further performance of FAPSO-GRU in predicting CO2 emissions in Hainan Province, three evaluations, including mean absolute error (MAE), root mean square error (RMSE), and mean absolute percentage error (MAPE) were used to calculate the statistical results of all the algorithms. The detailed calculations of these indicators are shown in Table 3, and the equations of MAE, RMSE, and MAPE are shown in Equation (3):
where n is the number of samples. and are the prediction value and reality value, respectively.
Table 3.
Statistical results for GRU, LSTM, PSO-GRU, and FAPSO-GRU in training and test sets.
From Table 3, FAPSO-GRU has better results than the control group, both on the training set and on the test set. In the test set, the RMSE values of FAPSO-GRU are 43.05%, 39.76%, and 12.82% better than GRU, LSTM, and PSO-LSTM, respectively.
3.3. FAPSO-GRU Results with Complex Data
To further evaluate the prediction performance of FAPSO-GRU, real data from Shanghai, Beijing, Guangdong, Hubei, and Hunan are used for validation tests. For Shanghai, Beijing, Guangdong, Hubei, and Hunan, data from 1997 to 2016 are used for training, and data from 2017 to 2021 are used for testing.
- In Shanghai, the test MAE for FAPSO-GRU is 3.5079, while the MAE for GRU is 17.3467.
- In Beijing, the test MAE for FAPSO-GRU is 2.6671, while the MAE for GRU is 9.9971.
- In Guangdong, the test MAE for FAPSO-GRU is 26.987, while the MAE for GRU is 108.838.
- In Hubei, the test MAE for FAPSO-GRU is 17.8247, while the MAE for GRU is 39.4897.
- In Hunan, the test MAE for FAPSO-GRU is 22.6347, while the MAE for GRU is 33.4465.
This comprehensive evaluation demonstrates the model’s adaptability and robustness across diverse geographical and climatic conditions, as well as its effectiveness in capturing long-term dependencies within time series data. Additionally, the inclusion of the particle swarm optimization enhances parameter optimization, ultimately improving the model’s predictive capabilities. In summary, a robust and adaptable solution for carbon emission prediction is provided, validated, and fine-tuned through multi-region assessments, contributing significantly to the field of environmental modeling.
Table 4.
Prediction results of Shanghai, Beijing, Guangdong, Hubei, and Hunan.
Table 5.
MAE, MAE, and RMSE results of Shanghai, Beijing, Guangdong, Hubei, and Hunan.
3.4. Validation and Discussion
The comparison between the predicted results and the actual values is illustrated in the figures. Specifically, the prediction results for Shanghai are shown in Figure 4; for Beijing, they are shown in Figure 5; for Guangdong, they are shown in Figure 6; for Hubei, they are shown in Figure 7; and for Hunan, they are shown in Figure 8. The prediction results obtained using the FAPSO-GRU method demonstrate a closer alignment with the actual values compared to those produced by other methods.
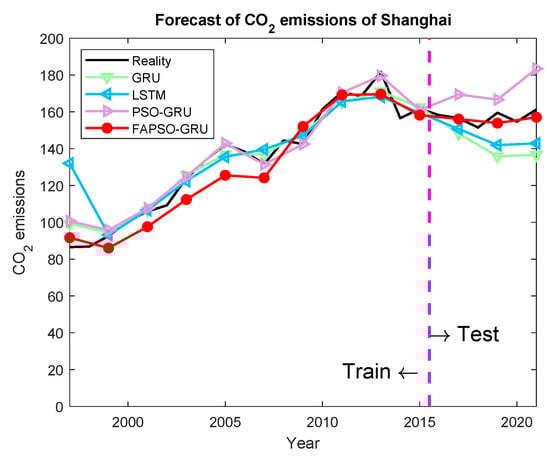
Figure 4.
The forecasting results of Shanghai.
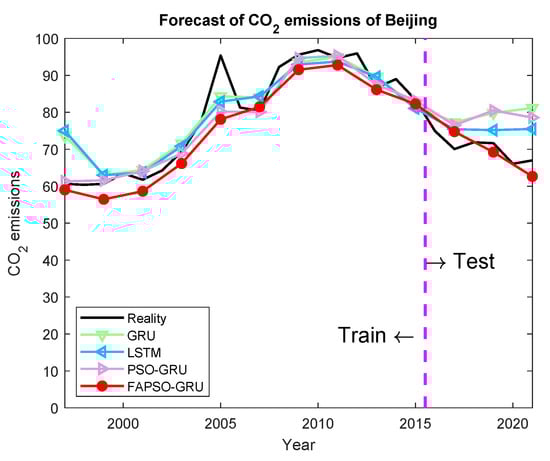
Figure 5.
The forecasting results of Beijing.
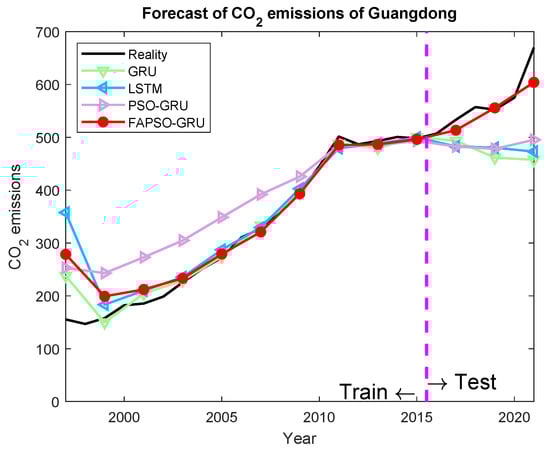
Figure 6.
The forecasting results of Guangdong.
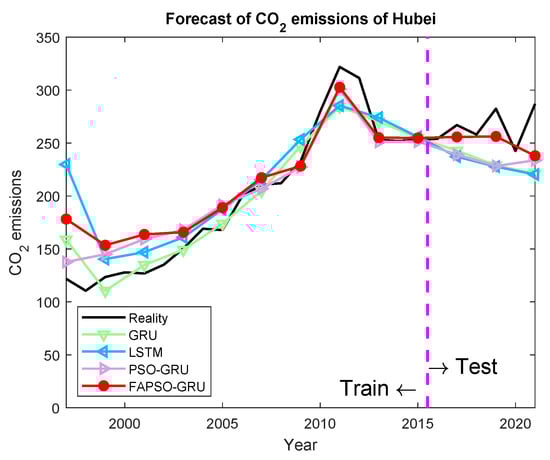
Figure 7.
The forecasting results of Hubei.
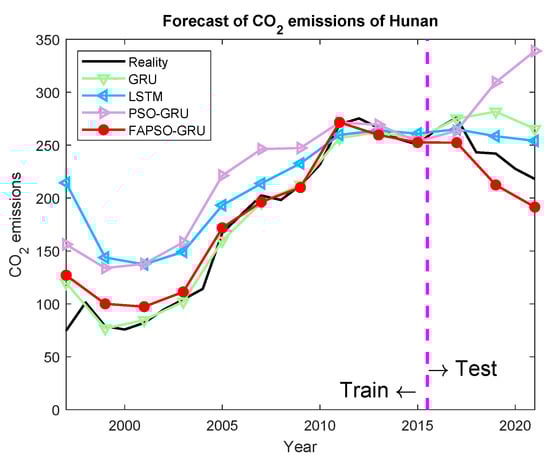
Figure 8.
The forecasting results of Hunan.
The FAPSO-GRU holds significant practical implications for carbon emission reduction. This model enhances the accuracy of emission predictions and optimizes resource allocation, thereby facilitating the development of more effective carbon reduction strategies and supporting the formulation of scientifically sound environmental policies and regulations by governmental and related organizations. Furthermore, it assists industrial enterprises in monitoring carbon emissions and optimizing production processes, promoting sustainable development. However, there are several potential limitations. Firstly, the model’s performance is highly dependent on the availability of high-quality and extensive historical carbon emission data; any deficiencies or poor quality in the data could adversely affect prediction accuracy. Secondly, the integration of GRU and FAPSO increases the model’s complexity, necessitating greater computational resources and time for training and prediction, which may hinder real-time applications. Additionally, the model’s adaptability across different regions and industries may be limited, requiring substantial localization and optimization efforts to achieve optimal results.
4. Conclusions
This work introduces an innovative GRU model enhanced by the Fibonacci attenuation particle swarm optimization algorithm. The primary application of this model is in predicting carbon emissions. It achieves this by leveraging the Fibonacci attenuation particle swarm optimization algorithm to fine-tune the hyperparameters of the GRU model, thereby effectively addressing the issue of reduced model accuracy due to limited training data.
To evaluate the performance of our proposed model, we conducted experiments using real carbon emission data from Hainan Province, covering the period from 1991 to 2019. Specifically, data from 1991 to 2016 were used for training, while data from 2016 to 2019 were reserved for testing. Control groups included standard GRU models, standard LSTM models, and PSO-GRU models. When comparing FAPSO-GRU to the traditional GRU model, we observed substantial improvements: a 42.27% reduction in MAE, a 42.38% reduction in RMSE, and a 43.06% reduction in MAPE. To further validate the performance of FAPSO-GRU, additional experiments were conducted using data from Shanghai, Beijing, Guangdong, Hubei, and Hunan. The experimental results conclusively demonstrate that our proposed model provides a highly accurate solution for carbon emission prediction tasks.
Despite these promising results, several limitations should be acknowledged. Firstly, the model’s reliance on historical carbon emission data means that its performance is contingent on the availability and quality of such data. Regions with sparse or unreliable data may not benefit equally from the model. Secondly, the complexity of the GRU-FAPSO model requires substantial computational resources, which could limit its practical application in resource-constrained environments. Furthermore, the model’s performance has primarily been validated on data from Chinese provinces, and its generalizability to other regions with different carbon emission patterns remains to be explored.
Future research should focus on addressing these limitations. One potential direction is to explore data augmentation techniques or transfer learning to improve the model’s robustness in data-scarce environments. Additionally, efforts could be made to optimize the computational efficiency of the model, potentially through the development of more lightweight versions or the use of advanced hardware accelerators. Expanding the validation of the model to include a diverse set of geographical regions with varying carbon emission characteristics will also be crucial to establishing its generalizability.
Author Contributions
Conceptualization, J.G. and J.L.; Methodology, J.G. and Y.S.; Software, J.G., J.L. and Y.S.; Validation, J.G.; Formal analysis, J.G.; Investigation, J.G. and Z.Y.; Resources, J.G.; Data curation, J.G. and Z.Y.; Writing—original draft, J.G.; Writing—review & editing, J.G.; Visualization, J.G.; Supervision, J.G.; Project administration, J.G.; Funding acquisition, J.G. All authors have read and agreed to the published version of the manuscript.
Funding
This research was funded by Natural Science Foundation of Hubei Province (2023AFB003, 2024AFB002); School Youth Fund Program of Hubei University of Economics (XJZD202305); JSPS KAKENHI Grant Numbers JP22K12185.
Data Availability Statement
The original contributions presented in the study are included in the article, further inquiries can be directed to the corresponding author.
Conflicts of Interest
On behalf of all the authors, the corresponding author states that there are no conflicts of interest.
References
- Jin, H. Prediction of direct carbon emissions of Chinese provinces using artificial neural networks. PLoS ONE 2021, 16, e0236685. [Google Scholar] [CrossRef] [PubMed]
- Abeydeera, L.H.U.W.; Mesthrige, J.W.; Samarasinghalage, T.I. Global research on carbon emissions: A scientometric review. Sustainability 2019, 11, 3972. [Google Scholar] [CrossRef]
- Chen, X.; Cheng, F.; Liu, C.; Cheng, L.; Mao, Y. An improved Wolf pack algorithm for optimization problems: Design and evaluation. PLoS ONE 2021, 16, e0254239. [Google Scholar] [CrossRef] [PubMed]
- Li, J.; Tian, Z.; Zhang, G.; Li, W. Multi-AUV Formation Predictive Control Based on CNN-LSTM under Communication Constraints. J. Mar. Sci. Eng. 2023, 11, 873. [Google Scholar] [CrossRef]
- Majeed, M.T.; Ozturk, I.; Samreen, I.; Luni, T. Evaluating the asymmetric effects of nuclear energy on carbon emissions in Pakistan. Nucl. Eng. Technol. 2022, 54, 1664–1673. [Google Scholar] [CrossRef]
- Zhu, Y.; Huo, C. The Impact of Agricultural Production Efficiency on Agricultural Carbon Emissions in China. Energies 2022, 15, 4464. [Google Scholar] [CrossRef]
- Yu, Y.; Sun, R.; Sun, Y.; Wu, J.; Zhu, W. China’s Port Carbon Emission Reduction: A Study of Emission-Driven Factors. Atmosphere 2022, 13, 550. [Google Scholar] [CrossRef]
- Kong, F.; Song, J.; Yang, Z. A daily carbon emission prediction model combining two-stage feature selection and optimized extreme learning machine. Environ. Sci. Pollut. Res. 2022, 29, 87983–87997. [Google Scholar] [CrossRef] [PubMed]
- Zhou, J.; Zhu, S.; Qiu, Y.; Armaghani, D.J.; Zhou, A.; Yong, W. Predicting tunnel squeezing using support vector machine optimized by whale optimization algorithm. Acta Geotech. 2022, 17, 1343–1366. [Google Scholar] [CrossRef]
- Kong, F.; Song, J.; Yang, Z. A novel short-term carbon emission prediction model based on secondary decomposition method and long short-term memory network. Environ. Sci. Pollut. Res. 2022, 29, 64983–64998. [Google Scholar] [CrossRef]
- Zhao, A.; Song, X.; Li, J.; Yuan, Q.; Pei, Y.; Li, R.; Hitch, M. Effects of Carbon Tax on Urban Carbon Emission Reduction: Evidence in China Environmental Governance. Int. J. Environ. Res. Public Health 2023, 20, 2289. [Google Scholar] [CrossRef]
- Ott, C.; Schiemann, F. The market value of decomposed carbon emissions. J. Bus. Financ. Account. 2023, 50, 3–30. [Google Scholar] [CrossRef]
- Kılıç, M.; Kuzey, C. The effect of corporate governance on carbon emission disclosures: Evidence from Turkey. Int. J. Clim. Chang. Strateg. Manag. 2019, 11, 35–53. [Google Scholar] [CrossRef]
- Houqe, M.N.; Opare, S.; Zahir-Ul-hassan, M.K.; Ahmed, K. The Effects of Carbon Emissions and Agency Costs on Firm Performance. J. Risk Financ. Manag. 2022, 15, 152. [Google Scholar] [CrossRef]
- Wang, L.; Cao, Q.; Zhang, Z.; Mirjalili, S.; Zhao, W. Artificial rabbits optimization: A new bio-inspired meta-heuristic algorithm for solving engineering optimization problems. Eng. Appl. Artif. Intell. 2022, 114, 105082. [Google Scholar] [CrossRef]
- Li, Z.; He, J.; Ni, T.; Huo, J. Numerical computation based few-shot learning for intelligent sea surface temperature prediction. Multimed. Syst. 2022, 29, 3001–3013. [Google Scholar] [CrossRef]
- Kolemen, E.; Egrioglu, E.; Bas, E.; Turkmen, M. A new deep recurrent hybrid artificial neural network of gated recurrent units and simple seasonal exponential smoothing. Granul. Comput. 2024, 9, 7. [Google Scholar] [CrossRef]
- Wang, X.; Wang, L.; Zhang, Z.; Chen, K.; Jin, Y.; Yan, Y.; Liu, J. Sparse Data-Extended Fusion Method for Sea Surface Temperature Prediction on the East China Sea. Appl. Sci. 2022, 12, 5905. [Google Scholar] [CrossRef]
- Hu, Y.; Lv, K. Hybrid prediction model for the interindustry carbon emissions transfer network based on the grey model and general vector machine. IEEE Access 2020, 8, 20616–20627. [Google Scholar] [CrossRef]
- Zhu, Z.; Liu, B.; Yu, Z.; Cao, J. Effects of the Digital Economy on Carbon Emissions: Evidence from China. Int. J. Environ. Res. Public Health 2022, 19, 9450. [Google Scholar] [CrossRef]
- Kennedy, J.; Eberhart, R. Particle swarm optimization. In Proceedings of the ICNN’95—International Conference on Neural Networks, Perth, WA, Australia, 27 November–1 December 1995; Volume 4, pp. 1942–1948. [Google Scholar] [CrossRef]
- Guo, J.; Shi, B.; Yan, K.; Di, Y.; Tang, J.; Xiao, H.; Sato, Y. A twinning bare bones particle swarm optimization algorithm. PLoS ONE 2022, 17, e0267197. [Google Scholar] [CrossRef] [PubMed]
- Guo, J.; Zhou, G.; Di, Y.; Shi, B.; Yan, K.; Sato, Y. A Bare-bones Particle Swarm Optimization with Crossed Memory for Global Optimization. IEEE Access 2023, 11, 31549–31568. [Google Scholar] [CrossRef]
- Guo, J.; Zhou, G.; Yan, K.; Shi, B.; Di, Y.; Sato, Y. A novel hermit crab optimization algorithm. Sci. Rep. 2023, 13, 9934. [Google Scholar] [CrossRef] [PubMed]
Disclaimer/Publisher’s Note: The statements, opinions and data contained in all publications are solely those of the individual author(s) and contributor(s) and not of MDPI and/or the editor(s). MDPI and/or the editor(s) disclaim responsibility for any injury to people or property resulting from any ideas, methods, instructions or products referred to in the content. |
© 2024 by the authors. Licensee MDPI, Basel, Switzerland. This article is an open access article distributed under the terms and conditions of the Creative Commons Attribution (CC BY) license (https://creativecommons.org/licenses/by/4.0/).