Abstract
In some pumped storage stations, water spray from the air hole occurs during load rejection. In order to avoid this phenomenon, it is necessary to study the change of the air hole water level during the transient process of the power station. A transient simulation of a pumped storage power station was carried out to study the variation in the maximum water level of the air hole and gate shaft. The transition process of a power station with or without a surge tank was analyzed, and the changes in the water level of the gate shaft and air hole were compared based on different gate shaft areas, and the influence of the gate shaft location on the changes in the water level of the gate shaft and air hole was determined. The following results were obtained: when the power station has a surge tank, the maximum water levels of the gate shaft and air hole are basically consistent; when the station has no surge tank, the maximum water level difference between the gate shaft and air hole gradually increases as the gate shaft area increases; the greater the distance between the gate shaft and inlet, the larger the maximum water level difference between the air hole and gate shaft; overflow measures for the air hole are required if the maximum water level of the air hole exceeds the design value.
1. Introduction
In recent years, with the decrease in traditional energy, renewable energy has gradually become the direction of world development. As the most widely known and widely used renewable energy, hydropower has become an important choice for renewable energy with its low-cost, high-power generation efficiency and the most mature technology level. Compared with other power generation methods, the energy used in hydropower generation is water energy, which is renewable energy and inexhaustible. There is no need to worry about the excessive use of energy resulting in a large number of energy consumption problems, and its energy is clean and pollution-free.
With the development of renewable energy, great efforts have been made toward the development of pumped storage power stations because of their numerous functions and advantages in the power grid, such as peak regulation, valley filling, frequency regulation, phase regulation, and accident backup [1,2,3]. Pumped storage power stations are multi-usage machines that are characterized by frequent start-ups and shutdowns, and multi-condition changes. During the start-up and stoppage of turbines and load disturbances, the transient process in the long power tunnel is complex. Given the inertia of the water and runner and the imbalance of energy in the system, the water pressure, runner speed, and water level of the surge tank may change erratically when the condition changes, endangering the power plant and reducing the life of units. Therefore, transient calculations for different conditions should be conducted, and both the stability of the system and dangerous conditions should be predicted.
In the pumped storage station, the gate is mainly used to block the water flow, where the gate drops down during an accident, and the air hole supplies air to the diversion tunnel. The gate shaft with the air hole also functions as a differential surge tank used to control the pressure of the pipeline system. The gate shaft is equivalent to the main chamber of the differential surge tank, and the air hole is equivalent to the riser pipe of the differential surge tank, but the impedance coefficient of the air hole is larger than the riser pipe. When the power station has no surge tank, the gate shaft has a greater effect on the pressure control. When the unit load is rejected, the water flows into the gate shaft and the air hole at the same time, and the water levels begin to rise. When there is no inflow, the water levels of the gate shaft and the air hole are at their maximum. Then, the water in the gate shaft and air hole begins to flow out, and their water levels subsequently decrease. A gate shaft is sometimes used to replace the surge tank in a power station, where the gate shaft area is increased to reduce the maximum water level of the gate shaft, but water spray from the air hole occurs.
In some power stations and working conditions, the phenomenon of water spraying from the air hole occurs. The power station calculated in this paper is in its construction period, and the overflow dam has been set up due to the water level of the air hole. Therefore, in order to ensure the safety of the power station, this study is necessary.
This paper mainly studies the working condition of the power station when the water level of the gate shaft and air hole is at its maximum. Through a calculation of the transient process, it is found that the working condition with the highest water levels of the gate shaft and air hole is the load rejection condition. Therefore, no further research has been carried out on other working conditions.
In this study, the main contributions are summarized as follows:
- Established a platform for a calculation of a simulation of a power station.
- The accuracy of the calculation is proved by comparing the calculated and field test.
- Analyzed the changes in the water level of the gate shaft and air hole based on different gate shaft areas.
- The influence of the gate shaft location on the changes in the water level of the gate shaft and air hole was determined.
The rest of this article is organized as follows: Section 2 contains the present research status of the gate shaft and surge tank. Section 3 describes the mathematical model of calculation. In Section 4, the transition process of a power station with or without a surge tank was calculated, the changes in the water level of the gate shaft and air hole were compared based on different gate shaft areas and summarized the change rule of the water level of the air hole. Section 5 summarized the work and along with a discussion on future directions.
2. Literature Review
Surge tanks are designed to protect hydropower stations from pressure fluctuations caused by sudden changes in load. Surge tanks are used to reflect the water hammer wave into the diversion channel, thereby improving the operating conditions of the water turbine and the quality of the system power supply when the load changes. Scholars have conducted many studies on surge tanks and differential surge tanks. Roman Gabl and Maurizio Righetti [4] used ANSYS-CFX to investigate the influence of the individual geometry parameters (radius, length, angle at the forefront) on the local head loss coefficients and the ratio of the two flow directions. Yu et al. [5] studied the differential pressure of the breast wall of a differential surge chamber under a transient condition. Richter W et al. [6] proposed a new concept of a semi-air-cushion surge tank (semi-ACST). Zhang et al. [7] investigated the effects of different connection patterns between the tailrace tunnel outlet and the downstream riverbed and the flow states in the transient process on the water level fluctuation in the tailrace surge tank. Li and Brekke [8] investigated the feasibility of adopting surge tanks with a section that is smaller than the Thoma critical value. Chen et al. [9] found that the penetration pressure drop of a one-way surge tank is inversely proportional to the impedance size. Zhu and Guo [10] analyzed the setting condition of surge tanks in power stations. Guo and Zhu [11] investigated the hydraulic design optimization of surge tanks and the unit operation control. Guo et al. [12] proposed a cascaded load adjustment mode that can realize the ideal attenuation of water level oscillations under superimposition operating conditions. Yang et al. [13] found that changing the impedance orifice and bottom plate shapes can effectively prevent the step water falling and air-trapped vortex swirling phenomena. Fathi-Moghadam et al. [14] selected the optimal diameter for the headrace tunnel, penstocks, and surge tanks, and a comparatively better value was obtained for the benefit-cost ratio. Vereide et al. [15] investigated the effect of surge tank throttling on the governor stability, power control, and hydraulic transients in hydropower plants. In a hydraulic power system with a surge tank, the fluctuation in the water level of the surge tank plays an important role in stabilizing the hydraulic system [16]. France [17] investigated the movement of the water surface in a surge tank following the rapid valve opening. Yu et al. [18] investigated the stability characteristics of the ultra-low-frequency oscillation of hydropower plants caused by the water level oscillation in surge tanks during regulation. Rezghi et al. [19] found that the position of the surge tank can affect its water level. Dhakal et al. [20] optimized the size of a double-chamber surge tank to effectively limit the maximum oscillation amplitude of its water level. As a common type of surge tank in long-diversion hydropower stations, differential surge tanks are mainly composed of the riser pipe and the main chamber; at the bottom, the impedance hole is connected to the pressure pipeline [21]. Differential surge tanks can quickly change the flow rate of the diversion channel to meet the needs of the turbine after load change, and the water level attenuation in these tanks is faster than that in any other surge tank. Li et al. [22] found that the hydraulic performance of differential surge tanks can be improved by using asymmetric orifices.
At present, there are some studies on the structure of the gate shaft. Thamir [23] investigated the effects of many gate lip shapes with and without extensions on the magnitudes and distribution of the bottom pressure coefficient when the values of the flow and shaft gap width ratio are constant. Taher [24] found that the bottom pressure coefficient and the fluctuation flow pattern below the gate surface are mainly influenced by the gate geometry. In summary, almost all of the aforementioned articles study the structure of the gate shaft. In comparison, the water level of the gate shaft, and especially the water level of the air hole, have scarcely been studied.
3. Mathematical Model
The solution of the transition process must consider the interdependence and mutual influence of the main components, such as the pipeline, the surge tank, the upper and lower reservoirs, and the unit, which can be considered as a whole. The pipe was solved by using the method of characteristics. The upper and lower reservoirs, the unit, and the surge tank could be used as the boundary condition. The transient flow model of the pipeline adopts the model introduced by Wylie and Streeter of a typically unsteady flow in the pipe. In this paper, the model of a gate well is established and then connected with a unit and pipeline in order to form a platform for a calculation of a simulation of a power station, which can simulate the transient process of various power stations. The program and the code used in this article were written by us.
3.1. Pipeline
The following are the fundamental equations for the unsteady flow in the pipe.
The continuity equation is expressed as follows [25]:
The momentum equation is expressed as follows [25]:
where is the speed of the pressure pulse (m s−1), is the diameter of the pipe (m), is the Darcy–Weisbach friction factor (-), is gravity acceleration (m s−2), is piezometric head (m), is the average velocity (m s−1) and is the pipeline slope (°).
Two partial equations are converted to the following difference equations using the characteristic method [25]:
where
Here, , , and . is the sectional area of the pipe (m2), is the serial number of calculation points (-), is the time step number (-), is the calculation time step (s), and is the piezometric head at calculation point when . Figure 1 shows the computation grid, where i is the serial number of the calculation points, and j is the time step number.
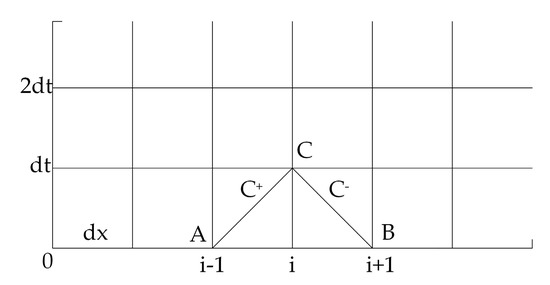
Figure 1.
Characteristic lines x-t mesh.
Equations (3) to (6) are used for the transient calculation of a single pipe.
3.2. Gate Shaft
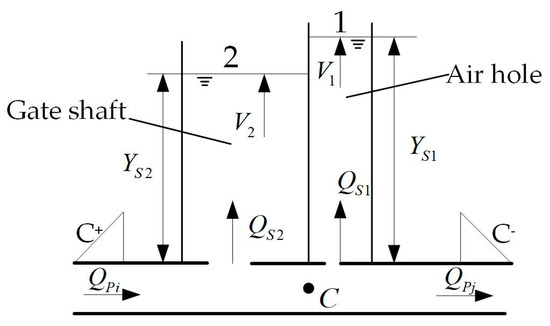
Figure 2.
Schematic of gate shaft.
Organize the above equations:
here , , , if , then the iteration terminates. Newton method is used to solve the problem; the convergence is well. Where is the pipe number before the gate shaft, is the pipe number after the gate shaft, point is the center point of the pipeline, is the calculation time step (s), is the cross-sectional area of the air hole (m2), is the cross-sectional area of the gate shaft (m2), is the flow loss coefficient for the flow into the air hole (-), is the flow loss coefficient for the flow into the gate shaft (-), is the pressure head of the pipe section below the gate shaft (m), is the piezometric head of the pipe before the gate shaft (m), is the piezometric head of the pipe after the gate shaft (m), is the flow of the air hole (m3 s−1), is the flow of the gate shaft (m3 s−1), is the flow of the pipe before the gate shaft (m3 s−1), is the flow of the pipe after the gate shaft (m3 s−1), is the overflowing discharge (m3 s−1), this model does not consider overflow (), is the height of the water column of the air hole (m), is the height of the water column of the gate shaft (m) and is the elevation of point C (m).
3.3. Upper and Lower Reservoirs
The water level of the upper and lower reservoir is assumed to be constant in the transient calculation. The upstream boundary condition can be obtained by the use of Equations (4) and (6) [25].
where: .
The downstream boundary condition can be obtained by the use of Equations (3) and (5) [25].
where: .
The subscript refers to the upstream section and refers to the downstream section, refers to the current value, is the water level of the upper reservoir, is the water level of the lower reservoir, and is the serial number of the downstream end of the pipe.
3.4. Runner
Based on the similarity theory of hydraulic machinery, the runner characteristic expressed by the dimensionless group is presented by Suter, Marxhal, and Flesxh [25].
where: , , , , if and if . , , and are the head (m), moment (N·m), speed (r.p.m), and discharge (m3 s−1), respectively, and subscript r refers to the rated value.
Based on the energy balance condition, the pressure balance equation of the runner can be obtained [25].
When , , the following equation can be obtained
Subscripts 1 and 2 refer to the point parameter before and after the runner, respectively.
The runner moment balance equation can be obtained based on the mechanic’s theory [25].
where , , is the resistance power and rated power of the shaft and is the inertia time constant of the unit.
3.5. Governor Model
The governor equation is
where , and . is the relative servomotor stroke of the distributor, is the relative speed, is the buffer time constant, is the partial feedback constant, is the response time of the distributor, is the permanent adjustment ratio, is the transient adjustment ratio and is the differentiating time constant.
The jaw opening of the wicket gate can be obtained at a given speed or output using the governor equation, pressure balance equation, and moment balance equation.
4. Experimental Results and Discussion
4.1. Comparison of Calculated and Field Test Data
A simulation calculation was carried out under the 100% load rejection condition of a single unit according to the field test data of the A power station. The diagram of the pipeline system of the A power station is shown in Figure 3. The specific parameters of the power station are shown in Table 1.
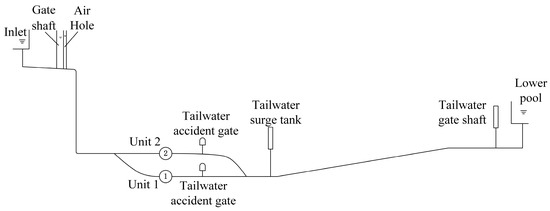
Figure 3.
Diagram of A power station.

Table 1.
A power station parameters.
In the field test, the water levels of the gate shaft and surge tank were measured by the water-level gauge, whose precision is 1 mm. The field test results of the gate shaft and tailwater surge tank were compared with the simulation results. The comparison results are shown in Table 2. The comparison between the results of the simulation and field test is shown in Figure 4.
Table 2.
Comparison results of simulation and field test.
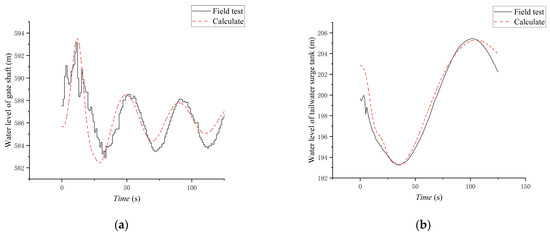
Figure 4.
Water level simulation and field test: (a) gate shaft, (b) tailwater surge tank.
Because the actual area of the gate shaft of the power station may deviate, the measuring instrument will also have deviation, resulting in a certain deviation in the field test result. However, the calculation results are generally consistent with the field test results, where the changing trend of the curve is consistent and the extreme value and time taken to reach the extreme value are close, thus proving that the calculation method is accurate.
4.2. With Surge Tank
The B power station with a surge tank was taken as an example for analysis and calculation. The diagram of the pipeline system of the B power station is shown in Figure 5. The specific parameters of the power station are shown in Table 3.
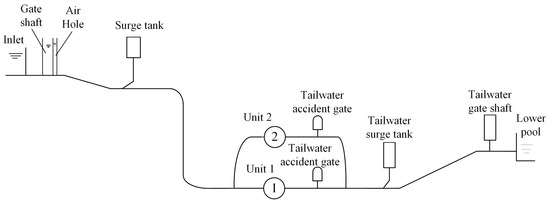
Figure 5.
Diagram of B power station.
Table 3.
Parameters of B power station.
This study used two methods to increase the gate shaft area: (1) the gate shaft area below 563.4 m is 52.47 m2, and the area is expanded to 80, 100, and 150 m2 above 563.4 m; (2) the gate shaft area is expanded to 80, 100 and 150 m2. The transition calculation of the power station was carried out using the different parameters of the gate shaft. The calculation results are shown in Table 4.
Table 4.
Water level of gate shaft and air hole with different parameters of gate shaft.
According to the data in Table 4, the maximum water levels of the gate shaft and the air hole are essentially the same, even if the gate shaft has expanded, and the two different methods of enlarging the gate shaft have the same effect on the water levels of the gate shaft and the air hole.
4.3. Without Surge Tank
When the power station has no surge tank, the gate shaft with the air hole will take on the function of the surge tank. The water levels of the gate shaft and the air hole fluctuate greatly during unit load rejection.
Below the elevation of 595 m, the gate shaft area remains 12.7, 25.4, and 35 m2, and the gate shaft area above 595 m is expanded to 12.7, 25.4, 38.1, 50.8, 63.5, 127, and 149.8 m2. The air hole area is 1.27 m2. The calculation results are shown in Table 5. The water level curves of the gate shaft and the air hole are shown in Figure 6. Figure 7 shows the variation curves of the maximum water level using the different area ratios of the gate shaft and the air hole, and Figure 8 shows the variation curve of the water level difference between them. The flow of the gate shaft and air hole with different upper chamber areas of the gate shaft is shown in Figure 9. Table 6 shows the inflow volume and rising water level when the water level under different gate shaft areas has reached its highest point. The transient process of incrementally increasing the gate shaft area is also calculated in this paper. The calculation results are shown in Table 7.
Table 5.
Maximum water level of the gate shaft and air hole (increasing upper chamber area).
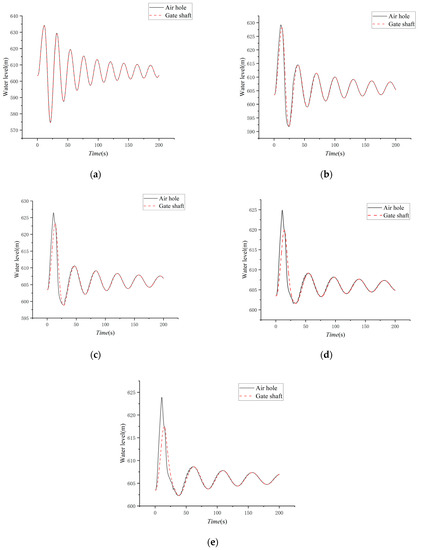
Figure 6.
Water level of gate shaft and air hole (different upper chamber areas of gate shaft): (a) 12.7 m2, (b) 25.4 m2, (c) 38.1 m2, (d) 50.8 m2, and (e) 63.5 m2.
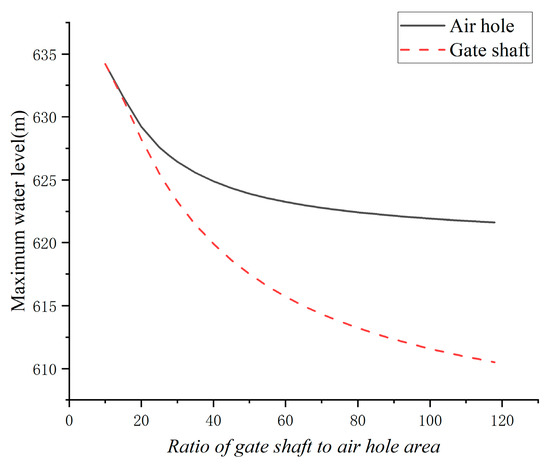
Figure 7.
Maximum water level by the different area ratios of gate shaft and air hole.
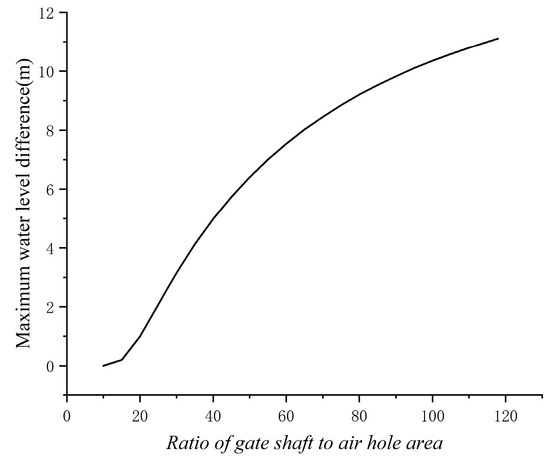
Figure 8.
Maximum water level difference between the gate shaft and the air hole with different area ratios.
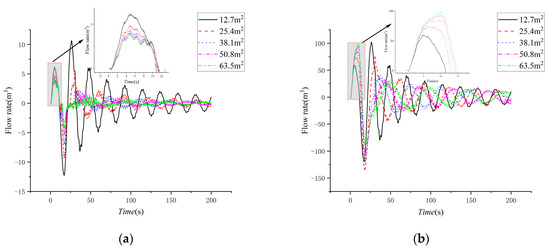
Figure 9.
Flow of gate shaft and air hole with different upper chamber areas of gate shaft: (a) air hole and (b) gate shaft.
Table 6.
The inflow and rising water level when the water level under different gate shaft areas has reached its highest point.
Table 7.
Maximum water level of the gate shaft and air hole (increasing the gate shaft area).
According to Table 5 and Figure 6, if the power station has no surge tank when the gate shaft area is less than 10 times the air hole area, the maximum water levels of the two are nearly the same. When the area of the gate shaft increases to 20, 30, 40, and 50 times that of the air hole, the maximum water level of the air hole decreases by 5.001, 7.791, 9.300, and 10.290 m, the maximum water level of the gate shaft decreases by 6.001, 10.892, 14.301 and 16.692 m and the maximum water level difference between them increases by 1.000, 3.101, 5.001 and 6.402 m, respectively. As shown in Figure 7 and Figure 8, when the gate shaft area ratio is less than 30 times the air hole area, the increasing trend of the maximum water level difference between the two expands with an increase in the gate shaft area ratio. However, the increasing trend of the maximum water level difference between the two decreases with an increase in the gate shaft area ratio when the gate shaft area is more than 30 times the air hole area; that is, the maximum water level difference between the two tends to be a constant value with the continuous expansion of the gate shaft area ratio.
According to Figure 9a, the inflow volume of the air hole decreases with an increase in the gate shaft area, but there are minimal changes to the inflow volume of the air hole, and subsequently, the maximum water level of the air hole decreases less. According to Figure 9b and Table 6, although the inflow volume of the gate shaft increases with an increase in the gate shaft area, the amplification of the water level of the gate shaft still decreases. Therefore, the maximum water level difference between the gate shaft and the air hole gradually increases as the gate shaft area increases.
As shown in Table 5 and Table 7, the changes in the water level of the gate shaft and air hole are consistent when only the upper chamber area of the gate shaft increases, or the gate shaft area increases as a whole. Both methods can significantly reduce the maximum water level of the gate shaft. Thus, when changing the gate parameters to reduce the maximum water level of the gate shaft, the method of increasing the upper chamber can be given priority, which can reduce the expenditure and maximize the benefits. However, when the maximum water level of the gate shaft meets the requirements, the maximum water level of the air hole may still exceed the design value. Thus, overflow measures should be taken for the air hole.
4.4. Influence of Distance from Gate Shaft to Inlet
The distance between the centerline of the gate shaft of the A power station and the inlet is 326.127 m. In this paper, the maximum water levels of the gate shaft and the air hole were analyzed when the gate shaft moved closer toward the inlet by 50 and 100 m and further away from the inlet by 50 and 100 m. The calculation results are shown in Table 8, and the maximum water levels of the gate shaft and air hole are shown in Figure 10.
Table 8.
Maximum water level of gate shaft and air hole at different positions.
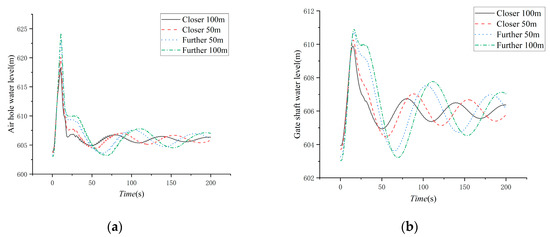
Figure 10.
Curves of water level of air hole and gate shaft by different gate shaft layout methods: (a) air hole and (b) gate shaft.
According to the calculation results, the maximum water levels of the gate shaft and air hole will increase as the gate shaft moves away from the inlet. With the change in the position of the gate shaft, the range of the change in the maximum water level of the air hole obviously exceeds that of the gate shaft. Therefore, the maximum water level difference between the gate shaft and the air hole will increase when the position of the gate shaft moves away from the inlet. On the contrary, moving the gate toward the inlet will decrease the maximum water level difference between the gate shaft and the air hole.
5. Conclusions
The results of the simulation and field test were compared. Then, the transient processes of two power plants with and without a surge tank were selected for simulation. Research shows that when a power station has a surge tank, the water level of the air hole can be ignored. However, for a power station without a surge tank, when the area of the gate shaft is less than or equal to ten times the area of the air hole, the water level of the air hole can also be ignored. Furthermore, when the area of the gate shaft is greater than ten times the area of the air hole, it is necessary to pay attention to the water level of the air hole. The maximum water level of the air hole may exceed the design value, and thus overflow measures should be taken for the air hole. For gate shafts at different positions, the further away the gate shaft is from the inlet, the greater the maximum water level difference between the gate shaft and the air hole, and the more attention that must be given to the maximum water level of the air hole, through the study of the gate shaft with different parameters, situations where the water level of the vent needs to be paid attention to have been summarized, providing guidance for improving the power plant design.
Author Contributions
Conceptualization, H.F. and W.Z.; methodology, H.F.; software, S.L.; validation, H.F. and S.L.; formal analysis, H.F. and S.L.; investigation, H.F.; resources, W.Z. and L.W.; data curation, S.L.; writing—original draft preparation, S.L.; writing—review and editing, H.F., W.Z. and L.W.; visualization, W.Z. and L.W.; supervision, H.F.; project administration, H.F.; funding acquisition, H.F. All authors have read and agreed to the published version of the manuscript.
Funding
This research was funded by the National Natural Science Foundation of China, grant numbers [51879140, 11972144, and 12072098], the State Key Laboratory of Hydroscience and Engineering, grant number [2021-KY-04], Tsinghua-Foshan Innovation Special Fund, grant number (TFISF) [2021THFS0209] and the Creative Seed Fund of Shanxi Research Institute for Clean Energy, Tsinghua University.
Data Availability Statement
Have no new data were created.
Acknowledgments
This study has been supported by the National Natural Science Foundation of China [51879140, 11972144, and 12072098], the State Key Laboratory of Hydroscience and Engineering [2021-KY-04], Tsinghua-Foshan Innovation Special Fund (TFISF) [2021THFS0209] and the Creative Seed Fund of Shanxi Research Institute for Clean Energy, Tsinghua University.
Conflicts of Interest
The authors declare no conflict of interest.
References
- Lu, H.; Chen, C.; Hong, Y.; Li, W. Environmental Benefit Analysis of Pumped Storage Power Station. In Proceedings of the 2017 2nd International Conference on Civil, Transportation and Environmental Engineering (ICCTE 2017), Shenzhen, China, 10–11 May 2017. [Google Scholar]
- Luo, Y.; Sheng, X.; Qiao, Z. Development Situation and Relevant Inspiration of Pumped Storage Power Station in the world. IOP Conf. Ser. Earth Environ. Sci. 2020, 619, 012017. [Google Scholar] [CrossRef]
- Wen, B.; Huang, D.; Yu, L. Functional localization analysis on pumped storage station under the new situation of energy transformation. IOP Conf. Ser. Earth Environ. Sci. 2021, 781, 042056. [Google Scholar] [CrossRef]
- Gabl, R.; Righetti, M. Design criteria for a type of asymmetric orifice in a surge tank using CFD. Eng. Appl. Comput. Fluid Mech. 2018, 12, 397–410. [Google Scholar] [CrossRef]
- Yu, X.; Zhang, J.; Zhou, L. Hydraulic Transients in the Long Diversion-Type Hydropower Station with a Complex Differential Surge Tank. Sci. World J. 2014, 2014, 241868. [Google Scholar] [CrossRef] [PubMed]
- Richter, W.; Zenz, G.; Vereide, K. The Semi-Air-Cushion Surge Tank: Design Principles and Case Study. IOP Conf. Ser. Earth Environ. Sci. 2022, 1079, 012102. [Google Scholar] [CrossRef]
- Zhang, Z.P.; Cai, F.L.; Hua, Y.L.; Cheng, H. Study on the Influence of Tailrace Tunnel Outlet Bottom Slope on Water Level Fluctuation in the Tailrace Surge Tank. Adv. Mater. Res. 2014, 1065–1069, 644–649. [Google Scholar] [CrossRef]
- Li, X.; Brekke, H. Large amplitude water level oscillations in throttled surge tanks. J. Hydraul. Res. 1989, 27, 537–551. [Google Scholar] [CrossRef]
- Chen, X.; Zhang, J.; Yu, X.; Chen, S.; Shi, L.; Bergant, A.; Zhou, J.F. Study on impedance size optimization of a one-way surge tank in a long-distance water supply system. Water Supply 2020, 21, 868–877. [Google Scholar] [CrossRef]
- Zhu, D.; Guo, W. Setting condition of surge tank based on stability of hydro-turbine governing system considering nonlinear penstock head loss. Int. J. Electr. Power Energy Syst. 2019, 113, 372–382. [Google Scholar] [CrossRef]
- Guo, W.; Zhu, D. A Review of the Transient Process and Control for a Hydropower Station with a Super Long Headrace Tunnel. Energies 2018, 11, 2994. [Google Scholar] [CrossRef]
- Guo, W.; Wang, B.; Yang, J.; Xue, Y. Optimal control of water level oscillations in surge tank of hydropower station with long headrace tunnel under combined operating conditions. Appl. Math. Model. 2017, 47, 260–275. [Google Scholar] [CrossRef]
- Yang, Z.Y.; Cheng, Y.G.; Liu, K.; Wang, Q.; Yang, F. Optimization of surge tank structures in hydropower station based on VOF method. IOP Conf. Ser. Earth Environ. Sci. 2021, 627, 012007. [Google Scholar] [CrossRef]
- Fathi-Moghadam, M.; Haghighipour, S.; Samani, H.M.V. Design-Variable Optimization of Hydropower Tunnels and Surge Tanks Using a Genetic Algorithm. J. Water Resour. Plan. Manag. 2013, 139, 200–208. [Google Scholar] [CrossRef]
- Vereide, K.; Svingen, B.; Nielsen, T.K.; Lia, L. The Effect of Surge Tank Throttling on Governor Stability, Power Control, and Hydraulic Transients in Hydropower Plants. IEEE Trans. Energy Convers. 2017, 32, 91–98. [Google Scholar] [CrossRef]
- Guo, W.; Liu, Y.; Qu, F.; Xu, X. A Review of Critical Stable Sectional Areas for the Surge Tanks of Hydropower Stations. Energies 2020, 13, 6466. [Google Scholar] [CrossRef]
- France, P.W. Surge tank water level variations following rapid valve opening. Adv. Water Resour. 1980, 3, 41–43. [Google Scholar] [CrossRef]
- Yu, X.; Yang, X.; Liu, Z.; Zhang, J. Mechanism and quantified criteria of stability characteristics of hydropower plants with surge tanks during regulation. Int. J. Electr. Power Energy Syst. 2020, 122, 106160. [Google Scholar] [CrossRef]
- Rezghi, A.; Riasi, A.; Tazraei, P. Multi-objective optimization of hydraulic transient condition in a pump-turbine hydropower considering the wicket-gates closing law and the surge tank position. Renew. Energy 2019, 148, 478–491. [Google Scholar] [CrossRef]
- Dhakal, R.; Zhou, J.; Palikhe, S.; Bhattarai, K.P. Hydraulic Optimization of Double Chamber Surge Tank Using NSGA-II. Water 2020, 12, 455. [Google Scholar] [CrossRef]
- Yang, X.L.; Kung, C.S. Nonlinear Stability of Differential Surge Chambers. J. Hydraul. Eng. 1992, 118, 1526–1539. [Google Scholar] [CrossRef]
- Li, X.; Hou, J.; Wu, X.; Li, X. Parameter Optimization on Asymmetry Orifice in a Differential Surge Chamber. Energy Procedia 2012, 16, 730–736. [Google Scholar] [CrossRef]
- Ahmed, T.M. Variation of Pressure Coefficient Along Bottom of Dam Vertical Lift Gates. J. Inst. Eng. Ser. A 2020, 101, 561–570. [Google Scholar] [CrossRef]
- Taher, T.M.; Anwar, A.O. Effects of Gate Lip Orientation on Bottom Pressure Coefficient of Dam Tunnel Gate. Arab. J. Sci. Eng. 2016, 41, 4927–4936. [Google Scholar] [CrossRef]
- Wylie, E.B.; Streeter, V.L. Fluid Transients in Systems; Prentice Hall: Englewood Cliffs, NJ, USA, 1993. [Google Scholar]
Disclaimer/Publisher’s Note: The statements, opinions and data contained in all publications are solely those of the individual author(s) and contributor(s) and not of MDPI and/or the editor(s). MDPI and/or the editor(s) disclaim responsibility for any injury to people or property resulting from any ideas, methods, instructions or products referred to in the content. |
© 2023 by the authors. Licensee MDPI, Basel, Switzerland. This article is an open access article distributed under the terms and conditions of the Creative Commons Attribution (CC BY) license (https://creativecommons.org/licenses/by/4.0/).