
Effect of Rational Fertilizer for Eggplants on Nitrogen and Phosphorus Pollutants in Agricultural Water Bodies


Abstract
:
1. Introduction
2. Materials and Methods
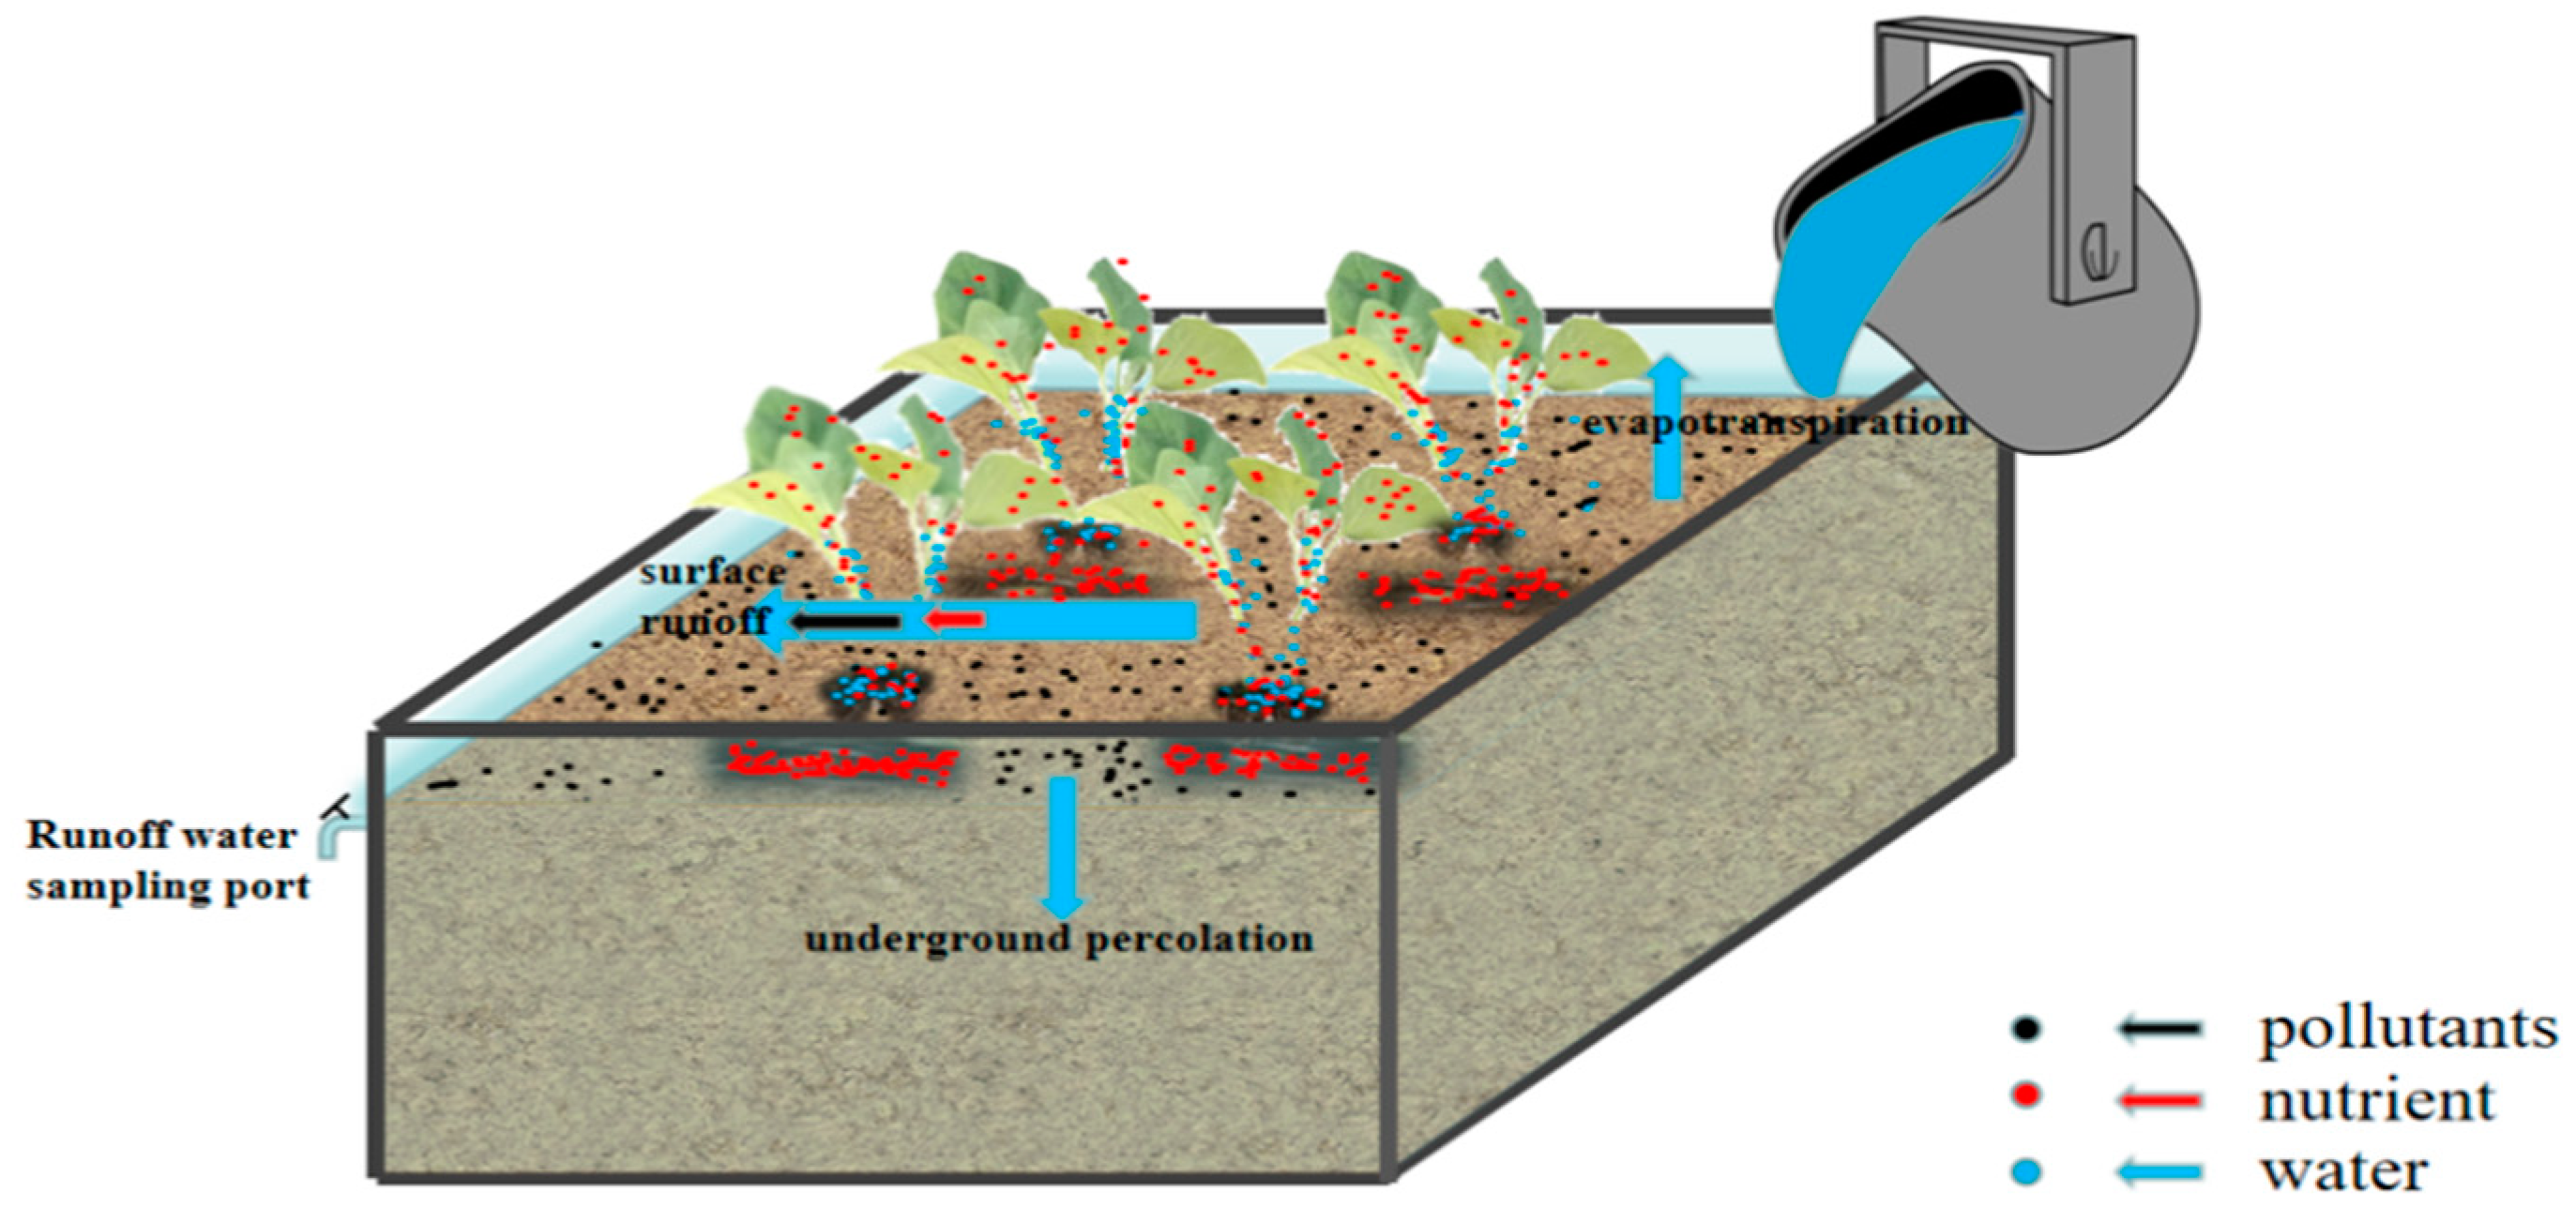
2.1. Crop-Soil Runoff Water Test System
2.2. Test Content
2.2.1. Crop Yield
2.2.2. Soil Fertility
2.2.3. Contaminants in Water
2.2.4. Statistical Analysis
3. Results
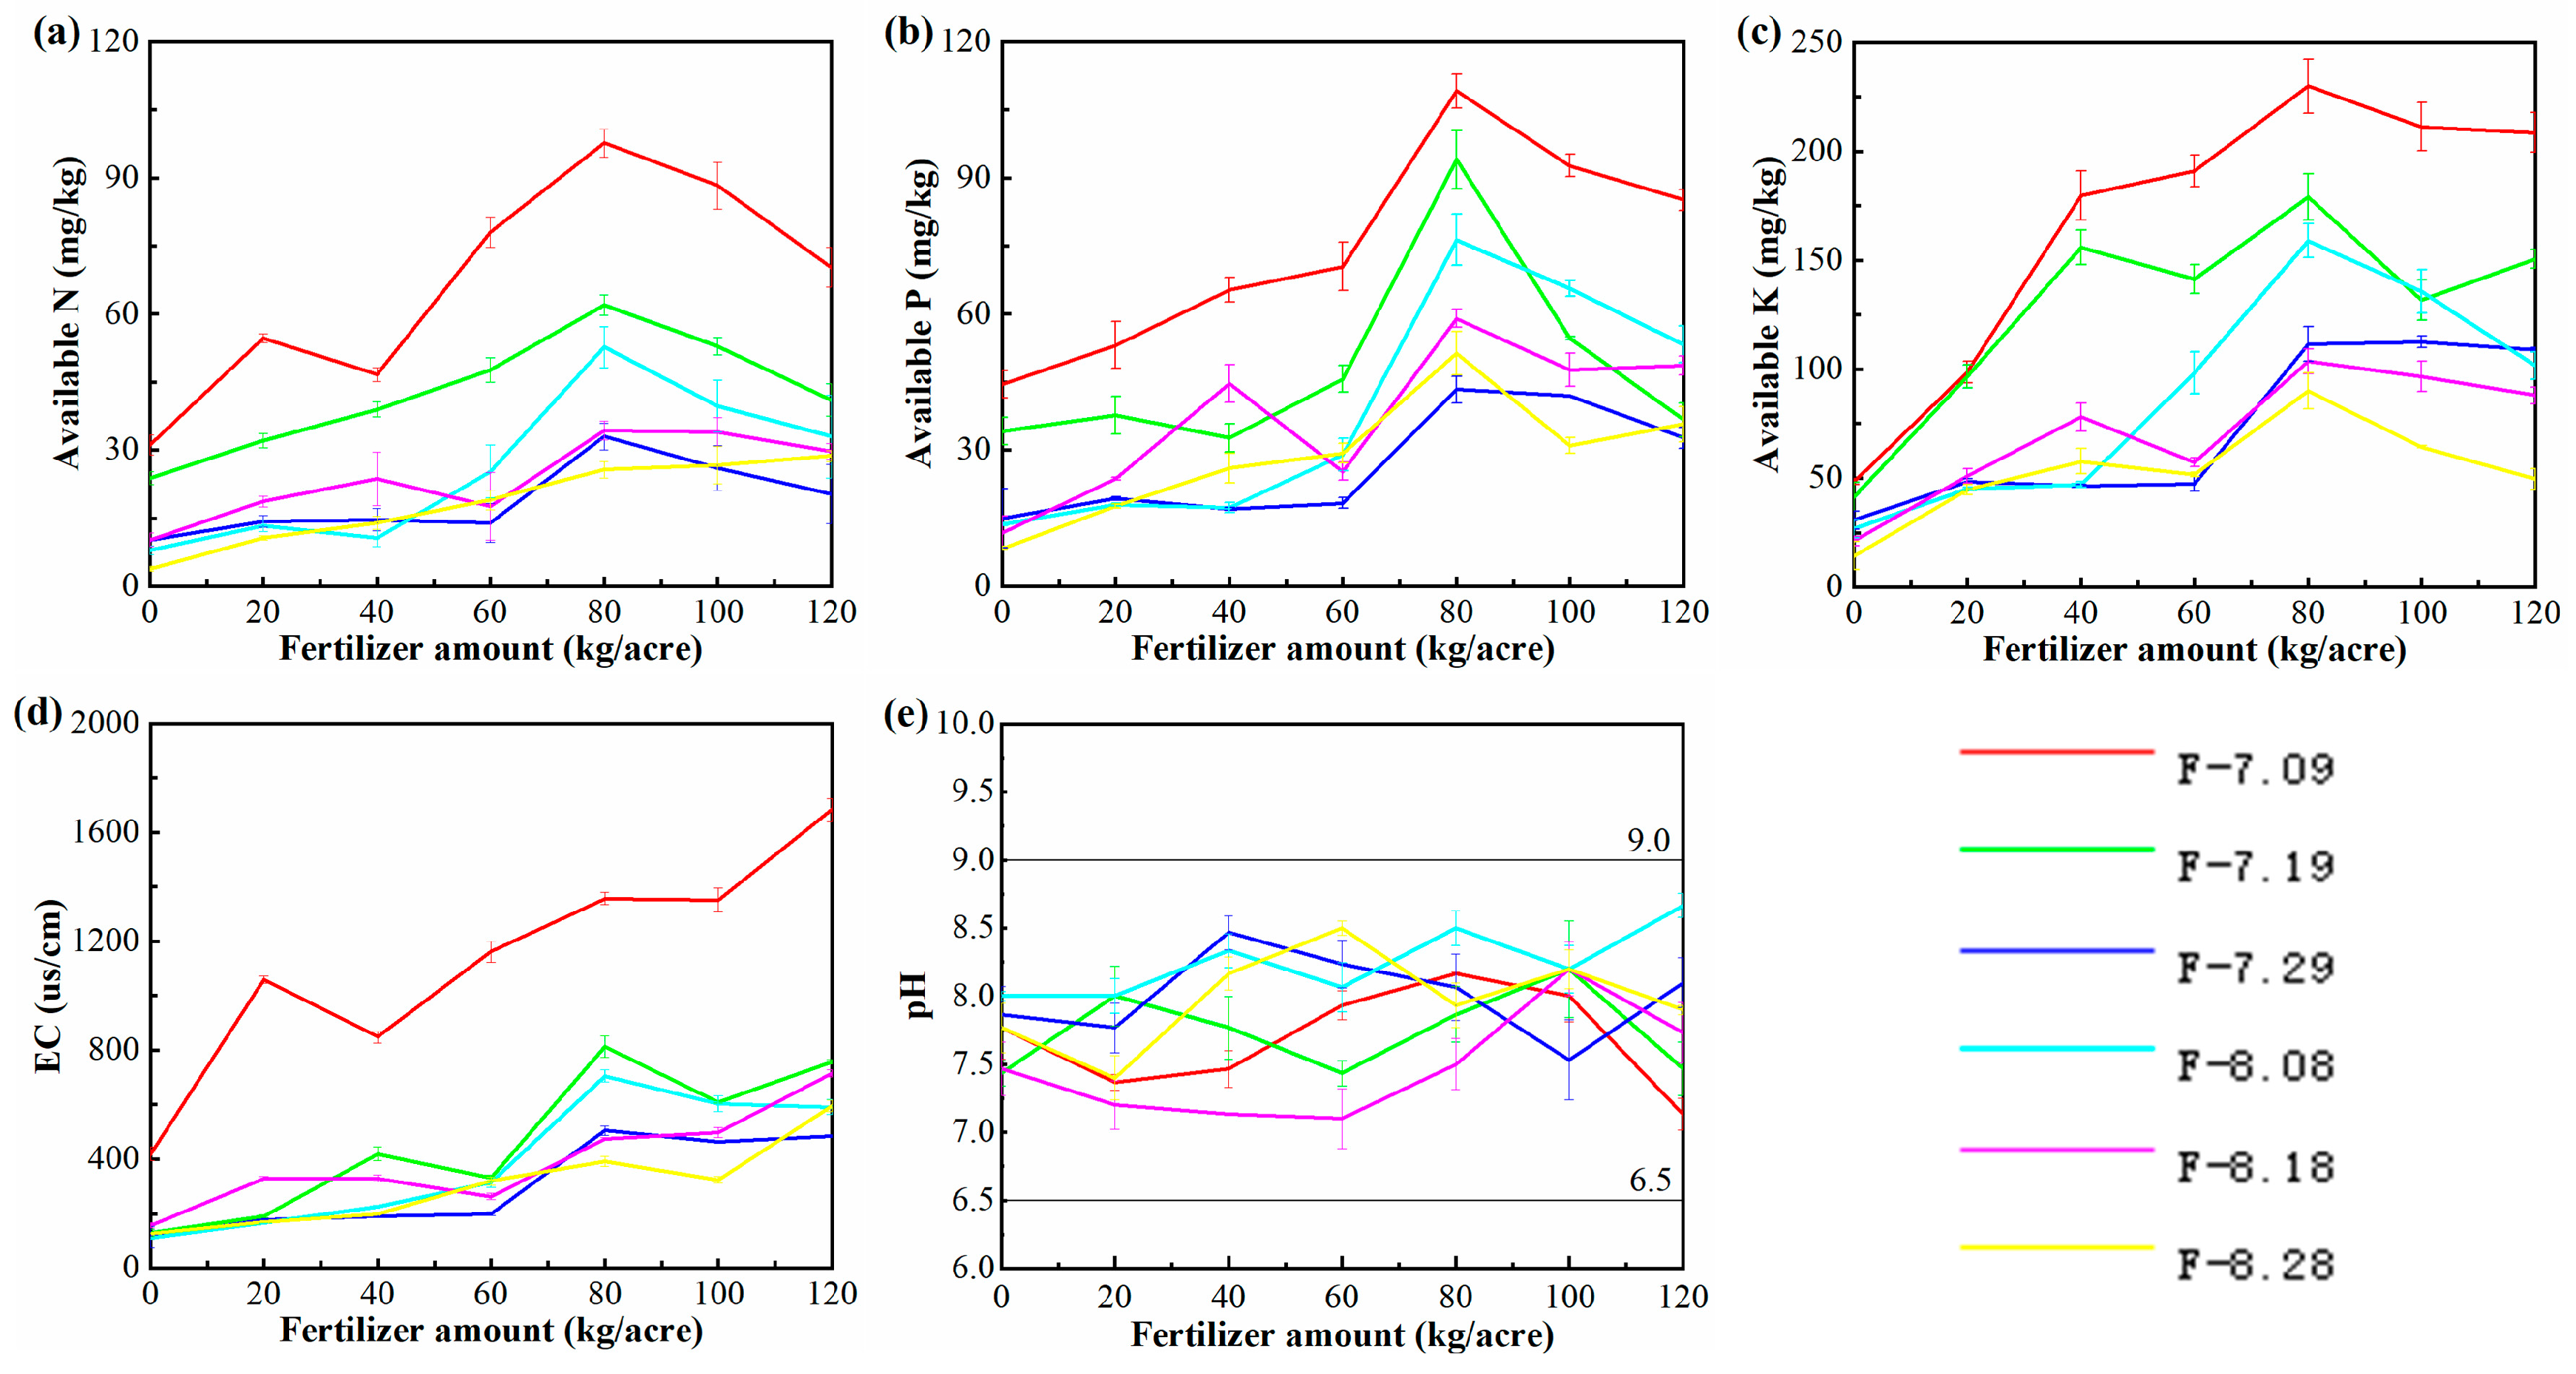
3.1. Effect of Fertilizer Application on Soil Fertility in Plantation
3.2. Effect of Fertilizer Application on Crop Yield in Plantation
3.3. The Effect of Fertilizer Application on Nitrogen and Phosphorus Pollutants in the Surrounding Water Bodies
4. Discussion
5. Conclusions
- (1)
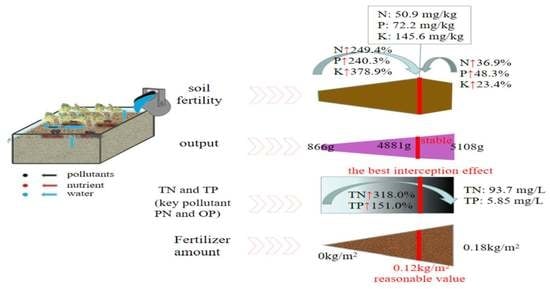
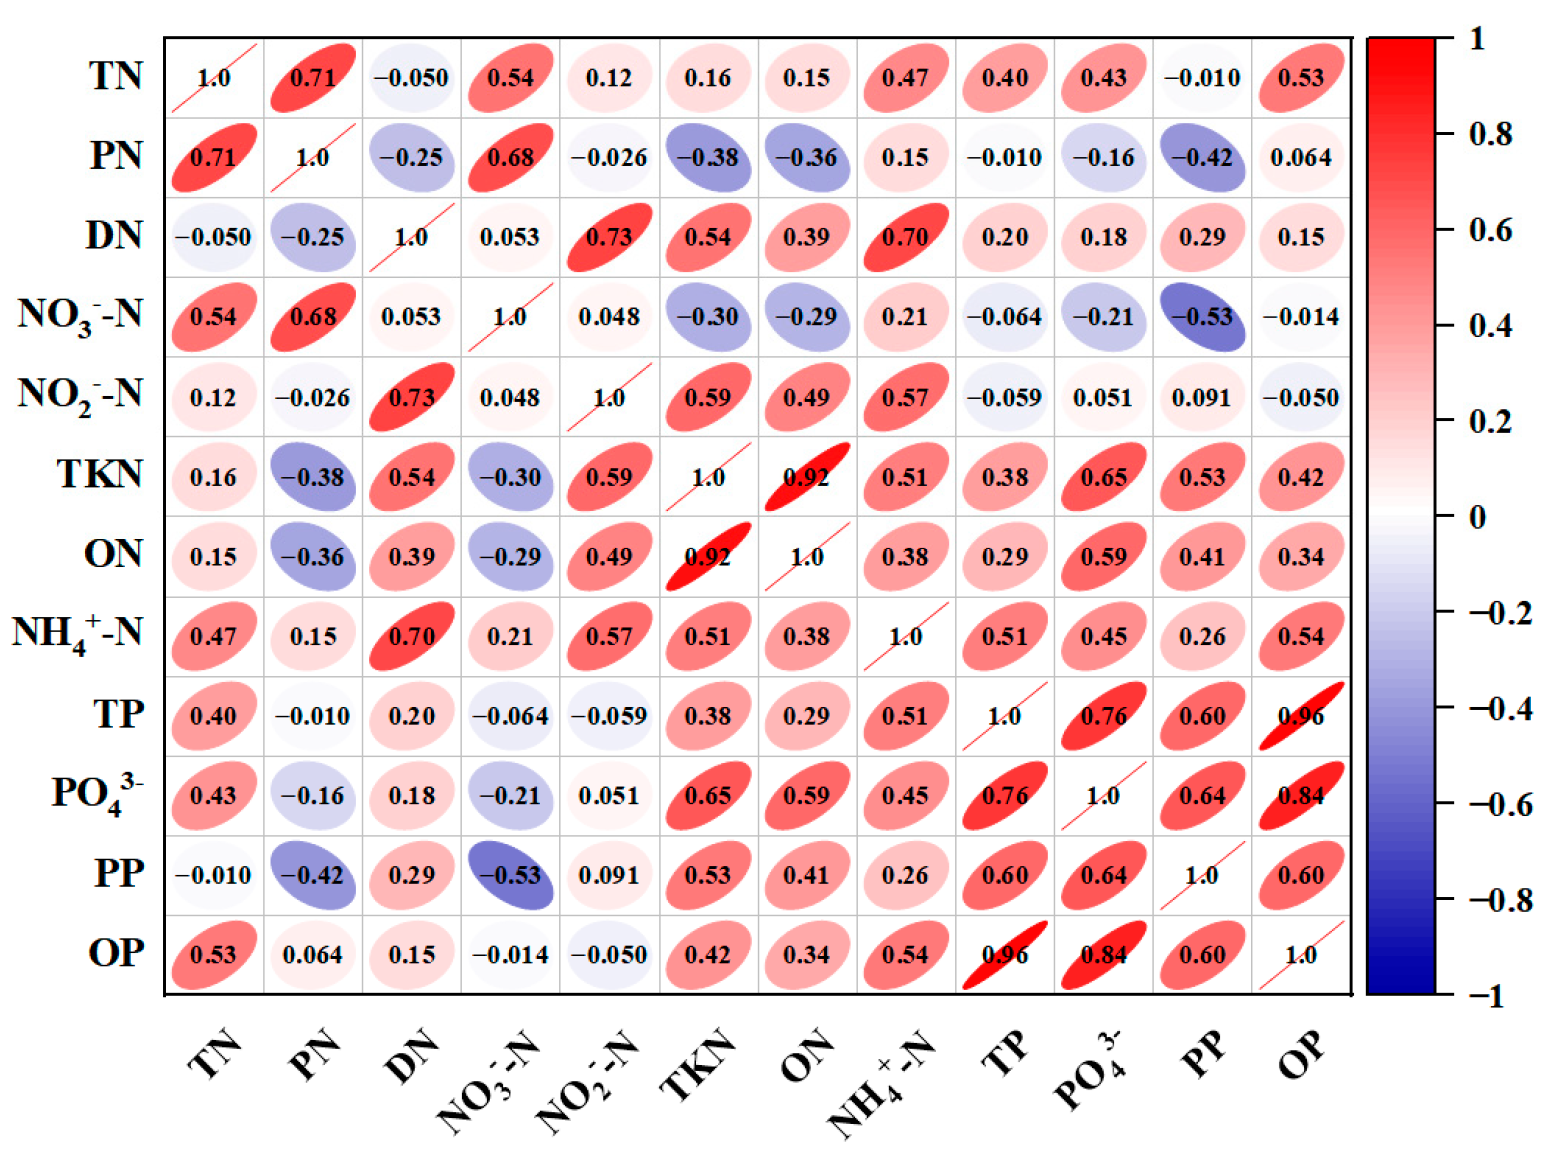
- The key nitrogen and phosphorus pollutants are PN and OP, respectively. The average proportion of PN to TN is 50.9% and the average proportion of OP to TP is 60.6%.
- (2)
- Crop growth will have a certain interception effect on pollutant migration. At the flowering stage, PN, TP, and OP were intercepted best by the crop, which can be reduced by 21.9%, 53.3%, and 47.6%, respectively, while TN was intercepted best at maturity one, and the concentration could be reduced by 42.6%.
- (3)
- Combining the interrelationship between fertilizer application on soil, crop fertility, and environmental effects on yield in the process of eggplant planting, the reasonable value of fertilizer application for eggplant planting in this paper is suggested to be 0.12 kg/m2. At this time, the soil fertility is the highest, the yield is close to the maximum, and the crop has the best interception effect on pollutants.
Author Contributions
Funding
Institutional Review Board Statement
Data Availability Statement
Acknowledgments
Conflicts of Interest
References
- Xiong, H.F. The effect of agricultural non-point Source Pollution of nitrogen and phosphorous on Lake Eutrophication. IOP Conf. Ser. Earth Environ. Sci. 2017, 64, 012061. [Google Scholar] [CrossRef]
- Shou, C.G.; Du, H.S.; Liu, X.P. Research progress of source and mechanism of agricultural non-point source pollution in China. Appl. Ecol. Environ. Res. 2019, 17, 10611–10621. [Google Scholar] [CrossRef]
- He, R.; Shao, C.F.; Shi, R.G.; Zhang, Z.Y.; Zhao, R. Development Trend and Driving Factors of Agricultural Chemical Fertilizer Efficiency in China. Sustainability 2020, 12, 4607. [Google Scholar] [CrossRef]
- Thorburn, P.J.; Biggs, J.S.; Palmer, J.; Meier, E.A.; Verburg, K.; Skocaj, D.M. Prioritizing Crop Management to Increase Nitrogen Use Efficiency in Australian Sugarcane Crops. Front. Plant Sci. 2017, 8, 1504. [Google Scholar] [CrossRef]
- Liang, C.; Song, J.; Yue, F.; Zhang, J.J. Water environmental protection strategy of Dagu River Basin in Qingdao, China. In Manufacture Engineering and Environment Engineering; WIT Press: Qingdao, China, 2014; Volume 1–2, pp. 753–757. [Google Scholar]
- Gong, L. Study on Water Pollution Prevention and Water Ecology Improvement Strategies in Dezhou City. Ph.D. Thesis, Ocean University of China, Qingdao, China, 2015. (In Chinese). [Google Scholar]
- Xie, L.G. Study on Water Resources Protection and Utilization in the Core Area of Three Gorges Reservoir. Ph.D. Thesis, Chongqing University, Chongqing, China, 2011. (In Chinese). [Google Scholar]
- Zhang, J.J. Study on Water Resources Allocation in Small and Medium-Sized Watersheds. Master’s Thesis, Chinese Institute of Water Resources and Hydropower Research, Beijing, China, 2018. (In Chinese). [Google Scholar]
- Chen, Y.C.; Li, Y.; Yu, H.M.; Qiao, B.; Sun, J.M. Runoff pollutant output characteristics and correlation analysis of typical rainfall paddy fields in Taihu Lake region. Chin. J. Environ. Eng. 2016, 10, 137–144. (In Chinese) [Google Scholar]
- Si, Q.L.; Gao, Y.; Peng, T.; Yu, J.L.; Zhao, W.F. Current status of chemical fertilizer use and progress of research on efficient fertilization for wheat yield increase in China. Agric. Technol. 2015, 35, 30–31. [Google Scholar]
- Wang, T.L.; Cheng, H. Research progress on the current status of nitrogen fertilizer application in agricultural production and its environmental effects. Heilongjiang Environ. Bull. 2020, 33, 58–59. [Google Scholar]
- Zhang, J.; Yin, F.H.; Li, G.Y. Research progress and development trend on the effectiveness of phosphorus fertilizer on farmland. Sci. Technol. Xinjiang Agric. Reclam. 2015, 38, 57–60. [Google Scholar]
- Qu, J.F. Study on the effect of fertilizer application and soil environmental safety. Phosphate Fertil. Compd. Fertil. 2010, 25, 10–12. (In Chinese) [Google Scholar]
- Thompson, R.B.; Martínez-Gaitan, C.; Gallardo, M.; Giménez, C.; Fernández, M.D. Identification of irrigation and N management practices that contribute to nitrate leaching loss from an intensive vegetable production system by use of a comprehensive survey. Agric. Water Manag. 2007, 89, 261–274. [Google Scholar] [CrossRef]
- Thorup-Kristensen, K.; Dorte, B.D.; Hanne, L.K. Crop yield, root growth, and nutrient dynamics in a conventional and three organic cropping systems with different levels of external inputs and N re-cycling through fertility building crops. Eur. J. Agron. 2012, 37, 66–82. [Google Scholar] [CrossRef]
- Stefanelli, D.; Ian, G.; Rod, J. Minimal nitrogen and water use in horticulture: Effects on quality and content of selected nutrients. Food Res. Int. 2010, 43, 1833–1843. [Google Scholar] [CrossRef]
- Colla, G.; Hye-Ji, K.; Kyriacou, M.C.; Youssef, R. Nitrate in fruits and vegetables. Sci. Hortic. 2018, 237, 221–238. [Google Scholar] [CrossRef]
- Hu, Y.C.; Song, Z.W.; Lu, W.L.; Poschenrieder, C.; Schmidhalter, U. Current Soil Nutrient Status of Intensively Managed Greenhouses. Pedosphere 2012, 22, 825–833. [Google Scholar] [CrossRef]
- Li, Y.; Ju, X.T. The key to reduce nitrous oxide emission in farmland is reasonable nitrogen application. J. Agro-Environ. Sci. 2020, 39, 842–851. (In Chinese) [Google Scholar]
- Li, B.; Li, J. Research progress on the prevention and control of agricultural non-point water pollution by microbial technology. Biotechnol. Bull. 2015, 31, 99–104. [Google Scholar]
- Min, J.; Zhang, H.L.; Shi, W.M. Optimizing nitrogen input to reduce nitrate leaching loss in greenhouse vegetable production. Agric. Water Manag. 2012, 111, 53–59. [Google Scholar] [CrossRef]
- Dimzon, I.K.D.; Ann, S.M.; Janine, M.; Roy, K.Y.; Stephan, L.; Heike, W.; Teresita, R.P.; Jutta, M.; Fabian, M.D.; Thomas, P.K. Trace organic chemical pollutants from the lake waters of San Pablo City, Philippines by targeted and non-targeted analysis. Sci. Total Environ. 2018, 639, 588–595. [Google Scholar] [CrossRef]
- Zhang, Z.Y. Analysis of the current situation and progress of agricultural surface source pollution management in water environment. Green Build. Mater. 2017, 4, 195. (In Chinese) [Google Scholar]
- Li, S.M.; Gary, S.B.; Ju, M.; Shi, W.M. Effect of continuous application of inorganic nitrogen fertilizer on selenium concentration in vegetables grown in the Taihu Lake region of China. Plant Soil 2015, 393, 351–360. [Google Scholar] [CrossRef]
- Wang, Y.G.; Wang, H.Y.; Zheng, Y.L.; Sun, X.Y. Advances in research methods and control technologies of agricultural non-point source pollution: A review. J. China Agric. Resour. Reg. Plan. 2021, 42, 25–33. [Google Scholar]
- Li, Q.K.; Hu, Y.W.; Sun, J. Migration and transformation of agricultural non-point source pollutants in drainage ditches. Chin. J. Eco-Agric. 2010, 18, 210–214. [Google Scholar] [CrossRef]
- Yu, Y.L.; Yang, L.Z.; Li, H.N.; Zhu, C.X.; Yang, B.; Xue, L.H. Situation analysis and trend prediction of the prevention and control technologies for planting non-point source pollution. Environ. Sci. 2020, 41, 3870–3878. [Google Scholar]
- Wu, L.; Long, T.Y.; Liu, X. Nitrogen and phosphorus pollution load estimation in small watershed in three gorges reservoir area. China Water Wastewater 2012, 28, 120–124. [Google Scholar]
- Gan, M.Q.; Pod, L.; Huang, Y.; Liu, P.S.; Ye, C.R.; Ma, Y.H. Monitoring and evaluation of surface source pollution from cultivation in Hefei City around Chaohu Lake. Environ. Monit. Manag. Technol. 2021, 33, 28–32. (In Chinese) [Google Scholar]
- Yang, J.L.; Zhang, G.L.; Shi, X.Z.; Wang, H.J.; Cao, Z.H.; Ritsema, C.J. Dynamic changes of nitrogen and phosphorus losses in ephemeral runoff processes by typical storm events in Sichuan Basin, Southwest China. Soil Tillage Res. 2009, 105, 292–299. [Google Scholar] [CrossRef]
- Buchanan, B.P.; Archibald, J.A.; Easton, Z.M.; Shaw, S.B.; Schneider, R.L.; Walter, M.T. A phosphorus index that combines critical source areas and transport pathways using a travel time approach. J. Hydrol. 2013, 486, 123–135. [Google Scholar] [CrossRef]
- Wang, W.G.; Shi, H.B.; Li, X.Y.; Sun, Y.N.; Zhang, W.C.; Zhou, H. Effects of irrigation, fertilization and tillage based on improved Swat model on nutrient load and crop yield in WuliangSuhai Watershed. Lake Sci. 2022, 34, 1505–1523. (In Chinese) [Google Scholar]
- Li, C.; Guo, L.; Ma, Z.W.; Wu, S.; Wu, Z.H.; Ma, Y.H. Research on Reducing fertilizer efficiency and controlling nitrogen and Phosphorus loss in Wuhu City. Chin. Agric. Sci. Bull. 2022, 38, 100–105. (In Chinese) [Google Scholar]
- Tong, R.; Gao, L.; Pang, Z.; Gu, X.; Chen, X.; Zhang, J.; Wang, H.; Wang, S.; Shi, C.; Chen, X. Traceability of Nitrogen and Oxygen Isotopes in Nitrates with the Siar Model: Case Study on the Wangbeng Interval of the Huaihe River Basin. Pol. J. Environ. Stud. 2022, 31, 2255–2263. [Google Scholar] [CrossRef]
- Wang, S.; Wang, Y.; Wang, Y.; Wang, Z. Assessment of Influencing Factors on Non-Point Source Pollution Critical Source Areas in an Agricultural Watershed. Ecol. Indic. 2022, 141, 109084. [Google Scholar] [CrossRef]
- Wang, W.; Li, Z.B.; Shi, P.; Yan, Z.; Pan, B.Z.; Peng, L.; Ding, S.J.; Jing, L.; Bi, Z.L.; Wang, X.K. Vegetation restoration and agricultural management to mitigate nitrogen pollution in the surface waters of the Dan River, China. Environ. Sci. Pollut. Res. 2021, 28, 47136–47148. [Google Scholar] [CrossRef]
- Hou, L.; Zhou, Z.; Wang, R.; Li, J.; Dong, F.; Liu, J. Research on the Non-Point Source Pollution Characteristics of Important Drinking Water Sources. Water 2022, 14, 211. [Google Scholar] [CrossRef]
- Chu, Q.H. Role of fertilization technology in increasing grain yield in China and application prospects. China Agric. Sci. Technol. Her. 2013, 15, 12–19. [Google Scholar]
- Zhang, Q.; Shen, W.; Chu, C.; Shu, L.Z.; Zhou, X.J.; Zhu, S.N. Regulation of nitrogen forms on growth of eggplant under partial root-zone irrigation. Agric. Water Manag. 2014, 142, 56–65. [Google Scholar] [CrossRef]
- Xiao, L.L.; Sun, Q.B.; Yuan, H.T.; Lian, B. A practical soil management to improve soil quality by applying mineral organic fertilizer. Acta Geochim. 2017, 36, 198–204. [Google Scholar] [CrossRef]
- Rodney, B.T.; Luca, I.; Jim, V.R.; Daniele, M. Reducing contamination of water bodies from European vegetable production systems. Agric. Water Manag. 2020, 240, 106258. [Google Scholar]
- Yu, H.B.; Dai, G.J. Migration and transformation mechanism of nitrogen and phosphorus surface source pollution in ditches. South. Agric. 2018, 12, 103–105. (In Chinese) [Google Scholar]
- Nendel, C.; Melzer, D.; Thorburn, P.J. The nitrogen nutrition potential of arable soils. Sci. Rep. 2019, 9, 5851. [Google Scholar] [CrossRef]
- Long, H.Y.; Zhang, D.; Jin, J. Effects of soil texture on growth and development, biomass and soil fertility of Stylosanthes. Soil 2017, 49, 1049–1052. (In Chinese) [Google Scholar]
- Chen, H.L.; Hu, J.W.; Gou, M.M.; Wang, N.; Zhu, S.F.; Xiao, W.F.; Liu, C.F. Soil nutrient characteristics and fertility evaluation of Zigui Citrus Orchard in Hubei Province. Terr. Ecosyst. Conserv. 2022, 2, 21–31. (In Chinese) [Google Scholar]
- Chen, L.H.; Liu, L.Y.; Lv, X.; Li, Y.R. Relationship between rhizosphere soil microbial quantity and fertility of tea tree in different planting years. Fujian J. Agric. Sci. 2019, 34, 1433–1439. (In Chinese) [Google Scholar]
- Liu, L.; Huang, B.J.; Sun, J.; Guo, S.R.; Li, L.Q.; Guo, H.W. Relationship between microbial quantity, enzyme activity and soil fertility in greenhouse pepper continuous cropping soil. Soil Fertil. Sci. China 2013, 2, 5–10. (In Chinese) [Google Scholar]
- Francesco, T.; Stefaan, D.N.; Janjo, D.H.; Hanne, L.K. Nitrogen management of vegetable crops. Agric. Water Manag. 2020, 240, 106316. [Google Scholar]
- Ashraf, M.Y.; Hussain, F.; Akhter, J.; Gul, A.; Ross, M.; Ebert, G. Effect of Different Sources and Rates of Nitrogen and Supra Optimal Level of Potassium Fertilization on Growth, Yield and Nutrient Uptake by Sugarcane. Grown Under Saline Conditions. Pak. J. Bot. 2008, 40, 1521–1531. [Google Scholar]
- Baque, M.A.; Karim, M.A.; Hamid, A.; Hidaka, T. Effects of fertilizer potassium on growth, yield and nutrient uptake of wheat (Triticum aestivum) under water stress conditions. South Pac. Stud. 2006, 27, 25–35. [Google Scholar]
- Noack, S.R.; McBeath, T.M.; McLaughlin, M.J. Potential for foliar phosphorus fertilisation of dryland cereal crops: A review. Crop. Pasture Sci. 2010, 61, 659–669. [Google Scholar] [CrossRef]
- Ashraf, M.Y.; Akhtar, K.; Sarwar, G.; Ashraf, M. Role of the rooting system in salt tolerance potential of different guar accessions. Agron. Sustain. Dev. 2005, 25, 243–249. [Google Scholar] [CrossRef]
- Bastida, F.; Torres, I.F.; Romero-Trigueros, C.; Baldrian, P.; Větrovsky, T.; Bayona, J.M.; Alarcón, J.J.; Hernández, T.; García, C.; Nicolás, E. Combined effects of reduced irrigation and water quality on the soil microbial community of a citrus orchard under semi-arid conditions. Soil Biol. Biochem. 2017, 104, 226–237. [Google Scholar] [CrossRef]
- Yang, L.Z.; Zhou, X.P.; Wang, J.G.; Wang, D.J.; Shi, W.M.; Shi, L.X. Ecological interceptor ditch system and its effectiveness for non-point source pollution control in agricultural fields. J. Ecol. 2005, 11, 121–124. (In Chinese) [Google Scholar]


| Plot | 5Ca(NO3)2·NH4NO3·10H2O (kg/m2) | Ca(H2PO4)2 (kg/m2) | KCl (kg/m2) | Fertilizer Amount (kg/m2) |
|---|---|---|---|---|
| 1 | 0.012 | 0.009 | 0.009 | 0.03 |
| 2 | 0.024 | 0.018 | 0.018 | 0.06 |
| 3 | 0.036 | 0.027 | 0.027 | 0.09 |
| 4 | 0.048 | 0.036 | 0.036 | 0.12 |
| 5 | 0.060 | 0.045 | 0.045 | 0.15 |
| 6 | 0.072 | 0.054 | 0.054 | 0.18 |
| CK | 0 | 0 | 0 | 0 |
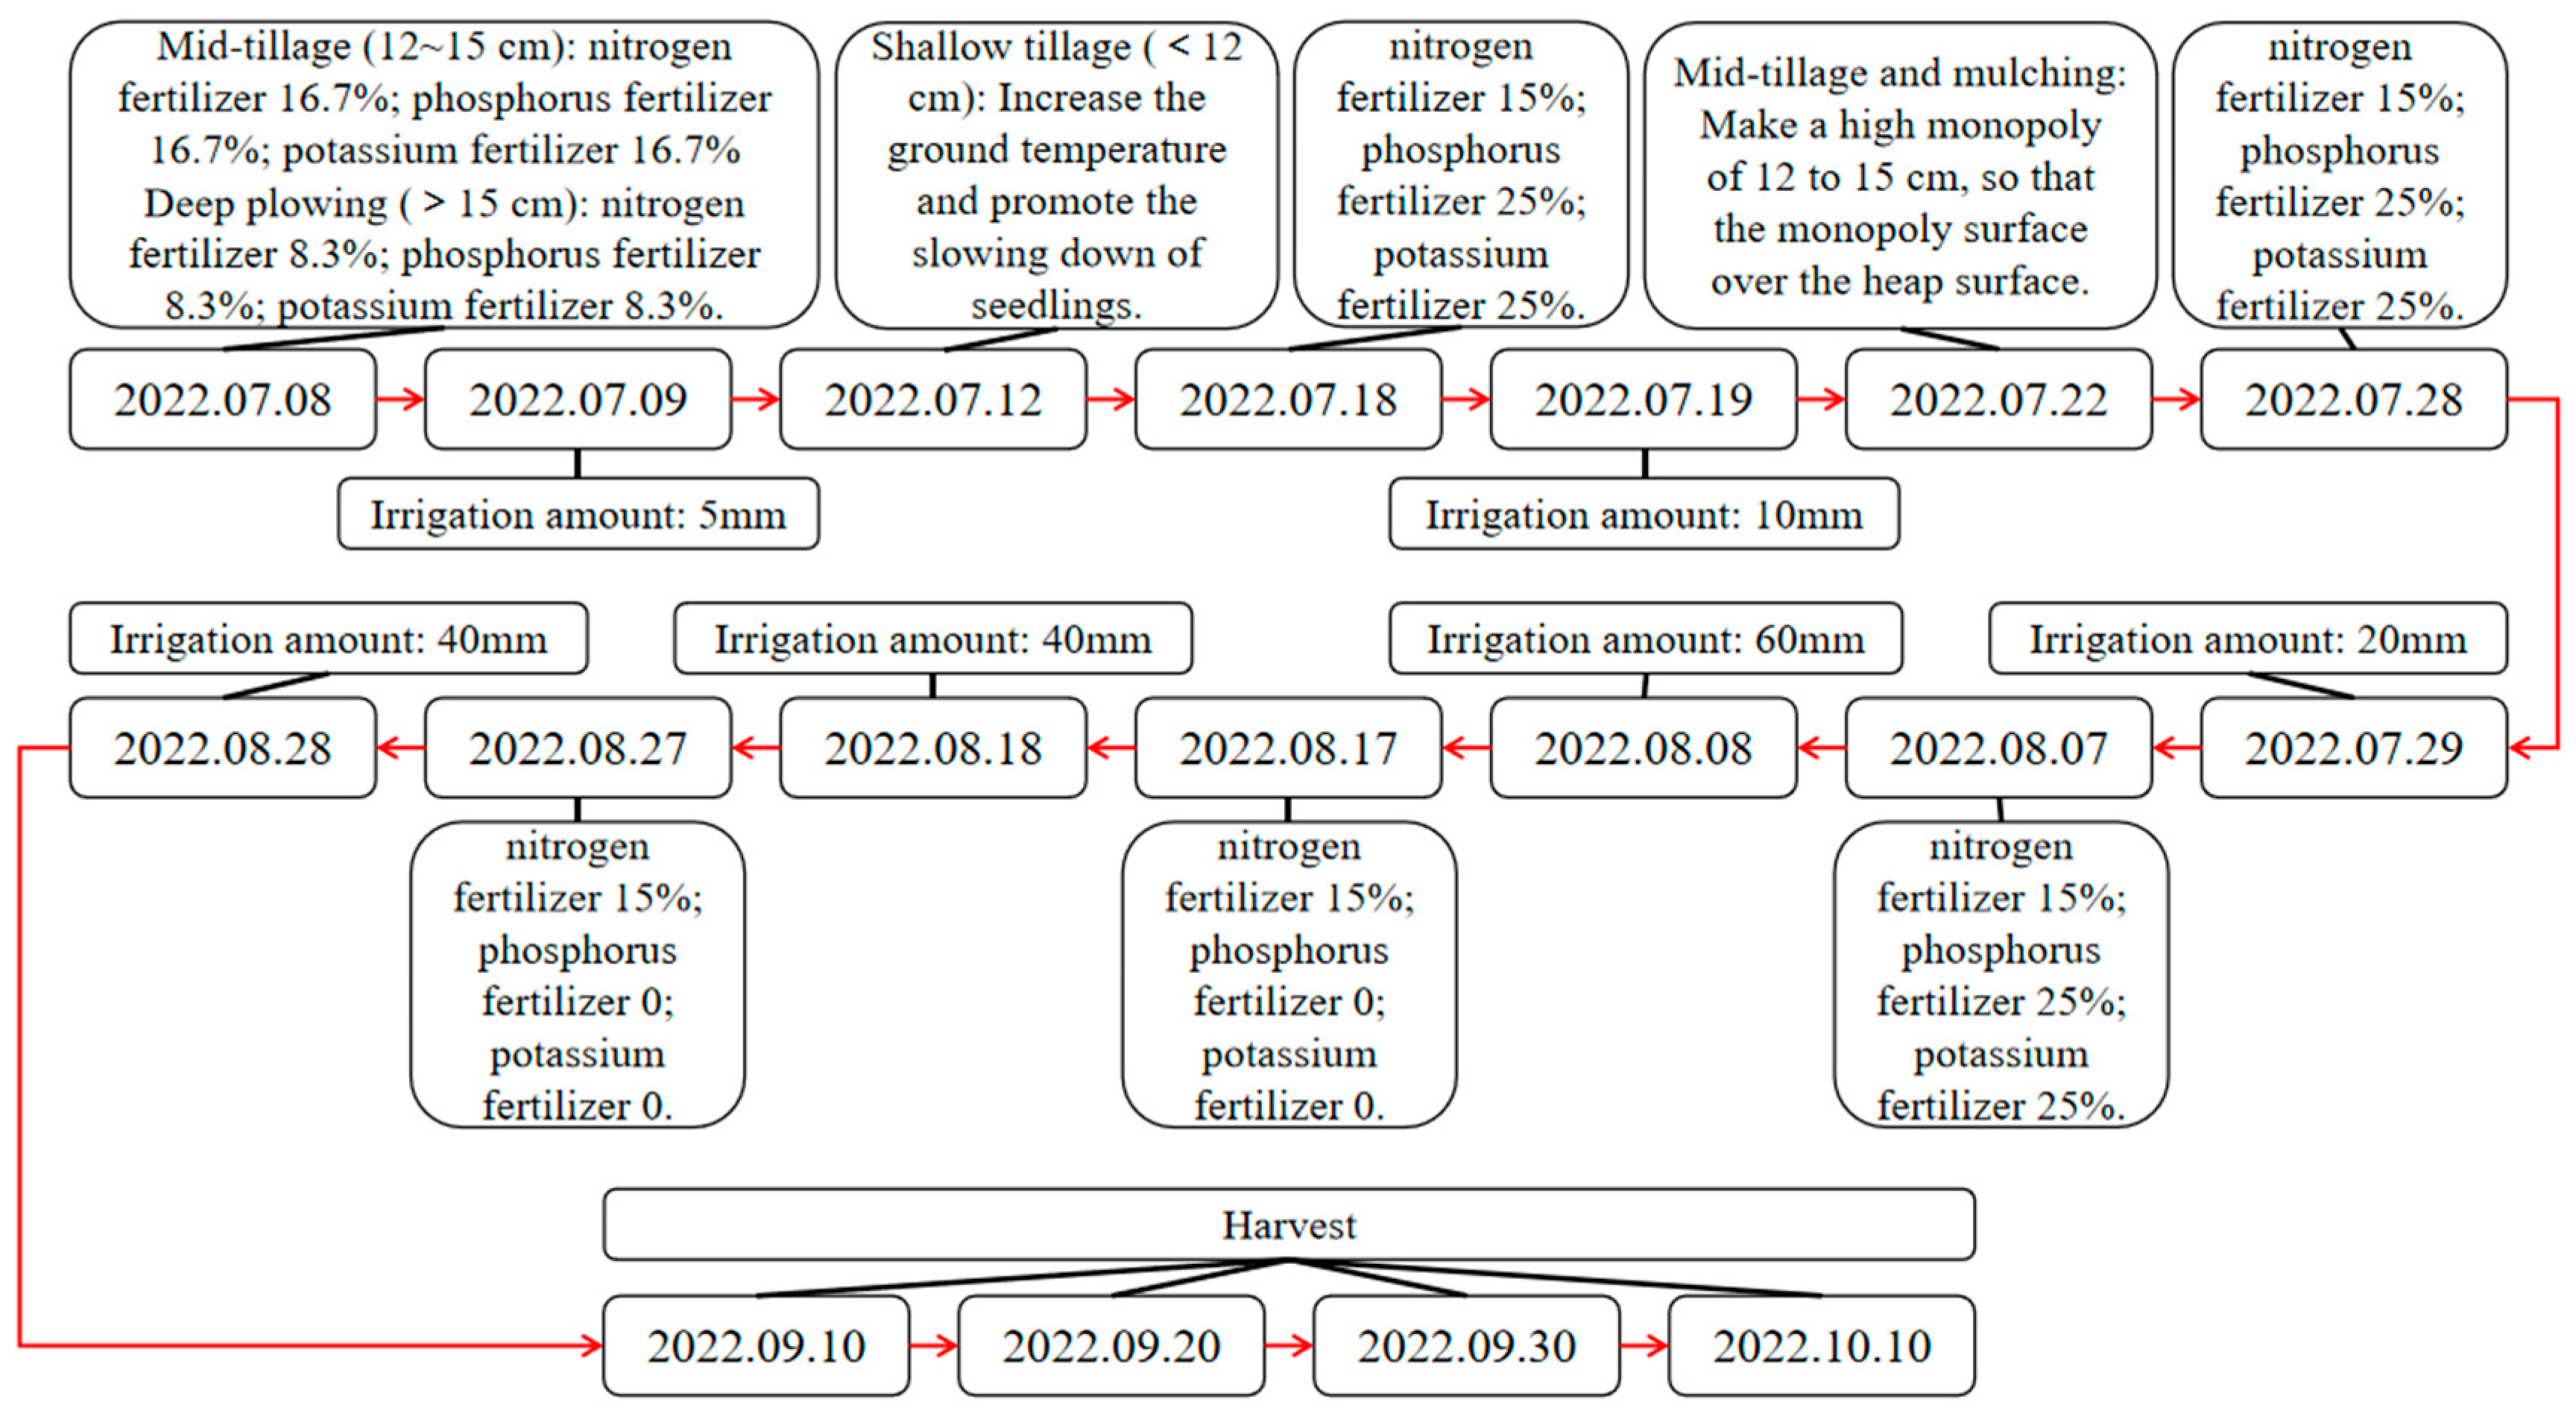
| Date | 7.09 | 7.19 | 7.29 | 8.08 | 8.18 | 8.28 |
| Growth Period | Planting | Slow seedling | Hardening of seedling | Flowering | Mature 1 | Mature 2 |
| Irrigation Amount | 5 | 10 | 20 | 60 | 40 | 40 |
| Reference | F-7.09 | F-7.19 | F-7.29 | F-8.08 | F-8.18 | F-8.28 |
| Indicator | Method |
|---|---|
| TN | KH2PO4 oxidation—ultraviolet spectrophotometry |
| PN | The difference between TN and DTN |
| DTN | 1. Filter with 0.4 μm filter hole 2. KH2PO4 oxidation—ultraviolet spectrophotometry |
| NO3−-N | Phenol disulfonic acid photometry |
| NO2−-N | N-1-Naphthylethylenediamine Dihydrochloride spectrophotometry |
| TKN | The difference between NO3−-N and NO2−-N |
| ON | The difference between TKN and NH4+-N |
| NH4+-N | Nessler’s reagent spectrophotometry |
| TP | 1. KH2PO4 digestion 2. Molybdenum-antimony resistance spectrophotometry |
| PO43− | 1. Filter with 0.4 μm filter hole 2. Mo-Sb Anti-spectrophotometer |
| PP | EDTA method |
| OP | 1. Extracted by chloroform several times 2. Gas chromatography |
| COD | Potassium dichromate method |
Disclaimer/Publisher’s Note: The statements, opinions and data contained in all publications are solely those of the individual author(s) and contributor(s) and not of MDPI and/or the editor(s). MDPI and/or the editor(s) disclaim responsibility for any injury to people or property resulting from any ideas, methods, instructions or products referred to in the content. |
© 2023 by the authors. Licensee MDPI, Basel, Switzerland. This article is an open access article distributed under the terms and conditions of the Creative Commons Attribution (CC BY) license (https://creativecommons.org/licenses/by/4.0/).
Share and Cite
Luo, P.; Xin, C.; Zhu, Y.; Liu, Y.; Ling, J.; Wang, T.; Huang, J.; Khu, S.-T. Effect of Rational Fertilizer for Eggplants on Nitrogen and Phosphorus Pollutants in Agricultural Water Bodies. Processes 2023, 11, 579. https://doi.org/10.3390/pr11020579
Luo P, Xin C, Zhu Y, Liu Y, Ling J, Wang T, Huang J, Khu S-T. Effect of Rational Fertilizer for Eggplants on Nitrogen and Phosphorus Pollutants in Agricultural Water Bodies. Processes. 2023; 11(2):579. https://doi.org/10.3390/pr11020579
Chicago/Turabian StyleLuo, Peiyuan, Changchun Xin, Yuanhao Zhu, Yang Liu, Junhong Ling, Tianzhi Wang, Jun Huang, and Soon-Thiam Khu. 2023. "Effect of Rational Fertilizer for Eggplants on Nitrogen and Phosphorus Pollutants in Agricultural Water Bodies" Processes 11, no. 2: 579. https://doi.org/10.3390/pr11020579
APA StyleLuo, P., Xin, C., Zhu, Y., Liu, Y., Ling, J., Wang, T., Huang, J., & Khu, S.-T. (2023). Effect of Rational Fertilizer for Eggplants on Nitrogen and Phosphorus Pollutants in Agricultural Water Bodies. Processes, 11(2), 579. https://doi.org/10.3390/pr11020579