Article

Microwave-Assisted Hydrothermal Carbonisation of Waste Biomass: The Effect of Process Conditions on Hydrochar Properties

by
Mathew C. Holliday
1,2,
Daniel R. Parsons
2 and
Sharif H. Zein
1,*
1
Department of Chemical Engineering, Faculty of Science and Engineering, University of Hull, Kingston upon Hull HU6 7RX, UK
2
Energy and Environment Institute, University of Hull, Kingston upon Hull HU6 7RX, UK
*
Author to whom correspondence should be addressed.
Processes 2022, 10(9), 1756; https://doi.org/10.3390/pr10091756
Submission received: 29 July 2022 / Revised: 17 August 2022 / Accepted: 19 August 2022 / Published: 2 September 2022
(This article belongs to the Section Environmental and Green Processes)

Abstract

:
Hydrochars are an alternative form of biochar produced by hydrothermal carbonisation (HTC), a potentially cheaper and greener method. In this paper, the effect of multiple variables on hydrochar properties was investigated. Waste biomass was converted to hydrochar via microwave-assisted hydrothermal carbonisation. The variables were temperature, solution ratio (water-biomass ratio), time, particle size, pH and acetone washing. The measured properties were yield, carbon, oxygen and ash content, higher heating value (HHV), carbon and energy recovery and dye and water adsorption. Feedstock significance was investigated using apple, wheat, barley, oat and pea straw. The investigation into this specific combination of variables and feedstock has not been done before. HTC increased carbon content (~60%), HHV (~24 MJ/kg) and water adsorption and reduced oxygen content and dye adsorption. Thermal analysis suggested hydrochars were not suitable for sequestration. Decreasing the solution ratio was the most significant factor in increasing yield, carbon recovery and energy yield. Increasing the temperature was the most significant factor in increasing carbon and decreasing oxygen content. This affected HHV, with higher temperatures producing a higher energy material, surpassing brown coal. Hydrochars produced at a high solution ratio, temperature and times showed the best carbonisation. Smaller particle size increased yield and carbonisation but increased ash content. Low solution pH increased carbon content, HHV and water adsorption but lowered yield, carbon recovery, energy yield, dye adsorption and oxygen and ash content. High pH increased ash content and dye adsorption but lowered yield, carbon recovery, energy yield and dye adsorption. Acetone decreased yield, carbon recovery, energy yield, carbon content and HHV but increased oxygen, ash content and dye and water adsorption. Barley biomass showed the highest yield and carbon recovery, and pea showed the highest energy yield and HHV. Apple showed the highest carbon content. All the hydrochars showed promise as solid fuels, a soil additive and a precursor for activated carbon but lacked high adsorption for pollutant adsorbents and stability for carbon sequestration.

Graphical Abstract

1. Introduction

Waste agricultural biomass is often left to rot in fields to function as a fertiliser or burnt as a solid fuel, however, this process results in the emission of CO2 and methane. Straw is typically discarded or burned, which will result in a waste of resources and serious environmental pollution [1]. This is part of the natural carbon cycle, but if it can be intercepted, it would result in a loss of carbon emissions. When waste biomass is left unused, it leaves an abundant source of highly useful carbon untapped. Currently, waste biomass is left unused because it is defined as a low-grade fuel and has many disadvantages such as high moisture content, low bulk density, low energy density, high volatile content, high oxygen content, high ash content, high alkali and alkaline earth metals and lack of fuel uniformity [1,2,3]. These factors make application and transportation not worth the time or effort. If these factors can be remediated, it will increase the viability of waste biomass.
Carbonisation will improve the value and application of waste biomass. Economic analysis has shown that upgrading biomass is economically feasible [4,5]. Pyrolysis is a popular method to produce biochar. Biochar has a very high carbon content, energy density and surface area [6,7]. This gives applications in carbon sequestration, fuel, soil additive or pollutant adsorbent. However, the process is energy-intensive, with high activation energy and excessive costs, requiring high temperatures of 300–1000 °C and an inert atmosphere [6,7,8]. Greenhouse gases are released which require complex equipment to recover and manage [9]. High moisture biomass cannot be used because it requires an intensive drying step or high enthalpy for vaporisation, increasing energy costs [10]. Developing nations may not have access to these processes but likely have abundant waste biomass and high demand for biochar application.
Hydrothermal carbonisation (HTC) is an alternative method to produce carbonaceous materials at lower temperatures than pyrolysis. Biomass is heated from 180–350 °C in an aqueous solution while sealed under autogenous pressure (2–10 MPa) [7,11]. Biomass is chemically destroyed in this process, resulting in CO2 gas, water mixed with simple organic compounds and a char-like material [12]. This material is called hydrochar (HC), to differentiate it from biochar. Since the pressure in the reactor increases with temperature, the water in the feedstock stays in the liquid phase, avoiding the energy-intensive evaporation stage [13]. Water acts as a solvent, reactant and catalyst for the hydrolysis reaction [14]. The main reaction pathways are devolatilisation, depolymerisation, decarboxylation, decarbonylation, dehydration, condensation, polymerisation of dissolved intermediaries, hydrolysis and aromatisation [2,11,15,16,17]. This process is useful for carbonising materials with a moisture content above 35%, which would not normally be used in pyrolysis, and allows the skipping of the energy-intensive drying step [18,19]. HTC has lower GHG emissions than pyrolysis. The HC particles are not prone to autoignition due to more oxygen-containing groups and have increased surface aromatisation [6,7,9,20,21,22]. Gases are dissolved in the water, reducing air pollution [3]. HTC improves the quality of biomass, improving carbon fixation efficiency, energy density, morphology and hydrophobicity, which increase stability and non-biodegradability [2,23]. The high temperatures and pressures destroy pathogens and pharmaceutically active compounds [13]. This means even dangerous waste materials could potentially be used as feedstock. Biomass can contain high levels of ash, but leeching by the HTC solvent can reduce ash content [23]. This method has a lower resource demand than biochars, making it especially useful in developing nations that have abundant waste biomass and demand for the product’s applications.
However, the process can take up to twelve hours or more to complete in some situations [11]. To improve the reaction time, microwaves (MW) can be used as the heating method. MW heating offers accelerated rates of reaction, better yields, higher purity, uniform and selective heating with lower energy consumption, greater reproducibility and cleaner synthesis routes [24,25]. MW sends energy directly to the subject, heating it internally with increased efficiency. The vaporisation of moisture within the biomass due to microwave heating will increase degradation and likely increase carbonisation [25]. MW reduce energy consumption and operational costs [8]. In another study, better carbonisation results were achieved using microwaves at a lower temperature and time than conventional heating [26]. MW does not provide enough energy to break chemical bonds or induce reactions [27] directly. This means there are no non-heating effects from MW and they are purely an alternative form of heating.
Biomass has different compositions of moisture, volatiles, hemicellulose, cellulose, lignin and ash. These compositions will affect the properties of HC. Recent studies have been performed on waste biomass such as corn stalk, biogas digestate, sewage sludge, watermelon peel, cotton stalk, rice straw, beet pulp and coffee grounds [2,10,16,19,20,23,28,29]. In this study the waste material from common agricultural products was used, wheat, oat, barley and pea straw and powdered apple. The production, area, yields and top two producers of the biomass feedstocks used in this study are displayed in a table in Table A1 [30]. Table A1 shows that the chosen biomass is produced in vast amounts worldwide and uses massive amounts of land. This makes them abundant and accessible feedstocks. In recent work, we used pea haulm as an effective biosorbent for dye in wastewater [31]. Therefore, the produced HC may show similar effectiveness. We have recently shown that carbonaceous material can be produced on an industrial scale from pea waste using microwave heating [32]. Wheat is the third most produced crop after maize and sugar cane [30]. For every tonne of wheat grain, one tonne of straw remains [33]. Oats and barley are primarily used for animal feed, but a large portion of the barley is used in the production of beer. Barley and wheat-derived HC has been investigated in other studies but not within the same context [9,33]. The chosen waste biomass feedstocks have not been investigated in this context previously and may offer new insights into their potential application.
The variables investigated in this study are process temperature, solution ratio, residence time, particle size, solution pH, acetone washing and feedstock. The properties of HC can change significantly depending on the process conditions. Higher temperatures and process times should degrade the biomass more, resulting in a lower yield and higher carbon content. Biomass particle size should affect the HC properties. A smaller size will have a larger surface area and reactivity. Acidic and basic solutions can affect the properties of HC. Acidic conditions should remove hemicellulose and basic should remove lignin [16]. HC is known for having poor surface area and porosity [16]. The solid–liquid interface forms a secondary char phase via aqueous phase re-polymerisation and condensation reactions [15]. During HTC, the more volatile components in the solution can create a tarry substance that blocks the pores of the HC, reducing its porosity. This layer causes HC to exhibit hydrophobicity [34]. Adsorption performance can be increased with surface modification but this can be complicated and expensive [35]. The application of acetone has previously removed the substance, which can be 2–3% of the total mass, revealing microspheres [36]. By washing the HC with acetone, this substance may dissolve, increasing the porosity.
The purpose of this paper is to answer the question: can quality HC be produced from waste biomass? What factors affect their properties and where can they be applied? To do this, (1) the effects of temperature, water–biomass ratio and process time are investigated; (2) then the effect of particle size is investigated; (3) then the effects of solution pH and acetone washing are investigated; (4) finally the effect of feedstock is investigated. The measured variables are HC yield, carbon, oxygen and ash content, carbon recovery, higher heating value, energy yield, and water and methylene blue (MB) dye adsorption. These qualities give the HC potential applications as a solid fuel, carbon sink, soil additive or pollutant adsorber. Carbon hydrogen and nitrogen (CHN) analyser, thermo-gravimetric analysis (TGA), Fourier-transform infrared spectroscopy (FTIR) and a scanning electron microscope (SEM) were used to characterise the HC and compare the physiochemical changes with the feedstock.

2. Materials and Method

2.1. Materials and Equipment

Pea haulm was collected from farms in The Yorkshire region, England. Apple, oat and wheat powder was supplied by EgoVita, Warsaw and did not require milling. Pure Pastures provided barley straw. The biomass was washed, dried and stored at 60 °C. It was milled using a Luvele Power-Plus 2200 W commercial blender to a fine powder. The powder was sieved by hand using Verder Scientific test sieves. The Milestone Ethos Ex Microwave Extraction System was used for microwave-assisted hydrothermal carbonisation with a maximum temperature of 220 °C. Citric acid, sodium hydroxide, acetone and MB were bought from Sigma Aldrich and used as received by dissolving in a deionised water solution. Solutions with a pH of 2, 4.5, 7, 9.5 and 12 were diluted as required and tested using a pH meter and pH strip. The dye mixtures were heated and agitated in a Stuart shaking incubator SI500. The mixtures were filtered using Whatman Grade 1 filter papers. The concentration of the dye was determined using ultraviolet-visible spectroscopy (UV-VIS), a Jenway 7310 spectrophotometer and a wavelength of 665 nm. The biomass and HC were analysed using SEM using a TM4000 plus tabletop microscope. FTIR was used using a Nicolet iS5 FTIR Spectrometer. A spectrum range of 400–4000 cm−1 was used with a resolution of 4 cm−1. TGA was also used using a TGA 4000 unit by Perkin Elmer, a temperature range of 25–900 °C was used with a thermal gradient of 10 °C/min under nitrogen. CHN analysis was performed using a Fisons Instruments EA 1108 CNH analyser.
Design Expert 13 was used to analyse the effects of process conditions using analysis of variance and surface response methodology. It is useful in experiments with more than two variables that might interact simultaneously. It can mathematically evaluate the data to identify relationships between the variable conditions and their significance. It can predict outcomes and summarise relationships using a multidimensional equation. It saves time processing the results manually and increases the accuracy of the analysis.

2.2. Method

The methodology was developed from previously used methods [8,23,37,38].
Apple powder was milled and then sieved to a size of <200 µm. About 1 g of biomass was then mixed with 10 or 50 mL citric acid solution with a pH of 2 in a microwavable sealed vessel. The vessel was heated to 180 or 220 °C at a rate of 20 °C/min, by applying up to 1000 W of microwave energy for 10 or 60 min. After heating, the contents were vacuum filtered with deionised water and washed with 50 mL of acetone until the filtrate turned clear and had a neutral pH. The residue was dried in an oven overnight at 60 °C and the yield was recorded. The runs were repeated at least three times and the yield was measured each time.
The effect of particle size was investigated by mixing 1 g of biomass of a size of <50 µm, 50–200 µm, and >200 µm with 10 mL of citric acid solution with a pH of 2. The mixture was heated to 220 °C for 60 min in the microwave and then vacuum filtered and washed with 50 mL of acetone until the filtrate turned clear and had a neutral pH. The residue was dried at 60 °C overnight and the yield was recorded. The runs were repeated at least three times and the yield was measured each time.
The effect of pH was investigated by mixing 1 g of <200 µm biomass with 10 mL of citric acid or NaOH solution with a pH of 2, 4.5, 7, 9.5 and 12. The mixture was heated to 220 °C for 60 min and then vacuum filtered and washed with 50 mL of acetone until the filtrate turned clear and had a neutral pH. The residue was dried at 60 °C overnight and the yield was recorded. The effect of acetone washing was investigated at a pH of 2, 7 and 12 by only washing with deionised water. The runs were repeated at least three times and the yield was measured each time.
Different biomass feedstocks were investigated using wheat, barley, oat and pea straw. About 1 g of <200 µm biomass was mixed with 10 mL citric acid solution with a pH of 2 and heated to 220 °C for 60 min. The product was vacuum filtered and washed with 50 mL of acetone until the filtrate turned clear and had a neutral pH. The residue was dried at 60 °C overnight and the yield was recorded. The runs were repeated at least three times and the yield was measured each time.
Table 1 shows the experimental runs. They are sectioned into different sets of experiments.
The materials were evaluated by using CHN, FTIR, SEM and TGA. CHN was used to find carbon and oxygen content. TGA was used to find ash content. The adsorption of MB was tested by mixing 10 µg of HC with a 20 mL 50 mg/L dye solution for 24 h at 30 °C. After the mixture was filtered, the dye concentration was analysed using UV-VIS spectrophotometry. The light absorbance was compared with a calibration curve to find the amount of dye adsorbed by the HC. The MB adsorption test was repeated at least three times per HC. Water adsorption was assessed by mixing 0.1 g of HC with 20 mL deionised water. Once dispersed, the mixture was filtered and the difference in the volume of water was measured. The water adsorption tests were repeated at least three times per HC.
To find the oxygen content (OC) (%) Equation (1) was used.
O C = 100 C C H C N C A C M C
where C C is the carbon content (%), H C is the hydrogen content (%), N C is the nitrogen content (%), A C is the ash content (%), M C is the moisture content (%).
To find the recovered carbon (RC) (%) Equation (2) was used.
RC = Y × CHC/CF
where Y is the yield (%), CHC is the carbon content of the HC (wt.%) and CF is the carbon content of the feedstock (wt.%).
The higher heating value (HHV) (MJ/kg) was found using the Dulong equation, seen in Equation (3).
HHV = 0.3383 × C + 1.422 × (H − O/8)
where C is the carbon content (wt.%), H is the hydrogen content (wt.%) and O is the oxygen content (wt.%).
The energy yield (EY) (%) was found using Equation (4).
EY = Y × HHVHC/HHVF
where HHVHF is the higher heating value of the HC (MJ/kg) and HVVF is the higher heating value of the feed (MJ/kg).
To find MB adsorption (MBA) (mg/g), Equation (5) was used.
A = V × (C0 − CE)/Ms
where V is the volume of dye solution (20 mL), C0 is the initial dye concentration (50 mg/L), CE is the equilibrium dye concentration (mg/L) and Ms is the mass of HC used (0.01 g).
To find the adsorption of water (WA) (g/g) Equation (6) was used.
WA = (W0 − WE)/Ms
where W0 is the initial mass of water (20 g) and WE is the mass of water after mixing and filtration.

3. Results and Discussion

The results for the HC produced under different solution ratios, process temperature and residence times is shown in a table in Table A2. It also shows the results of changing particle size, solution pH, acetone washing and biomass feedstock. It shows the effect of these factors on HC yield; carbon, hydrogen, nitrogen, oxygen and ash content; recovered carbon; HHV and energy yield; and MB and water adsorption. The results are compared with the C, H, N, O and ash content, HHV, MB and water adsorption of unmodified biomass. The data are scaled from white to green to make comparison easier. Each property column has an independent colour scale. White signifies the lowest value in the property column and the darkest green signifies the greatest value. The results of Table A2 are investigated in depth in later sections. HTC converts the biomass into a carbonaceous material. Depending on process parameters, yield ranges from 17–43% in apple biomass. The rest of the original mass is lost in the process liquid. Carbon content is increased by 3–18% in apple, 13% in wheat, 14% in barley, 13% in oat and 16% in pea biomass. HHV is improved due to the increased carbon content. HHV improves by 2–8 MJ/kg in apple biomass depending on the process parameters. HTC improves water adsorption and worsens MB adsorption. Runs 2 and 5 show the best carbonisation. Acidic and basic conditions lower yield but acidic conditions improve carbon content. Acidic conditions improved water adsorption but worsened MB adsorption. Washing with acetone reduces yield and carbon content but lowers MB and water adsorption.

3.1. Characterisation

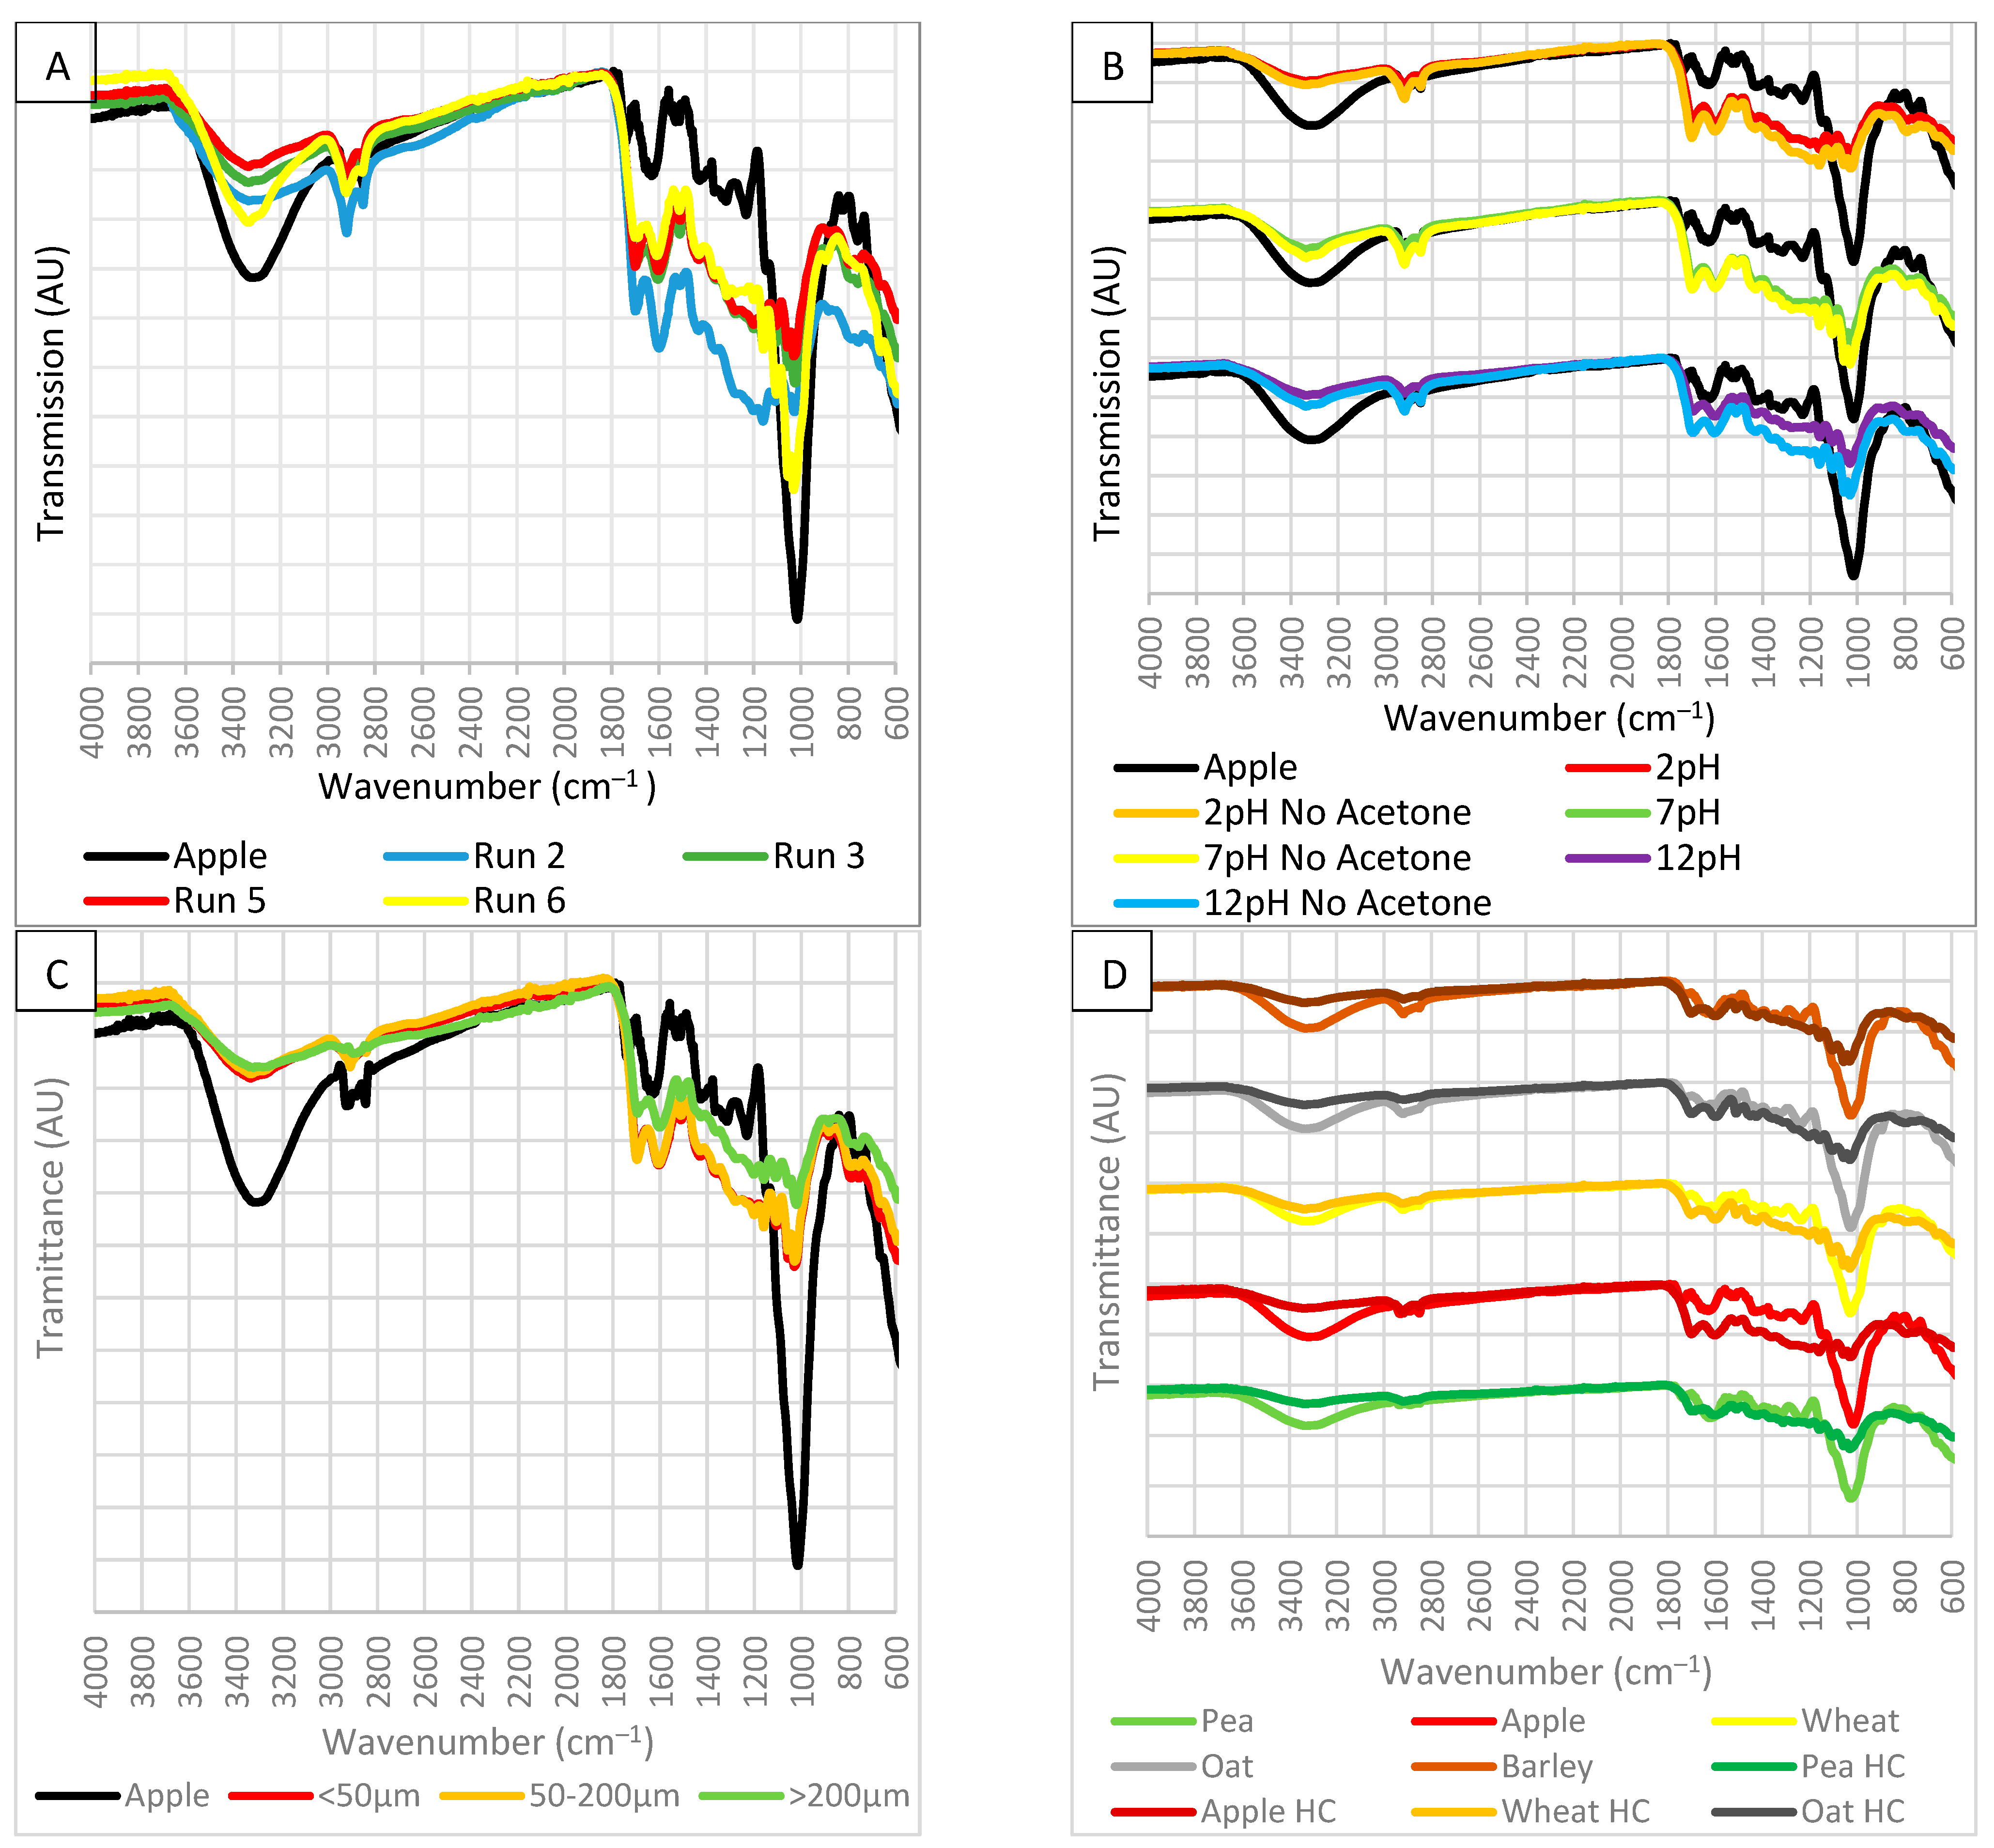
FTIR analysis was performed on all the HC to identify functional groups on the surface and how the peaks differ depending on the production parameters. A select few are shown in Figure 1.
The major peaks found in the FTIR spectrums are summarised in a table in Table A3. The spectrums were compared to biomass and HC spectrums found in other studies to help identify the functional groups. Figure 1A shows the effect of low and high temperature, high solution ratio and low processing time on the HC FTIR spectrum. These conditions are represented by runs 6, 5, 2 and 3, respectively. The broad peak at 3300 cm−1 representing O–H in carboxyl and hydroxyl groups decreases in intensity after HTC. This coincides with decarboxylation and dehydration reactions and decreasing oxygen content. The reduction in intensity is ranked run 5 > run 3 > run 2 > run 6 > apple. This suggests that process temperature has the most significant effect on decarboxylation and dehydration reactions. The peaks between 2900 and 2800 cm−1 representing C–H in methylene groups and aromaticity are similar in all spectrums but increase in run 2, suggesting solution ratio significantly affects aromatisation. The vapour pressure caused aromatisation, increasing aromaticity in the hydrochar [1]. Increasing the volume of solution will increase this pressure. HC show an increase in aromaticity and alkyl groups, which contribute to stability [19]. The peaks between 1700 and 1200 cm−1 representing C=C and C=O in carbonyl, carboxyl, aromatic rings, ester and ether groups are higher in all HC. The increase in C=C is due to decarboxylation reactions [1]. The peaks are similar in all HC spectrums except Run 2, suggesting a higher solution ratio enhances decarboxylation and dehydration reaction. The reduction in –OH and C=O are due to dehydration reactions, which also lower O/C and H/C ratios [1]. The peaks between 1200 and 1000 cm−1 representing C–O in ether, alcohol, phenol and ester decrease in intensity after HTC. This coincides with a decrease in oxygen content. The reduction in intensity is ranked run 5 > run 3 > run 2 > run 6 > apple, the same as the O–H group. The reduction in C–O peaks is due to the degradation of cellulose and hemicellulose [1]. This suggests the best HC have low-intensity O–H, C–O groups and high-intensity C=C, C=O, and C–H groups since this shows the best decarboxylation and dehydration reactions.
Figure 1B shows the effect of a solution with a low, neutral and high pH and acetone washing on the HC FTIR spectrum. They show a similar spectrum to the previous hydrochar. This suggests that changing the solution pH or washing with acetone did not modify the chemical structure of hydrochar. Acidic and neutral conditions show a higher intensity of C=C and C=O than basic conditions, suggesting basic conditions are detrimental to the HTC process and decarboxylation reactions. Neutral conditions showed the least reduction in C–O groups, with acid and basic showing the most reduction. This suggests acidic conditions were the best for enhancing HTC. Acetone washing was most significant in basic conditions. When HC is not washed with acetone, O–H and C–O show a higher intensity. However, not acetone washing also improved C=O and C=C intensity and aromaticity. The reduction in all peaks suggests that the acetone dissolved volatile components, refining the HC. In other studies, acetone washing reduced aromatic ester C–O, C=O and chain C–H groups suggesting the removal of fatty acids, decreased alkyl groups and increased aromatic groups [36,39,40]. It has been reported that washing with acetone causes the enhancement of aromatic structures and dissolves fatty acids [40].
Figure 1C shows the effect of particle size on the HC FTIR spectrum. They show a similar spectrum to the other hydrochar. The particle sizes of <50 µm and 200–50 µm show a near identical spectrum suggesting no further enhancement is achieved using a size lower than 200 µm. All particle sizes show a similar reduction in O–H and C–H groups. <50 µm and 200–50 µm show the greatest increase in C=C and C=O groups and the greatest intensity in C–O groups. This suggests particles >200 µm reduce decarboxylation and dehydration reaction effectiveness. This is due to an increased specific surface area in smaller particles, which improves reactivity. In another study, a particle size fraction of <0.25 mm and 0.5–0.25 mm had nearly identical chemical structures [37].
Figure 1D shows the effect of biomass feedstock on the HC FTIR spectrum. The biomass spectrums are nearly identical. The HC spectrums are similar to previous HC, suggesting feedstock does not modify the chemical structure of HC. All the biomass shows a similar reduction in O–H groups, except wheat. Barley and oat showed a reduction in C–H groups and therefore reduced aromaticity. Only apple showed an increase in C=C and C=O groups. All the biomass showed similar reductions in C–O groups.
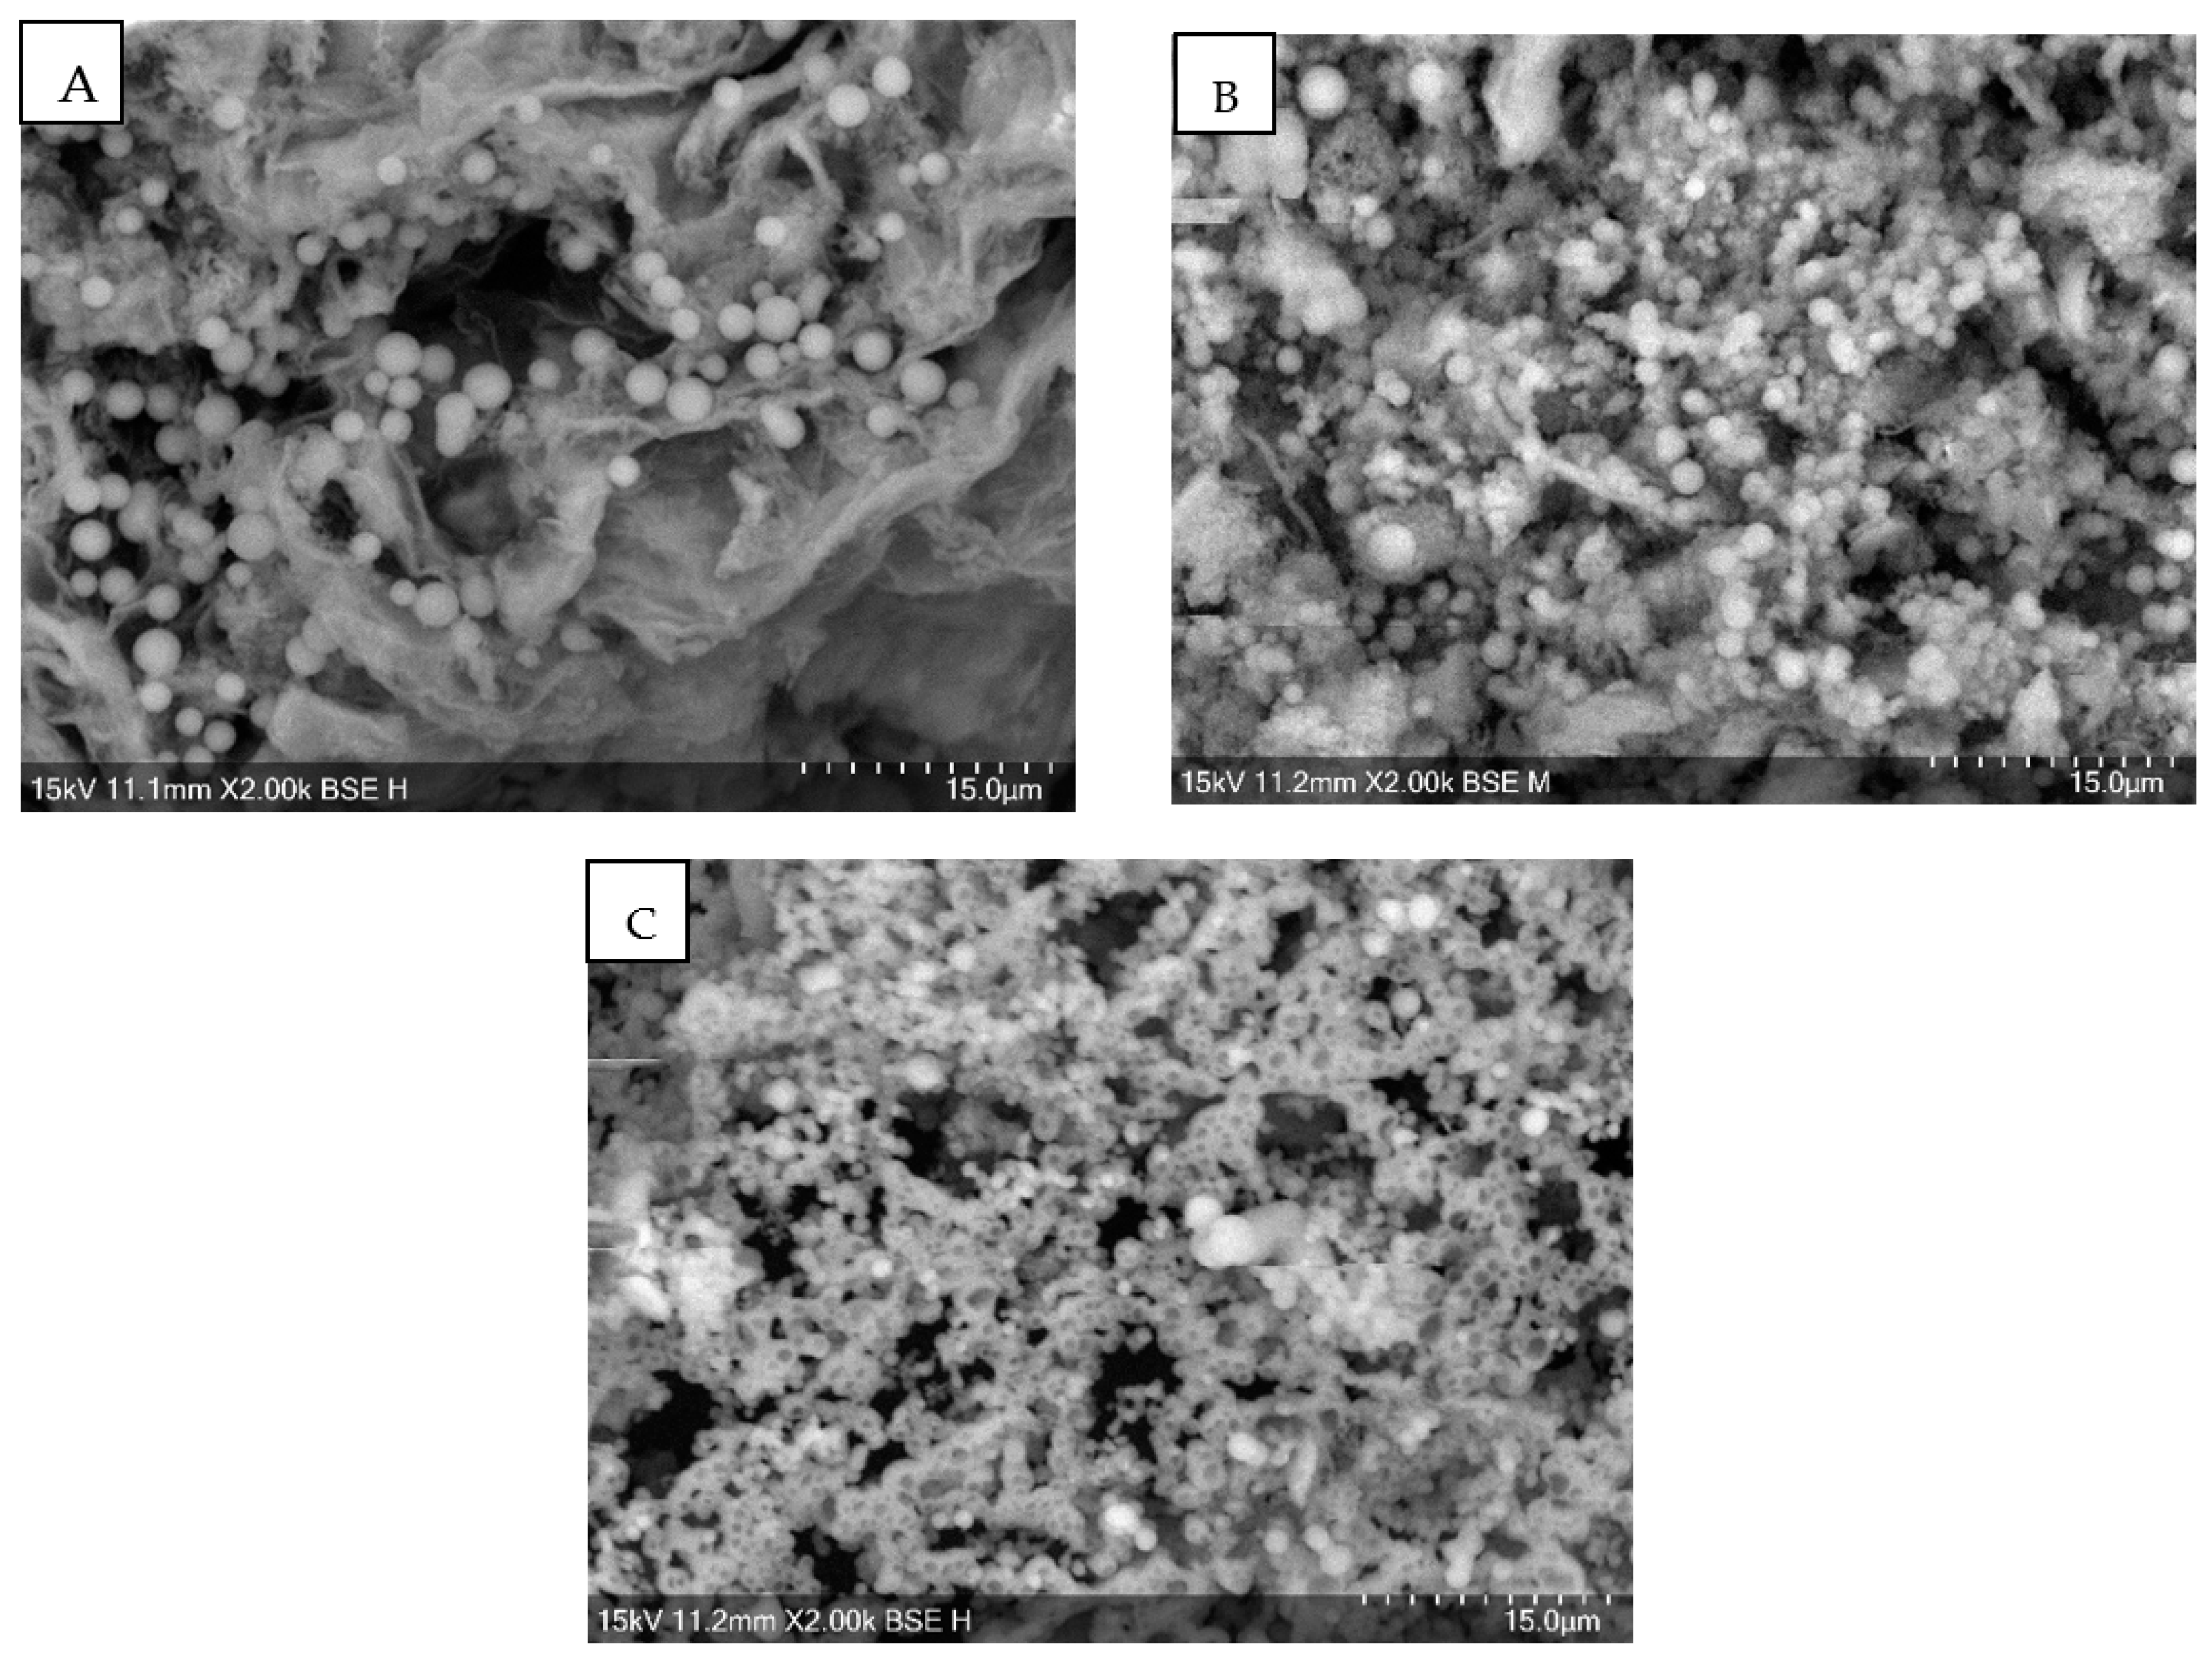
SEM images were taken of every hydrochar. Almost all showed course textures, but none showed a high porosity. Some showed microspheres on the surface of a size of 5–1 µm. Figure 2 shows SEM images of runs 1, 2, and 3, respectively.
Microspheres have appeared in other studies on HC [8,41]. There are no common factors with these runs other than a pH of 2 and acetone washing, suggesting process conditions play no significant part in their development. HTC occurs via soluble intermediates, resulting in carbon spheres [37]. Acid pre-treatment has resulted in carbon microspheres previously [8]. The addition of acid removes hemicellulose, leaving concentrated cellulose and lignin. Lignin improves microspheres, which can block pores and gaps, reducing porosity and surface area [16]. It has been suggested that the microspheres are degraded cellulose [9]. It has been concluded that the addition of acid-induced hydrolysis of cellulose into oligomers and glucose which then underwent dehydration, condensation, and polymerisation reactions to form microspheres of a larger diameter than just water [36]. It has been reported that the addition of acid and microwave heating increased porosity, increasing surface area and pore volume [26].
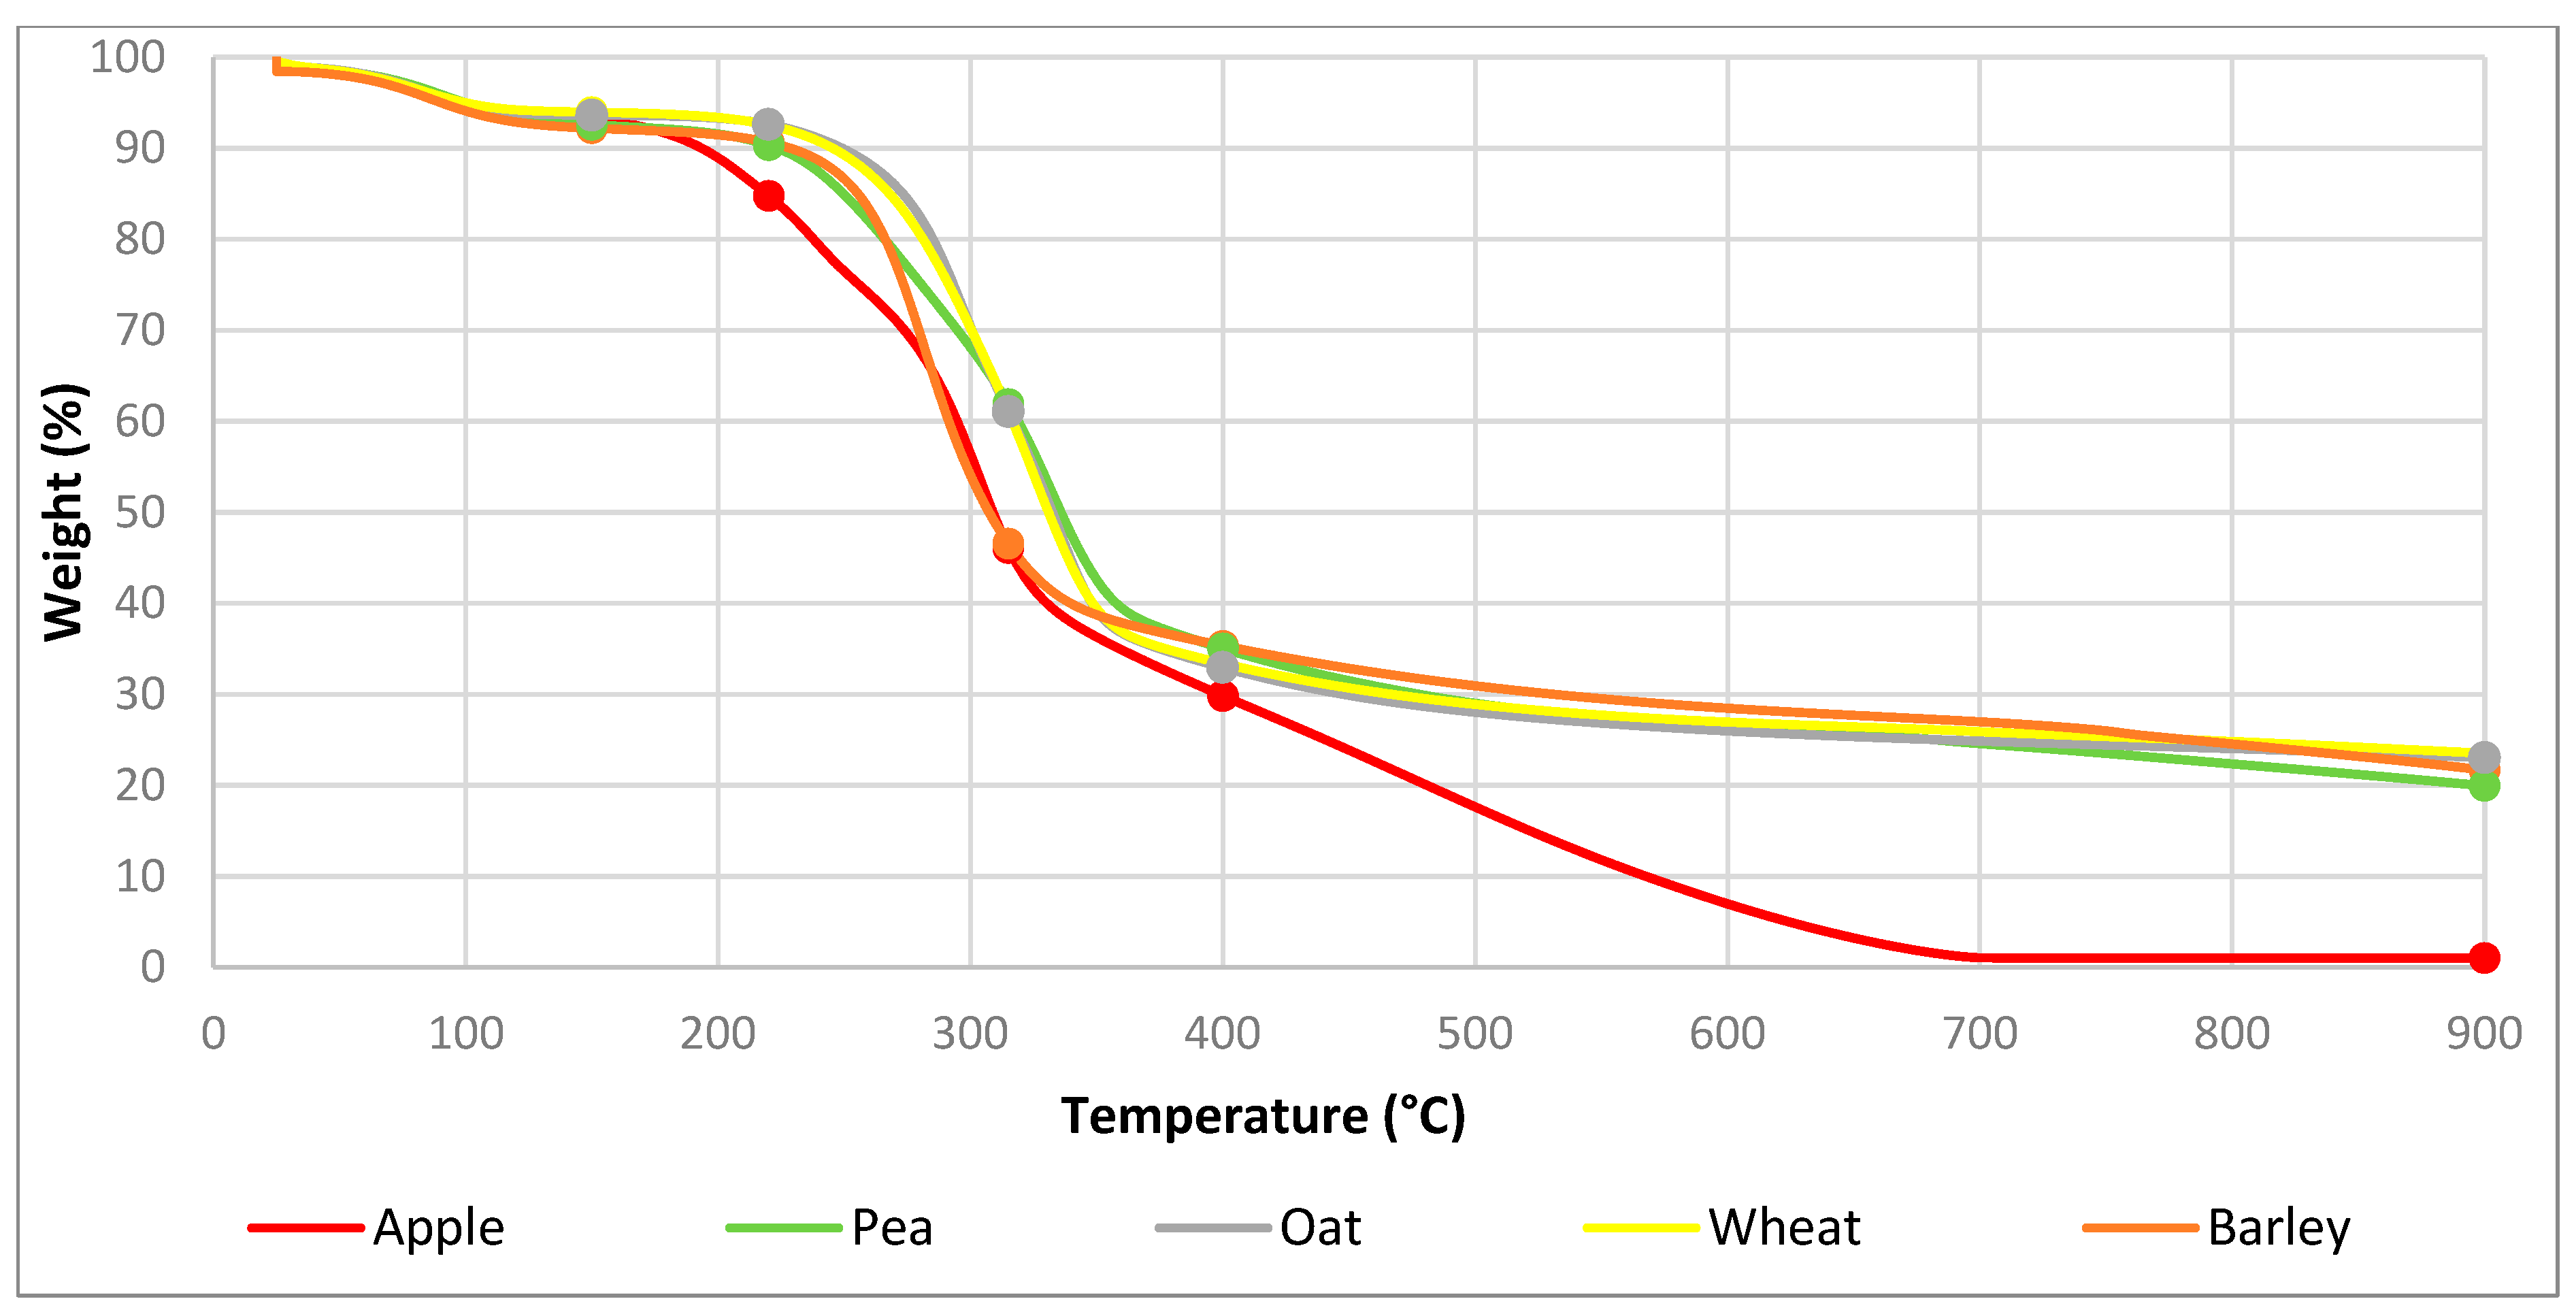
TGA was performed on the biomass feedstocks to identify the key components. Biomass usually has a composition of 15–30% hemicellulose, 40–60% cellulose and 10–25% lignin [14]. This changes depending on the function of the biomass. It has been noted that hemicellulose degrades at 220–315 °C, cellulose degrades at 300–400 °C and lignin degrades over a range of 150–900 °C [42]. These values were compared with the TGA data and ash content to find the composition of the biomass. Ash content was found by performing TGA in oxygenated conditions. The TGA spectra for each biomass and the component degradation temperature points can be seen in Figure 3.
The mass loss at certain temperatures was used to identify the composition of the feedstocks. Since the mass loss of hemicellulose and cellulose is indistinguishable, they were represented together as holocellulose. The compositions are summarised in Table 2.
Where B is biomass, HL is holocellulose, L is lignin, M is moisture, V is volatiles, FC is fixed carbon and A is ash. The data are scaled from white to green to make comparison easier. Each composition column has an independent colour scale. White signifies the lowest value in the column and the darkest green signifies the greatest value. Oat and wheat showed the highest amount of holocellulose, pea, barley and apple biomass showed the least. Conversely, apple showed the highest lignin content, followed by pea, barley and oat. Wheat showed the least amount of lignin. Barley had the highest moisture content, followed by pea and apple. Wheat and oat showed the lowest moisture content. Apple had the greatest number of volatiles and no fixed carbon, leaving only a small amount of ash. Pea had the next highest number of volatiles, followed by oat and barley. Wheat had the least number of volatiles. Oat had the greatest amount of fixed carbon, followed by wheat and barley. Pea had the lowest fixed carbon after apple. Wheat had the highest ash content, followed by barley and pea. Oat had the least ash after apple. Apple had the highest ‘as received’ carbon content, followed by oat, wheat, pea and barley. Apple had the highest ‘as received’ oxygen content, followed by oat and then wheat, barley and pea. Wheat and oat had the highest carbon content, and pea, barley and apple had the lowest carbon content on a dry ash-free basis. Apple, barley and oat had the highest oxygen content on a dry ash-free basis, followed by pea and then wheat.
There is a relationship between biochar degradability and thermal recalcitrance, which are carbon mineralised after 1 year and the temperature when 50% of the hydrochar is lost to oxidation, respectively [43]. Equation (7) was used to find the thermal recalcitrance using graphite as a reference, with 50% conversion at 886 °C.
R 50 , hydrochar = T 50 hydrochar T 50 , graphite  
where, R 50 , hydrochar is the thermal recalcitrance of hydrochar, T 50 , hydrochar is the temperature at 50% degradation of hydrochar by oxidation and T 50 , graphite is the temperature at 50% degradation of graphite by oxidation. Recalcitrance between 0.7 and 0.5 signifies a material with intermediate carbon sequestration potential, and a value less than 0.5 signifies a carbon sequestration potential similar to biomass [43]. The recalcitrance values are displayed in a table in Table A4. The data is scaled from white to green to make comparison easier and ordered with the most stable at the top. Each variable and property column has an independent colour scale. White signifies the lowest value in the column and the darkest green signifies the greatest value. The results of Table A4 suggest the produced hydrochar has low carbon sequestration potential. However, trends are noticeable; a higher temperature was most significant in increasing the recalcitrance value, followed by residence time. The solution ratio did not have a significant effect on the value. A higher temperature would likely increase thermal stability to the point of intermediate sequestration, but this will also likely reduce yield significantly. Hydrochar has a higher number of oxygenated groups than biochar, which increases reactivity and thus degradability [44]. The hydrophilicity of HC may facilitate the microbes and enzymes on the HC surface [45]. In another study, the choice of biomass feedstock affected carbon degradability [45]. A high degradability coincides with high hydrophilic functional groups, high O/C and H/C ratios, low C/N ratio and low lignin content [45].

3.2. Effect of Process Temperature, Solution Ratio and Residence Time on Hydrochar Properties

The effect of process temperature (180–220 °C), water-biomass ratio (10–50 mL/g) and residence time (10–60 min) on yield, carbon, oxygen and ash content, HHV, and carbon recovery, energy yield, MB and water adsorption were investigated. 
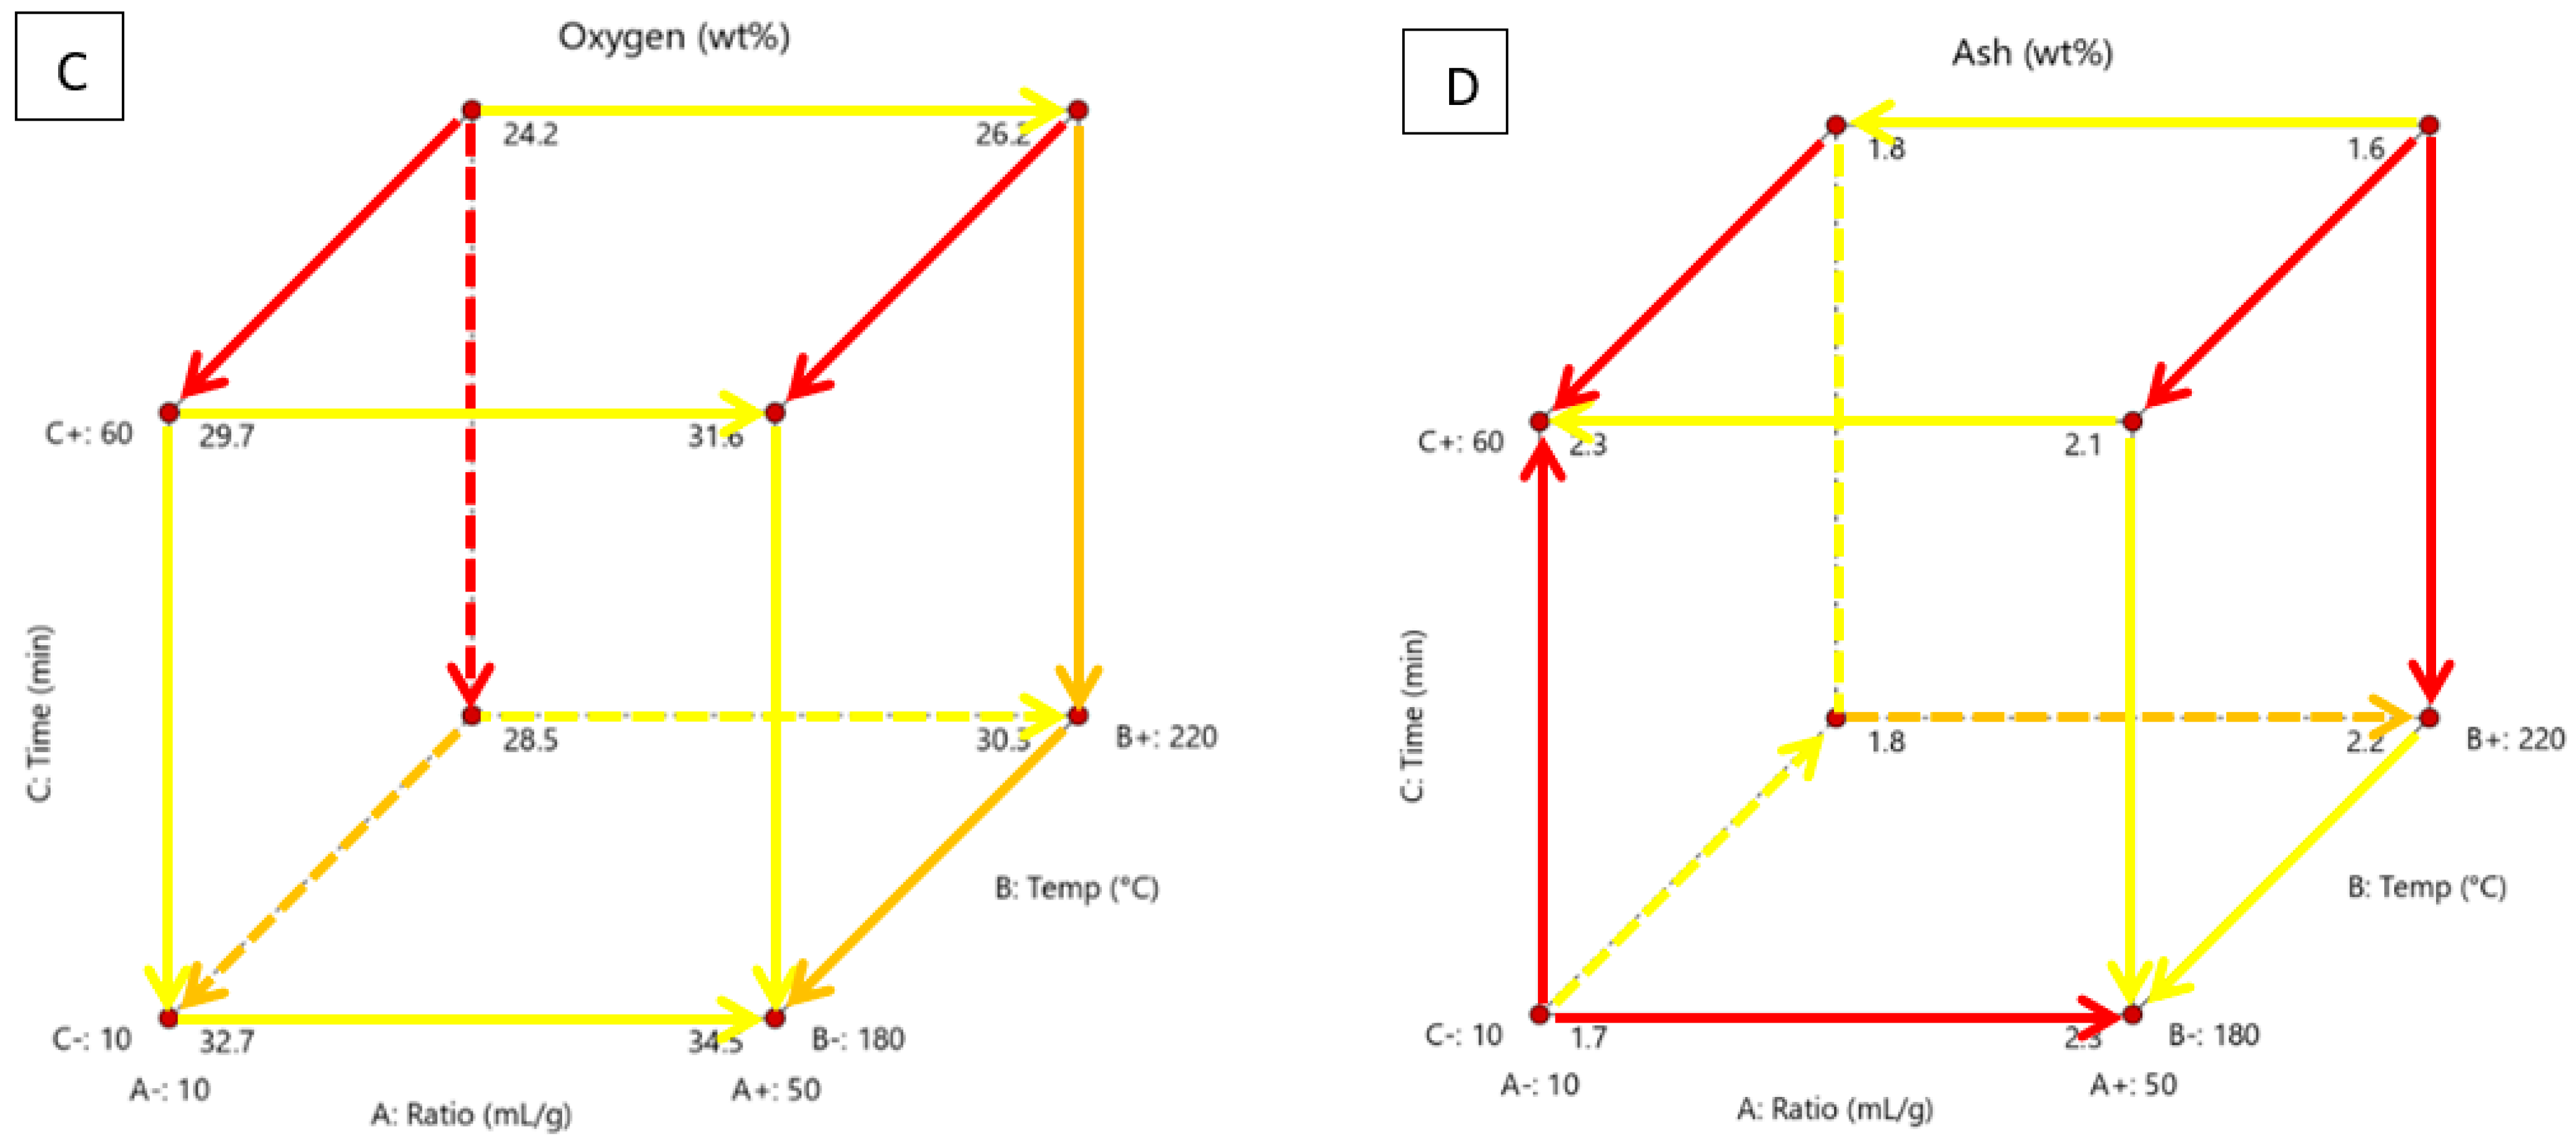
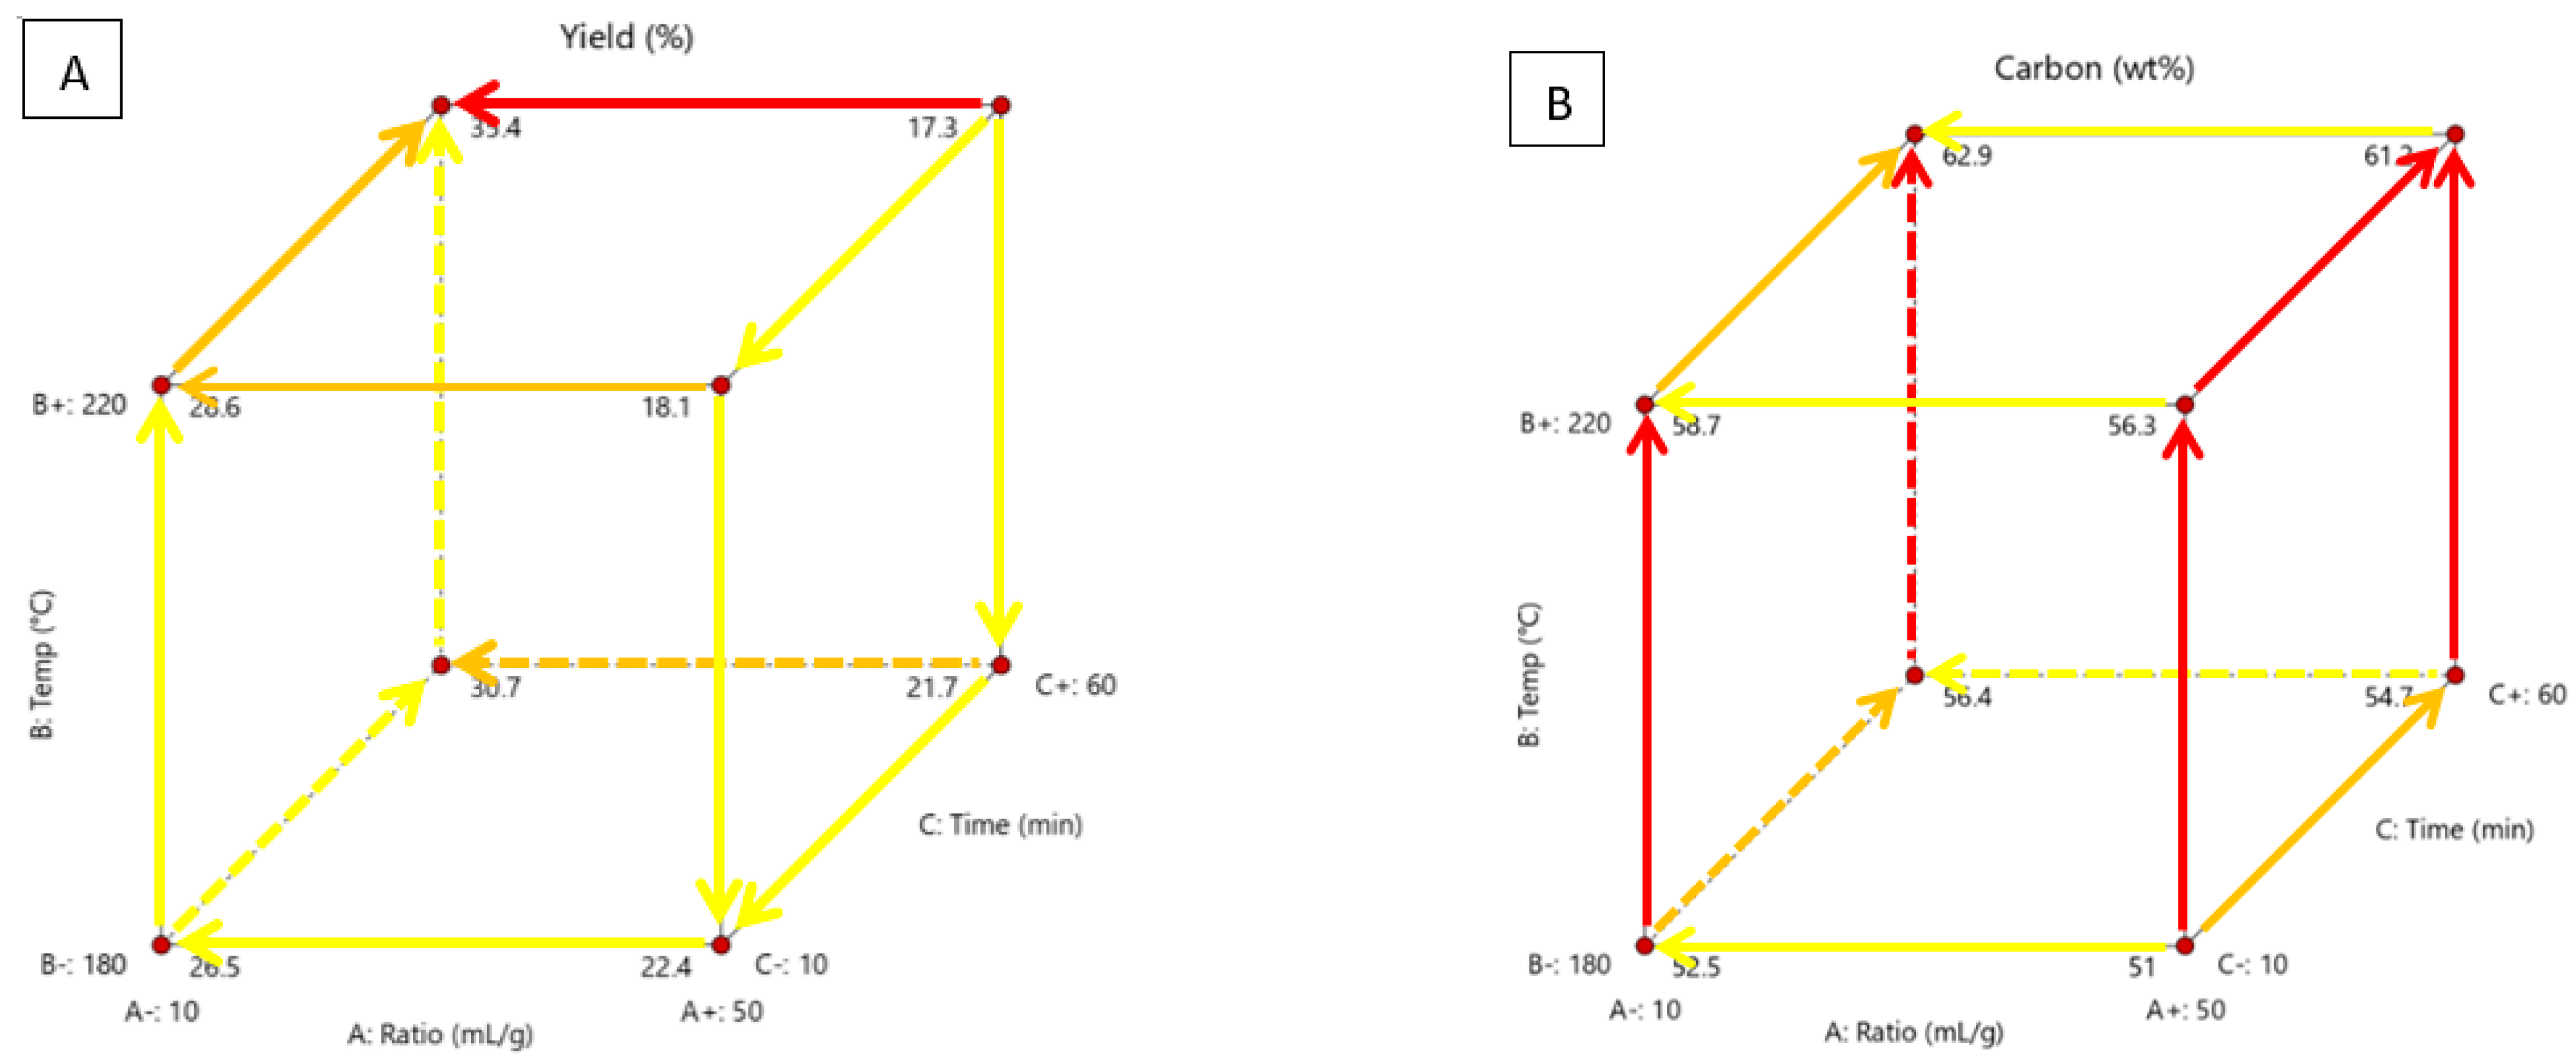
Figure 4 shows the effects of these variables on yield, carbon, oxygen and ash content in a cubic form and highlights the significant relationships and directions of development.
The arrows point in the direction of positive development in the property, showing how changes in a variable have an effect. The colours show the impact of the variable, with red showing the most difference between property values, orange showing an intermediate amount and yellow showing little difference. Yield is important because it determines the amount of product made and how much material is lost. If the yield is too low, producing the material may not be profitable. The method of solid separation will affect yield. It has been found in another study that Büchner filtration is more effective than folded filter paper [28]. In this study, vacuum filtration with a Büchner funnel was used. Design Expert deemed the solution ratio the most significant factor, the temperature the least significant and there are two-factor relationships, seen in the table in Table A5. According to Figure 4A, yield is highest with a low solution ratio, high temperature and high residence time. The yield is the lowest with a high solution ratio, temperature and time. This shows that the effect of temperature and time is insignificant. The solution ratio only has a significant effect at high temperatures and residence time. Time only has a significant effect at high temperatures and low solution ratios. At shorter residence times, the biomass may only degrade thermally and not fully convert. Longer times may enhance the polymerisation reaction of intermediaries, increasing yield. Another study found that processing time has little significance on the yield [11]. From the yield results and FTIR data, it can be assumed that an increased amount of solution enhances biomass hydrothermal decomposition. Higher solution ratios of water act as a solvent, increasing feedstock solubility and intermediate products, producing less char [46]. At 100 °C, water-soluble components are dissolved. At 150 °C, hydrolysis starts and carbonisation starts at 180–250 °C [14]. The main mass loss comes from the degradation of hemicellulose over a temperature of 180 °C [33]. Hemicellulose thermally decomposes at 180 °C and cellulose at 200 °C to form monomers and oligomers while lignin decomposes at 220 °C and remains mostly untouched [11,14,18,23]. Higher temperatures offer more heat for breaking bonds in the biomass during HTC [2]. Temperatures below 210 °C do not alter the properties of cellulose and lignin [37]. This means there will be a rapid reduction in yield as these three major components degrade at high temperatures. It is also known that high temperatures enhance hydrolysis, dehydration and decarboxylation reactions which lead to mass loss [2,11,28]. Hydrolysis is the rate-limiting step, which can be increased with higher temperatures, but this increases liquid and gas yields [37]. In another study, it was found that a longer residence time and a high temperature had the highest yield, similar to the current study [8]. In other studies, higher temperatures and times resulted in a reduced yield [2,6,11,12,14,17,18,23,28,33,38,46,47].
A higher carbon content means the material is more carbonaceous such as coal or biochar. A higher percentage makes it a valuable precursor for activated carbon or fuel source. It affects factors such as carbon recovery, HHV and energy yield. Design Expert deemed process temperature as the most significant factor, the solution ratio was the least significant with no two-factor relationships, as seen in Table A5. According to Figure 4B, carbon content is highest at a low solution ratio, high temperature and high time. Carbon content is lowest at a high solution ratio, low temperature and low time. The temperature has a significant effect in every scenario. Time has the most significant effect at high temperatures and high solution ratios. Hemicellulose decomposes at 180 °C and cellulose hydrolyses at 130–230 °C, lignin has a lower decay rate and will not completely hydrolyse until 600 °C [17]. Temperatures above 210 °C alter the properties of cellulose and lignin [37]. At higher temperatures, cellulose and hemicellulose, which are oxygen-rich will degrade leaving a carbon-rich lignin structure. Increased temperature will enhance dehydration and decarboxylation reactions, decreasing hydrogen and oxygen content but enhancing carbon content [17]. Similar trends were found in other studies [2,6,23,28]. However, another study found that temperatures above 220 °C reduced the carbon content [18]. This could be because carbon-rich components began to degrade at higher temperatures. Reducing total carbon content. This occurrence could not be investigated in the present study due to the limitations of the equipment, but is a possible area for future research. Another study found that biomass was not fully carbonised after 4 h at 230 °C [6]. This is likely because they used conventional and not microwave heating, which is more effective.
According to Figure 4C, the oxygen content is highest at a high solution ratio, low temperature and time. Oxygen content is lowest at a low solution ratio, high temperature, and high time. This is the opposite of the effects on carbon content. The temperature was the most significant factor, followed by the processing time and solution ratio. Design Expert found two-factor relationships, seen in Table A5. According to Figure 4C, the solution ratio has low significance in every scenario. Temperature is most significant at longer times. Time is most significant at higher temperatures. Hemicellulose and cellulose are oxygen-rich and are the first to hydrolyse. The properties of cellulose and lignin will alter above 210 °C and the dehydration and decarboxylation reactions will be enhanced, decreasing hydrogen and oxygen content but enhancing carbon content [17,37]. The same carbon and oxygen content trends were found in other studies on the HTC of biomass [11,29,33]. An oxygen reduction implies a reduction in the oxygen-containing functional groups, such as carbonyl and hydroxyl groups, which enhances physical stability [19].
Ash content is made up of non-organic materials like potassium, calcium and magnesium. If the ash content is too high, it can negatively affect the soil. Water dissolves the metal salts and causes the soil pH to increase, negatively affecting fertility. High sodium and potassium content can also cause fouling and corrosion in boilers and lower melting temperatures [11,18]. Lower ash fuel is preferred. Design Expert deemed temperature the most significant factor, time the least significant and found two-factor relationships, seen in Table A5. According to Figure 4D, the solution ratio is only significant at low temperatures and time. At a high time, a higher solution ratio causes ash to decrease and at a low time a higher solution ratio causes ash to increase. Temperature is only significant at longer times. Ash is higher at low temperatures. Time is significant at low solution ratio and temperature and high solution ratio and temperature. At a low solution ratio, increased time causes ash to increase. At a high solution ratio, increased time causes ash to decrease. Biomass with high ash content will produce char with high ash since it is not thermally degraded. HTC can reduce ash content. Subcritical water from HTC acts as a reacting medium and the soluble sodium and potassium can be leached into the liquid phase, reducing ash content [11,23]. The reduction of ash by HTC was found in other studies on biomass, but increasing process temperature and time caused ash content to increase [2,11,17,18,28,29,48]. This is likely because the rate of organic degradation is increased at higher temperatures and process times. At increased temperature and time, the hydrochar exhibits a porous structure and increased surface area which re-adsorbs the inorganics previously dissolved in the liquid [1]. Potassium salts are soluble in water, whereas calcium is insoluble [1].
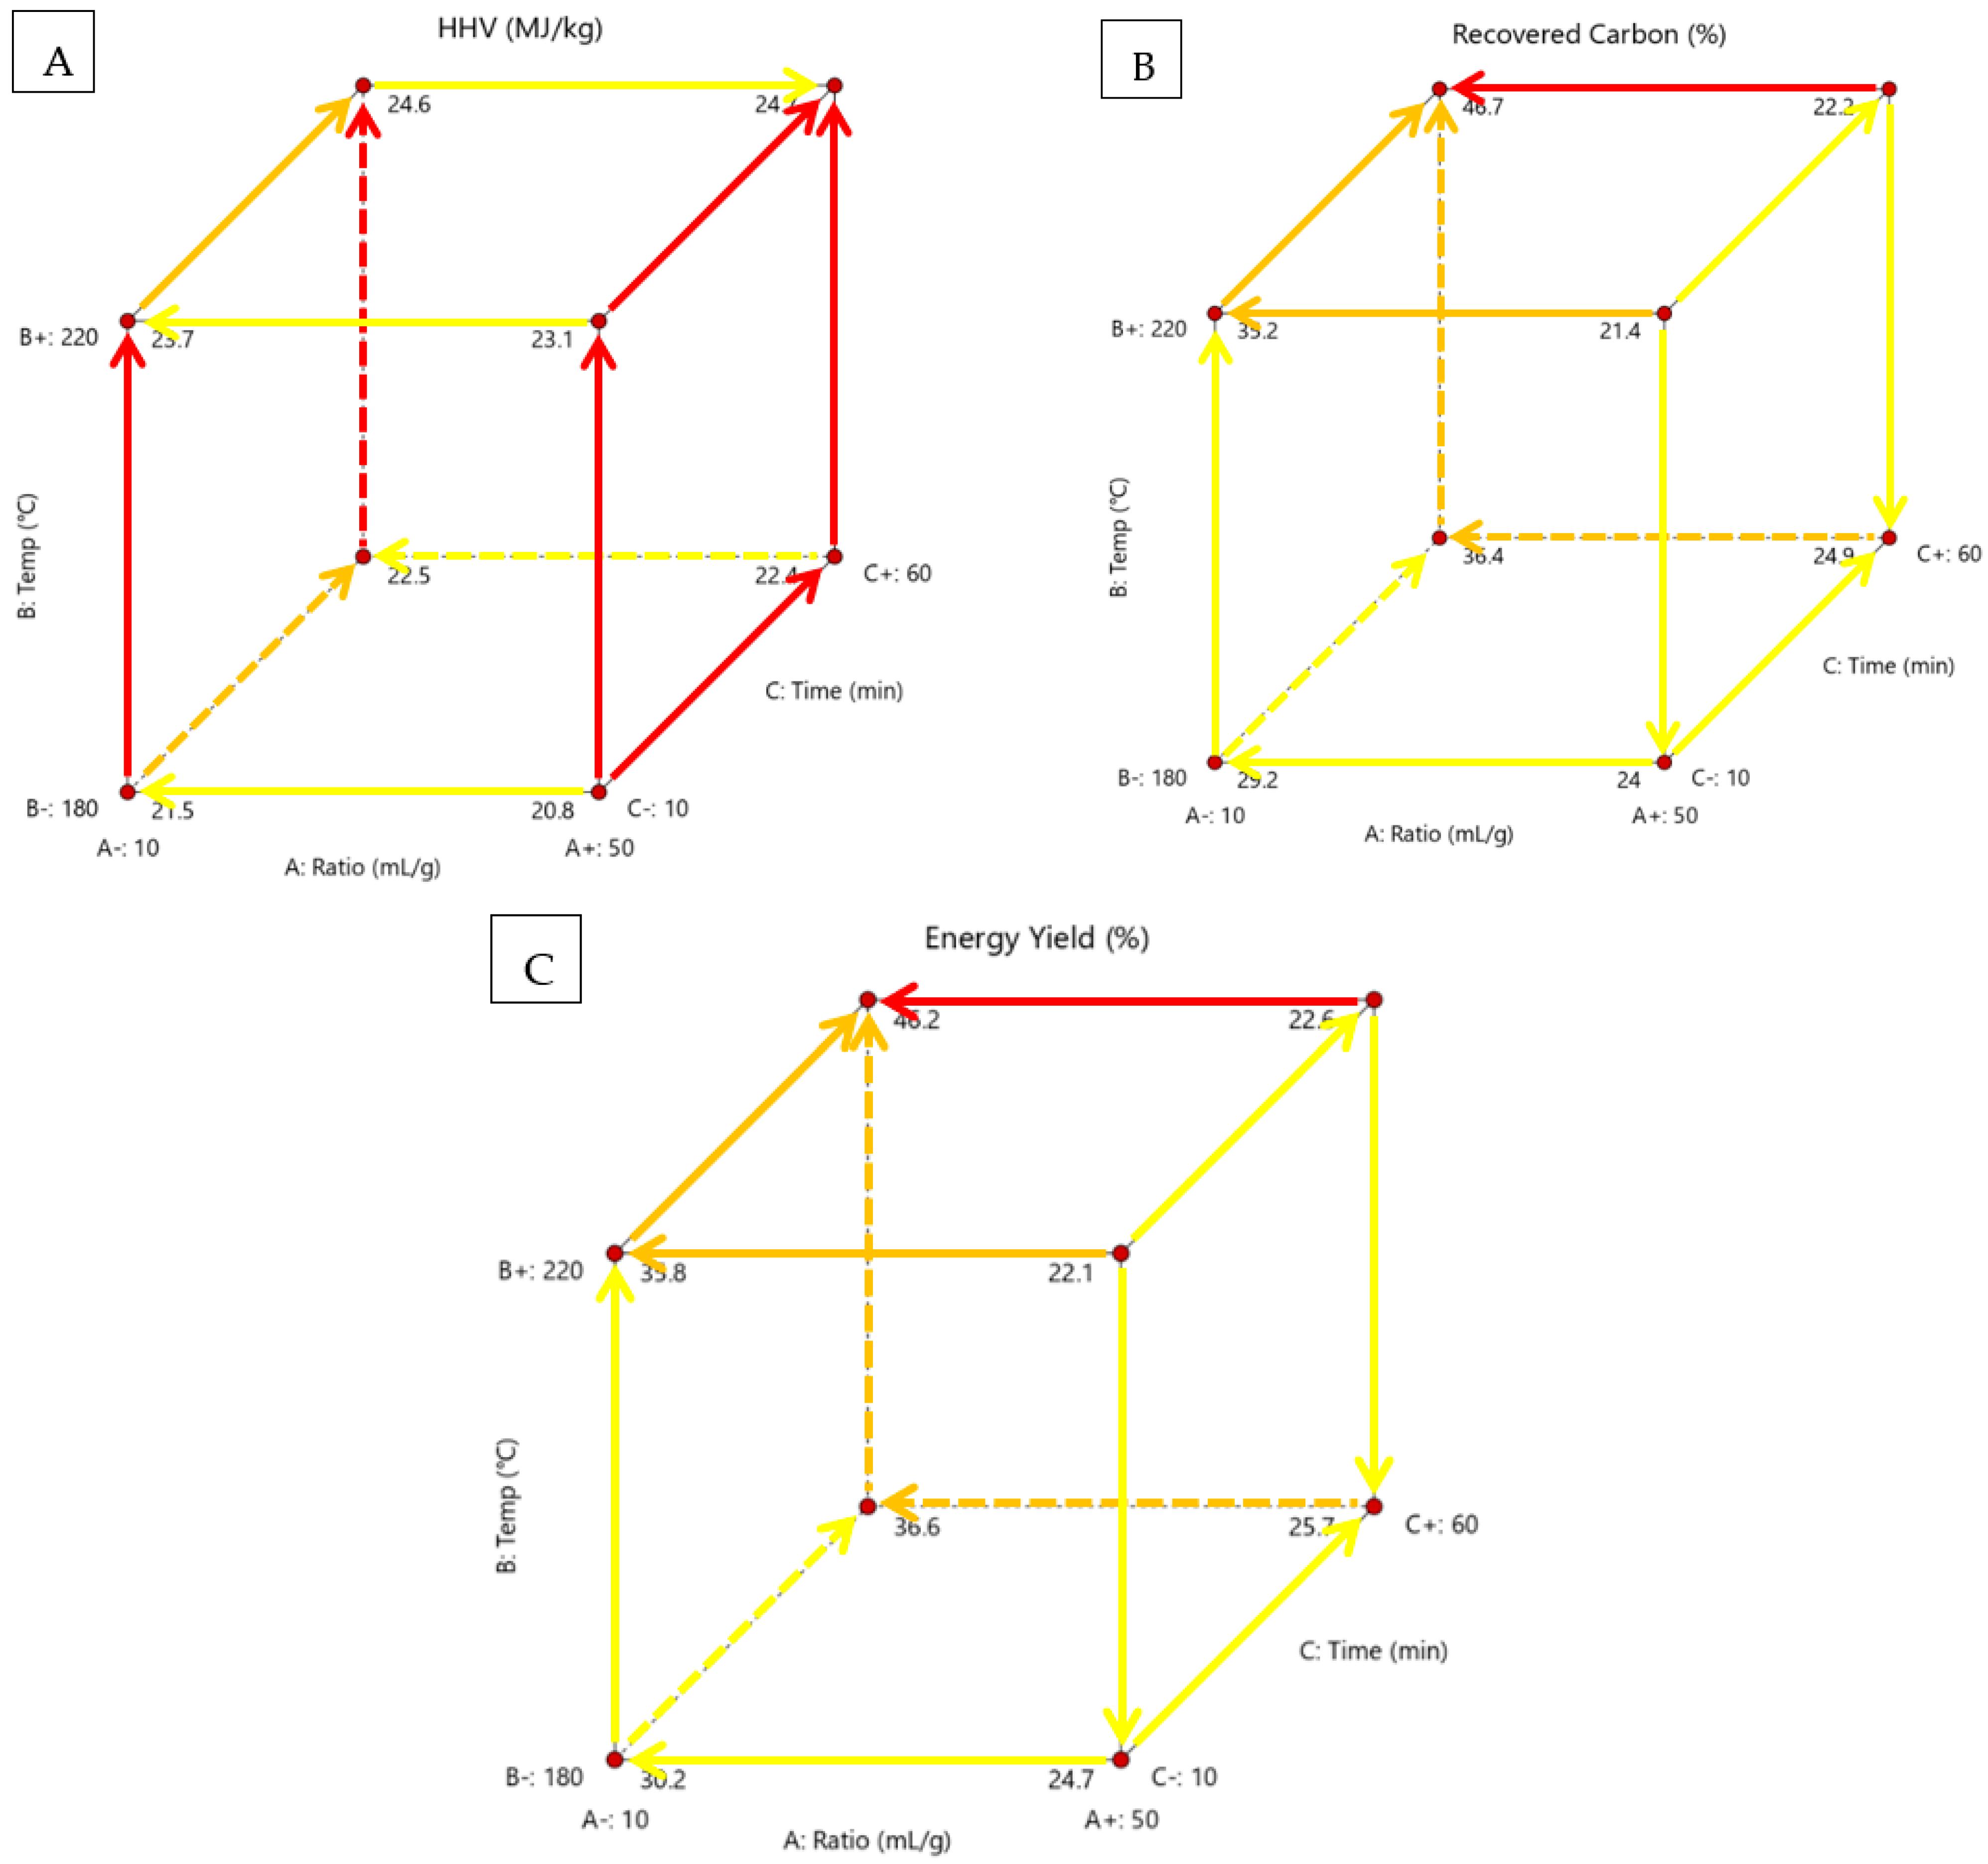
Figure 5 shows the effects of solution ratio, process temperature and residence time on recovered carbon, HHV and energy yield in a cubic form and highlights the significant relationships.
Hydrochar could be used as a solid fuel. HHV is the amount of heat released during the combustion of the material. The higher it is, the better the material is as a fuel source. Although this would not be beneficial for the environment, it would provide a portable condensed form of energy in poorer nations with abundant waste biomass. There would be a net zero increase in carbon since the feedstock is waste biomass. It can function as a greener alternative to coal that contributes to GHG. Design Expert deemed process temperature as the most significant factor, the solution ratio was the least significant and there are two-factor relationships, seen in Table A5. According to Figure 5A, HHV was highest at high temperatures and times. HVV was lowest at a high solution ratio, low temperature and low time. The solution ratio had low significance in every scenario and temperature had high significance in every scenario. Time was most significant at a high solution ratio. Cellulose and hemicellulose are easier to degrade at high temperatures leaving lignin, which has a higher HHV [11]. HHV was improved due to the destruction of low-energy chemical bonds and the generation of high-energy chemical bonds [17]. Hot compressed steam degrades hemicellulose and cellulose into monomers, furfural and 5-hydroxyl methyl furfural (HMF) which precipitated onto the HC increasing HHV [33]. In another study, increased temperature and time caused a decrease in yield but an increase in HHV [38].
HC could be used in carbon sequestration. Recovered carbon is the yield of carbon that remains from the original feedstock. The higher it is, the more carbon is captured from the biomass that would otherwise decay. This carbon is locked away during sequestration and cannot decompose into the atmosphere. Biomass takes about 100 years to decay fully and emits methane and carbon dioxide [18]. After carbonisation, a portion of the carbon is trapped and will remain after this time [18]. Energy yield is the yield of original biomass energy captured and condensed by the process. Reducing total mass and increasing energy density content makes energy more concentrated, making it easier to transport and use. Carbon recovery and energy yield had the same significant factors and trends since both were heavily influenced by yield and carbon content. Design Expert deemed solution ratio the only significant factor of carbon recovery, seen in Table A5. Design Expert deemed all the factors significant for energy yield, with the temperature being the most significant and identified two-factor relationships. According to Figure 5B,C, carbon recovery and energy yield are highest at low solution ratio and lowest at high solution ratio. It is lowest at a high solution ratio, high temperature and low time. The solution ratio is most significant at high temperatures and longer times. Temperature is most significant at low solution ratios and longer times. Time is most significant at low solution ratios and high temperatures. In another study, carbon recovery increased up to 30 min and decreased after [37]. It was concluded that the reason was delayed mass transfer through the pores of biomass particles affecting hydrolysis, dehydration, decarboxylation and condensation reactions [37]. In another study, energy yield increased at longer tomes and decreased at higher temperatures [38].
Figure 6 shows the solution ratio, process temperature and residence time effects on MB and water adsorption in a cubic form and highlights the significant relationships.
HC could be used as a cheap alternative pollutant adsorbent. MB is used to represent pollutants in wastewater streams. It is used in many adsorption viability tests [10,16,20,35,46]. High adsorption means the material would likely make a good pollutant adsorbent for industrial effluent treatment. It suggests a high porosity and surface area, which would also make the material a good precursor for activated carbon. Design Expert deemed no factors to be significant, seen in Table A5. According to Figure 6A, MB adsorption was best at a higher solution ratio, lower temperature and shorter time and was lowest at a lower solution ratio, higher temperature and longer time. The solution ratio was most significant at higher temperatures and longer time. The temperature was most significant at a lower solution ratio and longer time. Time was most significant at low solution ratios and higher temperatures. There are no trends, as calculated by the Design Expert software. This suggests that the factors do not play a part in determining adsorption and that apple HC may just have a wide range of MB adsorption results. A small specific area and low carboxyl and phenolic group restrict the adsorption efficiency [35]. The high pressures during the process do not allow pore structures to develop [44]. HTC dehydration and decarboxylation reactions reduce oxygen-containing functional groups. MB adsorption relies on hydrogen bonding with the hydroxyl groups of HC, electrostatic interaction with carboxylate and π–π interaction in benzene groups [35]. A higher adsorption capacity is achieved with more oxygen groups and a larger specific surface area [35]. Another study found that increasing the temperature increased MB removal [46]. It was found in another study that increasing temperature up to 220 °C increased porosity but decreased at 250 °C [13]. MB adsorption likely depends on the choice of biomass feedstock, with some showing more affinity for the process variables.
HC could be used as a soil additive. Deforestation, land use, excessive mineral fertilisers, unsustainable and excessive agriculture and irrigation, can contribute to a loss of soil quality [21]. This can lead to organic matter depletion, soil degradation and large amounts of waste [6]. HC can add benefits such as reduction of nutrient leaching, increasing soil carbon, cation exchange capacity, increasing nutrients, soil porosity, water holding capacity and aggregation [21]. HC can improve the physicochemical properties and enzyme activities and decrease the gas emissions of the soil [6]. HTC can increase the N, P, K and Ca content and reduce salt, making the soil more conducive for plants [6]. HC can decrease nitrate leaching from sandy soils [13]. HC is generally beneficial to soil physical properties and can be used as a soil conditioner, increasing available water for plants in coarse sandy soils with low organic matter but soils already high in organic matter and high available water content saw no increase with the addition of HC [49]. However, HC can contain hazardous and phytotoxic compounds, which is a significant issue with using it in soil amendment [21]. HC can inhibit seed germination and show detrimental effects on plant growth [21]. HC is less stable and can degrade easily due to its lower aromatic content, enhancing microbial growth, enzyme activity and CO2 emissions [6,21]. Co-composting can eliminate phytotoxic compounds, nutrient losses and GHG emissions and increases stable organic matter and nutrients in compost [12,21]. 0.5–1% addition of HC improved plant growth after an initial delay but increased water retention did not seem responsible [13]. In another study, the application of HC into soil decreased bulk density but increased total porosity, available water capacity and water repellence indirectly through fungal growth [49]. HC has reportedly reduced the CO2, CH4 and N2O emissions in the soil [6]. The feedstock is suspected of playing a part in whether HC will benefit or disadvantage plant growth [13]. Therefore, it is important to investigate different feedstocks.
Water adsorption is a measure of the amount of water adsorbed by the material. The higher it is the more water is adsorbed. This would make the material useful in sandy soil areas where water is not retained and drains away, depriving plants of water. It can also be used as a soil conditioner to improve the quality. Design Expert deemed no factors to be significant, seen in Table A5. According to Figure 6B, water adsorption is highest at a low solution ratio, high temperature and high time. Water adsorption is lowest at a high solution ratio, low temperature and high time. The solution ratio is most significant at high temperatures and a longer processing time. A lower solution ratio increases adsorption except at low temperatures and times. A higher temperature increases adsorption except at high solution ratios and low time. At a low solution ratio, a longer time increases adsorption, and at a high solution ratio, a longer time decreases adsorption. HC has a higher number of oxygenated groups than biochar which increases hydrophilicity and wettability [44]. Lignin is the most hydrophobic component in biomass and hemicellulose is the most hydrophilic [33]. Increasing temperature leads to hydrophobicity, reducing water adsorption [13]. In another study, increasing temperature and time increased the amount of water adsorbed by HC [48]. When HC is added to soil, water content is increased due to the porosity and agglomeration of the soil [6].
The relationship between the variables can be displayed as an equation. This can be used to predict results and shows how variables interact. An example equation can be seen in Equation (8).
Property = [ Intercept ] + [ Ratio ] + [ Temp ] + [ Time ] + [ Ratio × Temp ] + [ Ratio × Time ] + [ Temp × Time ]
The coded and actual values and p-Values from the Design Expert software can be seen in Table A5. The blue colour indicates that increasing the variable has a positive effect and the orange colour indicates that increasing the variable has a negative effect. A coded value means the variable is represented by a high (+1) and low (−1) value. An actual value means the real number can be used in the equation, for example, 220 when 220 °C is used. The p-values are also displayed in Table A5 for each variable and property. This value shows if a variable is significant. A p-value below 0.05 is significant and a value above 0.1 is insignificant. To maintain model hierarchy, insignificant factors are sometimes included.

3.3. Effect of Particle Size on HC Properties

The effect of particle size (<50 µm, 50–200 µm and >200 µm) on yield, carbon, oxygen and ash content, HHV, carbon recovery, energy yield, MB and water adsorption was investigated. Reducing particle size requires significant energy and processing cost. The industry should use larger sizes while maintaining efficiency. 
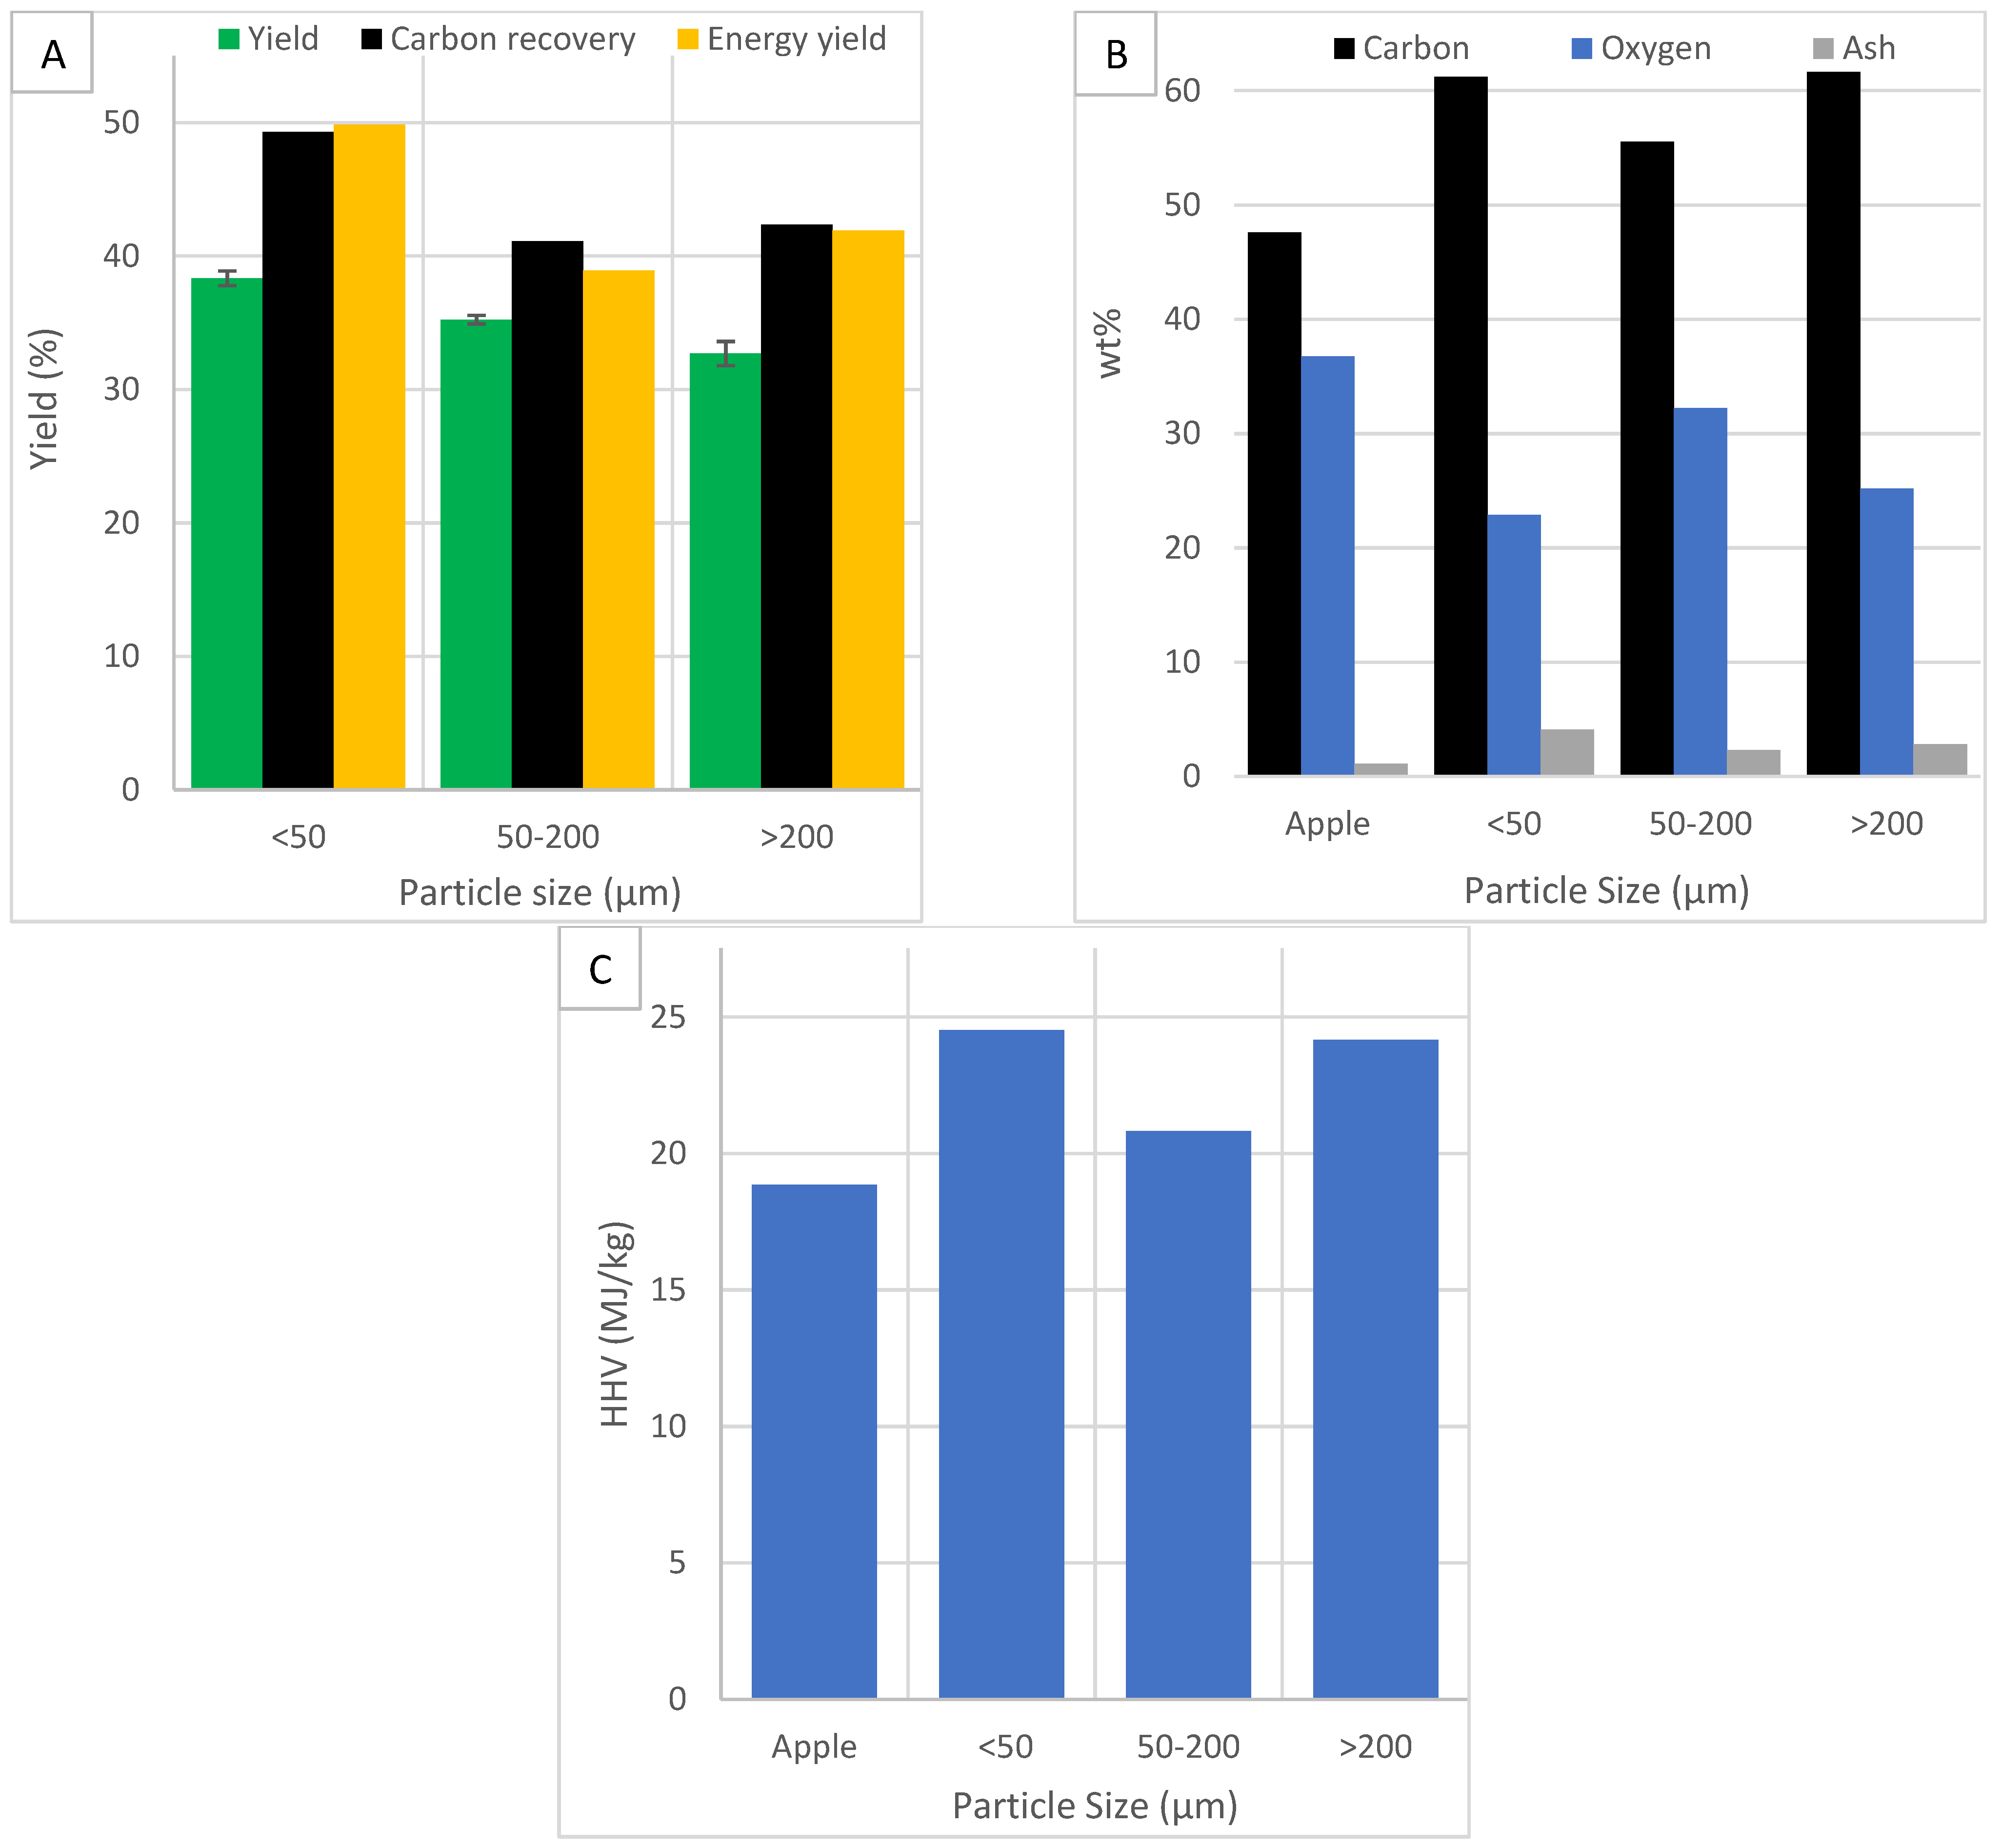
Figure 7 shows the effects of particle size on yield, carbon recovery, energy yield, carbon, oxygen and ash content and HHV.
Figure 7A shows the effect of particle size on HC yield. The standard error bars for yield are small, indicating the results are consistent. Yield increases as the particle size decrease. The heat from different milling processes has been shown to denature proteins, reduce amino acids and reduce saturated fatty acids in wheat flour [50]. The size reduction process may affect the biomass in such a way as to affect yield and carbonisation. At smaller particle sizes, water can penetrate the pores easier and the greater surface area will enhance the rate of heat, mass transfer and reaction kinetics [38]. A particle size reduction can reduce cellulose’s crystallinity, which improves hydrolysis reactions [38]. This improves the disintegration and separation of lignocellulosic material, reducing yield. In another study, decreasing particle size caused a decrease in yield and energy yield but HHV remained relatively unchanged, suggesting a smaller particle size promotes HTC [51]. In another study, decreasing particle size caused a decrease in yield and energy yield and an increase in HHV [38]. In this study, a different trend is displayed. A possible reason could be the choice of feedstock. The combination of apple feedstock and increased reactivity from size reduction may favour the conversion to the solid char fraction over the liquid fraction. Another possible reason is larger particle sizes may be receptive to microwave volumetric heating, increasing thermal degradation and decreasing yield. More effective microwave heating has been shown to significantly affect carbonisation [26].
Figure 7A also shows the effect of particle size on carbon recovery and energy yield. Carbon recovery is highest in the smallest particle size and lowest in the middle range. Carbon recovery is a function of yield and carbon content. Since the smallest particle size showed the highest yield, it shows the highest recovered carbon. Energy yield is also a function of yield and carbon content, therefore showing the same trend as carbon recovery.
Figure 7B shows the effect of particle size on carbon and oxygen content. HTC improves carbon content. Carbon content is highest in the smallest and largest particles size and lowest in the middle range. Increased carbon at the smaller size is likely because of increased reactivity from a larger specific surface area. More hemicellulose and cellulose are degraded, leaving carbon-rich lignin. Decarboxylation and dehydration reactions increase due to a smaller particle size, increasing carbon content and HHV [38]. At the larger size, increased microwave volumetric heating may cause increased thermal degradation of internal volatiles before surface hydrolysis, improving carbonisation. In another study, the smallest size fraction of <0.25 mm had the lowest carbon content due to a larger surface area and greater reactivity which caused the breakdown of char into carboxylic acids [37]. HTC reduces oxygen content. Oxygen content is lowest in the largest and smallest particle size and highest in the middle range. It shows the opposite trend of carbon content.
Figure 7B also shows the effect of particle size on ash content. Ash content increases after HTC. Ash content is greatest at the smallest particle size. The smallest particle size shows the highest yield and carbon content, suggesting most of the oxygen-rich components have been removed. This should leave a more porous structure than the other particle sizes, resulting in the re-adsorption of ash compounds dissolved in the process water [1].
Figure 7C shows the effect of particle size on HHV. HHV is improved by HTC. The smallest particle size shows the greatest improvement. HHV is strongly dependent on carbon content and shows the same trends.
Figure 8 shows the effects of particle size on MB and water adsorption.
Figure 8A shows the effect of particle size on MB adsorption. HTC reduces MB adsorption by more than half. MB adsorption is highest between 50 and 200 µm and lowest at low particle size. The mid-range particle size showed the least HC conversion, which suggests it is closest to unmodified biomass, which showed good MB adsorption. The middle-range HC had a higher oxygen content, suggesting more oxygen-containing functional groups, which improves adsorption.
Figure 8B shows the effect of particle size on water adsorption. HTC improved water adsorption. This is likely because of increased porosity and surface area. Water adsorption is highest between 50 and 200 µm and lowest at small particle size. The results are similar to MB adsorption. The middle range had the least carbonisation. This meant more oxygenated groups, more hemicellulose and therefore increased hydrophilicity and wettability than the other HC. This increased water adsorption in the middle range.

3.4. Effect of Solution pH and Acetone Washing on HC Properties

The effect of solution pH and acetone washing on yield, carbon, oxygen and ash content, HHV, carbon recovery, energy yield, MB and water adsorption was investigated. It has been reported that acidic conditions remove hemicellulose and basic conditions remove lignin [16]. Figure 9 shows the effects of particle size on yield, carbon, oxygen and ash content, HHV, carbon recovery and energy yield.
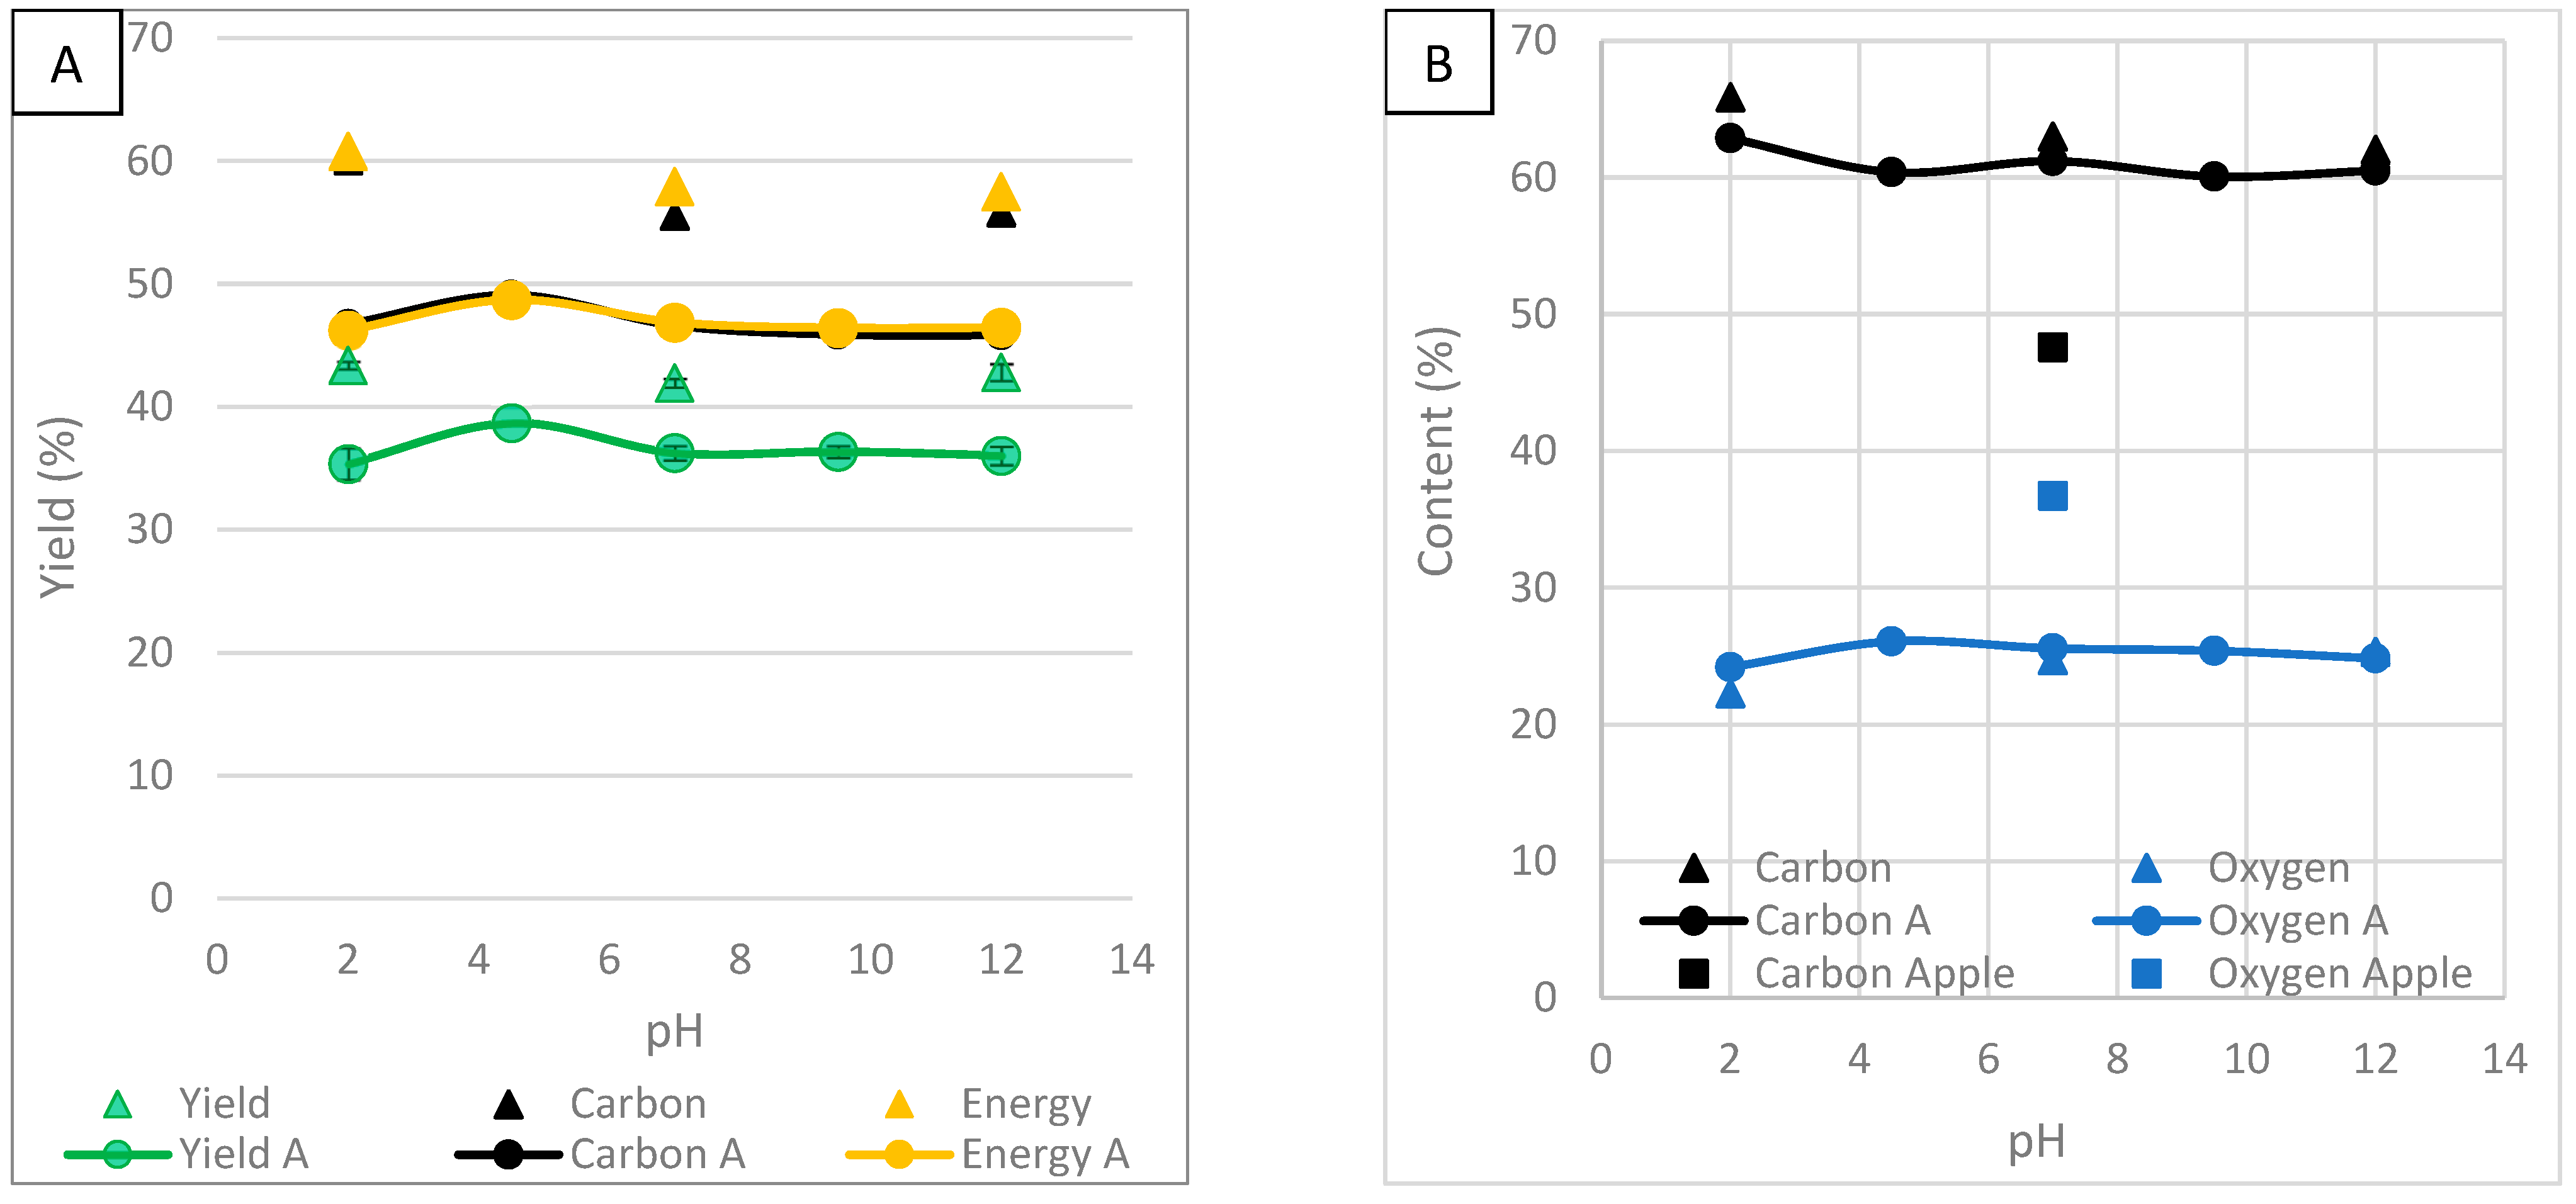
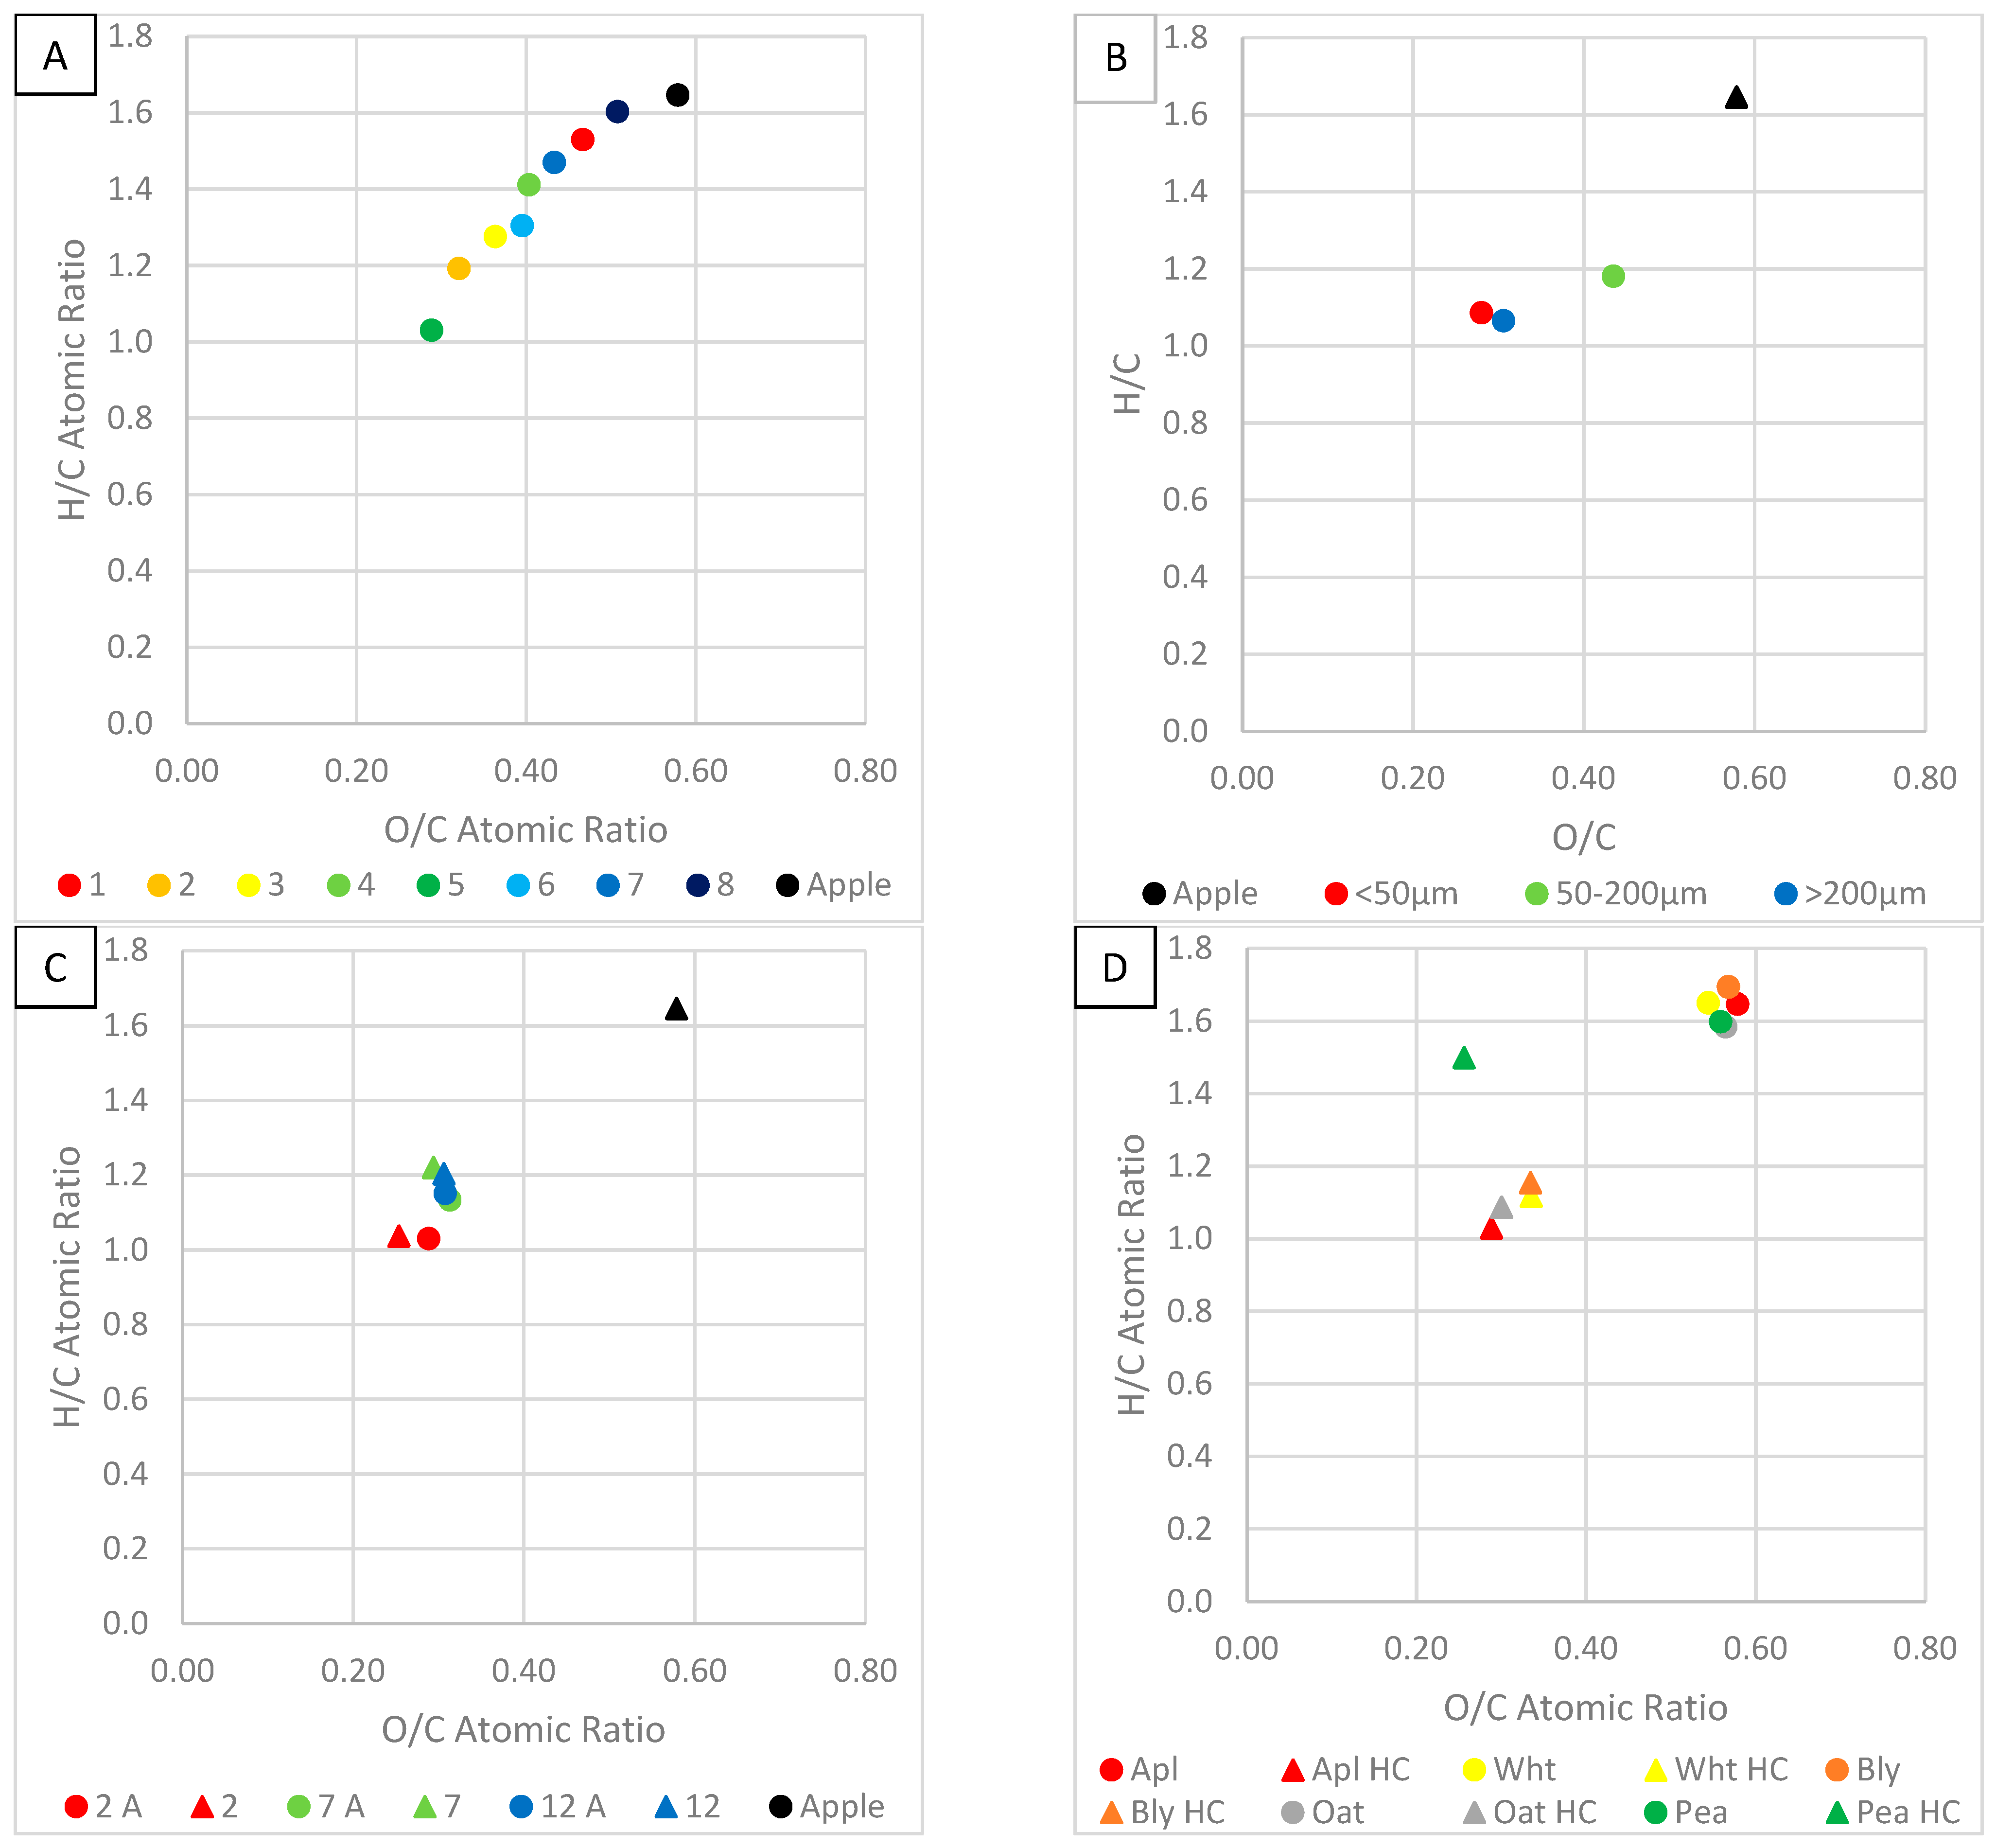
Figure 9A shows the effect of solution pH on yield. The standard error bars for yield are small, indicating the results are consistent. Yield is highest at a pH of 4.5 and 7. It was lowest at a pH of 2, 9.5 and 12. This suggests that the addition of acid and base reduces yield. Acid and base treatment removes hemicellulose and lignin, respectively. The mass loss is likely due to the enhanced removal of these components. In other studies, the solution pH did not affect the yield, but it was concluded that acid assisted hydrolysis and catalysed dehydration and carbonisation [36,39]. Lignin precipitates in acid when pH is lower, increasing yield [38]. The removal of acetone washing causes the yield to increase. This is because washing the HC with acetone reduces the yield. Surface carbons and volatile components are dissolved and washed away. Yield increases the most in acidic and basic conditions. It suggests that acidic and basic conditions produce more volatile components, likely from the dissolution of hemicellulose and lignin, respectively. These results are reflected in both carbon recovery and energy yield. In another study, washing with only water removed up to 10% of the mass, indicating a large proportion is volatile and water soluble [47]. The structural stability of the HC was strengthened by the removal of partially unstable organic matter [40].
Figure 9A also shows the effect of solution pH on carbon recovery and energy yield. It shows a similar result to yield. Carbon recovery and energy yield are highest at a pH of 4.5 and 7, and lowest at a pH of 2, 9.5 and 12. The removal of acetone washing causes carbon recovery and energy yield to increase. Carbon recovery and energy yield increase the most in acidic conditions.
Figure 9B shows the effect of solution pH on carbon and oxygen content. HTC improved carbon content while oxygen content was reduced. Carbon content is highest at a pH of 2 and oxygen is lowest at a pH of 2. This suggests acidic conditions are best for promoting HCT. At a low pH, hemicellulose degradation is enhanced, meaning fewer oxygen-containing groups. Without acetone washing, carbon content increased, and oxygen content decreased, most significantly at a pH of 2. HTC produces a tarry layer on the HC. The tarry substance is mostly composed of carbon, making it insoluble in water [36]. Washing with acetone has been noted to increase the proportion of fixed carbon, suggesting the substance is more volatile than HC [36]. In another study, the addition of acetone stabilised the carbon, oxygen and hydrogen contents due to polymerisation [3]. In another study, carbon content decreased and oxygen content increased after washing with organic solvent [34]. In another study, acetone washing decreased and increased carbon content depending on the feedstock [36]. Washing with acetone increases oxygen content and decreases carbon content [15]. This shows it is important to investigate the effects of HTC on different feedstocks, as they show different results.
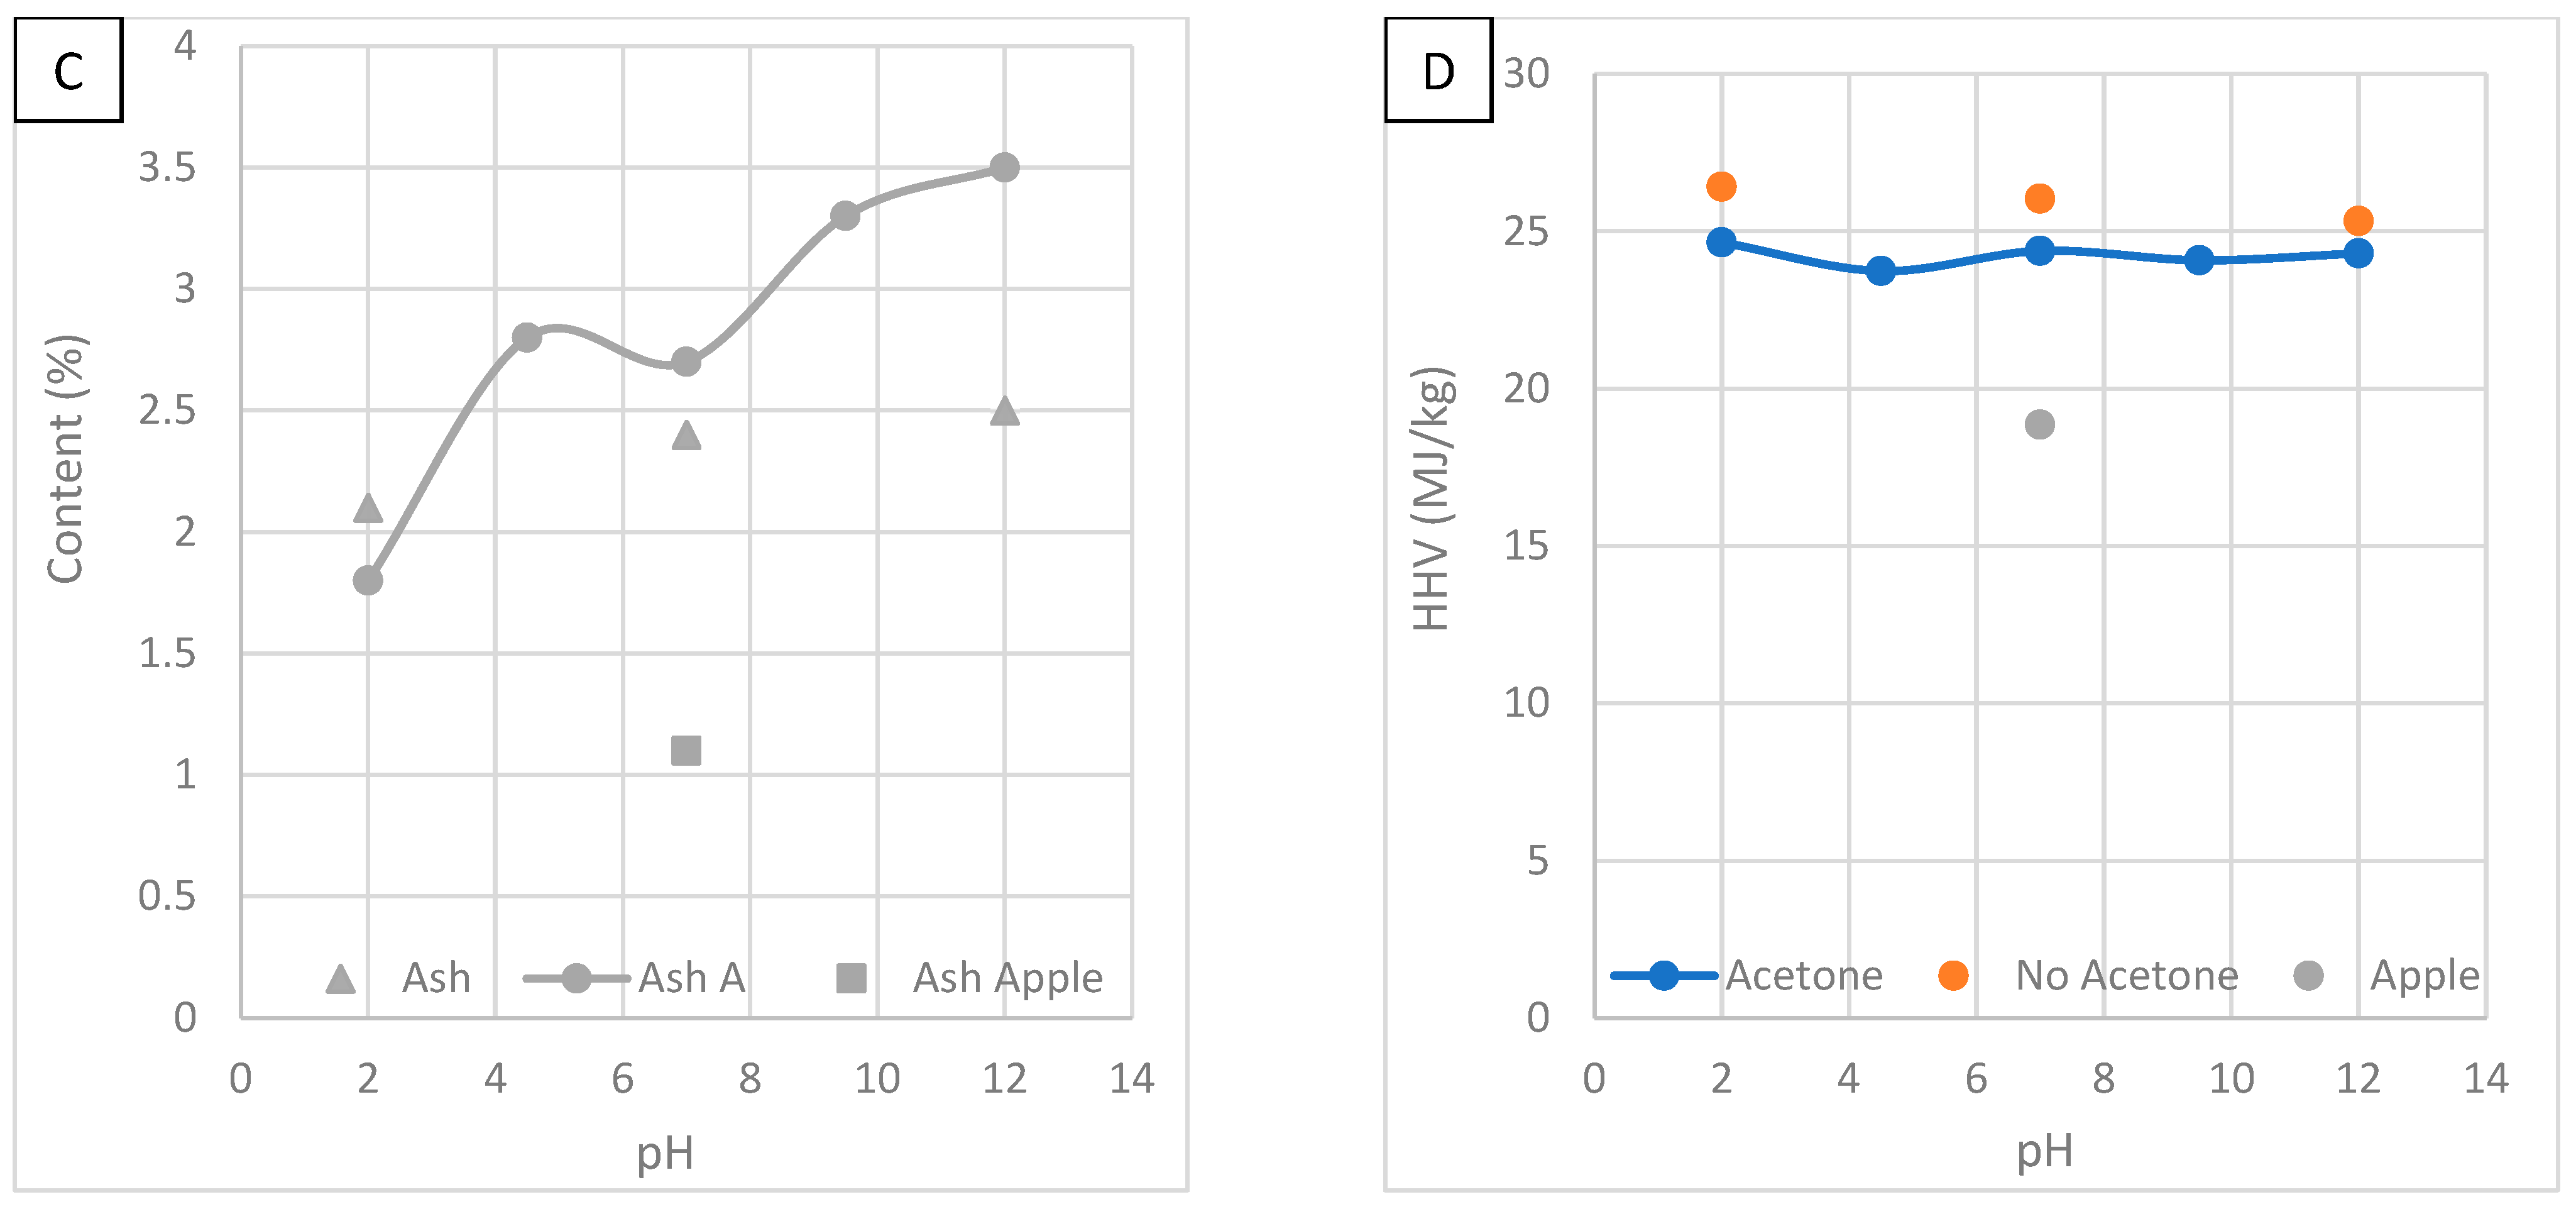
Figure 9C shows the effect of solution pH on ash content. Ash content increases as pH increases. Ash is mostly potassium and calcium, which react with water to form the basic compounds KOH and Ca(OH)2. At a high pH, the process water will be saturated with basic compounds and there will be a low concentration gradient. There will be a large concentration gradient at a low pH, encouraging ash’s dissolution. Not washing with acetone causes ash content to decrease at a pH of 12 and 7 but not at a pH of 2. This is likely because acetone leaves inorganic ash untouched while reducing organic components. In other studies, washing with organic solvent increased ash content [15,34].
Figure 9D shows the effect of solution pH on HHV. HVV is relatively unaffected by solution pH. The effect of pH is small on carbon and oxygen content. Since HHV is dependent on these variables, the effect is insignificant. Not washing with acetone causes HHV to increase, most significantly at a pH of 2. The more reactive oily outer phase can cause variation in oxidation rates, resulting in inefficient energy recovery when combusting the HC [15]. It has been concluded that acetone removes potentially undesirable combustion behaviour from low-temperature volatiles while minimising mass loss [15]. Acetone has been reported to remove the main volatile components dodecanoic acid and dodecyl amide, from the HC surface, which burn at a lower temperature, reducing ignition temperature and combustion activated energy [40]. In another study, HHV decreased after washing with acetone [15].
Figure 10 shows the effects of solution pH and acetone washing on MB and water adsorption.
Figure 10A shows the effect of solution pH on MB adsorption. HTC significantly reduced MB adsorption. Adsorption peaks at a pH of 9.5 and decreases at a pH of 12 and low pH. Basic conditions enhance the degradation of lignin, increasing the content of oxygen-rich hemicellulose and cellulose. More oxygen-containing groups are better for MB adsorption. Hemicellulose develops complex structures improving the surface area and porosity [16]. Basic conditions have a higher ash content, which will increase the pH of the MB solution. A higher pH enhances MB adsorption [31]. In another study, both acidic and basic conditions improved adsorption but a combination of both was found to be best [16]. This is likely because the increased degradation from either acid or base will improve porosity. In another study, an acidic solution increased adsorption and a basic solution reduced adsorption [39]. This is the opposite of the findings of this study. However, they were adsorbing atrazine in their study. Not washing with acetone causes adsorption to decrease at a pH of 12 and has no effect at a pH of 7 and 2. This is likely because acetone cleaned the tarry substance out of the pores and increased the porosity. It has been noted that washing with acetone increases the surface area [34]. In another study, washing with acetone increased the adsorption of atrazine by removing alkyl groups which had weaker interactions [39].
Figure 10B shows the effect of solution pH on water adsorption. HTC enhances water adsorption. Water adsorption peaked at a pH of 4.5 and was lowest in basic conditions. The opposite results of MB adsorption. The removal of ash and hemicellulose in low pH HC likely left voids, increasing porosity, and allowing more water to be adsorbed. Not washing with acetone decreased adsorption, most significantly at a pH of 2. This is likely because acetone improved porosity by removing the tarry outer layer.

3.5. Effect of Waste Biomass Feedstock on HC Properties

The effect of the choice of biomass feedstock on HC yield, carbon, oxygen and ash content, HHV, carbon recovery, energy yield, MB and water adsorption was investigated. 
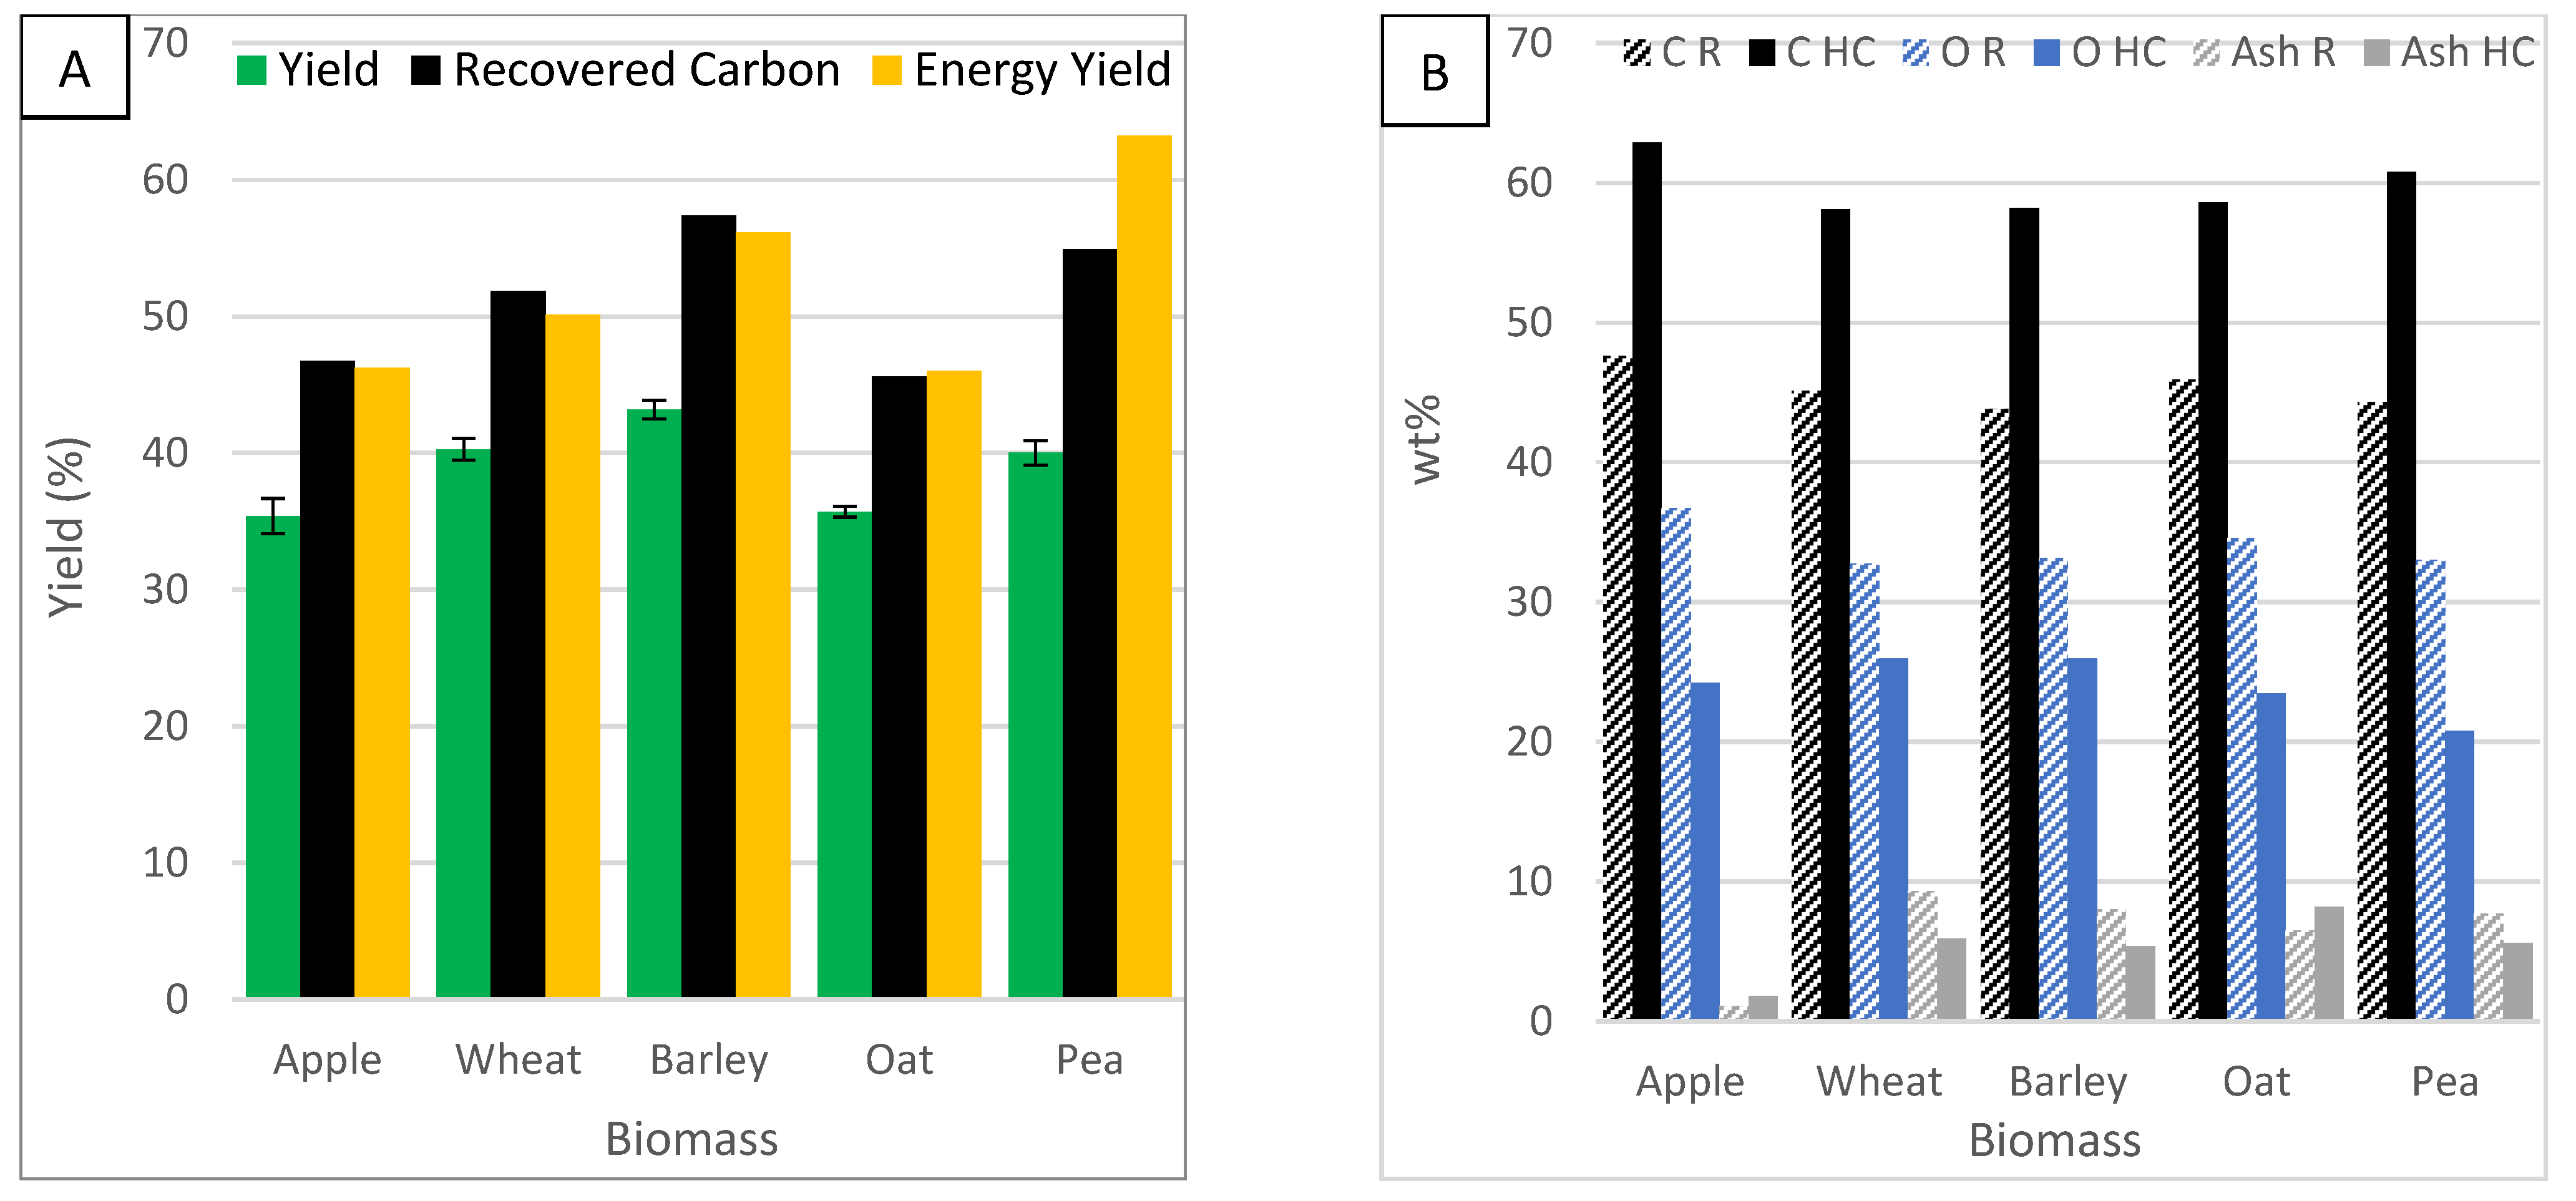
Figure 11 shows the effects of biomass feedstock on yield, carbon, oxygen and ash content, HHV, carbon recovery and energy yield.
Figure 11A shows the effect of biomass feedstock on HC yield. The standard error bars for yield are small, indicating consistent results. The yield was highest in barley HC and lowest in apple and oat HC. The yield from different feedstocks ordered; barley > wheat > pea > oat > apple. A feedstock with a lower moisture content will produce a higher char yield [46]. Barley showed the highest yield but had the highest moisture content. Figure 11A also shows the effect of biomass feedstock on recovered carbon. Recovered carbon was highest in barley HC and lowest in oat HC. The carbon recovery from different feedstocks is in the order: barley > pea > wheat > apple > oat. All the biomasses would be appropriate sources for carbon sequestration or conversion to fuel. Figure 11A also shows the effect of biomass feedstock on energy yield. Energy yield was highest in pea HC and lowest in oat HC. The energy yield from different feedstocks is in the order: pea > barley > apple and wheat > oat. Oat was consistently the worst feedstock for yield, carbon recovery and energy yield, and pea and barley were the best.
Figure 11B shows the effect of biomass feedstock on carbon content. Carbon content was increased by 13–17% by the HTC process. It was most effective in apple and pea biomass and least effective in oat and wheat biomass. The carbon content ranks: apple > pea > oat > barley > wheat. This suggests apple and pea are very susceptible to HTC whereas wheat and barley are more resistant to carbonisation. Figure 11B also shows the effect of biomass feedstock on oxygen content. Oxygen content was reduced by 7–13%. Apple and pea HC showed the most notable change, while wheat and barley showed the least. The oxygen content ranked: wheat > barley > apple > oat > pea. This again shows apple and pea are effective feedstocks for HTC and wheat and barley are not. Figure 11B also shows the effect of biomass feedstock on ash content. Ash content increased in apple and oat and decreased in wheat, barley and pea after HTC. All the biomasses contain high amounts of ash (6.5–9.3%) other than apple biomass (1.1%). Ash content reduced after HTC because ash dissolved in the solution. With apple biomass, since it started with low ash content, more organic components were likely lost than ash was dissolved. This indicates biomass high in ash content can be used for HTC. In another study, different biomass feedstocks were compared and ash was also found to decrease in two of them, showing that the dissolution of ash is very feedstock determinate [15].
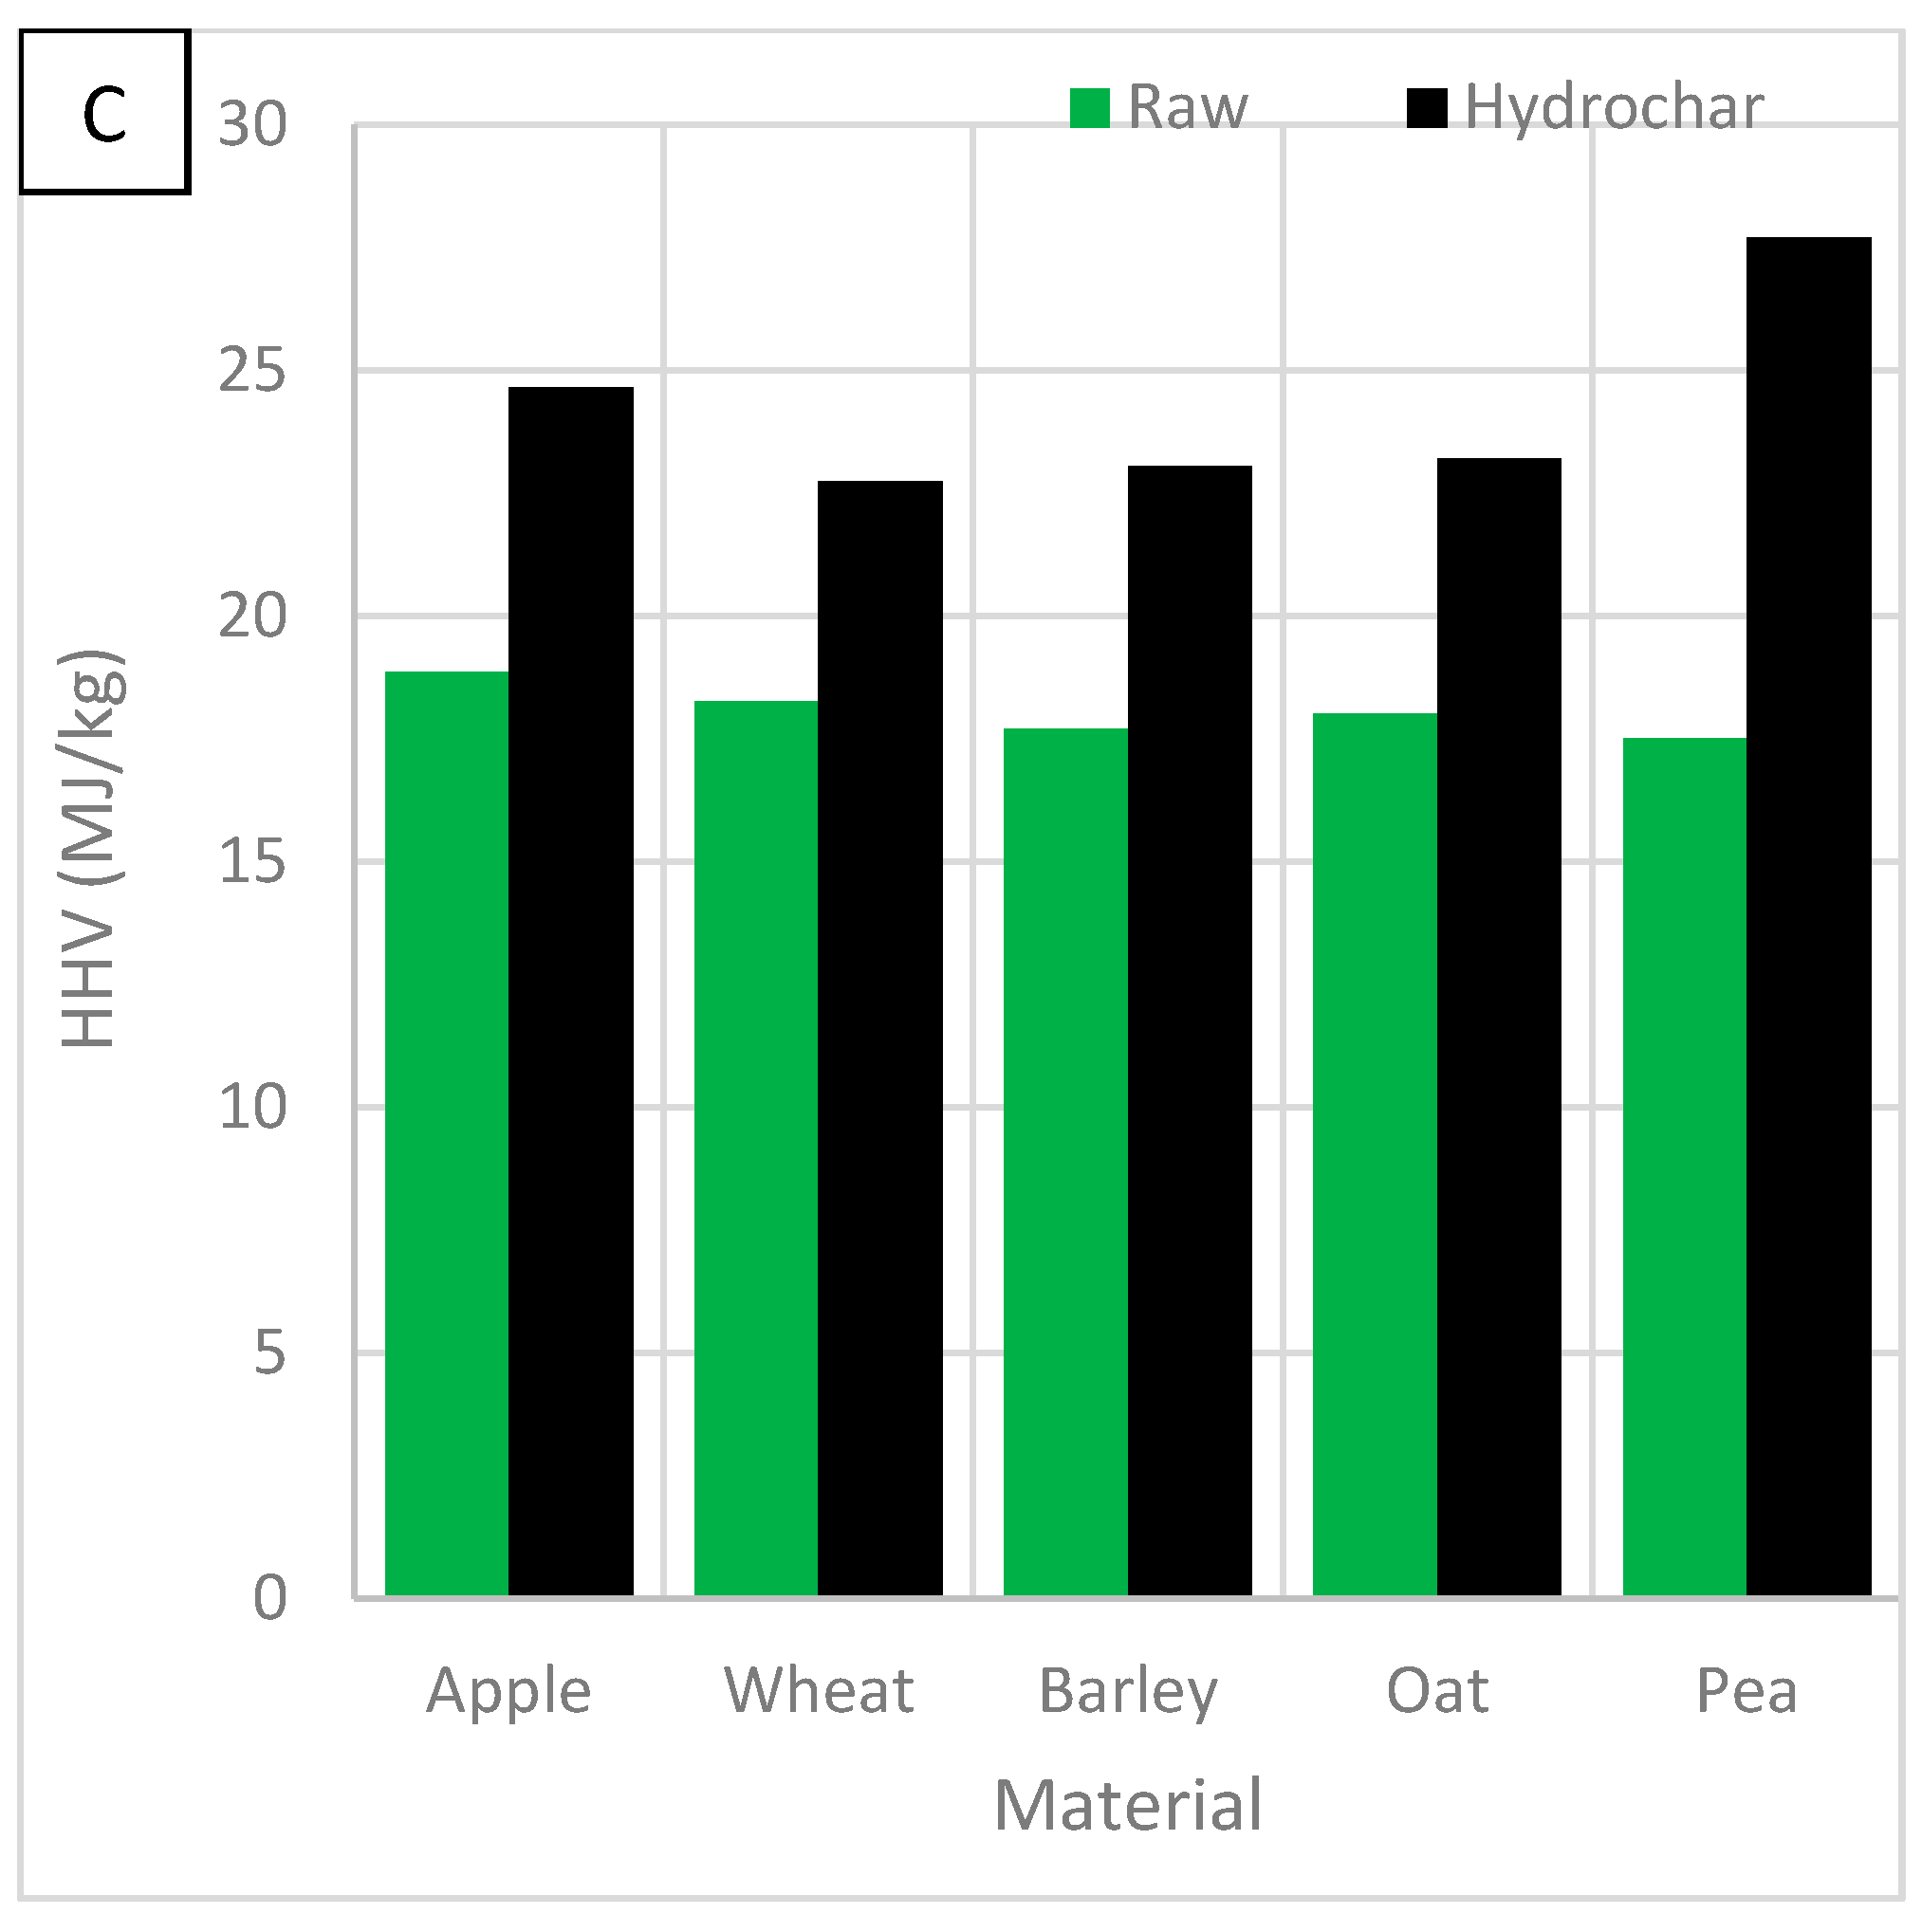
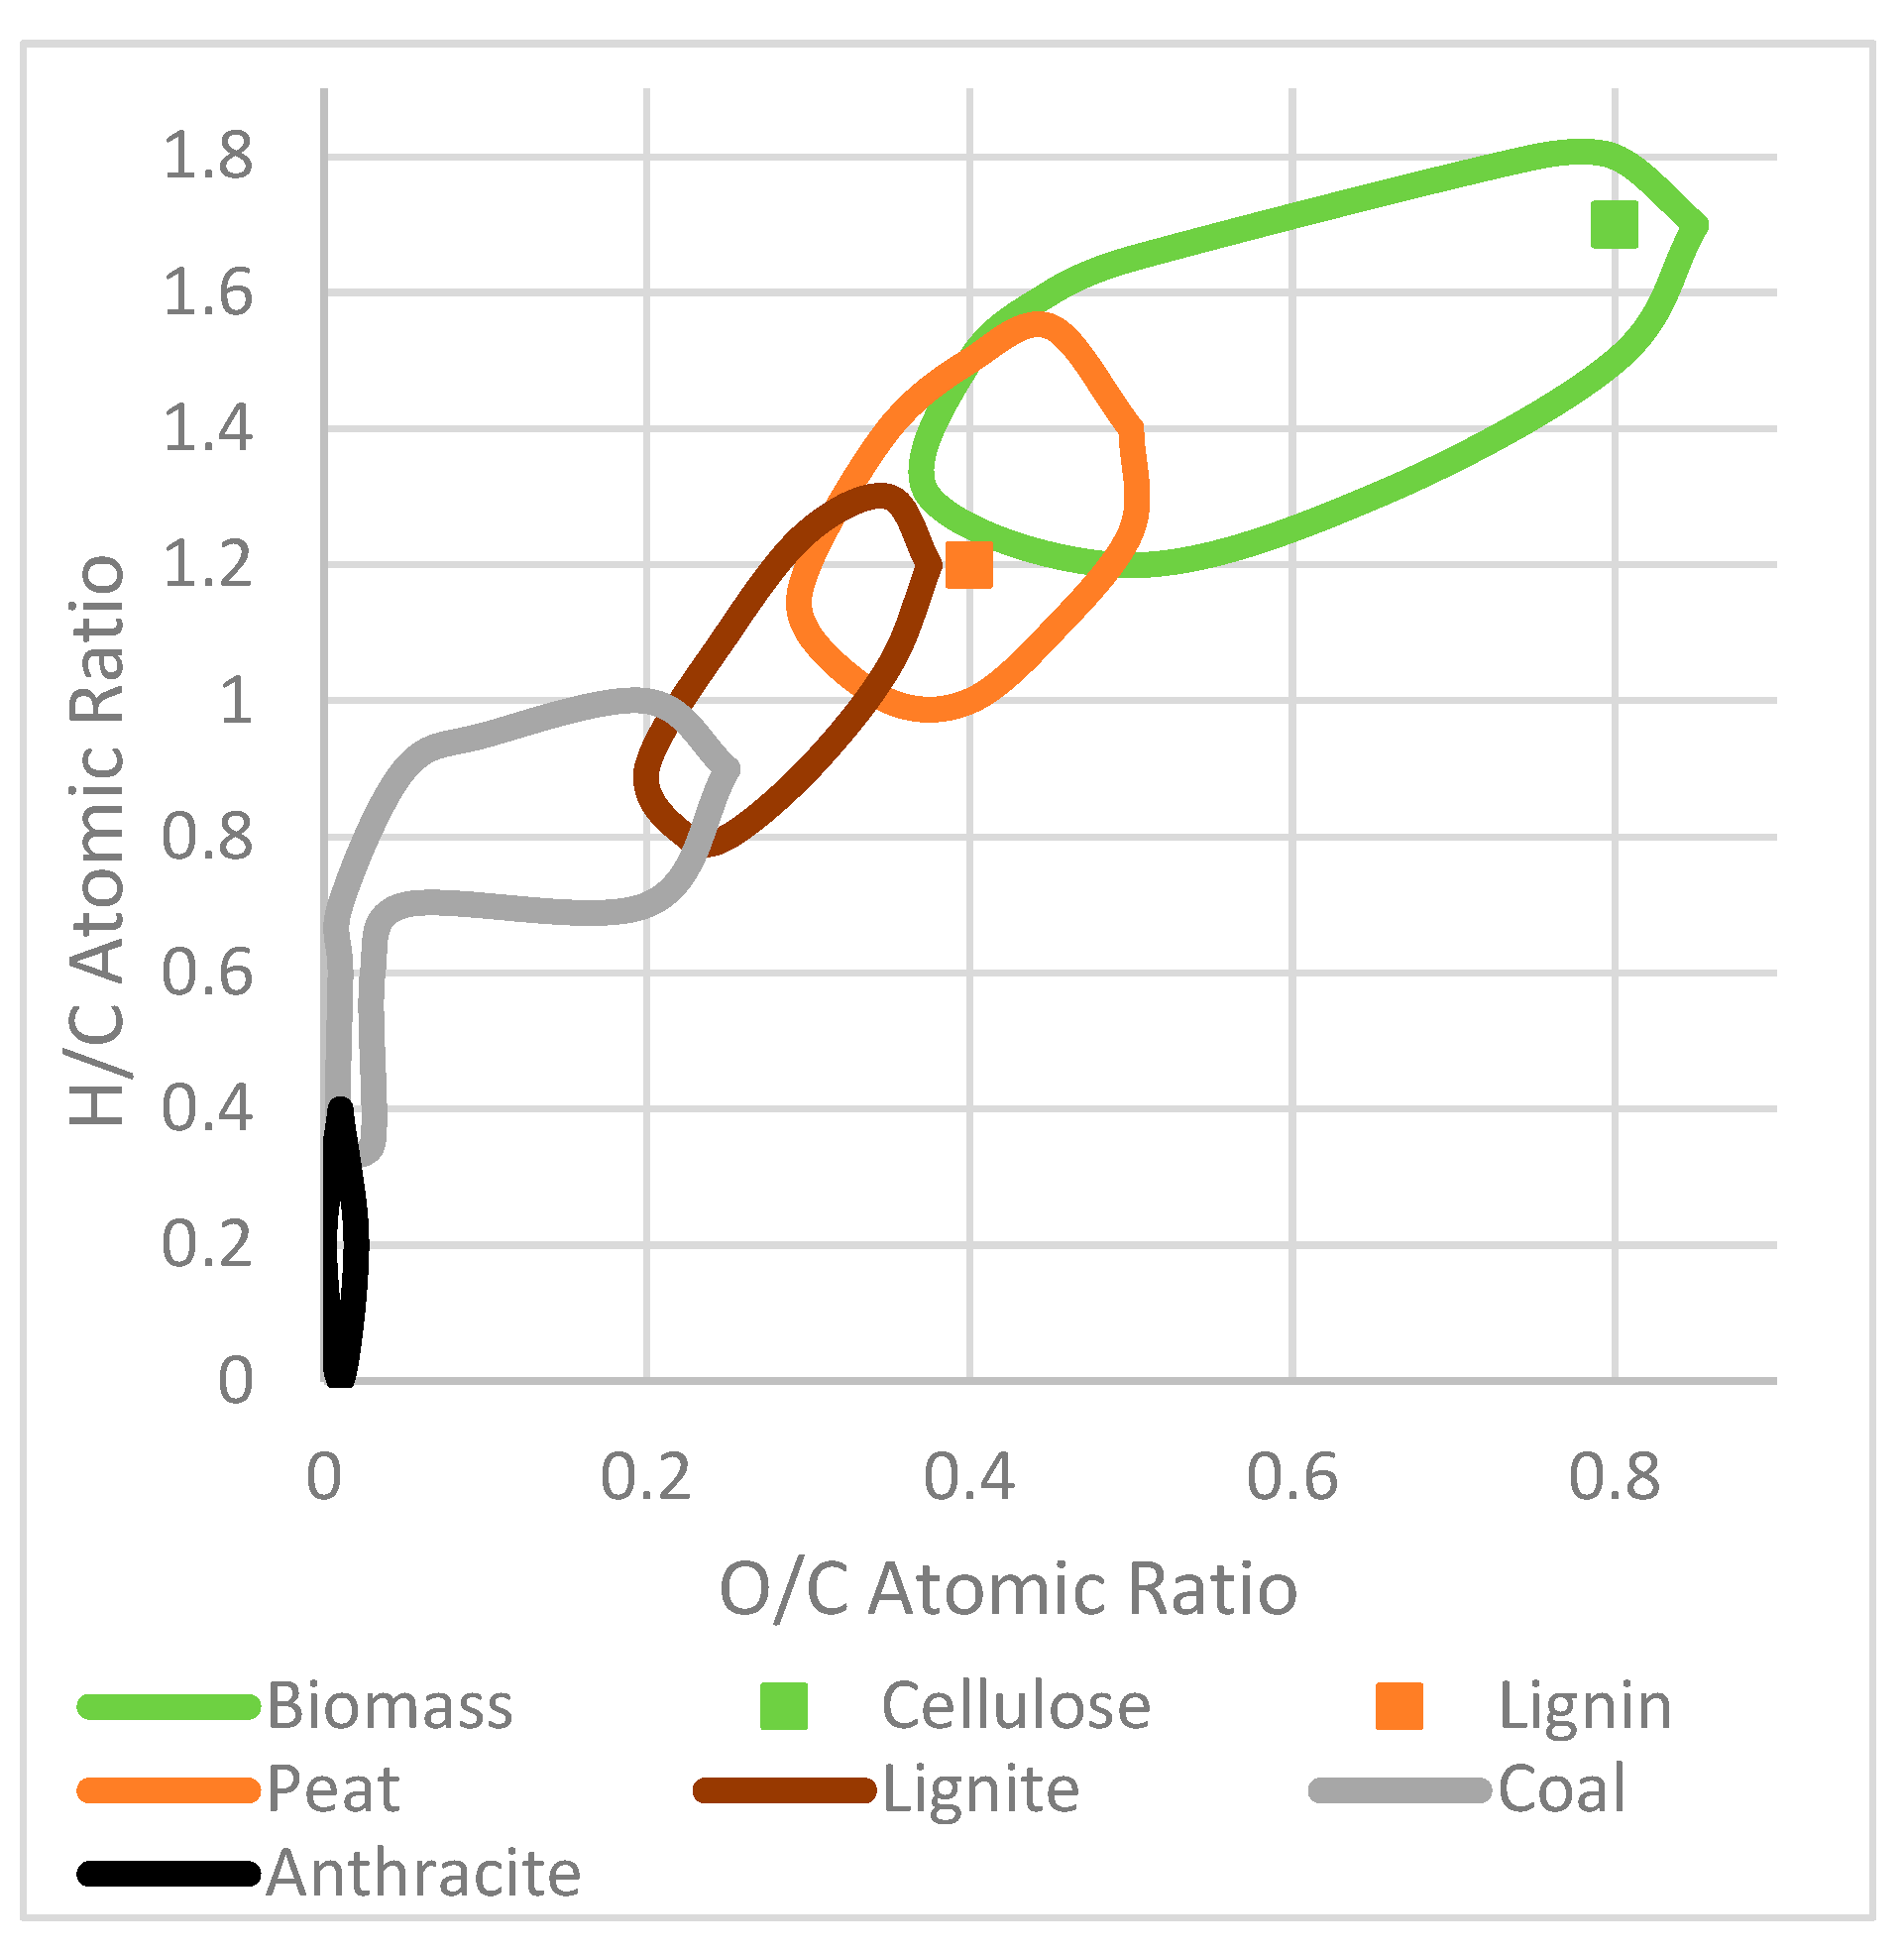
Figure 11C shows the effect of biomass feedstock on HHV. HHV was improved by 5–10% to values of 22.7–27.7 MJ/kg. Pea showed the most notable change and wheat showed the least. The HHV ranked: pea > apple > oat > barley > wheat. HTC improves biomass by increasing the HHV beyond other fuels such as wood, peat and brown coal. This makes them viable alternative solid fuels, greener than coal and peat.
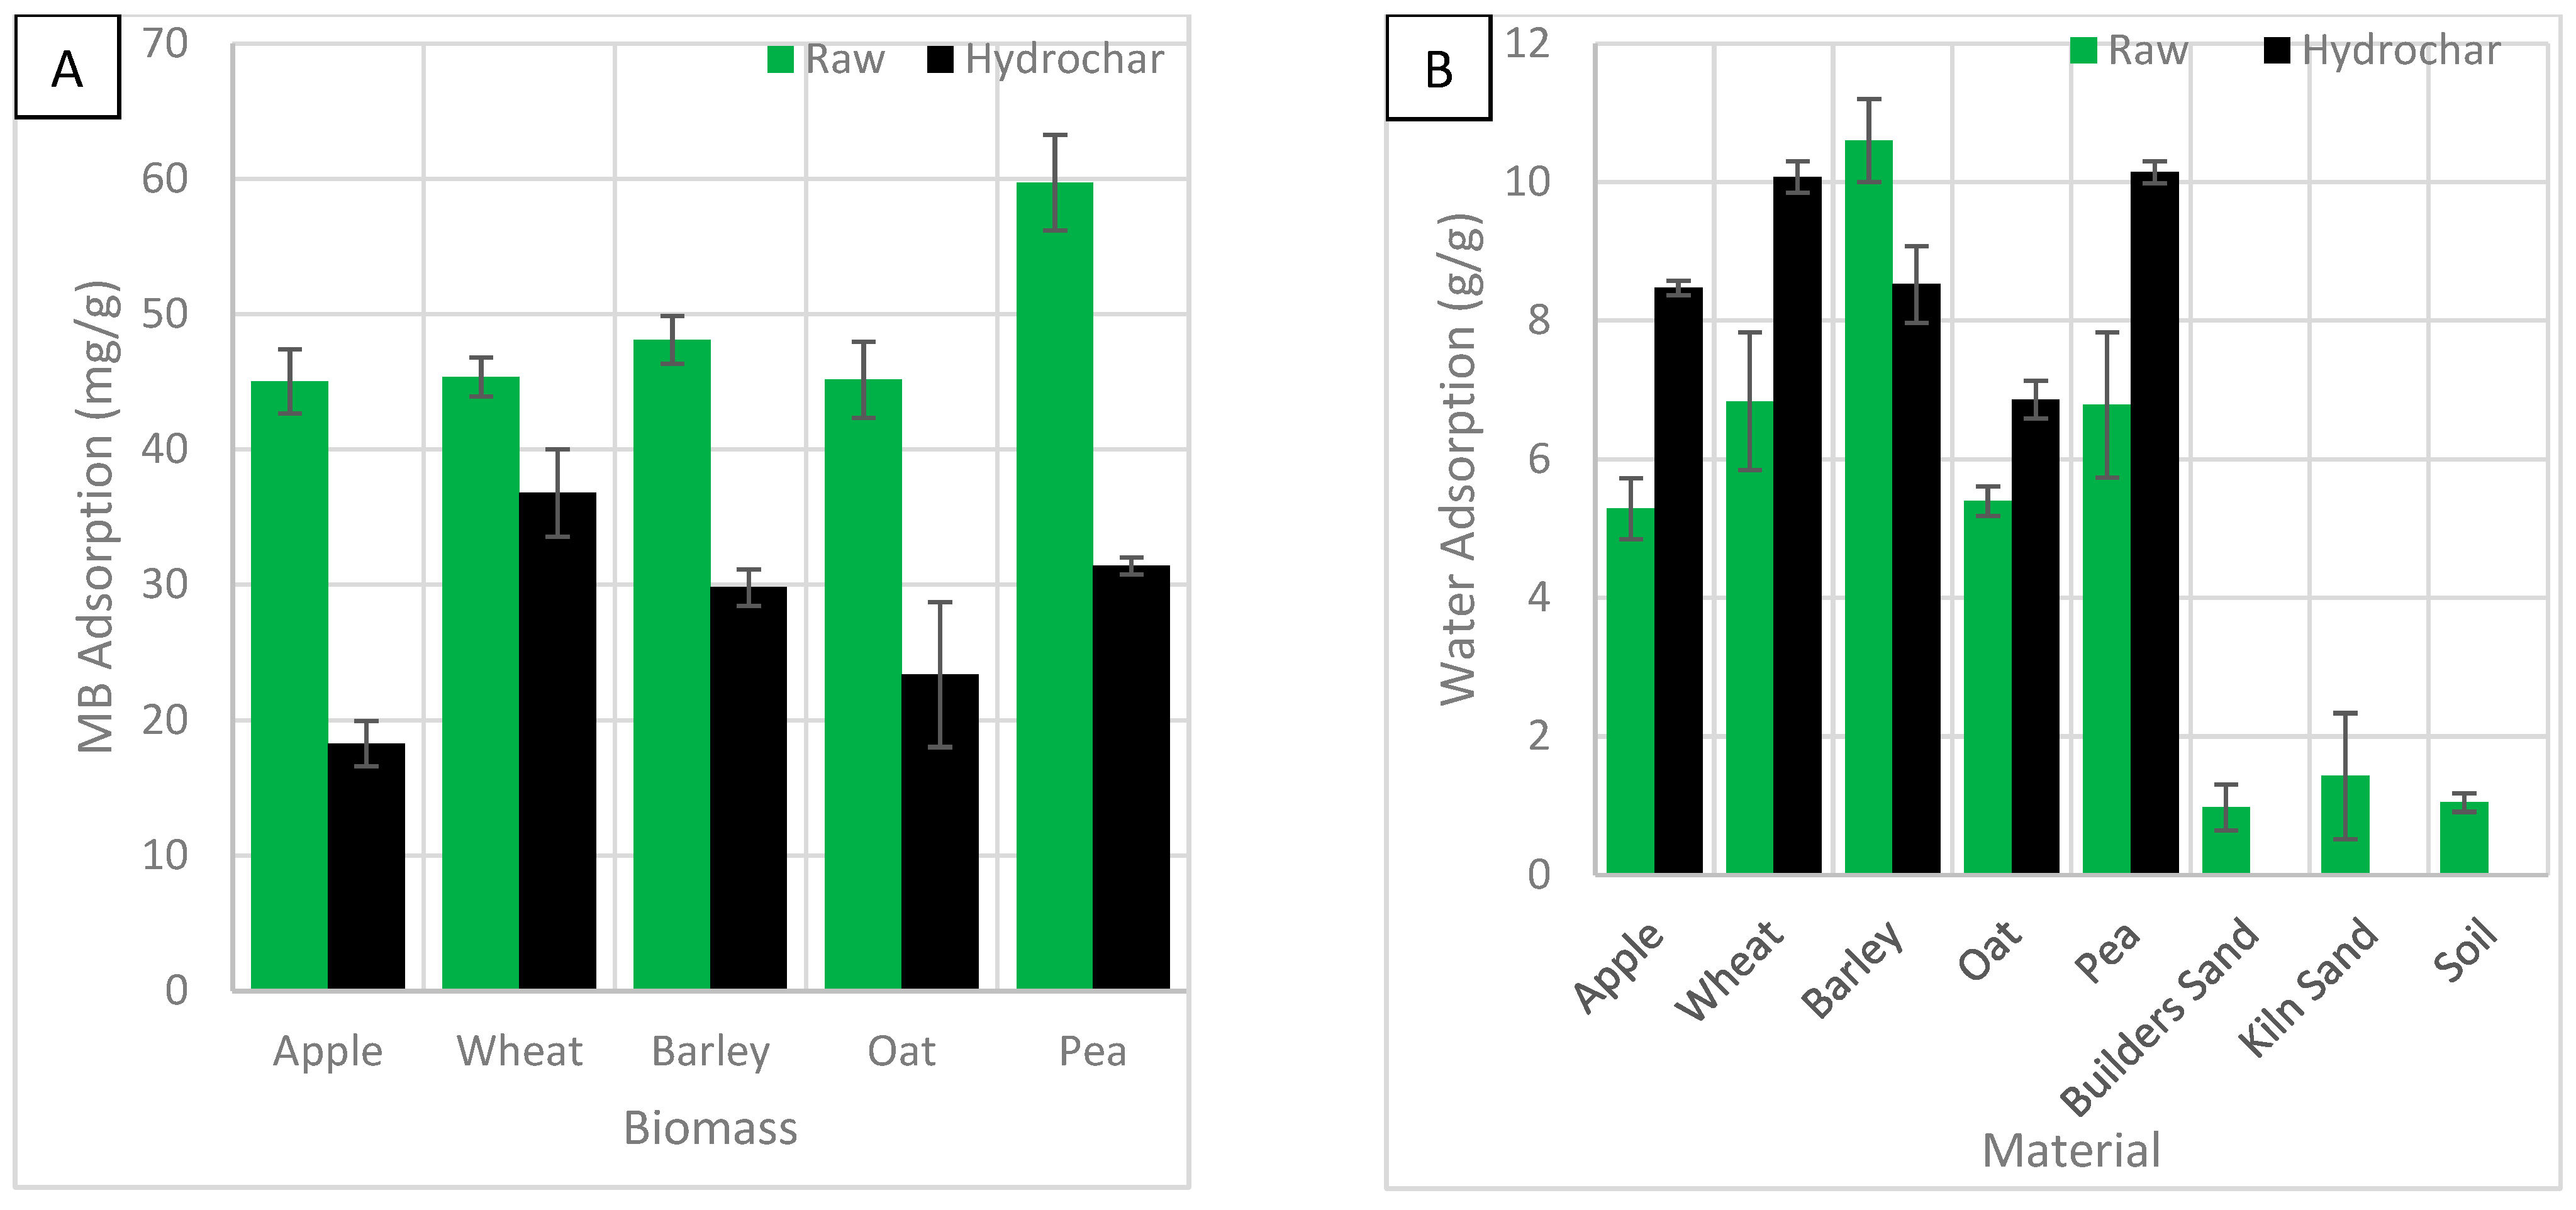
Figure 12 shows the effects of biomass feedstock on MB and water adsorption.
Figure 12A shows the effect of biomass feedstock on MB adsorption. Most of the standard error bars are small indicating the results are consistent. Oat HC shows larger bars, suggesting it is inconsistent and potentially unreliable as an adsorbent. HTC reduced the MB adsorption of all biomasses. HC usually have a low surface area and adsorption because the tarry solution blocks their porous surface during synthesis. Unmodified pea biomass showed the highest adsorption. Pea waste has shown high MB adsorption in previous studies [31]. Unmodified biomass is sometimes a good adsorber, because they have many useful functional groups, especially when they are reduced to small particle sizes. The biomass ranked pea > barley > wheat > oat > apple. Adsorption was reduced by 9–28 mg/g with pea HC showing the greatest reduction and wheat HC showing the least. Wheat HC was the best adsorber and apple HC was the worst. The hydrochar ranked wheat > pea> barely > oat > apple. Apple and oat material were consistently the worst adsorbers. Wheat was the least responsive to HTC and therefore is most similar to the original biomass, which may explain why wheat HC has a higher MB adsorption. Apple and pea were the most responsive and therefore likely lost many oxygen-containing functional groups, reducing adsorption.
Figure 12B shows the effect of biomass feedstock on water adsorption. The standard error bars for the HC are small, indicating the results are consistent. HTC improved the water adsorption capability in all biomasses by 2–3 g/g except barley, which lost 2 g/g. Unmodified biomass and HC were significantly better at adsorbing water than both sand and soil. Water adsorption by unmodified biomass ranked barely > wheat and pea > oat > apple. After HTC, pea showed the most notable change and oat showed the least. Adsorption by HC ranked wheat and pea > apple and barley > oat. Oat biomass and HC were consistently the worse adsorbers. Clay soil which is noted to have a high water holding capacity was not used in this study [44]. In another study, the addition of HC decreased the water holding capacity. However, they used clay soil which already had a high capacity [44].

3.6. Van Krevalen Diagram

The Van Krevalen diagram was developed to assess the quality of fuels. It can now be used to assess the quality of biomass-derived chars. A Van Krevalen diagram with annotated areas, adapted from another work is displayed in Figure A1 [52]. The coal section begins at an O/C ratio of 0.25 and a H/C ratio of 0.9. Decarboxylation reactions will decrease oxygen content, reducing the O/C atomic ratio, demethanation will decrease hydrogen content, reducing the H/C ratio and dehydration will decrease both atomic ratios [11,28]. A lower H/C ratio indicates increased aromaticity which means increased chemical and microbial stability [48]. Cellulose has a very high H/C and O/C ratio. Lignin has a lower H/C and O/C ratio.
Figure 13 shows the Van Krevalen diagrams for the produced HC.
Figure 13A shows the Van Krevalen diagram for HC produced under different process temperatures, solution ratios and residence times. The most coal-like substance was run 5, which had a low solution ratio and high temperature and times. They have H/C and O/C ratios within the coal and lignin cross-over section, suggesting they would make good solid fuel. At higher temperatures, more components containing O and H will be thermal degraded leaving a carbon-rich product. The worst carbonaceous material was run 8, high solution ratio and low temperature and time. This is likely because the temperature and processing time were not enough for effective carbonisation. The results indicate that demethanation, dehydration and decarboxylation were enhanced by higher temperatures, longer processing time and lower solution ratios of solution [18,23]. A reduction in oxygen content implies a decrease in carbonyl and hydroxyl functional groups; this increases hydrophobicity and therefore stability [19]. Decreases in H/C and O/C due to temperature and time increases indicate improved aromaticity and decreases polarity and oxygen-containing groups [6,29].
Figure 13B shows the Van Krevalen diagram of HC produced using different particle sizes. High and low sizes showed the high carbonisation, and the mid-range showed the least. In another study, larger particle size had a lower H/C and higher O/C ratio [37]. In another study, a particle size fraction of <0.25 mm and 0.5–0.25 mm had nearly identical H/C and O/C ratios [37].
Figure 13C shows the Van Krevalen diagram for HC produced using different solution pH and washing without acetone. Acid enhances carbonisation, producing highly carbonaceous HC. Acetone washing increases the O/C ratio. This is likely due to acetone dissolving organic components. It has been noted that acetone washing decreases the H/C ratio and increases the O/C ratio [34].
Figure 13D shows the Van Krevalen diagram for HC produced using different waste biomass feedstocks. Apple was the best biomass source for making carbonaceous materials. Pea HC had a higher H/C ratio and wheat, barley and oat HC had higher O/C ratios. This suggests apple is more susceptible to demethanation, dehydration and decarboxylation reactions. Pea is more resistant to demethanation, and oat, wheat and barley are more resistant to decarboxylation reactions.

3.7. Comparison

For comparison, the results of recent studies, from the current and the previous year, on HC from biomass are summarised in a table in Table A6. Areas selected for the comparison were feedstock, method, yield, carbon, oxygen and ash content, recovered carbon, HHV, energy yield and MB and water adsorption. Some boxes are blank where studies have not collected the same results. The studies are sorted in order of carbon content. The HC produced in this study rank highly. In this study, only 1 h of residence time was used. Some studies have used longer than this for no significant gain or lower properties, suggesting MW heating is a viable method which can improve results. The volumetric heating effect of MW likely enhanced carbonisation by increasing degradation. Carbon content and HV are higher than most HC, only being surpassed by HC produced at a higher temperature. Some of the HC shows very high ash content which could be problematic if used as a solid fuel or soil additive. MB adsorption is very low in comparison to other studies. After activation, the HC may show very high adsorption. The table shows the importance of investigating different feedstocks and production methods as they can produce drastically different results.

4. Conclusions

This study investigated how production variables affect the properties of HC. SEM, FTIR, TGA and CHN analysis characterise the produced material. The investigation into this set of variables and feedstock has not been done before. FTIR characterisation found that hydrothermal carbonisation caused a decrease in O–H and C–O and an increase in C=C and C=O, signifying decarboxylation and dehydration reactions. A high temperature had the most significant effect on O–H and C–O groups and a high solution ratio on C=C and C=O groups. SEM detected microspheres on the surface of the HC. TGA identified apple biomass had minuscule amounts of ash and no fixed carbon, whereas the other biomass ranged from 6–9% and 12–16%, respectively. The rest of the composition was relatively similar. It was found that the produced HC would have a carbon sequestration potential similar to unmodified biomass. The study found that solution ratio was the most significant factor in yield, carbon recovery and energy yield, with high solution ratios causing a decrease. The temperature was the most significant factor in carbon and oxygen content. Increasing the temperature increased carbon and decreased oxygen content. This, in turn, affected HHV with high temperatures producing a material with higher energy. HTC reduced MB adsorption and increased water adsorption. HC produced at a high solution ratio, high temperature and longer times showed the highest carbonisation. A smaller particle size increased yield but increased ash content. A particle size between 0.2 and 0.05 mm was the worst for carbon content and HHV. A lower solution pH increased carbon content, HHV, water adsorption and lowered yield, carbon recovery, energy yield and oxygen and ash content. A higher solution pH increased ash content and lowered yield, carbon recovery and energy yield. Washing with acetone decreased yield, carbon recovery, energy yield, carbon content, HHV and increased oxygen and ash content, and MB and water adsorption. Barley biomass showed the highest yield and carbon recovery; pea showed the highest energy yield and HHV. Apple showed the highest carbon content. All the HC lost significant MB adsorption capability but increased water adsorption. The produced HC had good carbon content and HVV compared to recent HC studies and was produced under milder conditions than some studies. All the biomass showed promise as solid fuels, soil amendment and precursor for activated carbon but lacked high adsorption of pollutants and stability for carbon sequestration. Future work could include the effect of HC produced under different conditions on plant growth and germination, the adsorption of other types of pollutants and chemical activation to enhance porosity.

Author Contributions

Conceptualisation: M.C.H. and S.H.Z.; formal analysis, investigation and Writing—original draft preparation: M.C.H.; supervisory role: D.R.P.; writing—review and editing: S.H.Z.; funding acquisition and supervision: S.H.Z. All authors have read and agreed to the published version of the manuscript.

Funding

This study was funded by the Teesside, Hull and York—Mobilising Bioeconomy Knowledge Exchange (THYME) (‘RG-ENERGY-ZEIN-3278637-University of York’) through Higher Education Funding Council for England (HEFCE).

Institutional Review Board Statement

Not applicable.

Informed Consent Statement

Not applicable.

Data Availability Statement

Not applicable.

Conflicts of Interest

The authors have no competing interests to declare that are relevant to the content of this article. All authors certify that they have no affiliations with or involvement in any organisation or entity with any financial interest or non-financial interest in the subject matter or materials discussed in this manuscript. The authors have no financial or proprietary interests in any material discussed in this article.

Appendix A

Table A1. Production, area and yield of biomass feedstocks.
CropProduction (Tonnes)Area (km2)Yield (kg/ha)Top Producers 2020
Apple86,442,71646,22418,701China, USA
Wheat760,925,8312,190,0693474China, India
Oat25,181,80597,7202577Canada, Russia
Barley157,030,764516,0143043Russia, Spain
Pea19,866,60125,3157848China, India
Table A2. HC results sectioned into the effect of process conditions, the effect of particle size, the effect of pH, the effect of acetone washing and the effect of feedstock and raw biomass results, with a colour scale.
RunProperties
YRCEYCHNOAHHVMBAWA
(%)(wt%)(MJ/kg)(mg/g)(g/g)
Apple Biomass 47.66.51.236.71.118.945.05.3
126.529.230.252.56.71.232.71.721.537.33.8
217.322.222.661.26.10.626.21.624.742.83.1
328.635.235.858.76.20.628.51.823.740.25.1
418.121.422.156.36.60.430.32.223.130.83.4
5 (pH of 2)35.446.746.262.95.41.424.21.824.618.38.5
630.736.436.656.46.10.929.72.322.538.15.9
721.724.925.754.76.70.431.62.122.429.02.5
822.424.024.751.06.80.434.52.320.843.66.5
<50 µm38.349.349.861.25.52.022.94.124.58.46.6
50–200 µm35.241.138.955.55.50.832.22.320.820.29.2
>200 µm32.742.441.961.75.51.125.22.824.211.28.3
pH of 4.538.749.148.760.45.61.626.12.823.717.88.8
pH of 738.749.750.061.25.81.325.62.724.425.37.8
pH of 9.536.445.946.460.15.81.625.43.324.136.66.8
pH of 1236.145.846.560.55.81.624.83.524.328.86.9
pH of 2
No Acetone
43.360.160.865.95.71.422.32.126.418.95.8
pH of 7
No Acetone
42.055.557.963.06.41.124.72.426.025.15.7
pH of 12
No Acetone
42.855.857.562.06.21.525.32.525.321.36.7
Wheat Biomass 45.16.20.732.79.318.345.46.8
Wheat HC40.351.950.158.15.40.626.05.922.736.810.1
Barley Biomass 43.86.21.133.28.017.748.110.1
Barley HC43.257.456.258.25.61.125.95.423.029.88.5
Pea Biomass 44.35.91.733.07.717.559.76.8
Pea HC40.054.963.260.87.61.320.75.627.731.410.1
Oat Biomass 45.96.10.634.66.518.045.25.4
Oat HC35.745.646.058.65.30.523.58.223.223.46.9
where Y is yield, C is carbon content, H is hydrogen content, N is nitrogen content, O is oxygen content, A is ash content, RC is recovered carbon, HHV is higher heating value, EY is energy yield, MBA is MB adsorption, WA is water adsorption.
Table A3. FTIR major peaks and groups.
Wavenumber (cm−1)GroupReference
3300 cm−1O–H stretching vibrations of carboxyl and phenolic hydroxyl groups which are often found in cellulose and lignin.[6,20,35]
2920–2915Asymmetric aliphatic C–H methylene groups.[6,20]
2850–2840Symmetric aliphatic C–H methylene groups or
aromaticity.
[6,16,20]
1740–1690–COOH carbonyl groups, C=C groups or C=O carboxyl groups.[16,20,41]
1620–1580Stretching C=C vibrations of aromatic rings.[16,20]
1510–1490C=C stretching vibrations indicating aromatic rings.[16,20,41]
1440–1420Skeletal aromatic and ester (C=C).[16]
1360C–O and C–OH bonds in esters and alcohols found in cellulose.[20]
1220C–O and C–O–C bonds of ether, alcohols and phenols from cellulose and lignin.[10,19,22]
1200–1000C–O vibrations of a primary alcohol bond or C–O–C ether or ester bonds which are found in hemicellulose and lignin.[6,16,18,20,35,41]
780–760Aromatic C–H bonds.[19,22]
Table A4. Recalcitrance values of HC produced at different conditions.
RunRatio (mL/g)Temperature (°C)Time (min) R 50 , h y d r o c h a r T 50 , h y d r o c h a r
510220600.44386
250220600.43385
450220100.4358
310220100.4358
610180600.38338
750180600.38335
110180100.36321
850180100.35314
Table A5. Coded and actual equation for each HC property, with colour coding.
PropertyInterceptRatioTempTimeRatio × TempRatio × TimeTemp × Time
YieldCoded25.1−5.213−0.2381.188−1.938−1.563
Actual1.280.8180.1330.141−0.00484−0.00313
p-Value 0.00390.54120.06750.0270.0407
Carbon ContentCoded56.7−0.9133.062.09
Actual24.5−0.04560.1530.0835
p-Value 0.002<0.0001<0.0001
Oxygen ContentCoded29.70.938−2.41−1.79 0.0375−0.313
Actual50.60.0443−0.09880.0513 7.5e−5−0.000625
p-Value 0.0002<0.0001<0.0001 0.09550.0016
AshCoded1.980.075−0.125−0.025 −0.175−0.125
Actual1.030.0160.00250.0595 −0.00035−0.00025
p-Value 0.09550.03770.423 0.01980.0377
HHVCoded22.9−0.1631.110.6380.03750.163
Actual12.0−0.03830.05280.01589.4e−50.000325
p-Value 0.00590.00010.00040.09550.0059
Recovered CarbonCoded30−6.875
Actual40.3−0.344
p-Value 0.0102
Energy YieldCoded30.5−6.711.192.29−2.61−1.91
Actual−17.71.10.2550.206−0.006531−0.00383
p-Value 0.00560.1430.04530.03520.0629
MB AdsorptionCoded35.0
Actual35.0
p-Value
Water AdsorptionCoded4.85
Actual4.85
p-Value
Figure A1. Example Van Krevalen diagram with annotation.
Processes 10 01756 g0a1
Table A6. Comparison of recent methods to produce HC and results.
FeedstockMethody (%)C (wt.%)O (wt.%)A (wt.%)RC (%)HHV (MJ/kg)EY (%)MBA (mg/g)Reference
Retail fuel waste0.15 g/mL, 500 g,
250 °C, 0.55–0.58 MPa, 60 min
5775.711.50.6793680 [15]
Brewer’s spent grain0.15 g/mL, 500 g,
250 °C, 0.55–0.58 MPa, 60 min
4971.516.91.671.7930.272 [15]
Dairy cheese whey0.05 g/mL, 500 g,
250 °C, 0.55–0.58 MPa, 60 min
3869.815.15.359.230.562 [15]
Corn stalk1 g/15 mL, 300 °C, 60 min 67250 26 [19]
AppleMicrowave, 1 g/10 mL, pH of 2 citric acid, 220 °C, 60 min43.365.822.32.160.126.460.818.9This study
Rape straw1 g/10 mL, 240 °C, 30 min48.765.6715.1710.8379.226.689.2 [1]
Cotton stalk4% H2SO4 then 5% NaOH, 95 °C, 4 h, 1 g/10 mL, 220 °C, 360 min, 1:2 KOH solution, 70 °C, 720 min 64246 24 198[16]
Sewage sludge8 g/70 mL, 180 °C, 240 min, washed with ethanol605812261072183172[10]
Beet pulp20 g/320 mL, 220 °C, 60 min4455371562257 [23]
Bamboo25 g/125 mL, 15 mL acrylic acid, 0.45 g Ammonium persulphate, 200 °C, 1440 min, HC washed in 0.1 M NaOH 120 min. 542217 22 718[35]
Oil extracted food waste10 g/100 mL, 270 °C, 90 min3552832412450 [11]
Rice straw1:10 g/mL, 240 °C, 30 min55523111751985 [2]
Sea lettuce250 mL slurry, 200 °C, 120 min9482520202023 [18]
Wheat straw20 g, 50% moisture, 220 °C,
30 min
6046.647.58.972.2522.282.73 [33]
Poultry litter250 °C, 60 min50.8344.6511.9135.6464.731974.44 [13]
Biogas digestate15% DM, 175 g, 210 °C, 30 min75422230791675 [28]
Paper waste1:15 g/mL, 240 °C, 60 min73111289837127 [17]
Coffee grounds and Olive oil cake1.2:0.8 g/g. 0.1 M HNO3, 2 g/100 mL, 200 °C, 360 min 238[20]
Mangosteen peel5 g/50 mL, 200 °C, 120 min82.8 131.6[46]
Where Y is yield, C is carbon content, H is hydrogen content, A is ash content, RC is recovered carbon, HHV is higher heating value, EY is energy yield, MBA is MB adsorption.

References

  1. Cheng, C.; He, Q.; Ismail, T.M.; Mosqueda, A.; Ding, L.; Yu, J.; Yu, G. Hydrothermal carbonization of rape straw: Effect of reaction parameters on hydrochar and migration of AAEMs. Chemosphere 2022, 291, 132785. [Google Scholar] [CrossRef] [PubMed]
  2. Wei, J.; Guo, Q.; Song, X.; Ding, L.; Mosqueda, A.; Liu, Y.; Yoshikawa, K.; Yu, G. Effect of hydrothermal carbonization temperature on reactivity and synergy of co-gasification of biomass hydrochar and coal. Appl. Therm. Eng. 2021, 183, 116232. [Google Scholar] [CrossRef]
  3. Yang, W.; Shimanouchi, T.; Kimura, Y. Characterization of hydrochar prepared from hydrothermal carbonization of peels of Carya cathayensis sarg. Desalin. Water Treat. 2014, 53, 2831–2838. [Google Scholar] [CrossRef]
  4. Waudby, H.; Zein, S.H. A circular economy approach for industrial scale biodiesel production from palm oil mill effluent using microwave heating: Design, simulation, techno-economic analysis and location comparison. Process Saf. Environ. Prot. 2021, 148, 1006–1018. [Google Scholar] [CrossRef]
  5. Thoppil, Y.; Zein, S.H. Techno-economic analysis and feasibility of industrial-scale biodiesel production from spent coffee grounds. J. Clean. Prod. 2021, 307, 127113. [Google Scholar] [CrossRef]
  6. Li, X.; Wang, R.; Shao, C.; Li, D.; Bai, S.; Hou, N.; Zhao, X. Biochar and Hydrochar from Agricultural Residues for Soil Conditioning: Life Cycle Assessment and Microbially Mediated C and N Cycles. ACS Sustain. Chem. Eng. 2022, 10, 3574–3583. [Google Scholar] [CrossRef]
  7. Chen, N.; Cao, S.; Zhang, L.; Peng, X.; Wang, X.; Ai, Z.; Zhang, L. Structural dependent Cr(VI) adsorption and reduction of biochar: Hydrochar versus pyrochar. Sci. Total Environ. 2021, 783, 147084. [Google Scholar] [CrossRef]
  8. Zein, S.H.; Gyamera, B.A.; Skoulou, V.K. Nanocarbons from acid pretreated Waste Coffee Grounds using microwave radiation. Mater. Lett. 2017, 193, 46–49. [Google Scholar] [CrossRef]
  9. Sevilla, M.; Maciá-Agulló, J.A.; Fuertes, A.B. Hydrothermal carbonization of biomass as a route for the sequestration of CO2: Chemical and structural properties of the carbonized products. Biomass Bioenergy 2011, 35, 3152–3159. [Google Scholar] [CrossRef]
  10. Tu, W.; Liu, Y.; Xie, Z.; Chen, M.; Ma, L.; Du, G.; Zhu, M. A novel activation-hydrochar via hydrothermal carbonization and KOH activation of sewage sludge and coconut shell for biomass wastes: Preparation, characterization and adsorption properties. J. Colloid Interface Sci. 2021, 593, 390–407. [Google Scholar] [CrossRef]
  11. Su, H.; Zhou, X.; Zheng, R.; Zhou, Z.; Zhang, Y.; Zhu, G.; Yu, C.; Hantoko, D.; Yan, M. Hydrothermal carbonization of food waste after oil extraction pre-treatment: Study on hydrochar fuel characteristics, combustion behavior, and removal behavior of sodium and potassium. Sci. Total Environ. 2021, 754, 142192. [Google Scholar] [CrossRef] [PubMed]
  12. Scrinzi, D.; Bona, D.; Denaro, A.; Silvestri, S.; Andreottola, G.; Fiori, L. Hydrochar and hydrochar co-compost from OFMSW digestate for soil application: 1. production and chemical characterization. J. Environ. Manag. 2022, 309, 114688. [Google Scholar] [CrossRef] [PubMed]
  13. Mau, V.; Arye, G.; Gross, A. Poultry litter hydrochar as an amendment for sandy soils. J. Environ. Manag. 2020, 271, 110959. [Google Scholar] [CrossRef]
  14. Güleç, F.; Riesco, L.M.G.; Williams, O.; Kostas, E.T.; Samson, A.; Lester, E. Hydrothermal conversion of different lignocellulosic biomass feedstocks—Effect of the process conditions on hydrochar structures. Fuel 2021, 302, 121166. [Google Scholar] [CrossRef]
  15. Pecchi, M.; Baratieri, M.; Goldfarb, J.L.; Maag, A.R. Effect of solvent and feedstock selection on primary and secondary chars produced via hydrothermal carbonization of food wastes. Bioresour. Technol. 2022, 348, 126799. [Google Scholar] [CrossRef]
  16. Zhang, L.; Tan, J.; Xing, G.; Dou, X.; Guo, X. Cotton stalk-derived hydrothermal carbon for methylene blue dye removal: Investigation of the raw material plant tissues. Bioresour. Bioprocess. 2021, 8, 10. [Google Scholar] [CrossRef]
  17. Zhao, Y.; Jia, G.; Shang, Y.; Zhao, P.; Cui, X.; Guo, Q. Chlorine migration during hydrothermal carbonization of recycled paper wastes and fuel performance of hydrochar. Process Saf. Environ. Prot. 2022, 158, 495–502. [Google Scholar] [CrossRef]
  18. Shrestha, A.; Acharya, B.; Farooque, A.A. Study of hydrochar and process water from hydrothermal carbonization of sea lettuce. Renew. Energy 2021, 163, 589–598. [Google Scholar] [CrossRef]
  19. Hu, C.; Feng, J.; Zhou, N.; Zhu, J.; Zhang, S. Hydrochar from corn stalk used as bio-asphalt modifier: High-temperature performance improvement. Environ. Res. 2021, 193, 110157. [Google Scholar] [CrossRef]
  20. Alshareef, S.A.; Alqadami, A.A.; Khan, M.A.; Alanazi, H.S.; Siddiqui, M.R.; Jeon, B.-H. Simultaneous co-hydrothermal carbonization and chemical activation of food wastes to develop hydrochar for aquatic environmental remediation. Bioresour. Technol. 2022, 347, 126363. [Google Scholar] [CrossRef]
  21. Bona, D.; Scrinzi, D.; Tonon, G.; Ventura, M.; Nardin, T.; Zottele, F.; Andreis, D.; Andreottola, G.; Fiori, L.; Silvestri, S. Hydrochar and hydrochar co-compost from OFMSW digestate for soil application: 2. agro-environmental properties. J. Environ. Manag. 2022, 312, 114894. [Google Scholar] [CrossRef] [PubMed]
  22. Dhaouadi, F.; Sellaoui, L.; Hernández-Hernández, L.E.; Bonilla-Petriciolet, A.; Mendoza-Castillo, D.I.; Reynel-Ávila, H.E.; González-Ponce, H.A.; Taamalli, S.; Louis, F.; Lamine, A.B. Preparation of an avocado seed hydrochar and its application as heavy metal adsorbent: Properties and advanced statistical physics modeling. Chem. Eng. J. 2021, 419, 129472. [Google Scholar] [CrossRef]
  23. Wilk, M.; Śliz, M.; Gajek, M. The effects of hydrothermal carbonization operating parameters on high-value hydrochar derived from beet pulp. Renew. Energy 2021, 177, 216–228. [Google Scholar] [CrossRef]
  24. Nain, S.; Singh, R.; Ravichandran, S. Importance of Microwave Heating in Organic Synthesis. Adv. J. Chem. -Sect. A 2019, 2, 94–104. [Google Scholar]
  25. Hibbert, S.; Welham, K.; Zein, S.H. An innovative method of extraction of coffee oil using an advanced microwave system: In comparison with conventional Soxhlet extraction method. SN Appl. Sci. 2019, 1, 1467. [Google Scholar] [CrossRef]
  26. Touhami, D.; Zhu, Z.; Balan, W.S.; Janaun, J.; Haywood, S.; Zein, S. Characterization of rice husk-based catalyst prepared via conventional and microwave carbonisation. J. Environ. Chem. Eng. 2017, 5, 2388–2394. [Google Scholar] [CrossRef]
  27. Knappe, V.; Paczkowski, S.; Robles, L.A.D.; Gonzales, A.; Pelz, S. Reducing Willow Wood Fuel Emission by Low Temperature Microwave Assisted Hydrothermal Carbonization. J. Vis. Exp. 2019, 147, e58970. [Google Scholar] [CrossRef]
  28. Cao, Z.; Hülsemann, B.; Wüst, D.; Oechsner, H.; Lautenbach, A.; Kruse, A. Effect of residence time during hydrothermal carbonization of biogas digestate on the combustion characteristics of hydrochar and the biogas production of process water. Bioresour. Technol. 2021, 333, 125110. [Google Scholar] [CrossRef]
  29. Liu, Y.; Sun, Y.; Wan, Z.; Jing, F.; Li, Z.; Chen, J.; Tsang, D.C.W. Tailored design of food waste hydrochar for efficient adsorption and catalytic degradation of refractory organic contaminant. J. Clean. Prod. 2021, 310, 127482. [Google Scholar] [CrossRef]
  30. Food and Agriculture Organization of the United Nations. FAOSTAT. Available online: https://www.fao.org/faostat/en/#data/QCL (accessed on 25 July 2022).
  31. Holliday, M.C.; Parsons, D.R.; Zein, S.H. Agricultural Pea Waste as a Low-Cost Pollutant Biosorbent for Methylene Blue Removal: Adsorption Kinetics, Isotherm And Thermodynamic Studies. Biomass Convers. Biorefin. 2022. [Google Scholar] [CrossRef]
  32. Zein, S.H.; Antony, A. Techno-economic analysis and feasibility of industrial-scale ac-tivated carbon production from agricultural pea waste using microwave-assisted pyrolysis: A circular economy approach. Processes 2022, 10, 1702. [Google Scholar] [CrossRef]
  33. Yu, Y.; Lau, A.; Sokhansanj, S. Hydrothermal carbonization and pelletization of moistened wheat straw. Renew. Energy 2022, 190, 1018–1028. [Google Scholar] [CrossRef]
  34. Zhu, X.; Liu, Y.; Qian, F.; Lei, Z.; Zhang, Z.; Zhang, S.; Chen, J.; Ren, Z.J. Demethanation Trend of Hydrochar Induced by Organic Solvent Washing and Its Influence on Hydrochar Activation. Environ. Sci. Technol. 2017, 51, 10756–10764. [Google Scholar] [CrossRef] [PubMed]
  35. Lv, B.-W.; Xu, H.; Guo, J.-Z.; Bai, L.-Q.; Li, B. Efficient adsorption of methylene blue on carboxylate-rich hydrochar prepared by one-step hydrothermal carbonization of bamboo and acrylic acid with ammonium persulphate. J. Hazard. Mater. 2022, 421, 126741. [Google Scholar] [CrossRef] [PubMed]
  36. Faradilla, R.F.; Lucia, L.; Hakovirta, M. Remarkable Physical and Thermal Properties of Hydrothermal Carbonized Nanoscale Cellulose Observed from Citric Acid Catalysis and Acetone Rinsing. Nanomaterials 2020, 10, 1049. [Google Scholar] [CrossRef]
  37. Wüst, D.; Correa, C.R.; Jung, D.; Zimmermann, M.C.; Kruse, A.; Fiori, L. Understanding the influence of biomass particle size and reaction medium on the formation pathways of hydrochar. Biomass Convers. Biorefin. 2019, 10, 1357–1380. [Google Scholar]
  38. Heidari, M.; Salaudeen, S.; Dutta, A.; Acharya, B. Effects of Process Water Recycling and Particle Sizes on Hydrothermal Carbonization of Biomass. Energy Fuels 2018, 32, 11576–11586. [Google Scholar] [CrossRef]
  39. Flora, J.F.R.; Lu, X.; Li, L.; Flora, J.R.V.; Berge, N.D. The effects of alkalinity and acidity of process water and hydrochar washing on the adsorption of atrazine on hydrothermally produced hydrochar. Chemosphere 2013, 93, 1989–1996. [Google Scholar] [CrossRef]
  40. Li, Y.; Liu, H.; Xiao, K.; Jin, M.; Xiao, H.; Yao, H. Combustion and Pyrolysis Characteristics of Hydrochar Prepared by Hydrothermal Carbonization of Typical Food Waste: Influence of Carbohydrates, Proteins, and Lipids. Energy Fuels 2020, 34, 430–439. [Google Scholar] [CrossRef]
  41. Qu, J.; Lin, X.; Liu, Z.; Liu, Y.; Wang, Z.; Liu, S.; Meng, Q.; Tao, Y.; Hu, Q.; Zhang, Y. One-pot synthesis of Ca-based magnetic hydrochar derived from consecutive hydrothermal and pyrolysis processing of bamboo for high-performance scavenging of Pb(II) and tetracycline from water. Bioresour. Technol. 2022, 343, 126046. [Google Scholar] [CrossRef]
  42. Waters, C.L.; Janupala, R.R.; Mallinson, R.G.; Lobban, L.L. Staged thermal fractionation for segregation of lignin and cellulose pyrolysis products: An experimental study of residence time and temperature effects. J. Anal. Appl. Pyrolysis 2017, 126, 380–389. [Google Scholar] [CrossRef]
  43. Harvey, O.R.; Kuo, L.-J.; Zimmerman, A.R.; Louchouarn, P.; Amonette, J.E.; Herbert, B.E. An Index-Based Approach to Assessing Recalcitrance and Soil Carbon Sequestration Potential of Engineered Black Carbons (Biochars). Environ. Sci. Technol. 2012, 46, 1415–1421. [Google Scholar] [CrossRef] [PubMed]
  44. Kalderis, D.; Papameletiou, G.; Kayan, B. Assessment of Orange Peel Hydrochar as a Soil Amendment: Impact on Clay Soil Physical Properties and Potential Phytotoxicity. Waste Biomass Valoriz. 2018, 10, 3471–3484. [Google Scholar]
  45. Eibisch, N.; Helfrich, M.; Don, A.; Mikutta, R.; Kruse, A.; Ellerbrock, R.; Flessa, H. Properties and Degradability of Hydrothermal Carbonization Products. J. Environ. Qual. 2013, 42, 1565–1573. [Google Scholar] [CrossRef] [PubMed]
  46. Hamid, N.A.; You, J.J. Mangosteen Peel-Derived Hydrochar Prepared via Hydrothermal Carbonization for Methylene Blue Removal. IOP Conf. Ser. Earth Environ. Sci. 2021, 765, 012114. [Google Scholar] [CrossRef]
  47. Dieguez-Alonso, A.; Funke, A.; Anca-Couce, A.; Rombolà, A.G.; Ojeda, G.; Bachmann, J.; Behrendt, F. Towards Biochar and Hydrochar Engineering—Influence of Process Conditions on Surface Physical and Chemical Properties, Thermal Stability, Nutrient Availability, Toxicity and Wettability. Energies 2018, 11, 496. [Google Scholar] [CrossRef]
  48. Kavindi, G.A.G.; Lei, Z. Development of Activated Hydrochar from Paddy Straw for Nutrient Adsorption and Crop Water Management. Water Resour. Manag. X 2019, 229, 67–77. [Google Scholar]
  49. Abel, S.; Peters, A.; Trinks, S.; Schonsky, H.; Facklam, M.; Wessolek, G. Impact of biochar and hydrochar addition on water retention and water repellency of sandy soil. Geoderma 2013, 202–203, 183–191. [Google Scholar] [CrossRef]
  50. Prabhasankar, P.; Haridas Rao, P. Effect of different milling methods on chemical composition of whole wheat flour. Eur. Food Res. Technol. 2001, 213, 465–469. [Google Scholar] [CrossRef]
  51. Yan, W.; Hoekman, S.K.; Broch, A.; Coronella, C.J. Effect of hydrothermal carbonization reaction parameters on the properties of hydrochar and pellets. Environ. Prog. Sustain. Energy 2014, 33, 676–680. [Google Scholar] [CrossRef]
  52. Trif-Tordai, G.; Ionel, I. Waste Biomass as Alternative Bio-Fuel—Co-Firing versus Direct Combustion. In Alternative Fuel; Maximino, M., Ed.; IntechOpen: London, UK, 2011. [Google Scholar]
Figure 1. FTIR spectrum of (A) HC produced under different process temperatures, solution ratio and residence time, Run 5, Run 6, Run 2 and Run 3, respectively, (B) HC produced at different solution pH and washed with acetone, (C) HC produced using different particle size and (D) HC produced from different biomass feedstocks.
Processes 10 01756 g001
Figure 2. SEM image of Run 1 (A), Run 2 (B) and Run 3 (C) showing microspheres.
Processes 10 01756 g002
Figure 3. TGA characterisation of biomass.
Processes 10 01756 g003
Figure 4. Cubic display of the effect of process temperature, solution ratio and residence time on (A) hydrochar yield, (B) carbon content, (C) oxygen content and (D) ash content, with highlighted relationships and direction of development.
Processes 10 01756 g004aProcesses 10 01756 g004b
Figure 5. Cubic display of the effect of process temperature, solution ratio and residence time on (A) HHV, (B) recovered carbon, (C) and energy yield, with highlighted relationships and direction of development.
Processes 10 01756 g005
Figure 6. Cubic display of the effect of process temperature, solution ratio and residence time on (A) MB adsorption and (B) water adsorption, with highlighted relationships and direction of development.
Processes 10 01756 g006
Figure 7. The effect of particle size on (A) HC yield, carbon recovery and energy yield, (B) carbon, oxygen and ash content and (C) HHV.
Processes 10 01756 g007
Figure 8. The effect of particle size on (A) MB adsorption and (B) water adsorption.
Processes 10 01756 g008
Figure 9. The effect of solution pH and washing with acetone on (A) yield, carbon recovery and energy yield, (B) carbon and oxygen content, (C) ash content and (D) HHV.
Processes 10 01756 g009aProcesses 10 01756 g009b
Figure 10. The effect of solution pH and washing with acetone on (A) MB adsorption and (B) water adsorption.
Processes 10 01756 g010
Figure 11. The effect of biomass feedstock on (A) yield, carbon recovery and energy yield, (B) carbon, oxygen and ash content and (C) HHV.
Processes 10 01756 g011aProcesses 10 01756 g011b
Figure 12. The effect of biomass feedstock on (A) MB adsorption and (B) water adsorption, including other mediums.
Processes 10 01756 g012
Figure 13. Van Krevalen diagrams of (A) HC produced under different process conditions, (B) HC produced using different particle sizes, (C) HC produced using different solution pH and acetone washing, where A signifies acetone washing, and (D) HC produced using different biomass feedstocks, where ‘Aple’ is apple, ‘Wht’ is wheat, Bly is barley.
Processes 10 01756 g013
Table 1. Total experimental runs, sectioned into the effect of process conditions on apple biomass, the effect of particle size, the effect of pH, the effect of acetone washing and the effect of feedstock.
RunVariables
FeedSize (µm)pHRatio (mL/g)Temp (°C)Time (min)Acetone
1Apple<20021018010Yes
2Apple<20025022060Yes
3Apple<20021022010Yes
4Apple<20025022010Yes
5Apple<20021022060Yes
6Apple<20021018060Yes
7Apple<20025018060Yes
8Apple<20025018010Yes
Effect of particle sizeApple<5021022060Yes
Apple50–20021022060Yes
Apple>20021022060Yes
Effect of solution pHApple<2004.51022060Yes
Apple<20071022060Yes
Apple<2009.51022060Yes
Apple<200121022060Yes
Effect of acetone washingApple<20021022060No
Apple<20071022060No
Apple<200121022060No
Effect of feedstockWheat<20021022060Yes
Barley<20021022060Yes
Oat<20021022060Yes
Pea<20021022060Yes
Table 2. Biomass feedstock composition and proximate analysis, with colour scale.
Composition (%)Proximate Analysis (%)Elemental Composition, as Received (%)Elemental Composition, Dry Ash-Free Basis (%)
BHLLMVFCACHNOCHNO
Wheat5924670149456133537138
Oat6027671177466235537140
Pea5527773128446233527239
Barley5527871148446133527140
Apple552979201487137527140
Publisher’s Note: MDPI stays neutral with regard to jurisdictional claims in published maps and institutional affiliations.

