
A Study on Flow Field Characteristics and Air Purifier with Barrier Effects


Abstract
:1. Introduction
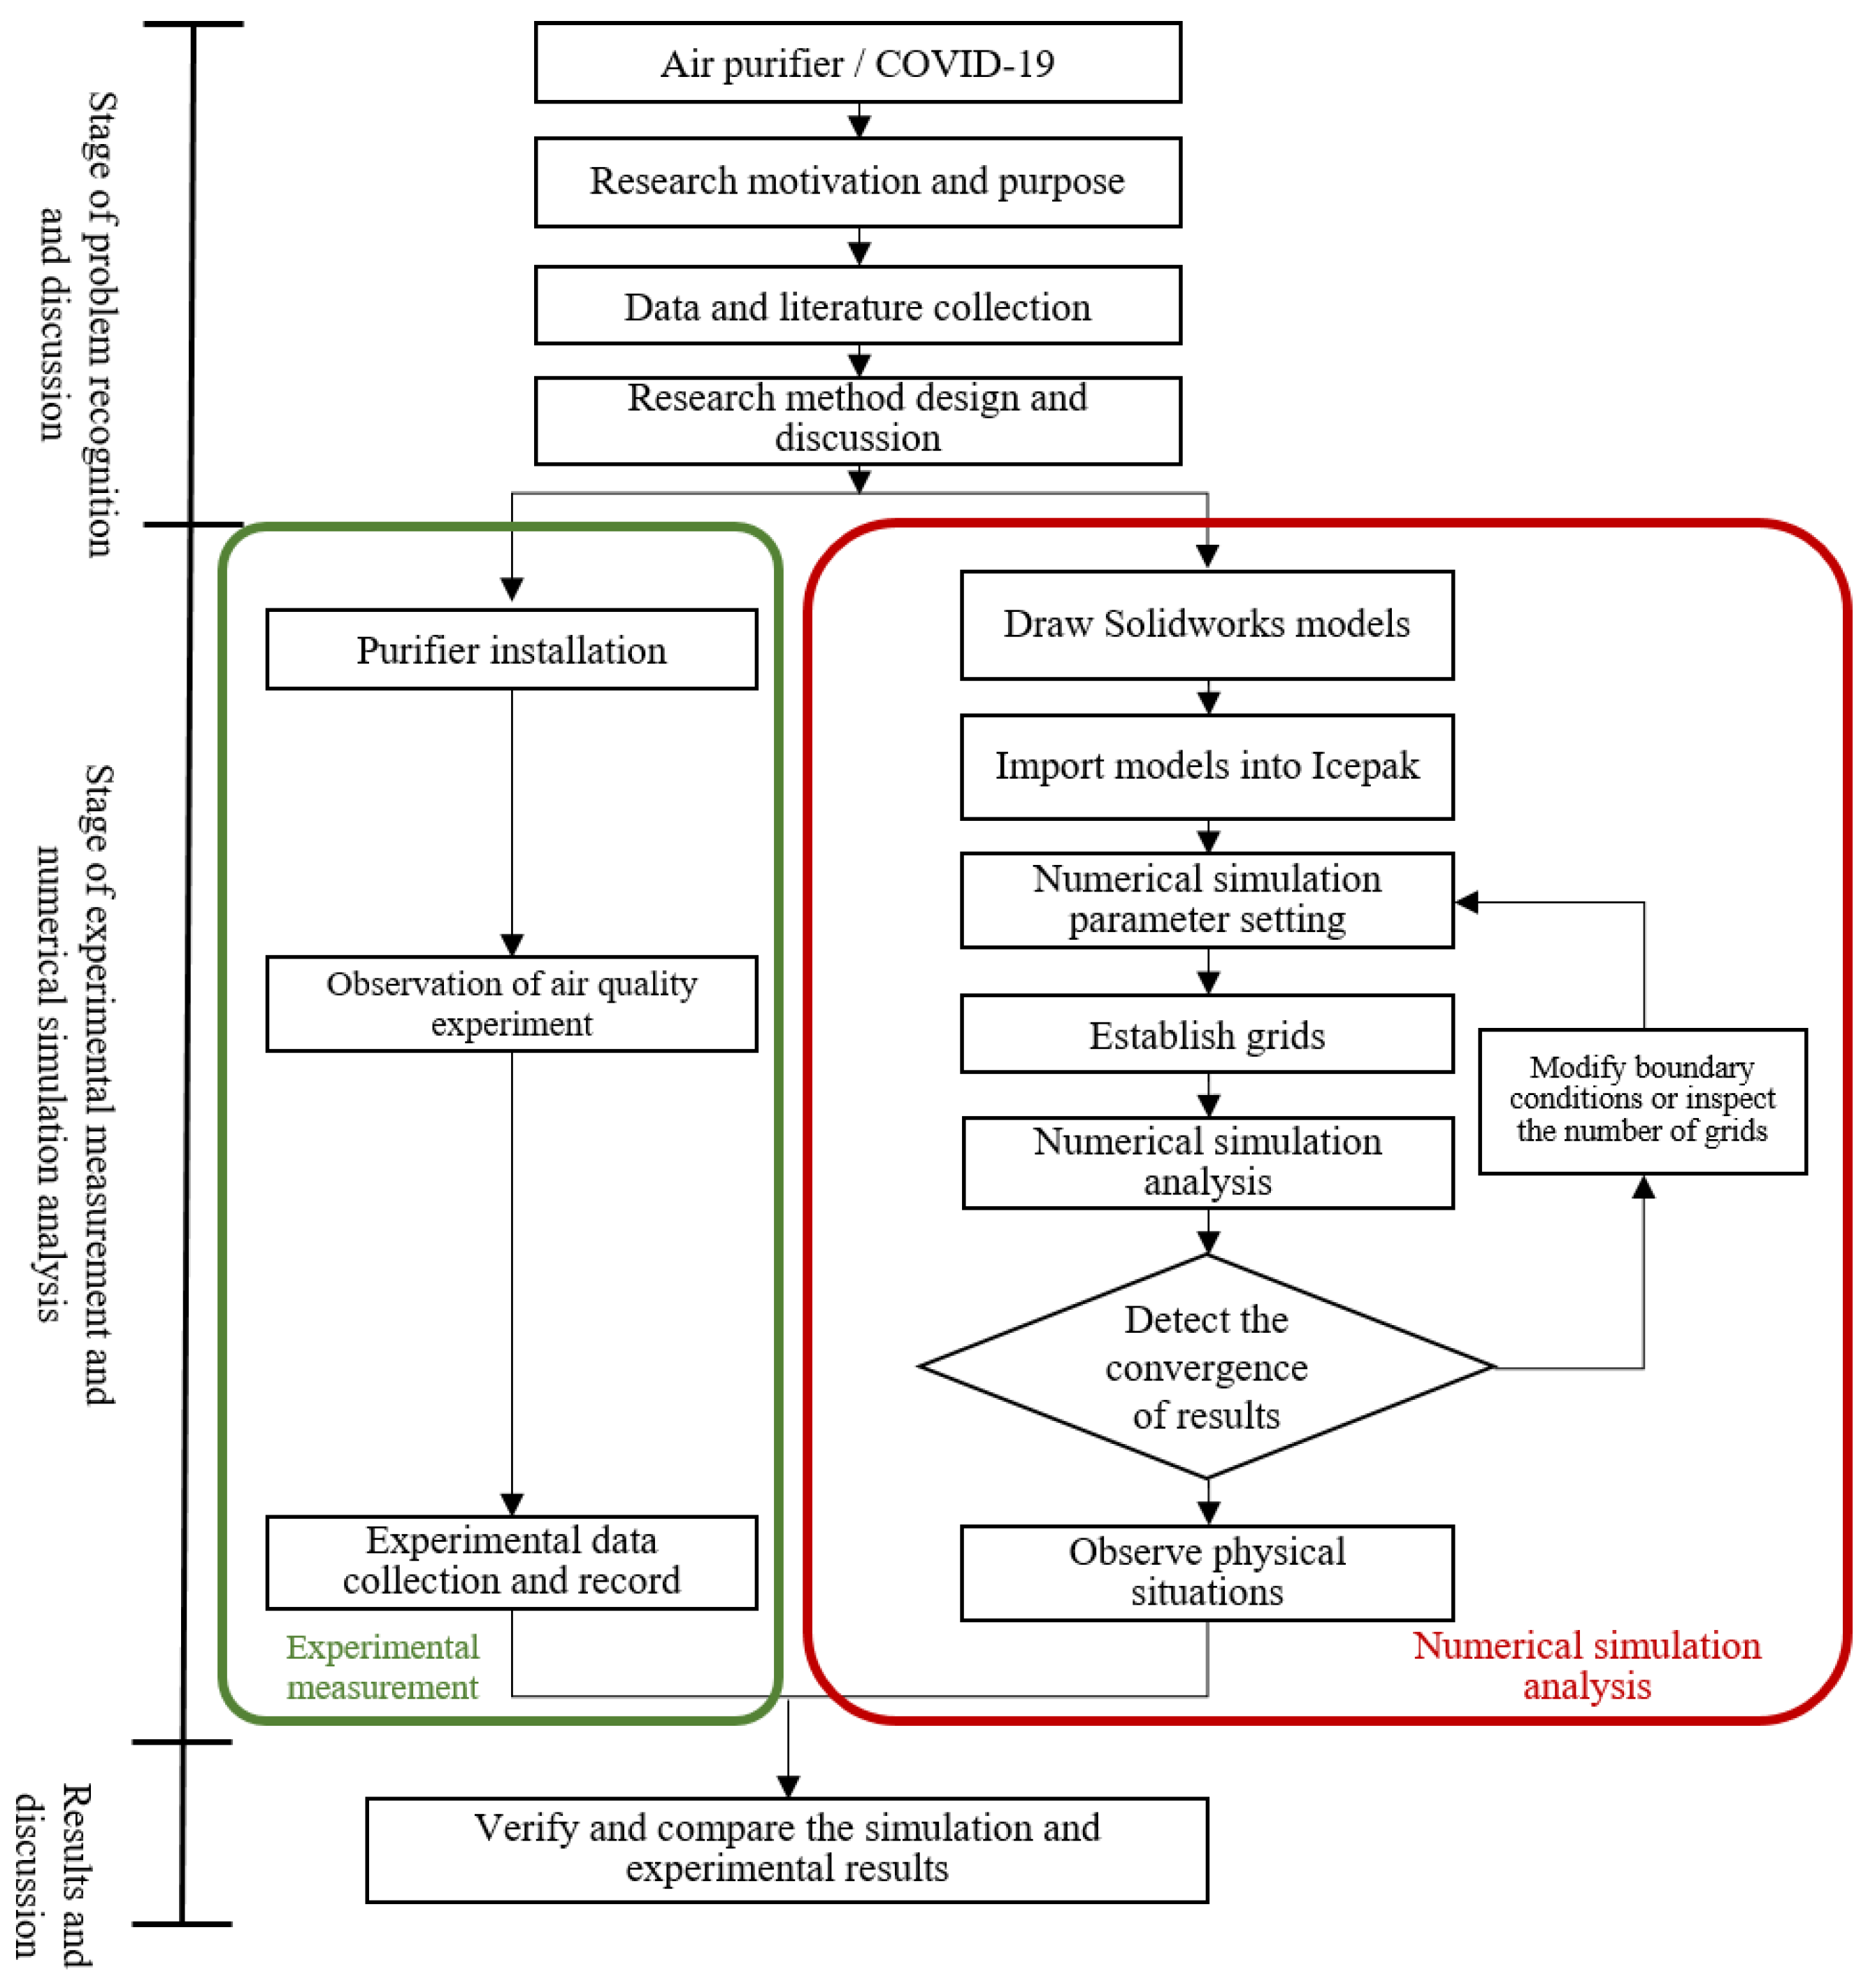
2. Research Method
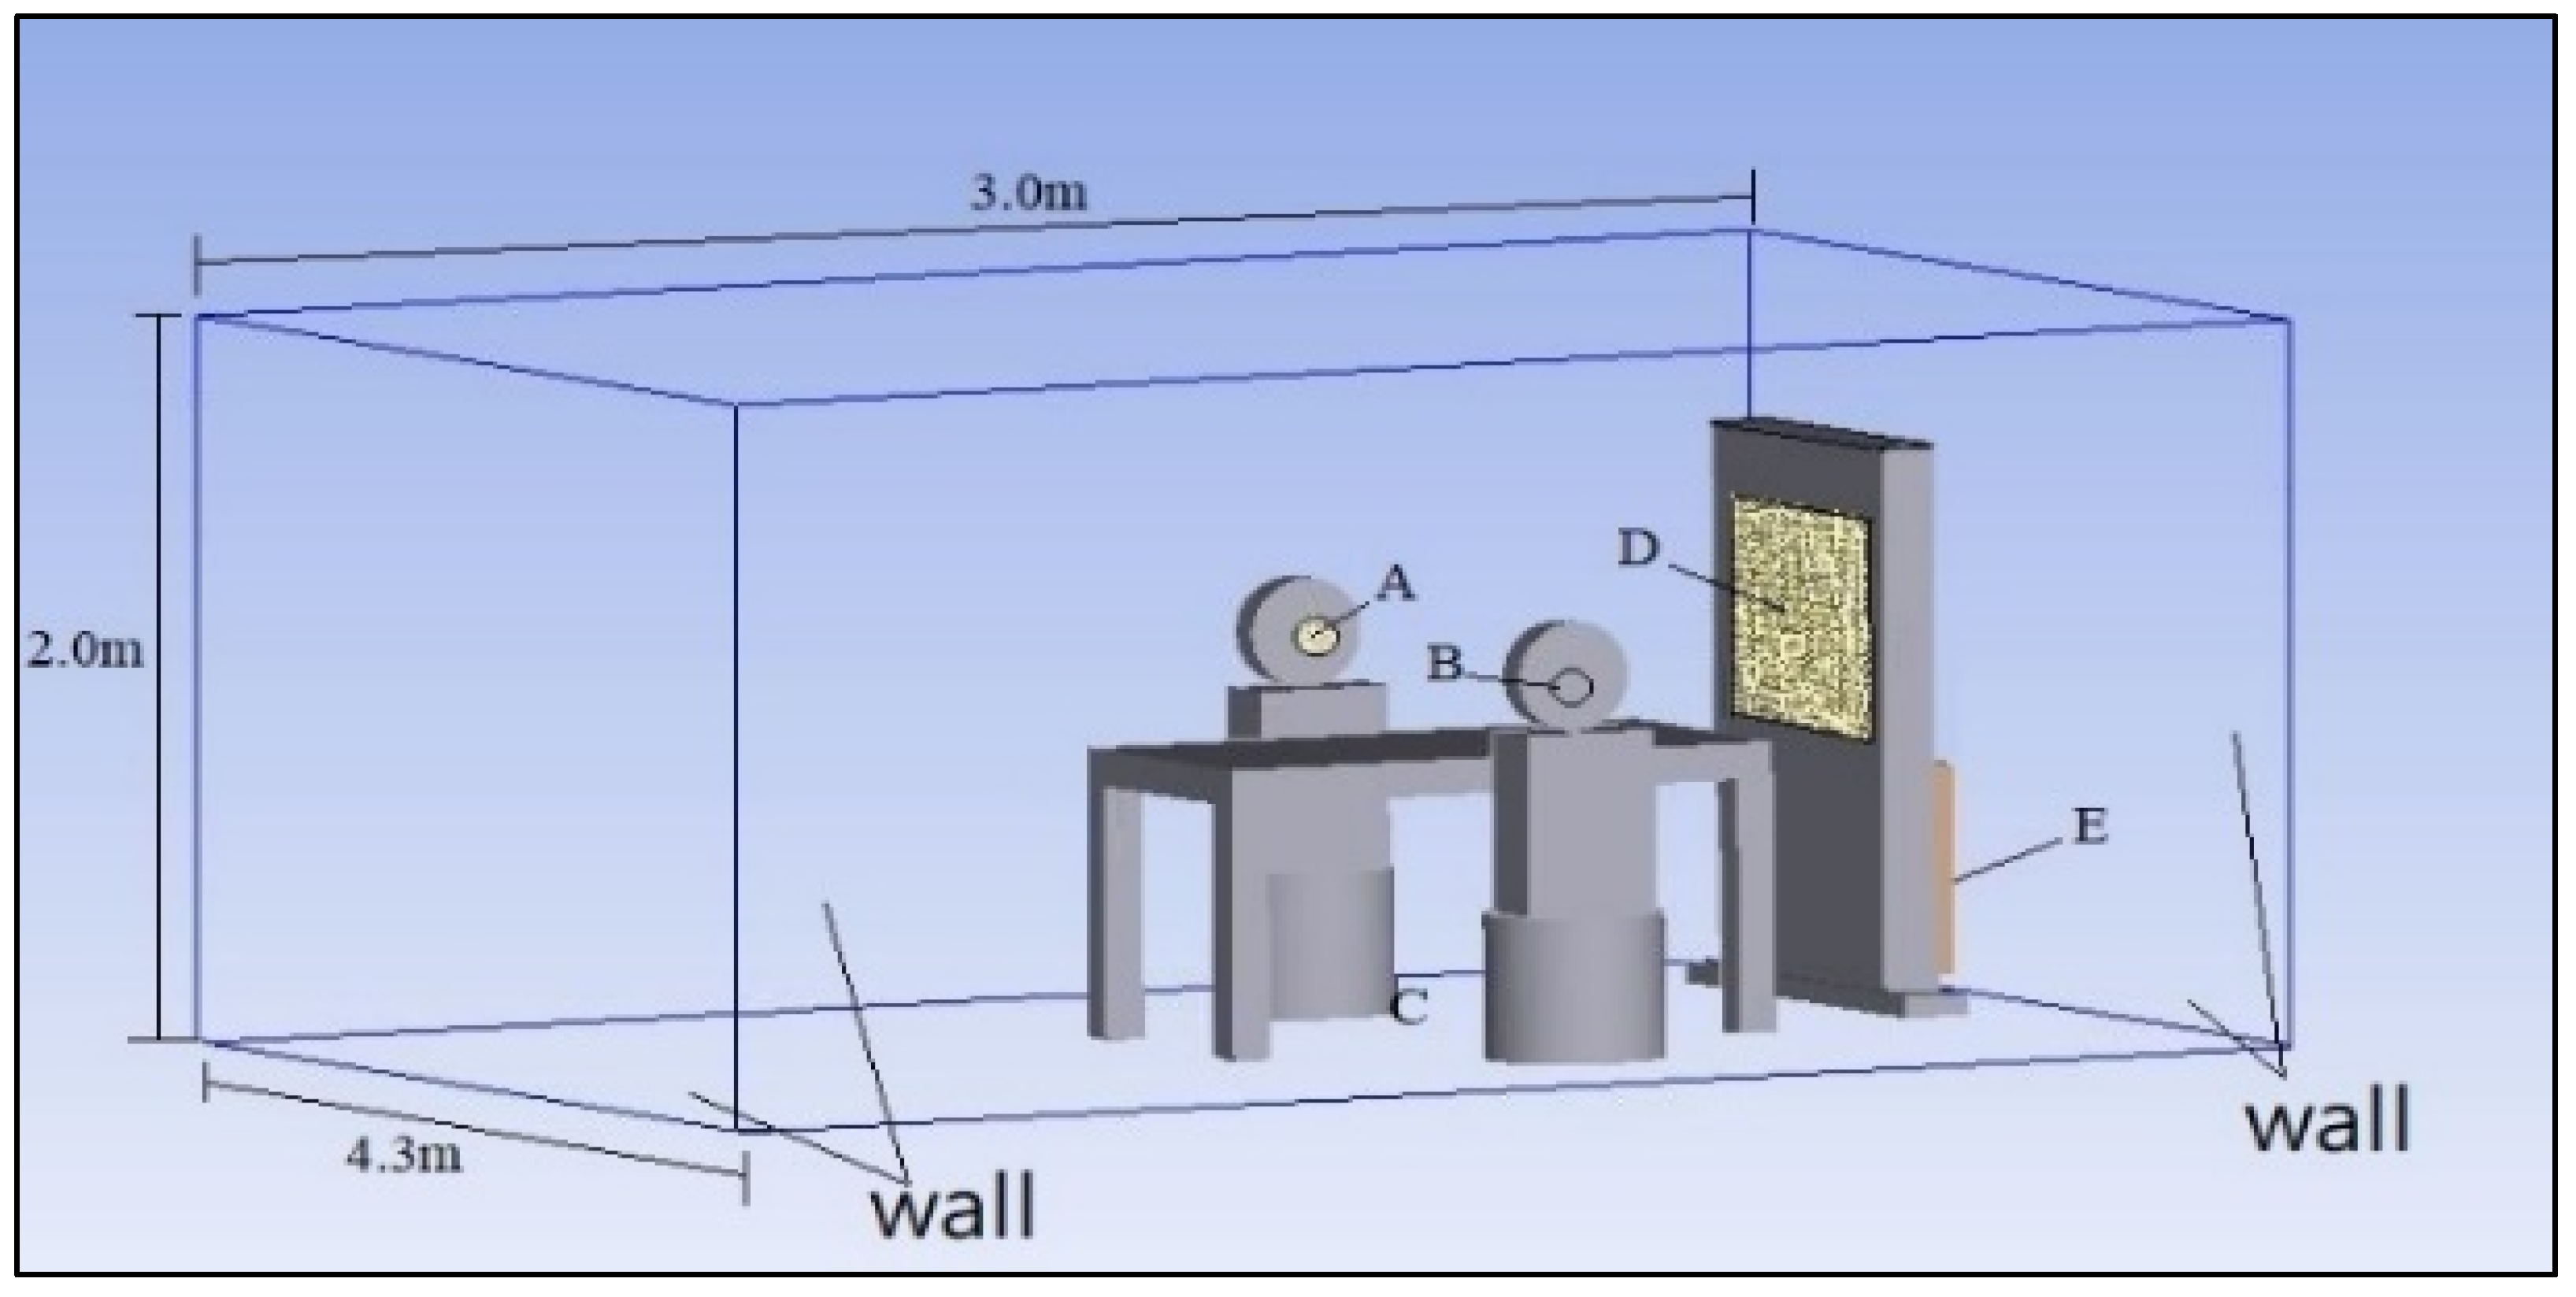
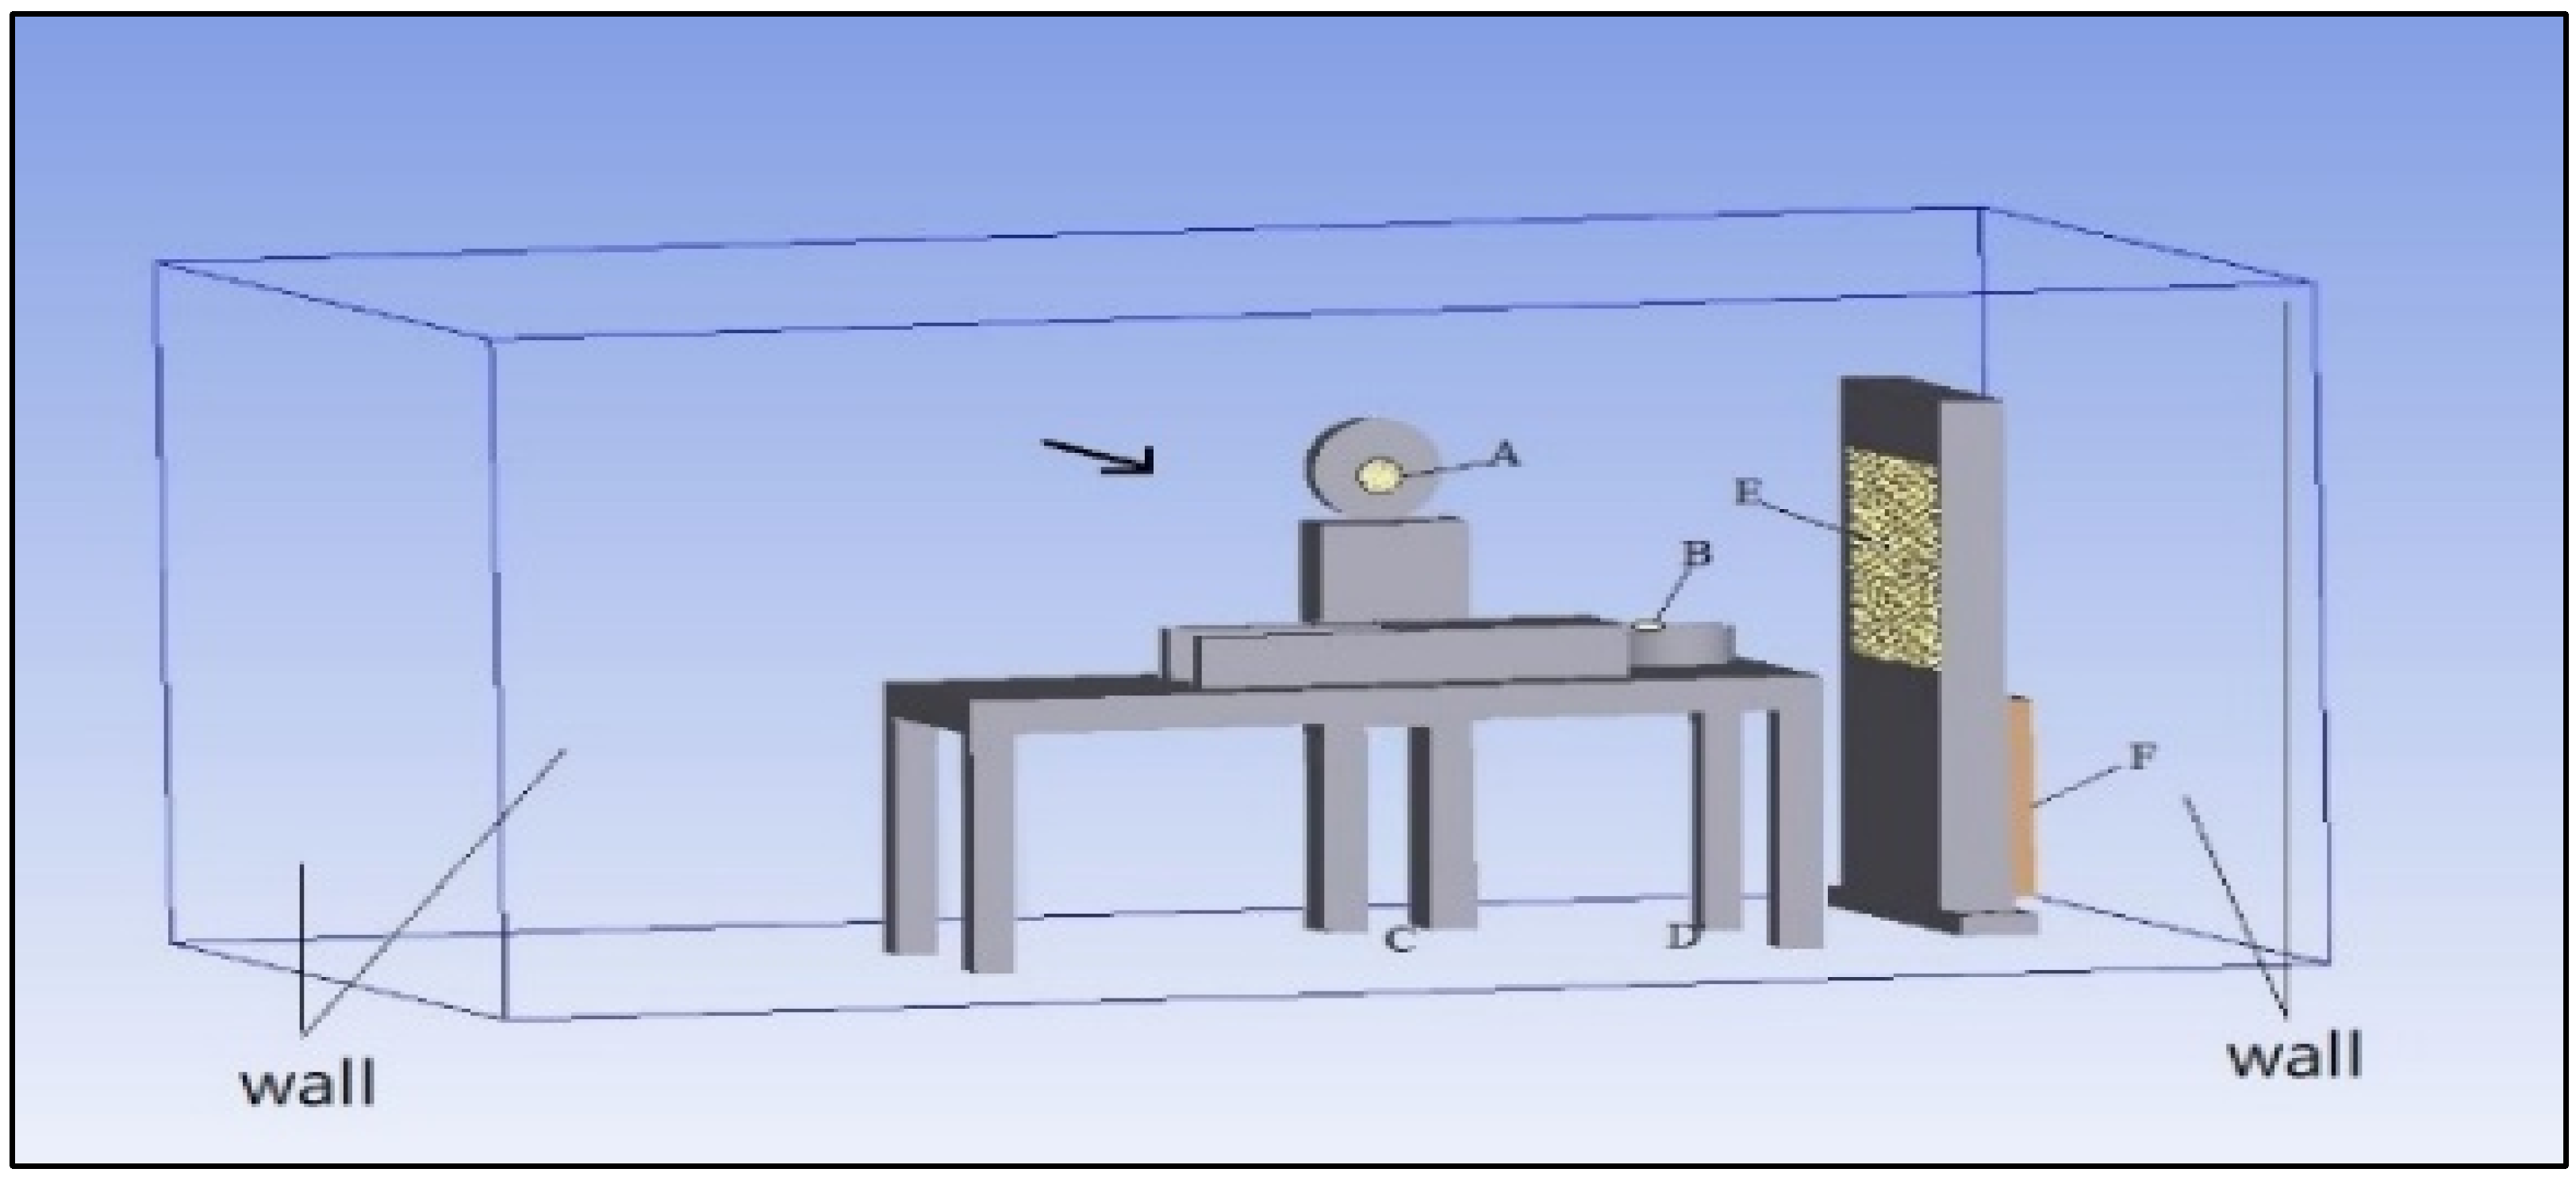
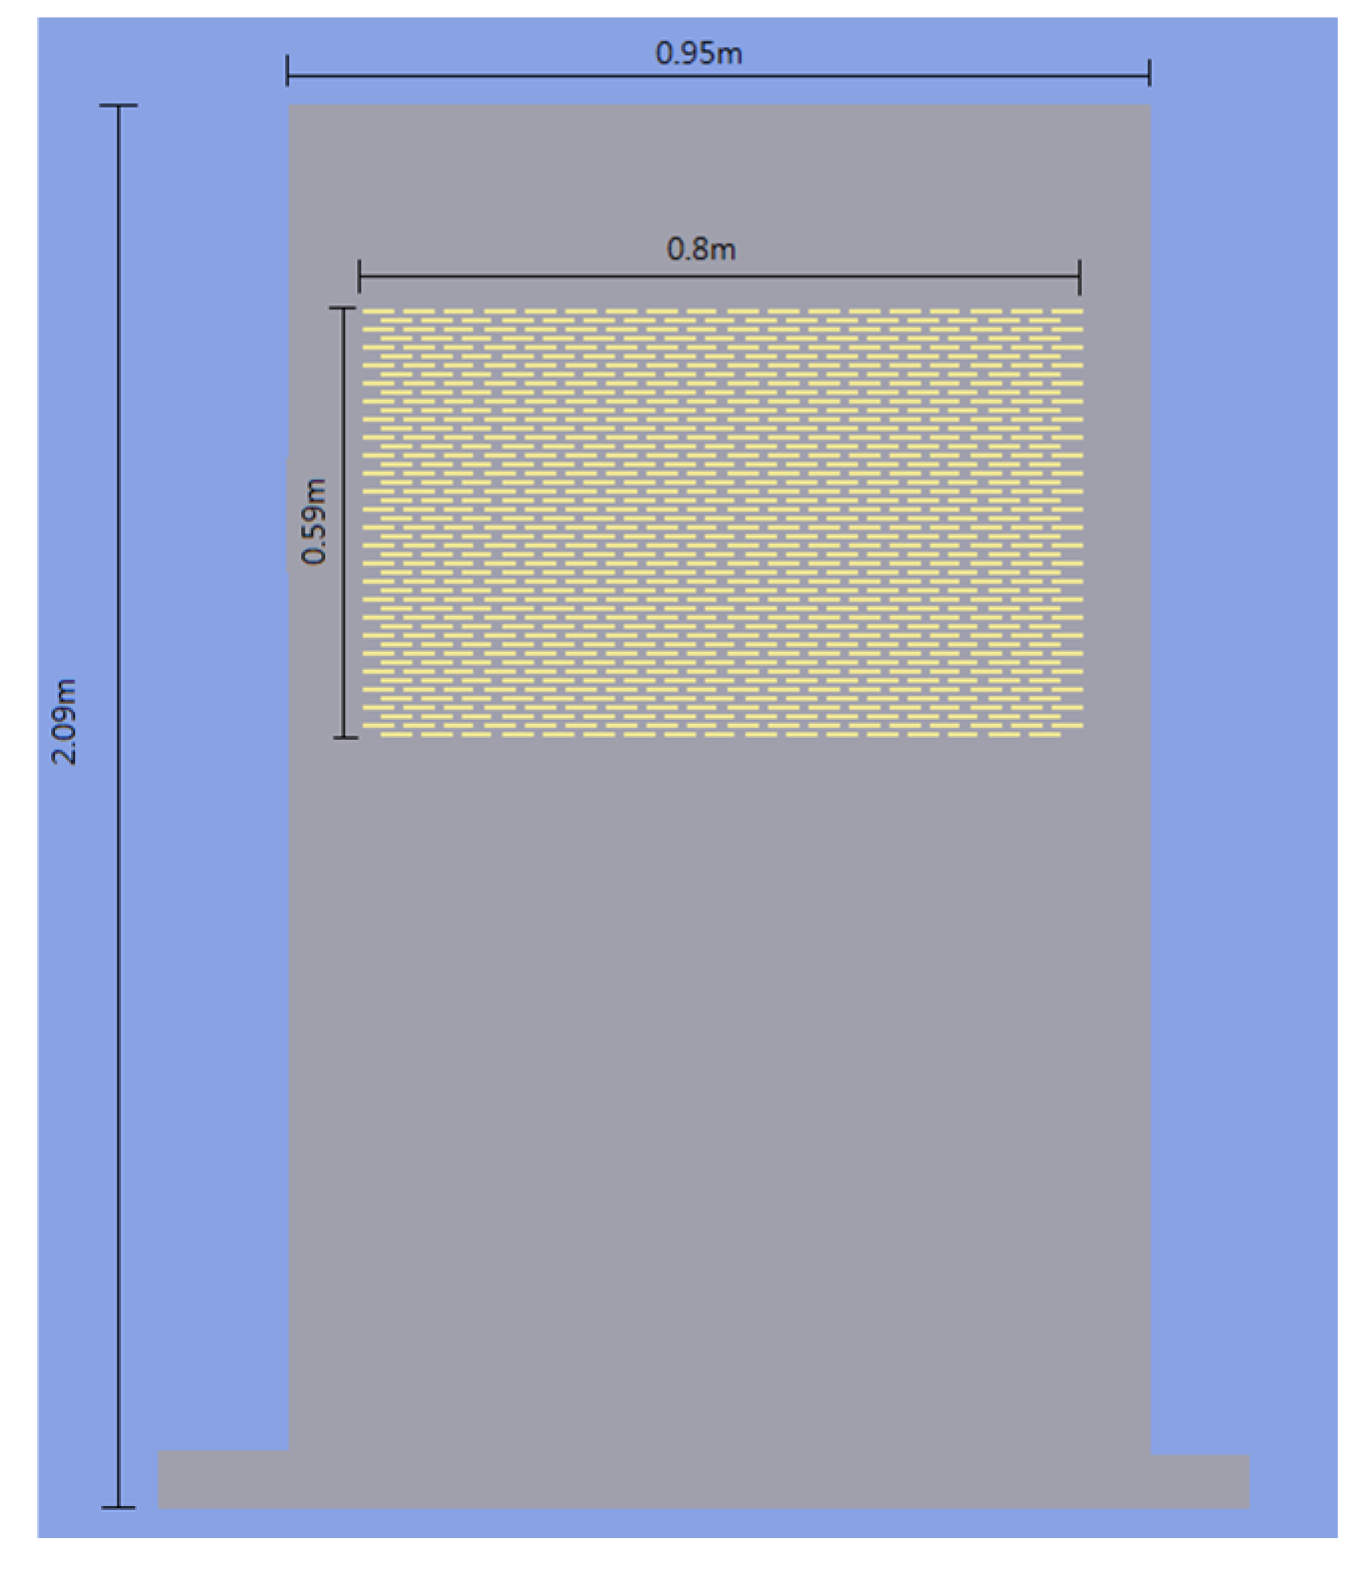
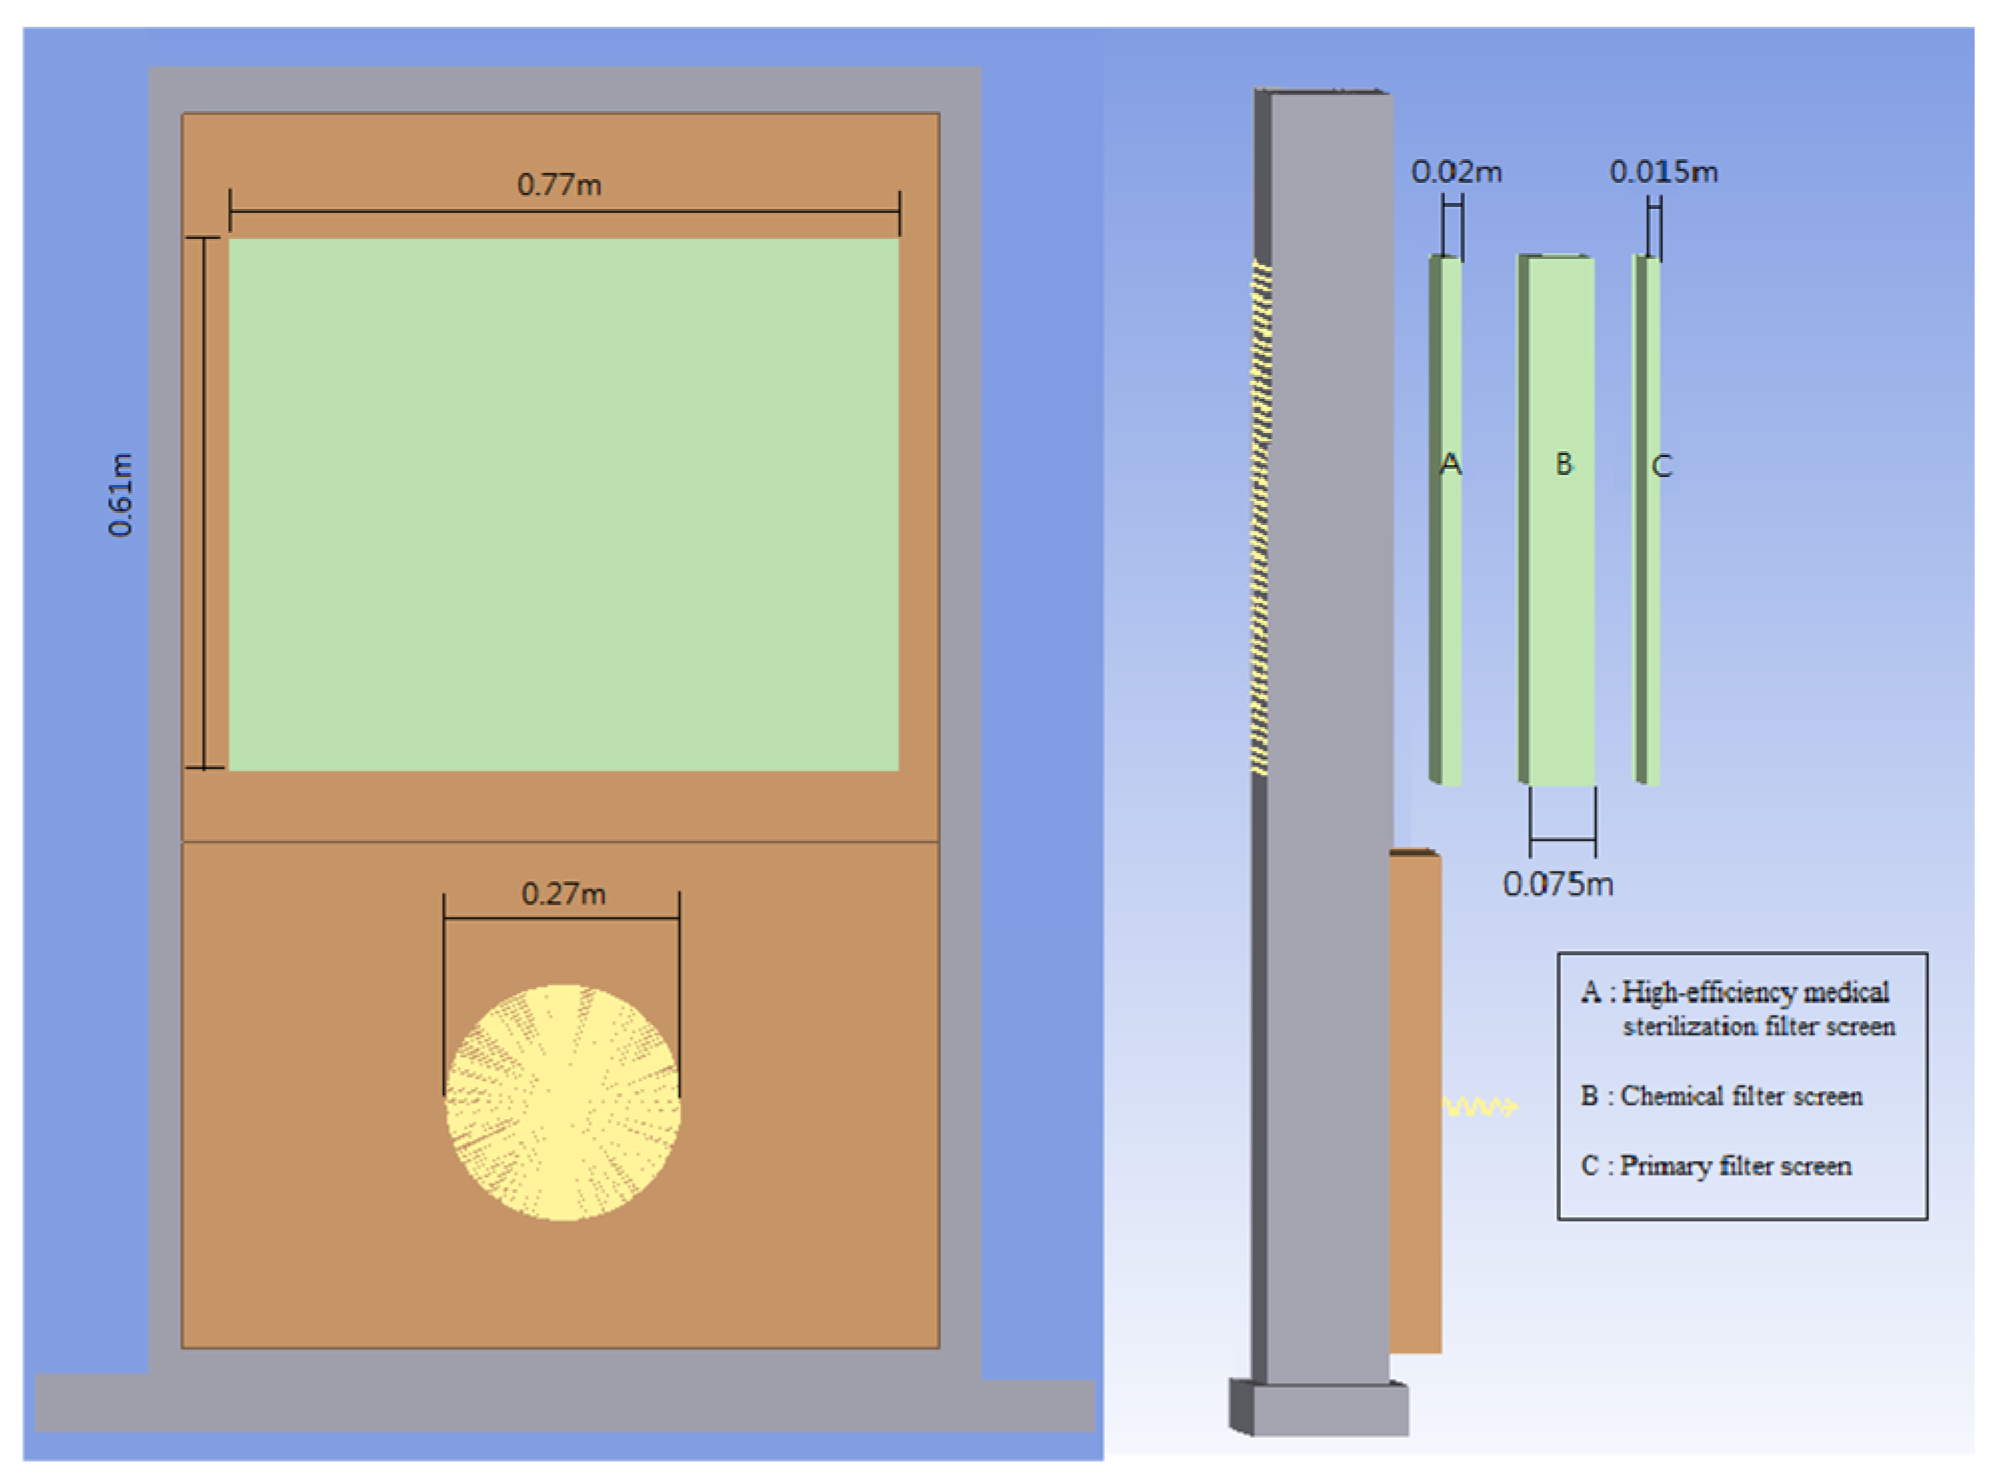
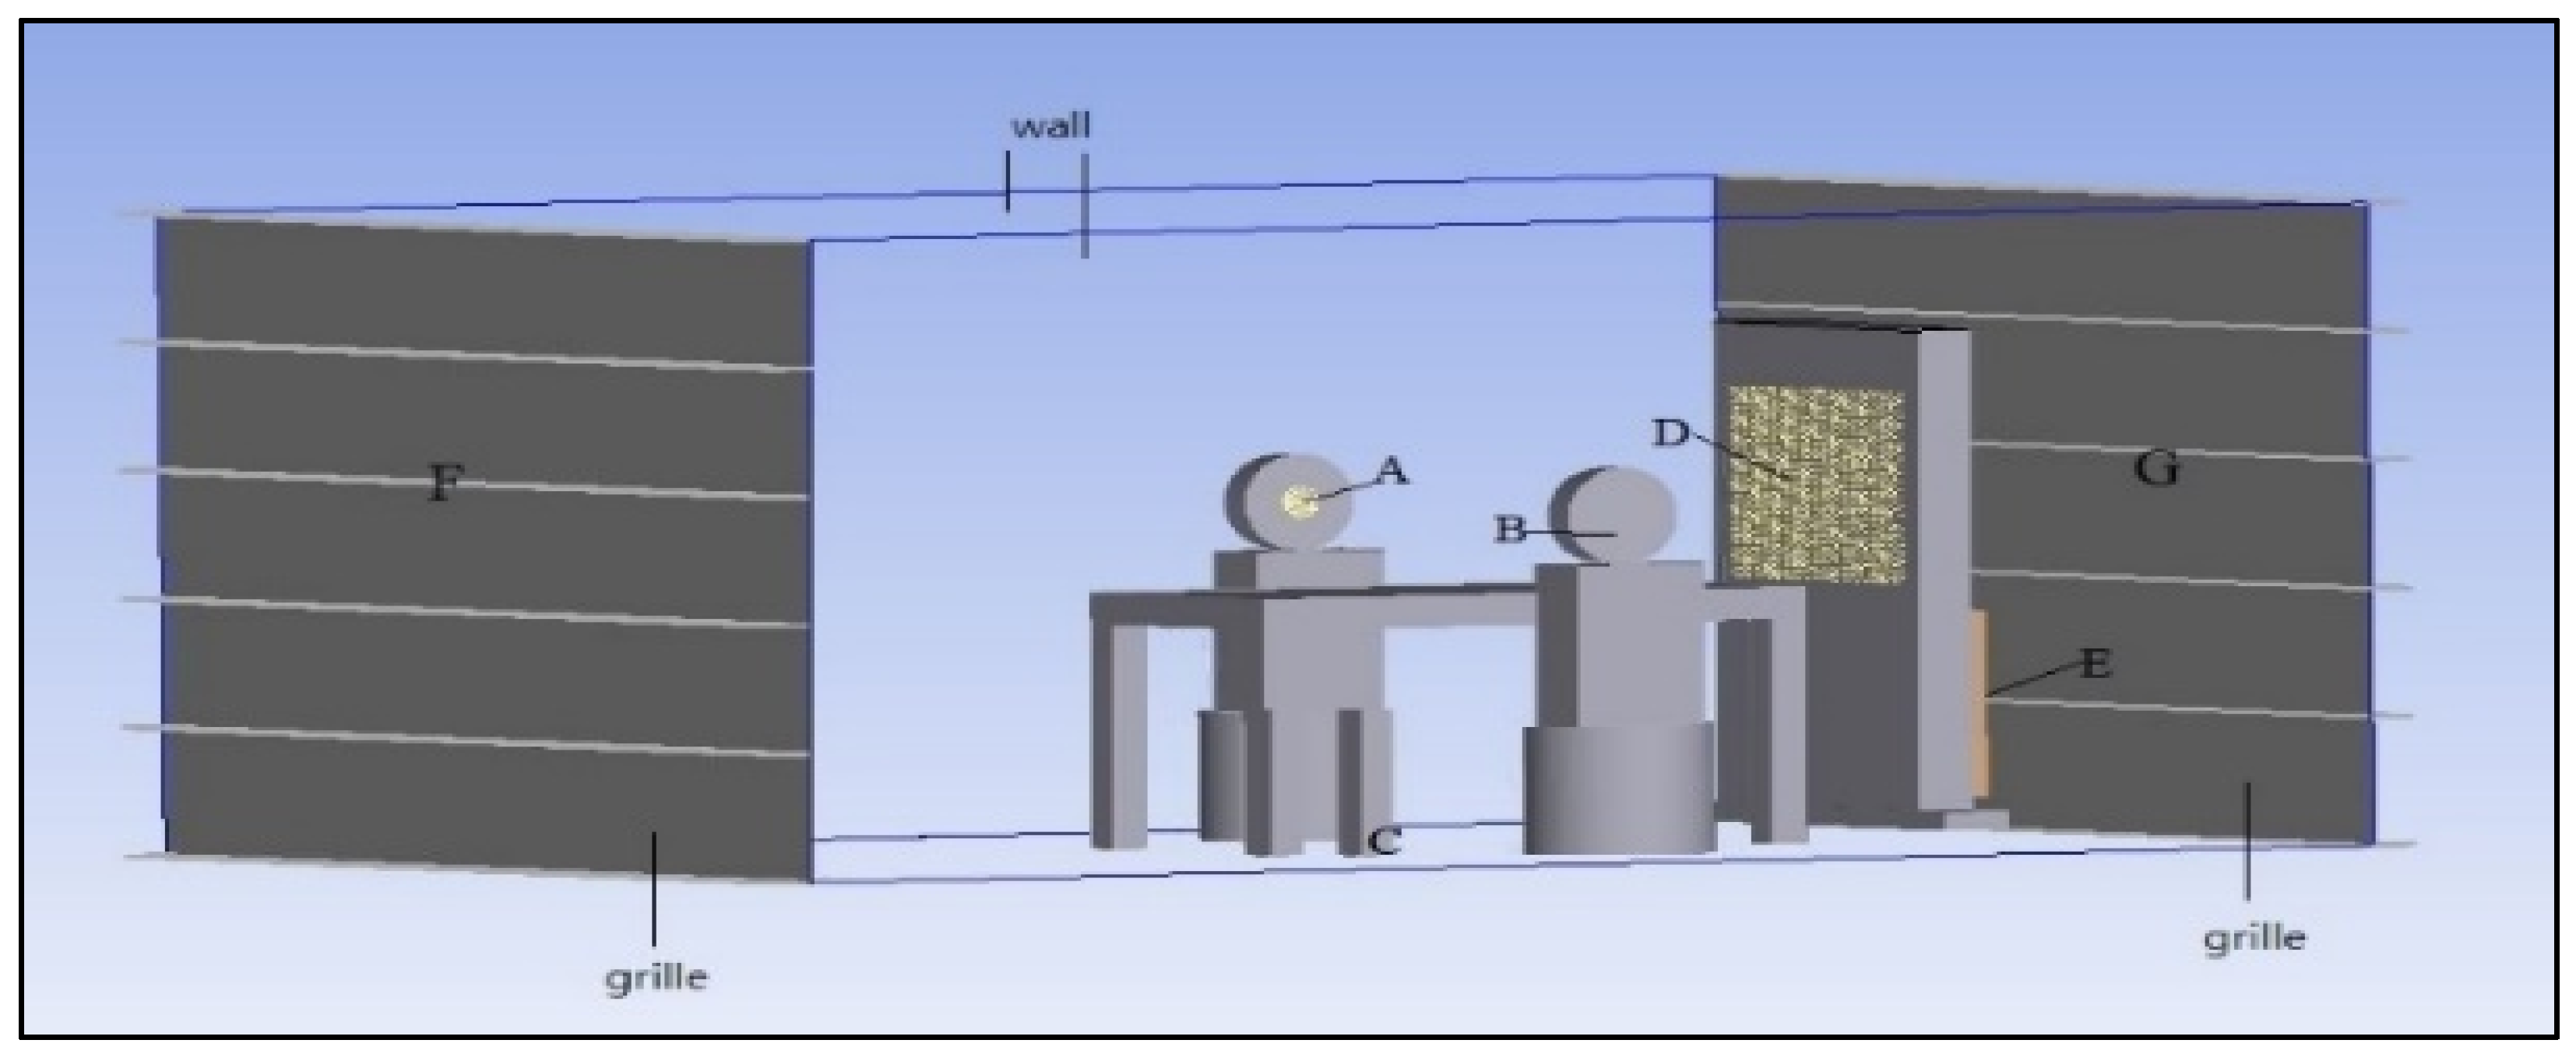
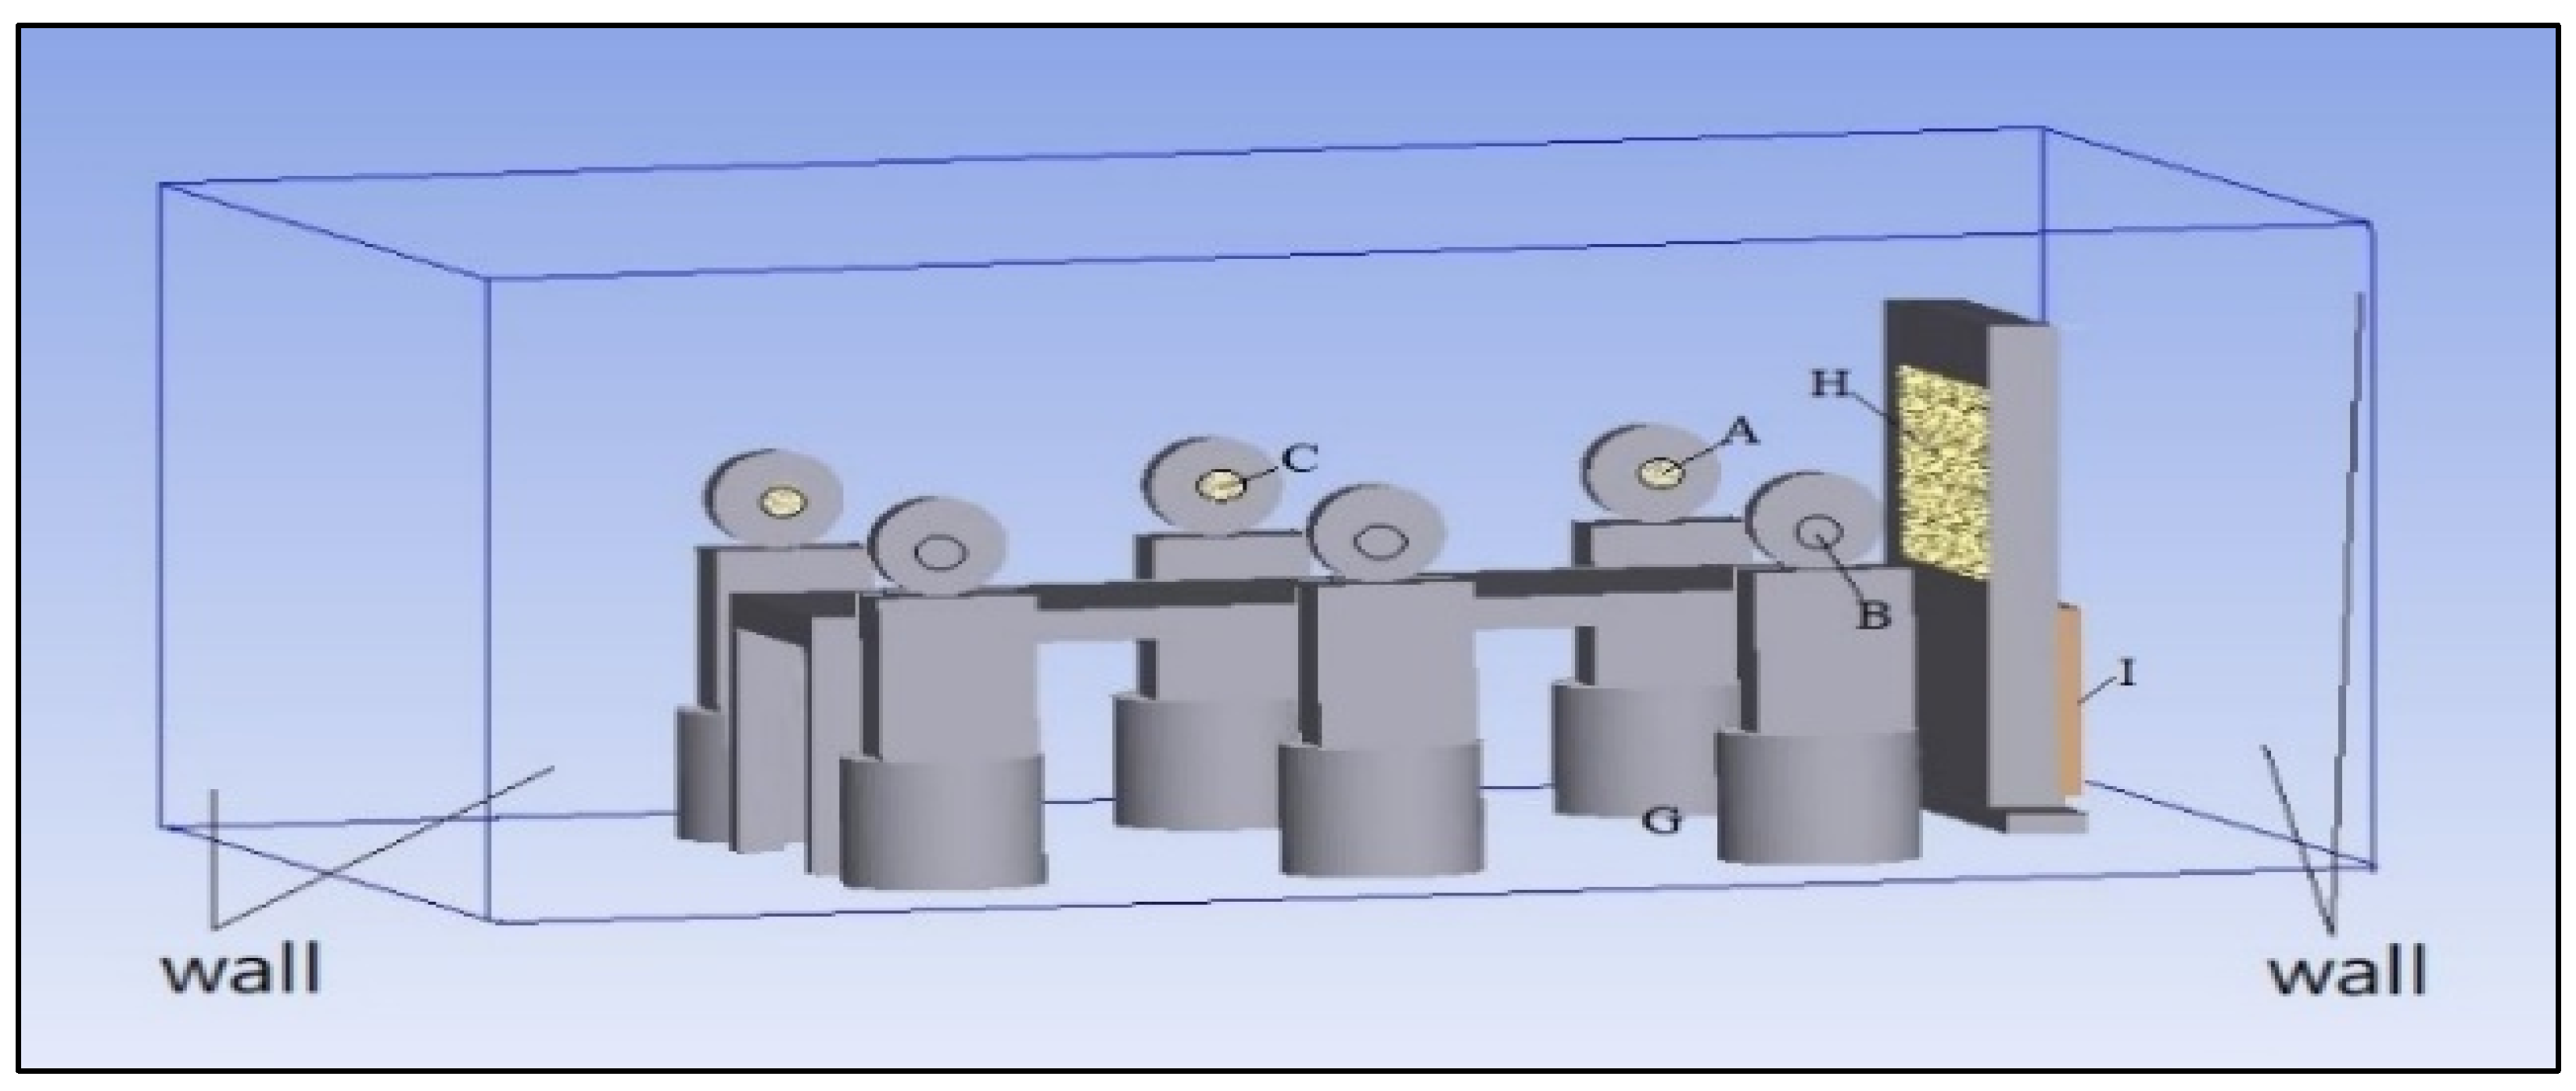
2.1. CFD Simulation Analysis
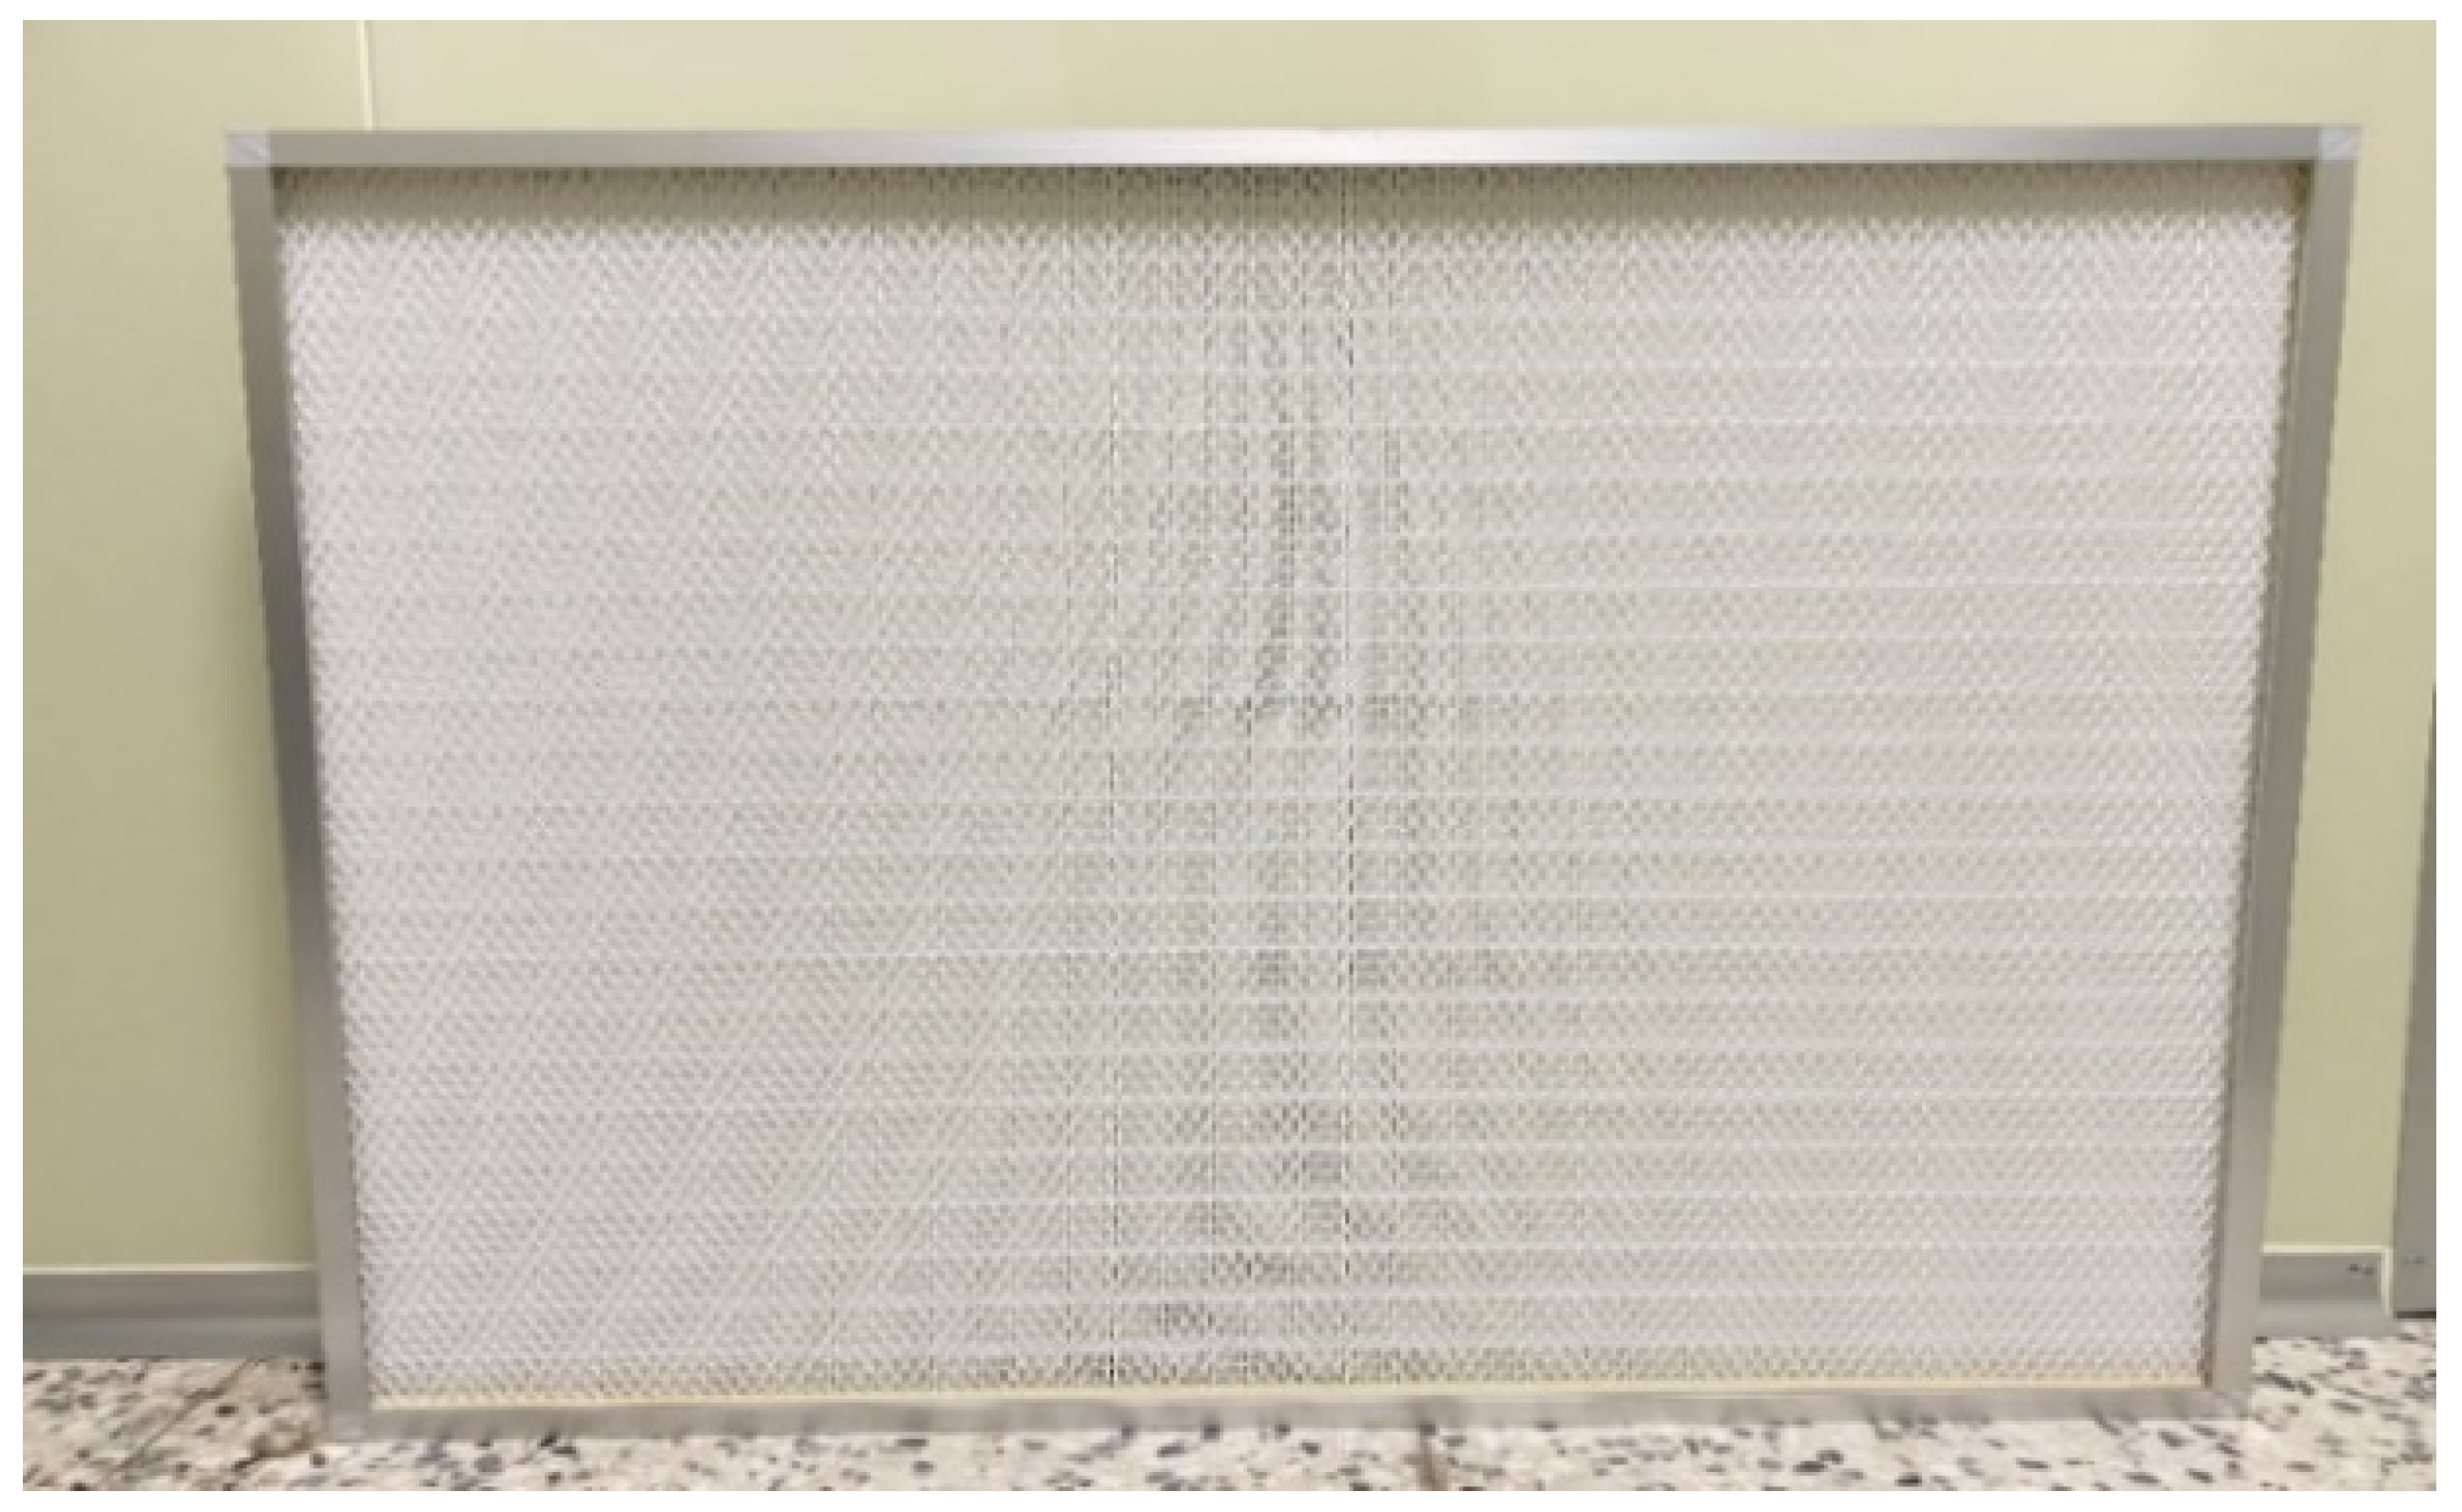
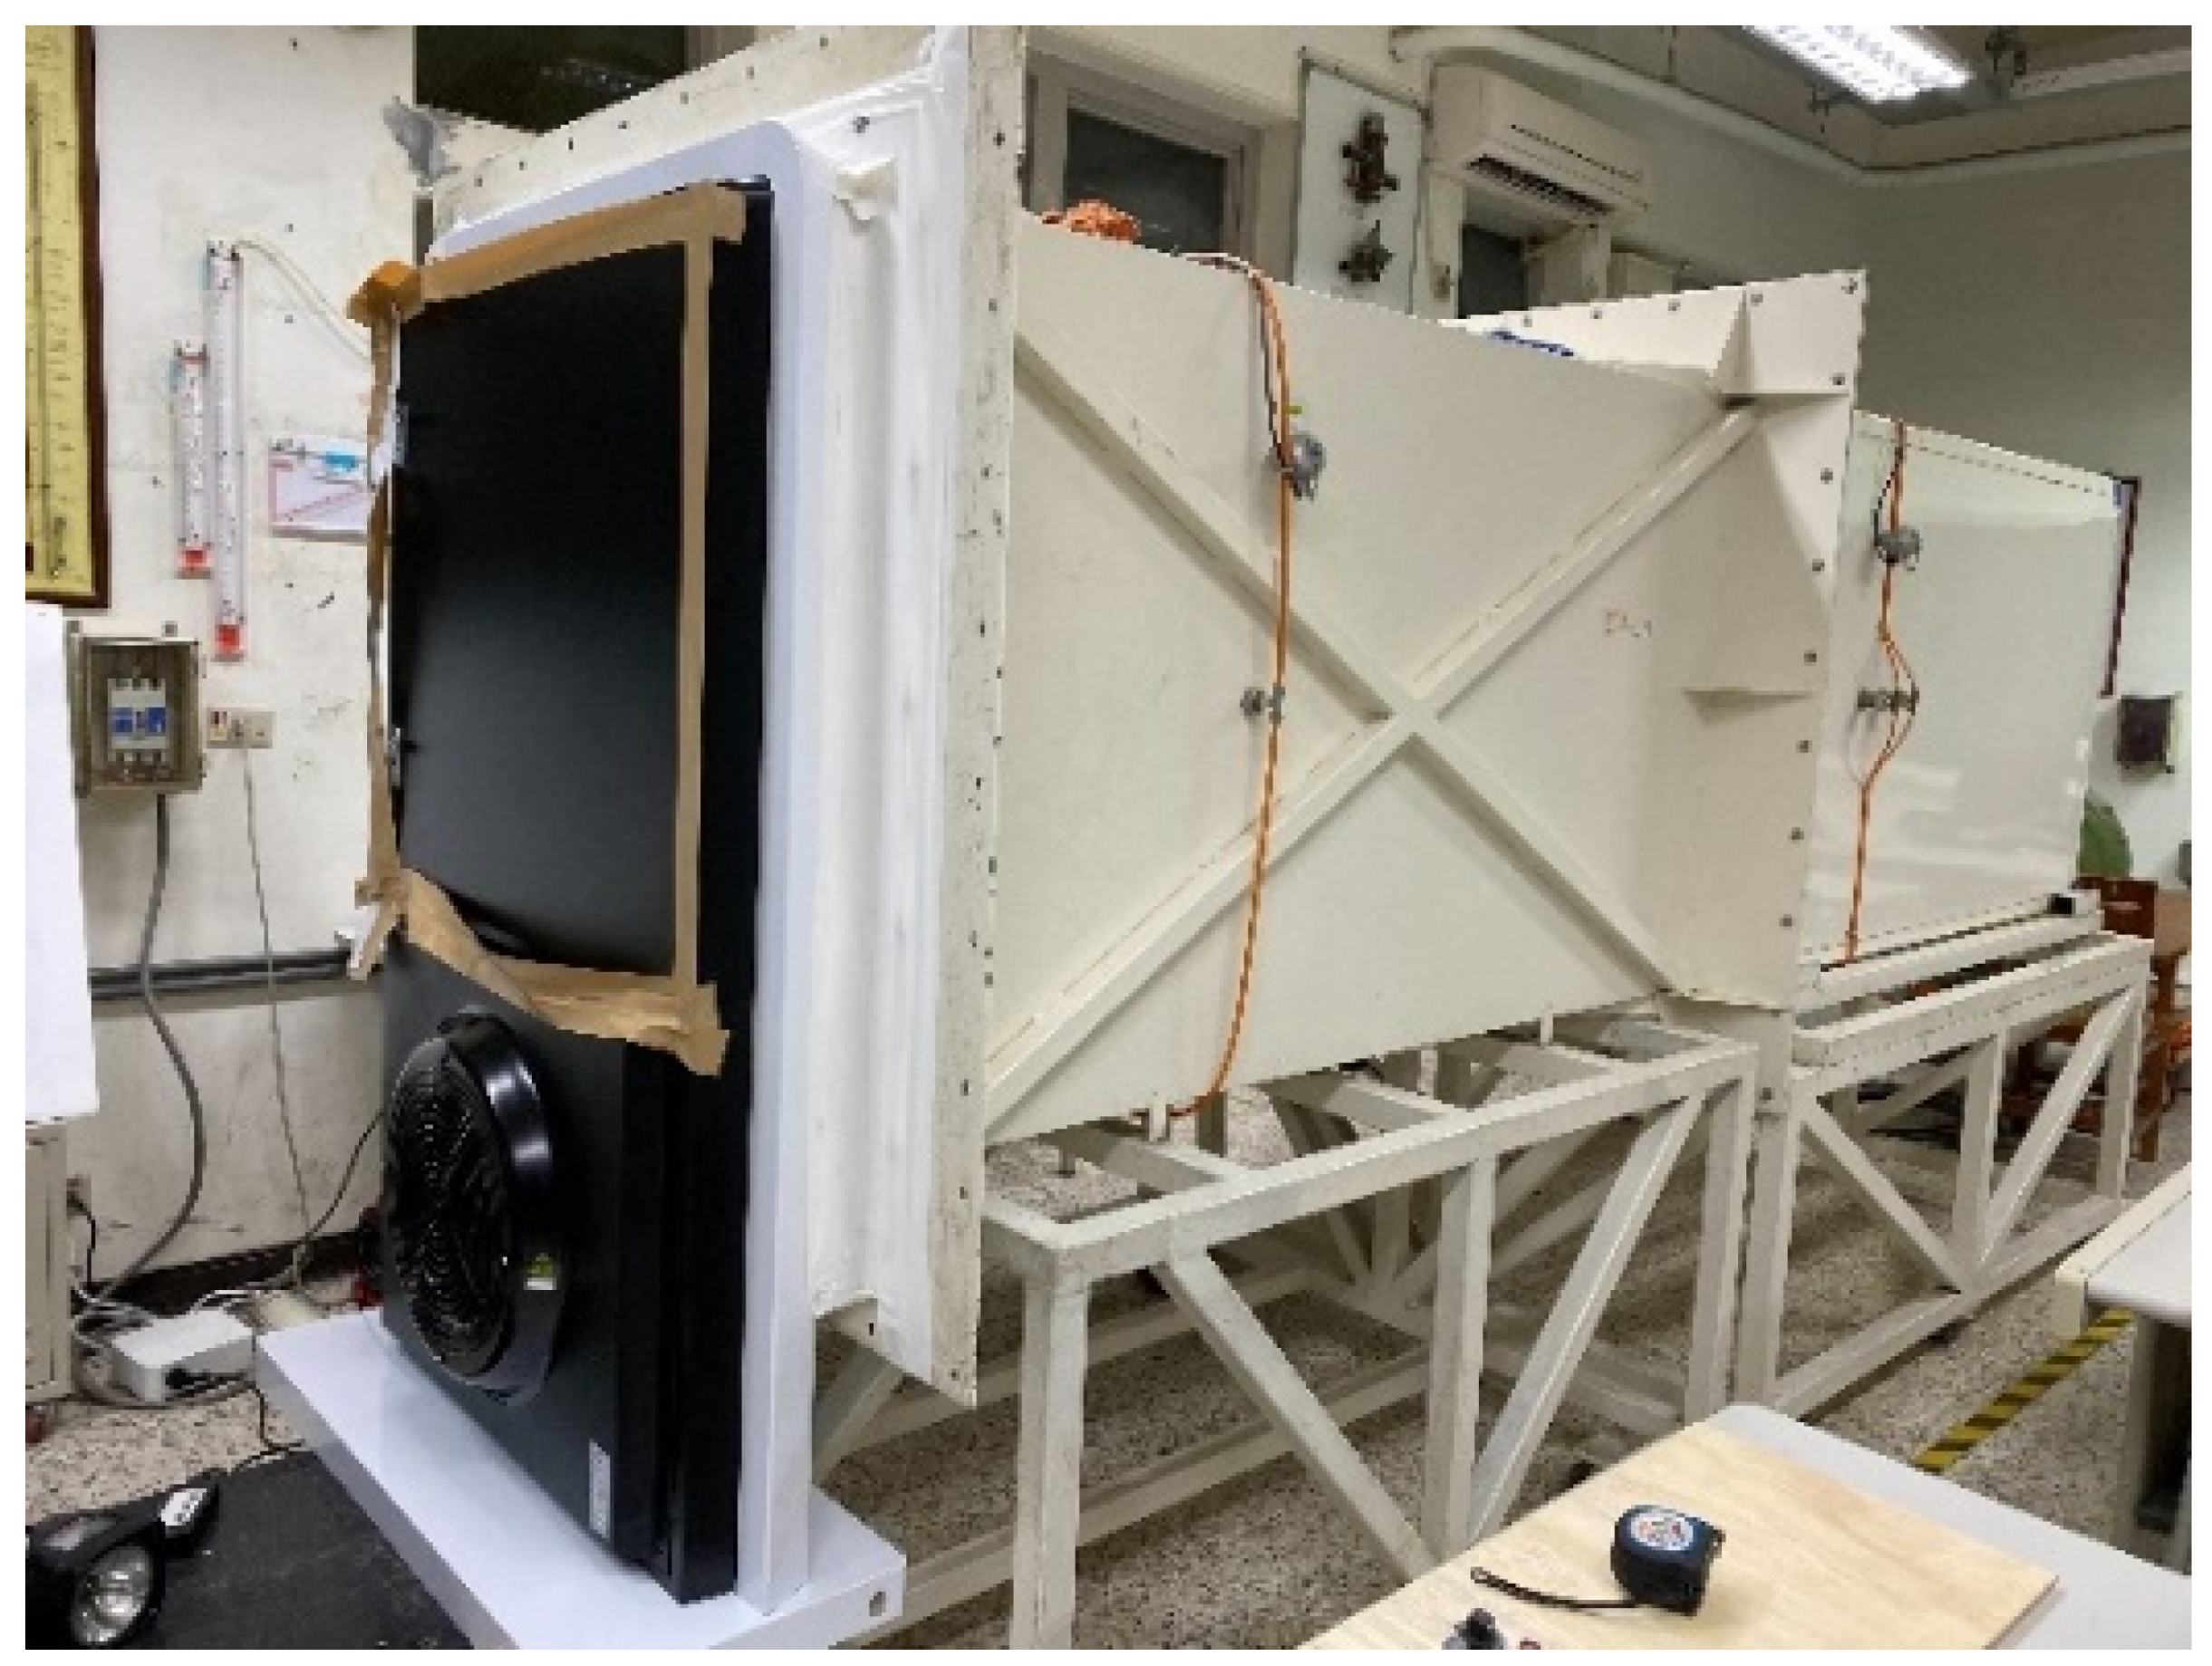
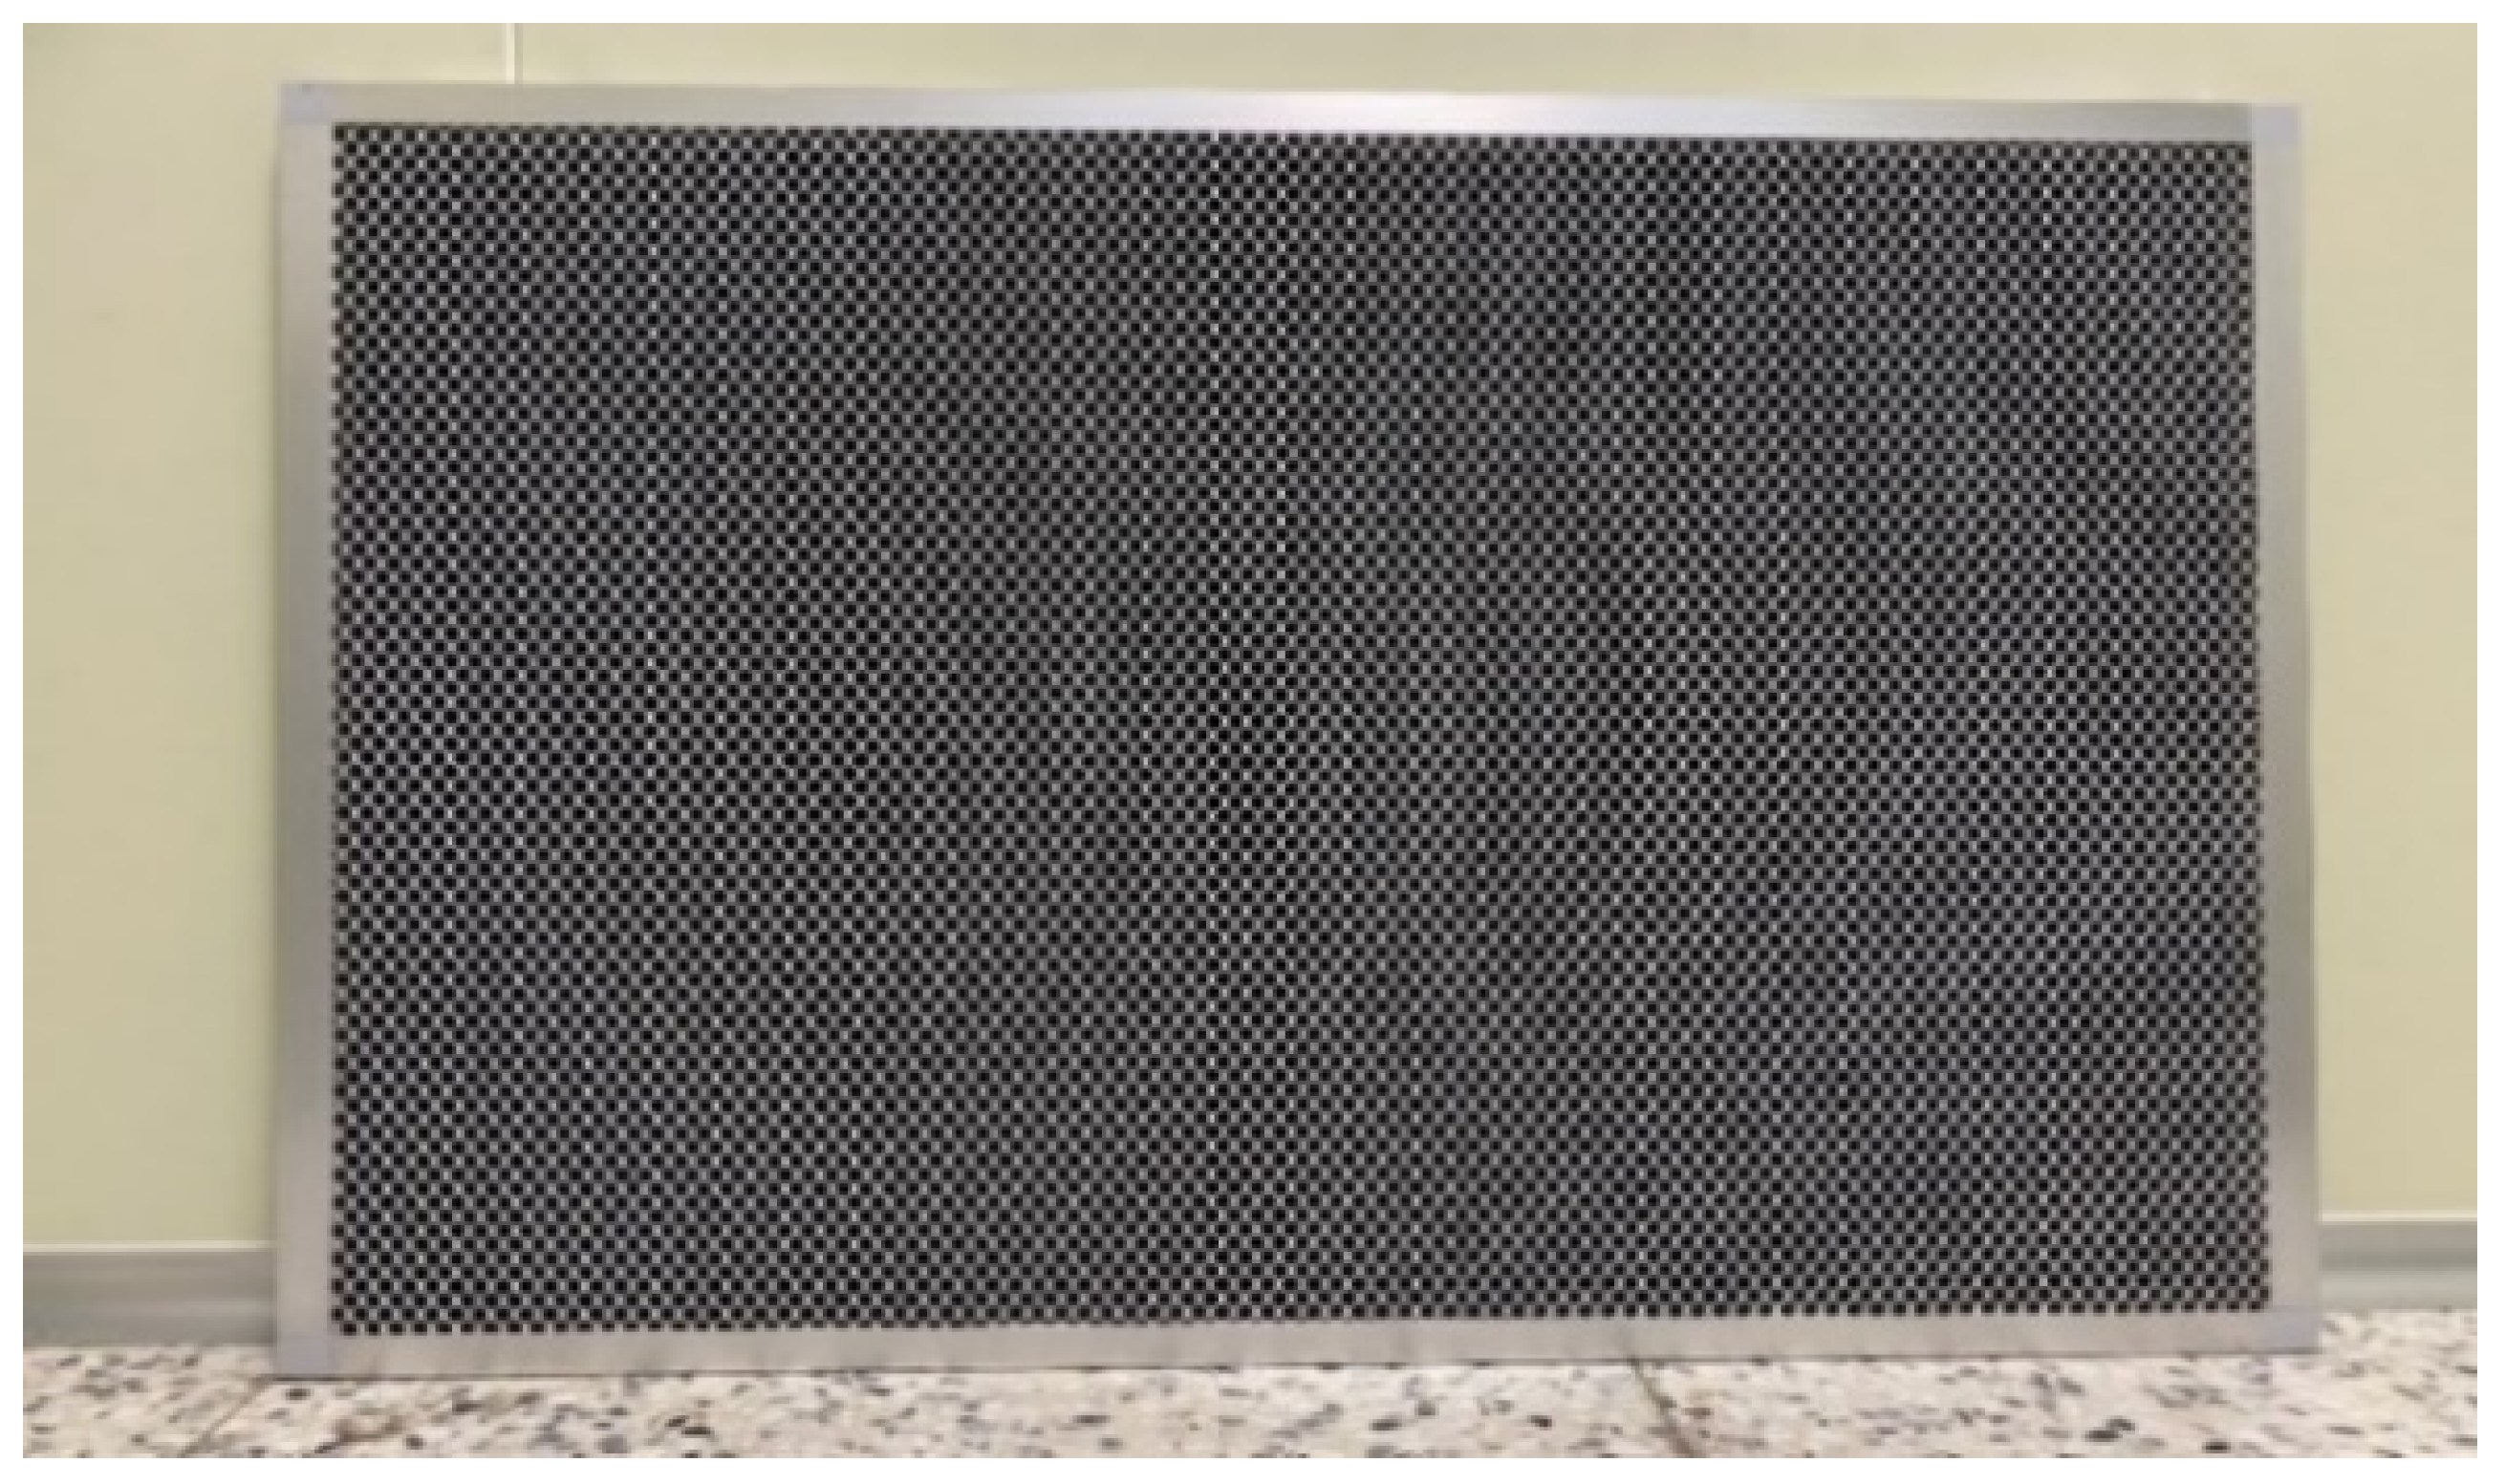
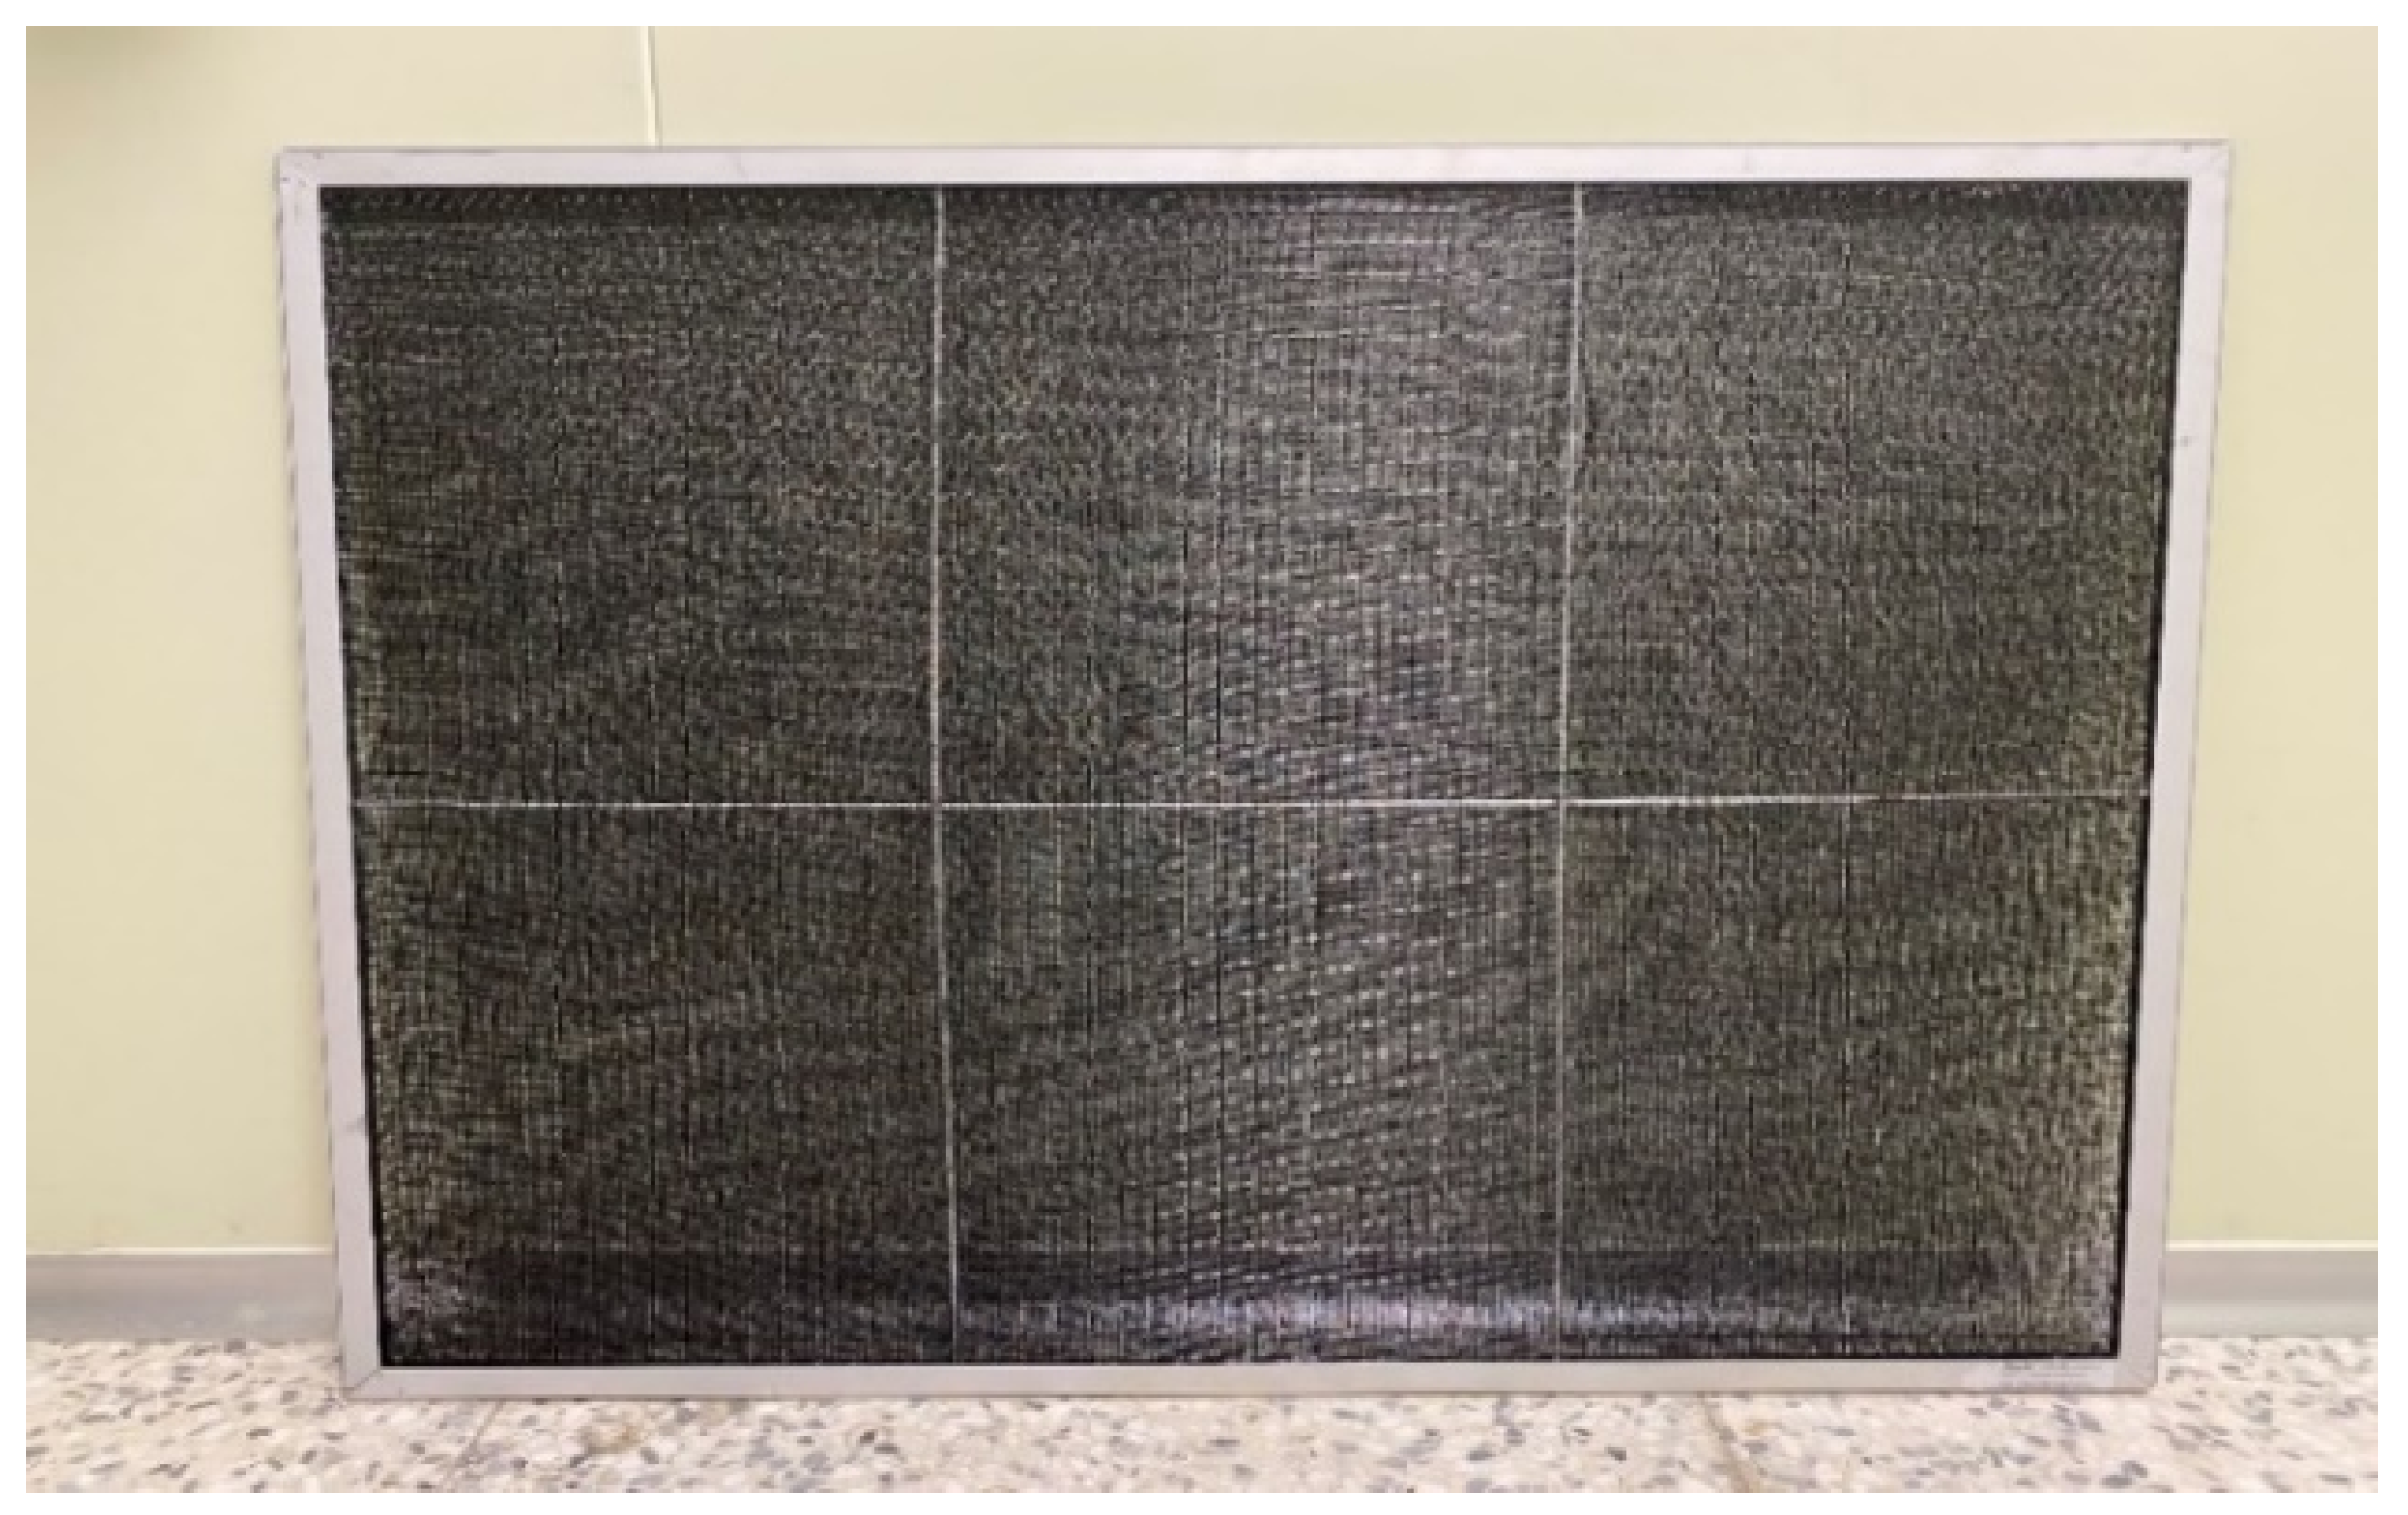
2.2. Impedance Characteristics of Filter Screens Measured with Different Materials
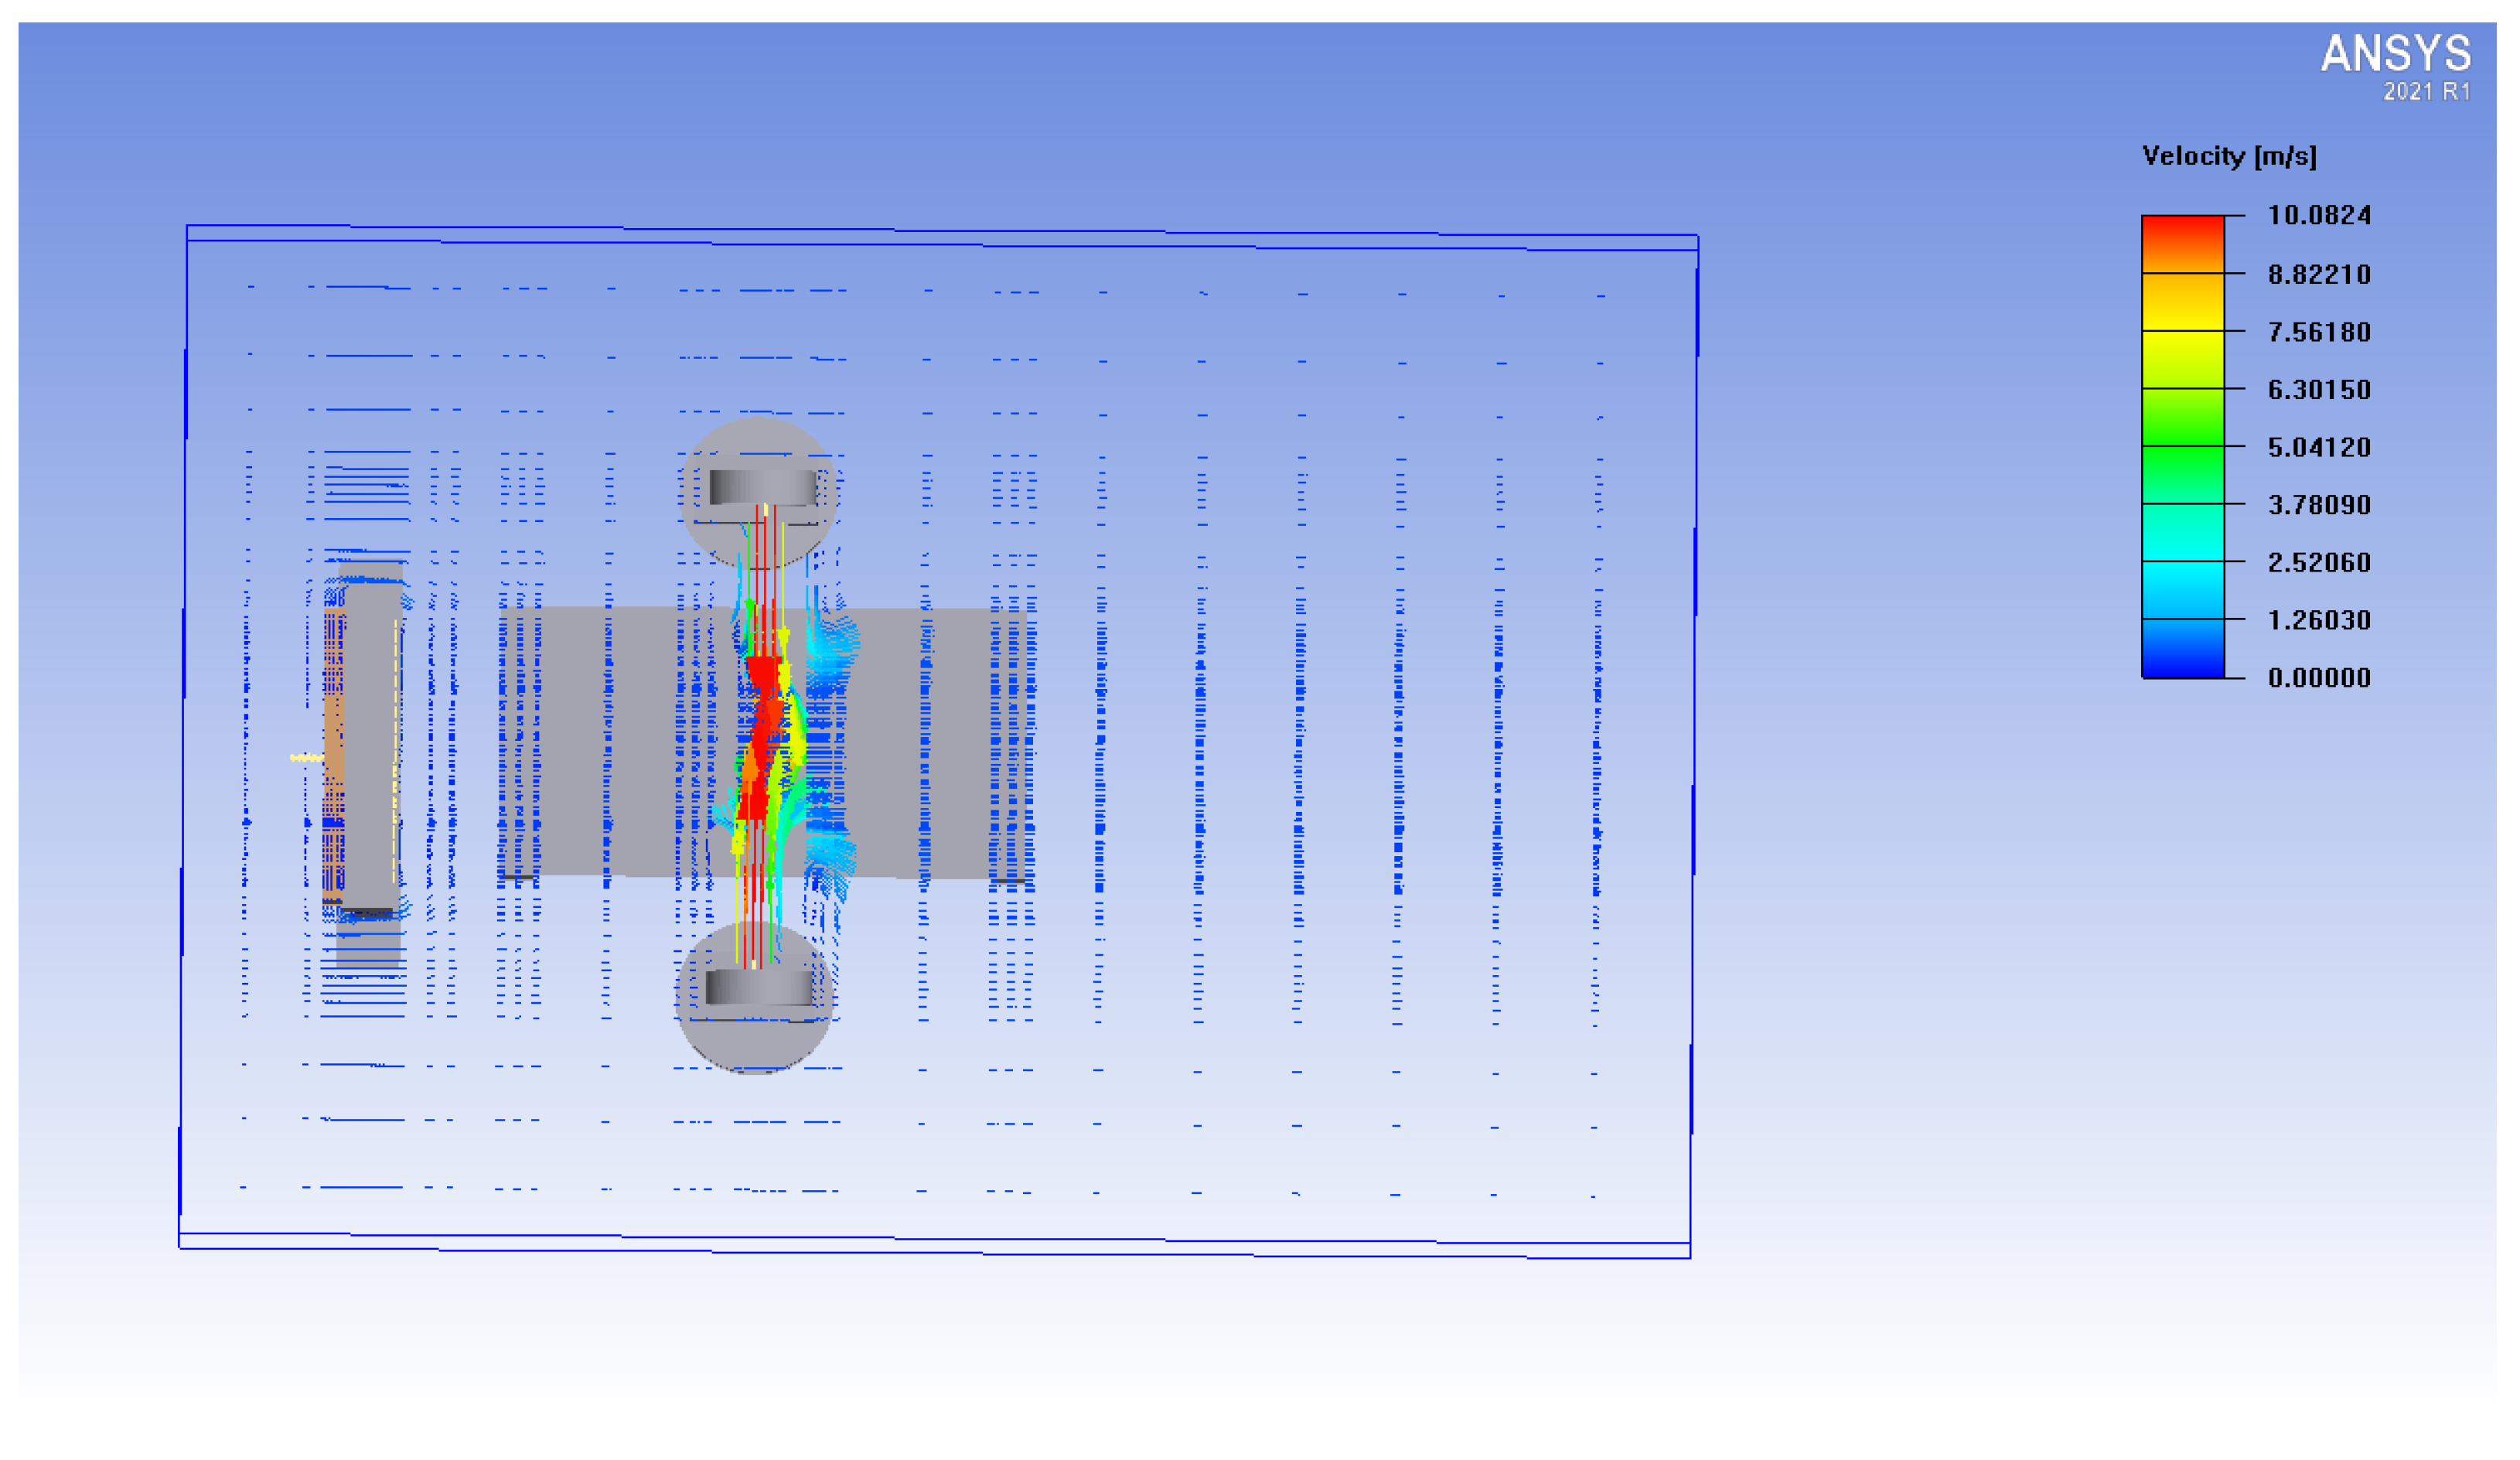
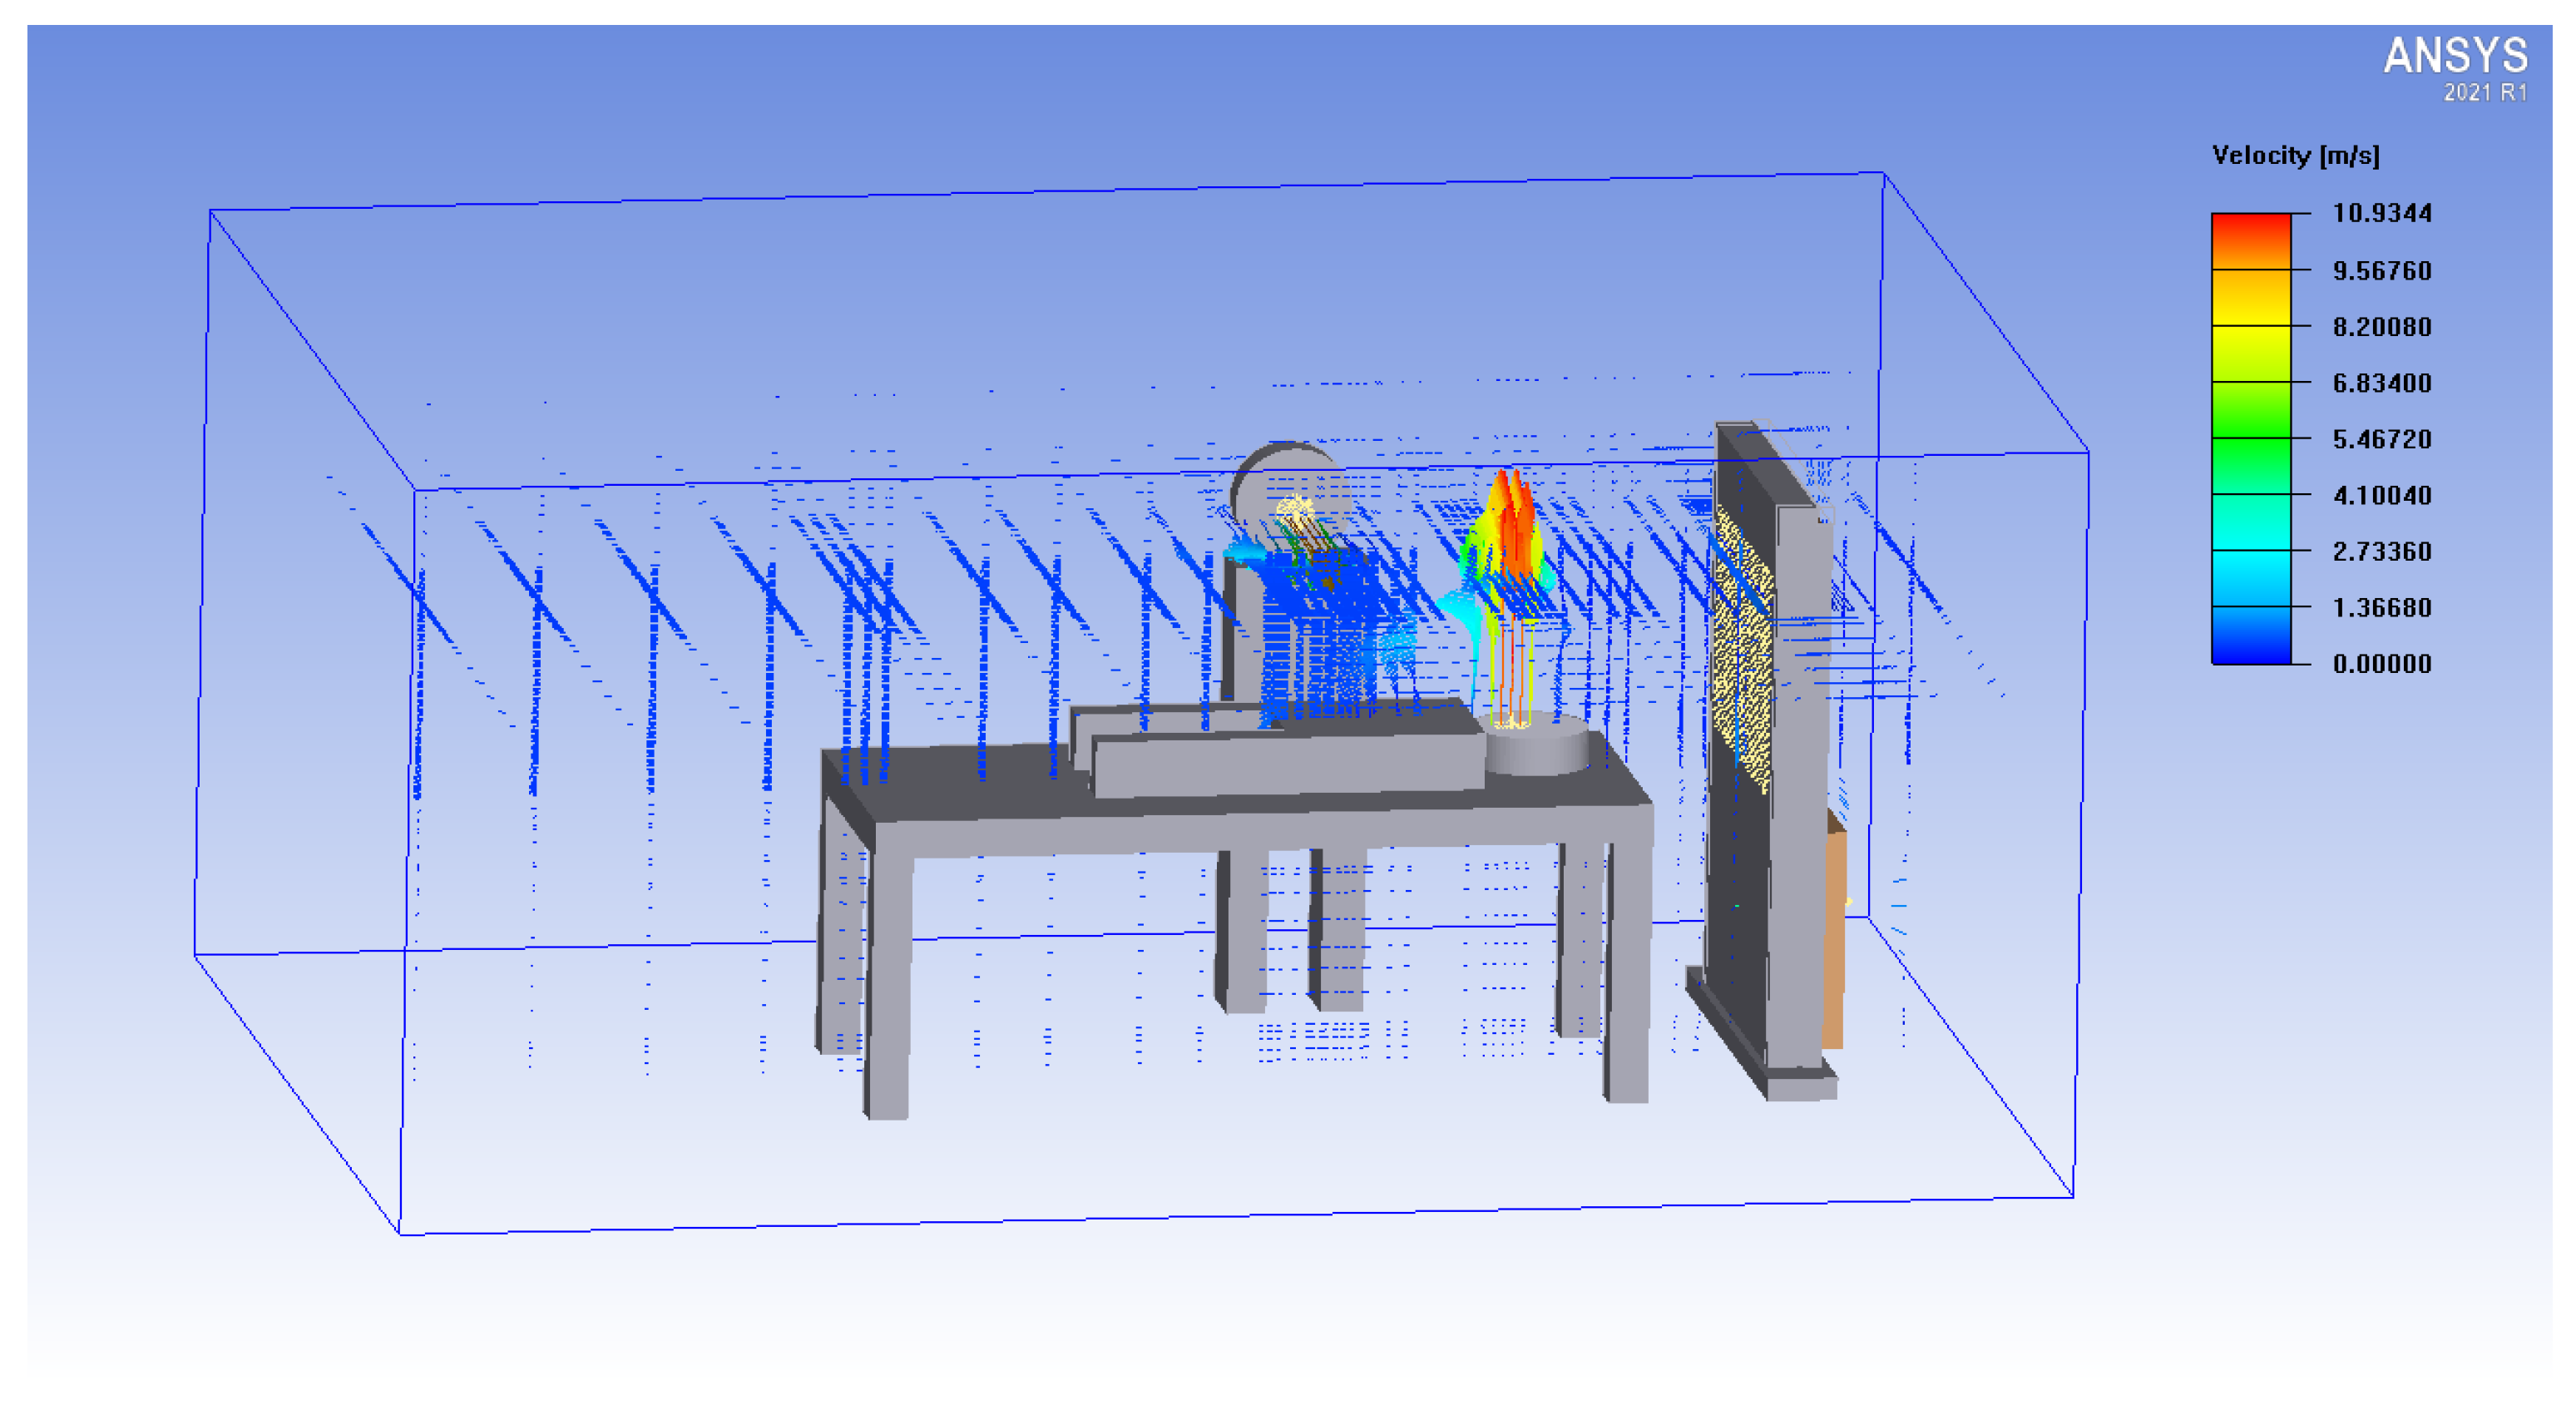
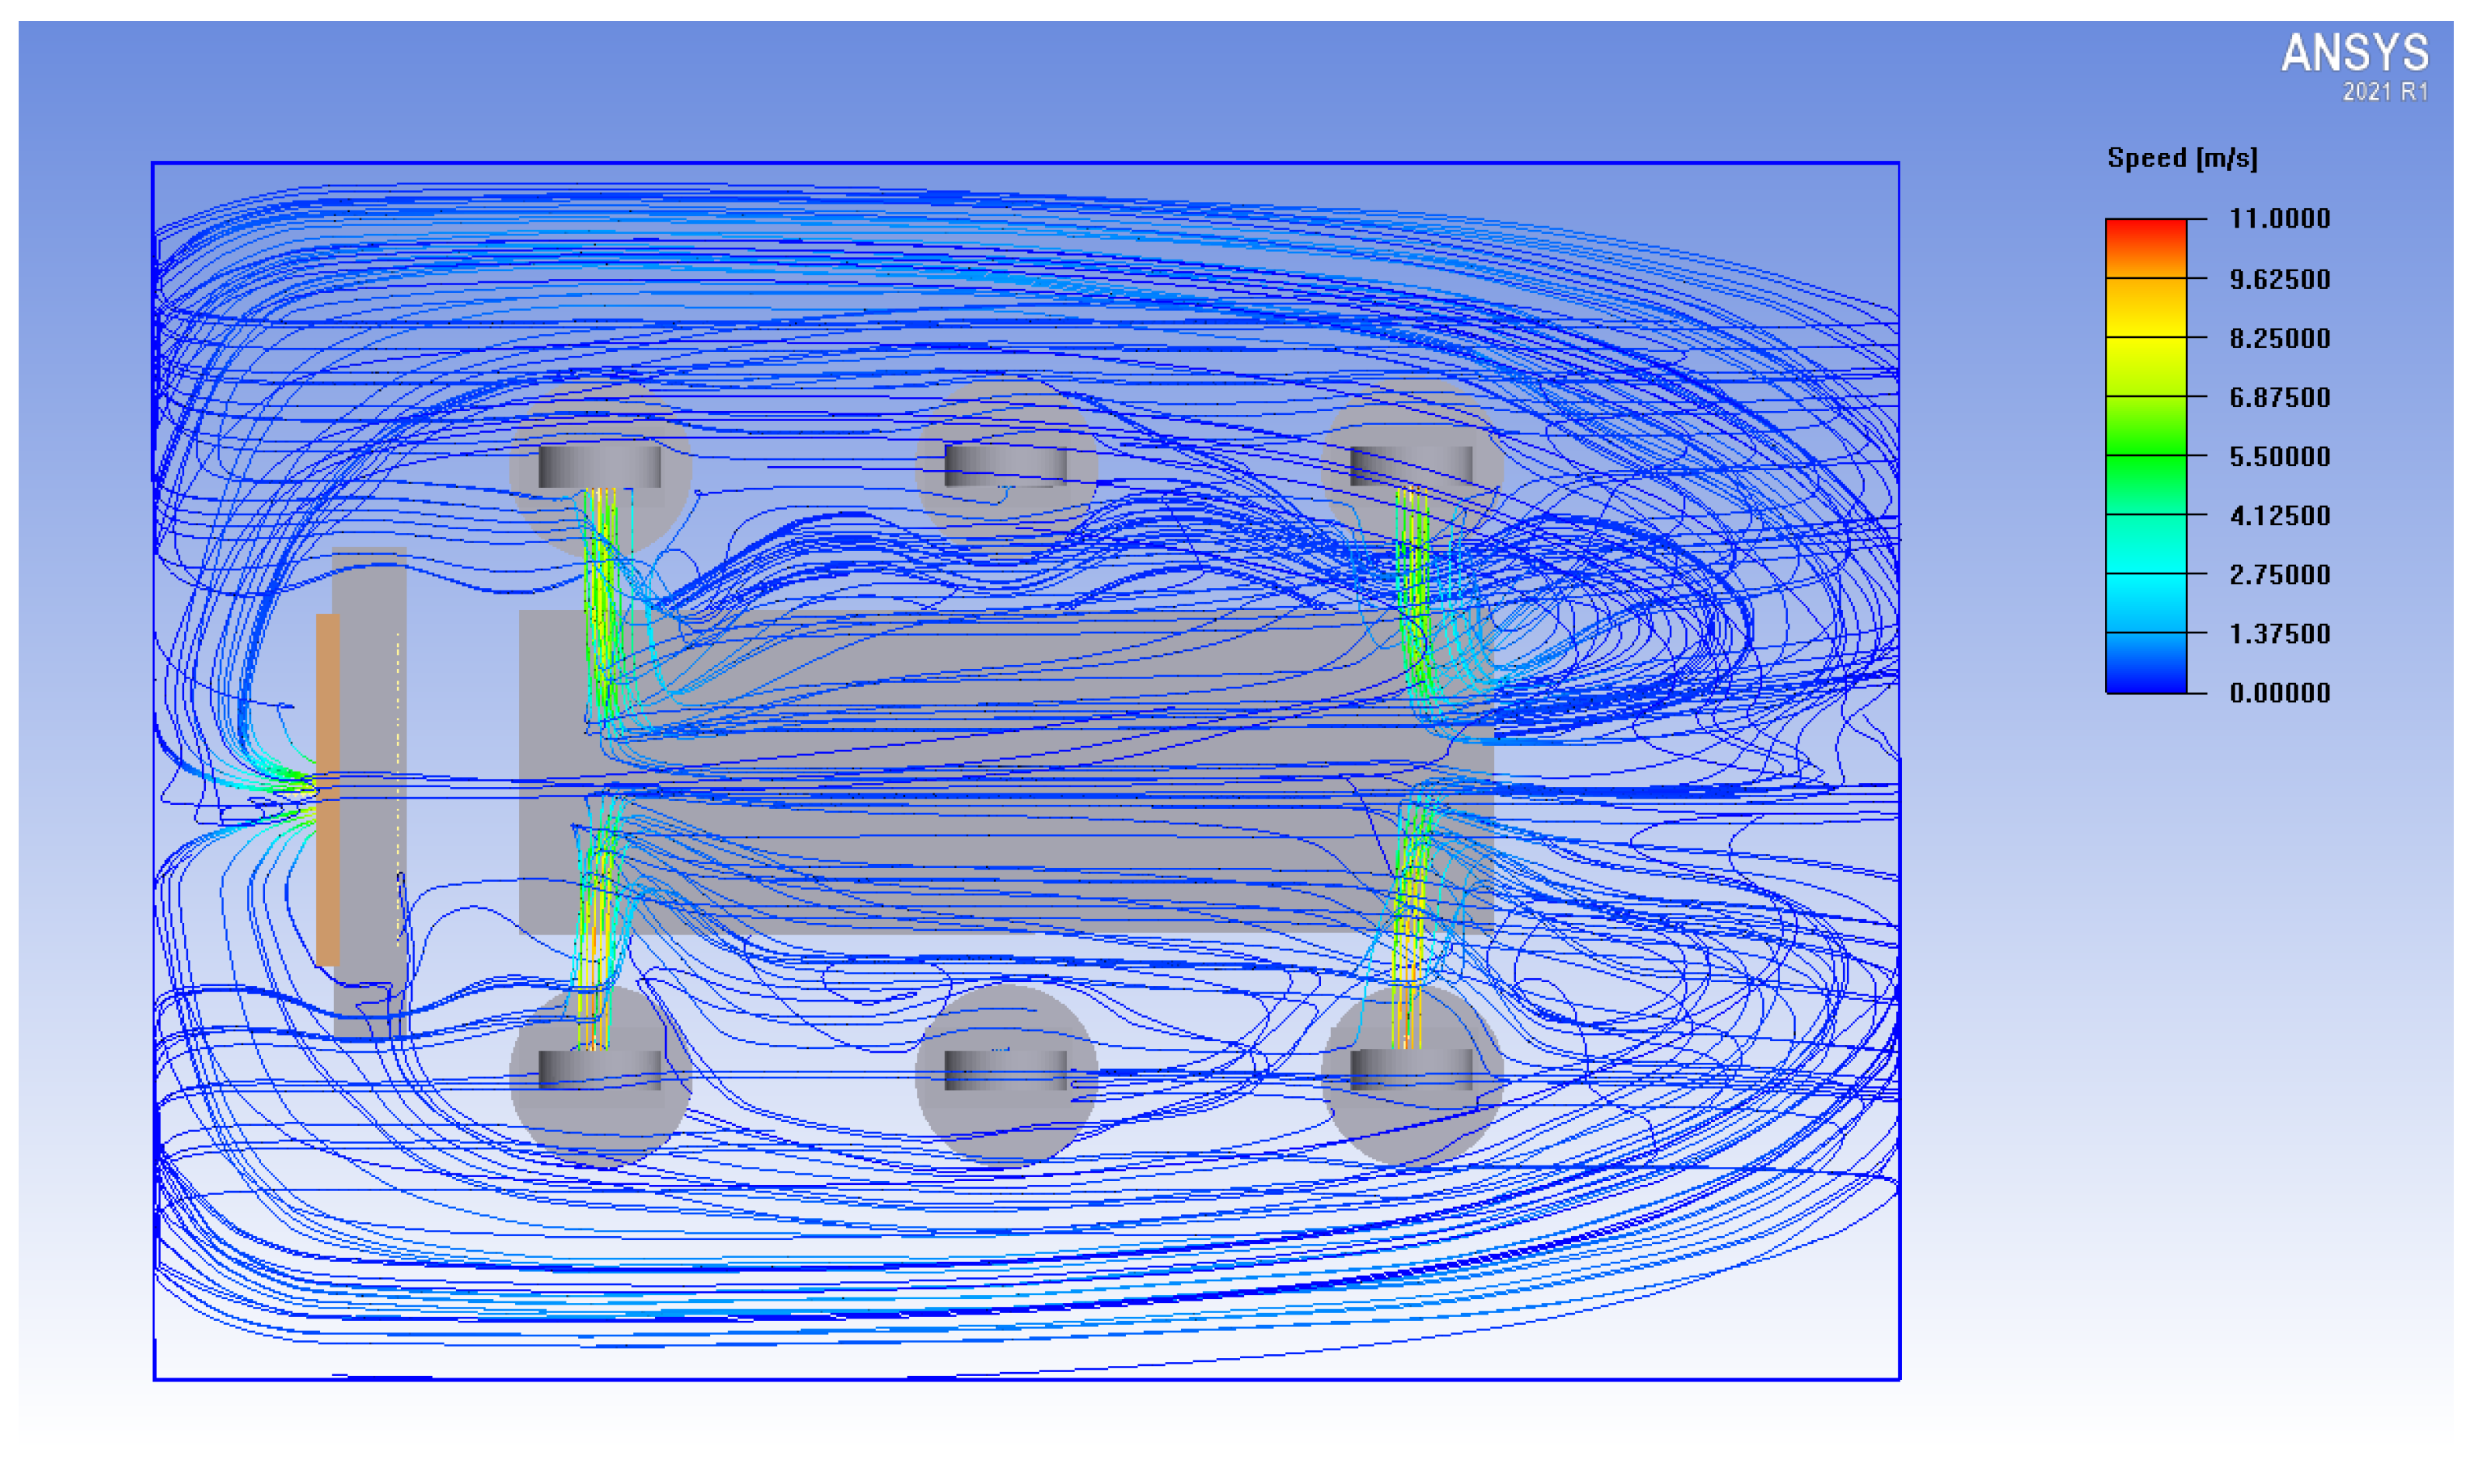
3. Results and Discussion
4. Conclusions
Author Contributions
Funding
Institutional Review Board Statement
Informed Consent Statement
Data Availability Statement
Acknowledgments
Conflicts of Interest
References
- Chiu, Y.-H.; Tai, Y.-Z.; Wu, M.-F. Using Buoyancy Ventilation Strategy to Improve Indoor Thermal Environment and Ventilation Performance. Archit. Plan. 2010, 11, 111–135. [Google Scholar]
- Gunatilaka, C.C.; Schuh, A.; Higano, N.S.; Woods, J.C.; Bates, A.J. The effect of airway motion and breathing phase during imaging on CFD simulations of respiratory airflow. Comput. Biol. Med. 2020, 127, 104099. [Google Scholar] [CrossRef] [PubMed]
- Cao, Q.; Liu, M.; Li, X. Influencing factors in the simulation of airflow and particle transportation in aircraft cabins by CFD. Build. Environ. 2022, 207, 108413. [Google Scholar] [CrossRef]
- Oh, W.; Ooka, R.; Kikumoto, H.; Han, M. Numerical modeling of cough airflow: Establishment of spatial–temporal experimental dataset and CFD simulation method. Build. Environ. 2022, 207, 108531. [Google Scholar] [CrossRef]
- Sheng, S.; Yamanaka, T.; Kobayashi, T.; Yuan, J.; Katoh, M. Modeling of supply airflow from slot line diffuser on ceiling for CFD of thermal environment in perimeter zone. Build. Environ. 2022, 213, 108884. [Google Scholar] [CrossRef]
- Endar, B.; Nurhandoko, R.K.; Martha, K.T.S.A.; Wibowo, S.W. Airflow Study of a Closed Room in the Public Spaces and Mass Transportation for Healthy and Safe from The Transmission of COVID-19 2020. J. Perenc. Pembang. Indones. J. Dev. Plan. 2021, 5, 20–31. [Google Scholar]
- Yang, A.; Holøs, S.B.; Resvoll, M.O.; Mysen, M.; Fjellheim, Ø. Temperature-Dependent Ventilation Rates Might Improve Perceived Air Quality in a Demand-Controlled Ventilation Strategy. Build. Environ. 2021, 205, 108180. [Google Scholar] [CrossRef]
- Sui, X.M.; Tian, Z.J.; Liu, H.T.; Chen, H.; Wang, D. Field Measurements on Indoor Air Quality of a Residential Building in Xi’an under Different Ventilation Modes in Winter. J. Build. Eng. 2021, 42, 103040. [Google Scholar] [CrossRef]
- Xu, J.C.; Guo, H.; Zhang, Y.L.; Lyu, X.P. Effectiveness of personalized air curtain in reducing exposure to airborne cough droplets. Build. Environ. 2021, 208, 108586. [Google Scholar] [CrossRef]
- Wang, Y.-H. Design and Analysis of Ambient Heat Flowin Quartz GlassTubing Processing Room Field. Master’s Thesis, National Chin-Yi University of Technology, Taichung City, Taiwan, 2019. [Google Scholar]
- Lu, C.-Y. Study on Control Efficiency and Cost of Fine Suspended Particles by Filters Used in Commercial Air Purifiers. Master’s Thesis, Jinwen University of Science and Technology, New Taipei City, Taiwan, 2019. [Google Scholar]
- Thi Dao, H.T.; Kim, K.-S. Behavior of cough droplets emitted from Covid-19 patient in hospital isolation room with different ventilation configurations. Build. Environ. 2022, 209, 108649. [Google Scholar]
- Benchrif, A.; Wheida, A.; Tahri, M.; Ramiz, M.; Biswas, S. Air Quality during Three COVID-19 Lockdown Phases: AQI, PM2.5 and NO2 Assessment in Cities with More than 1 Million Inhabitants. Sustain. Cities Soc. 2021, 47, 103170. [Google Scholar] [CrossRef] [PubMed]
- Agarwal, N.; Meena, C.S.; Raj, B.P.; Saini, L.; Kumar, A.; Gopalakrishnan, N.; Kumar, A.; Balam, N.B.; Alam, T.; Kapoor, N.R.; et al. Indoor Air Quality Improvement in COVID-19 Pandemic: Review. Sustain. Cities Soc. 2021, 70, 102942. [Google Scholar] [CrossRef]
- Sahraei, M.A.; Kuşkapan, E.; Çodur, M.Y. Public Transit Usage and Air Quality Index during the COVID-19 Lockdown. J. Environ. Manag. 2021, 286, 112166. [Google Scholar] [CrossRef] [PubMed]
- Jahanbin, A. Efficacy of Coupling Heat Recovery Ventilation and Fan Coil Systems in Improving the Indoor Air Quality and Thermal Comfort Condition. Energy Built Environ. 2021. [Google Scholar] [CrossRef]
- Zhu, Y.-D.; Li, X.; Fan, L.; Li, L.; Wang, J.; Yang, W.-J.; Yao, X.-Y.; Wang, X.-L. Indoor Air Quality in the Primary School of China—Results from CIEHS 2018 Study. Environ. Pollut. 2021, 291, 118094. [Google Scholar] [CrossRef] [PubMed]
- Raheja, S.; Obaidat, M.S.; Sadoun, B.; Malik, S.; Rani, A.; Kumar, M.; Stephan, T. Modeling and Simulation of Urban Air Quality with a 2-Phase Assessment Technique. Simul. Model. Pract. Theory 2021, 109, 102281. [Google Scholar] [CrossRef]
- Da Conceição Pereira, P.F.; Broday, E.E.; de Paula Xavier, A.A. Thermal Comfort Applied in Hospital Environments: A Literature Review. Appl. Sci. 2020, 10, 7030. [Google Scholar] [CrossRef]
- Sung, W.-P.; Chen, T.-Y.; Liu, C.-H. Strategy for Improving the Indoor Environment of Office Spaces in Subtropical Cities. Buildings 2022, 12, 412. [Google Scholar] [CrossRef]
- Pease, L.F.; Wang, N. A missing layer in COVID-19 studies: Transmission of enveloped viruses in mucus-rich droplets. Int. Commun. Heat Mass Transf. 2022, 131, 105746. [Google Scholar] [CrossRef]
- Mixture Model Theory. ANSYS Fluent Theory Guide; Ansys, Inc.: Canonsburg, PA, USA, 2020; Volume R1, pp. 593–603. [Google Scholar]
- Ansys, Inc. Ansys Icepak User’s Guide; Ansys, Inc.: Canonsburg, PA, USA, 2021; Volume R2, pp. 257–269. [Google Scholar]
- MayAir, D-Guard5. Available online: http://www.mayair.com.tw/items/8e3f1e (accessed on 20 March 2022).


| Measuring Points | 1 | 2 | 3 | 4 | 5 | 6 | 7 | 8 | 9 | |
|---|---|---|---|---|---|---|---|---|---|---|
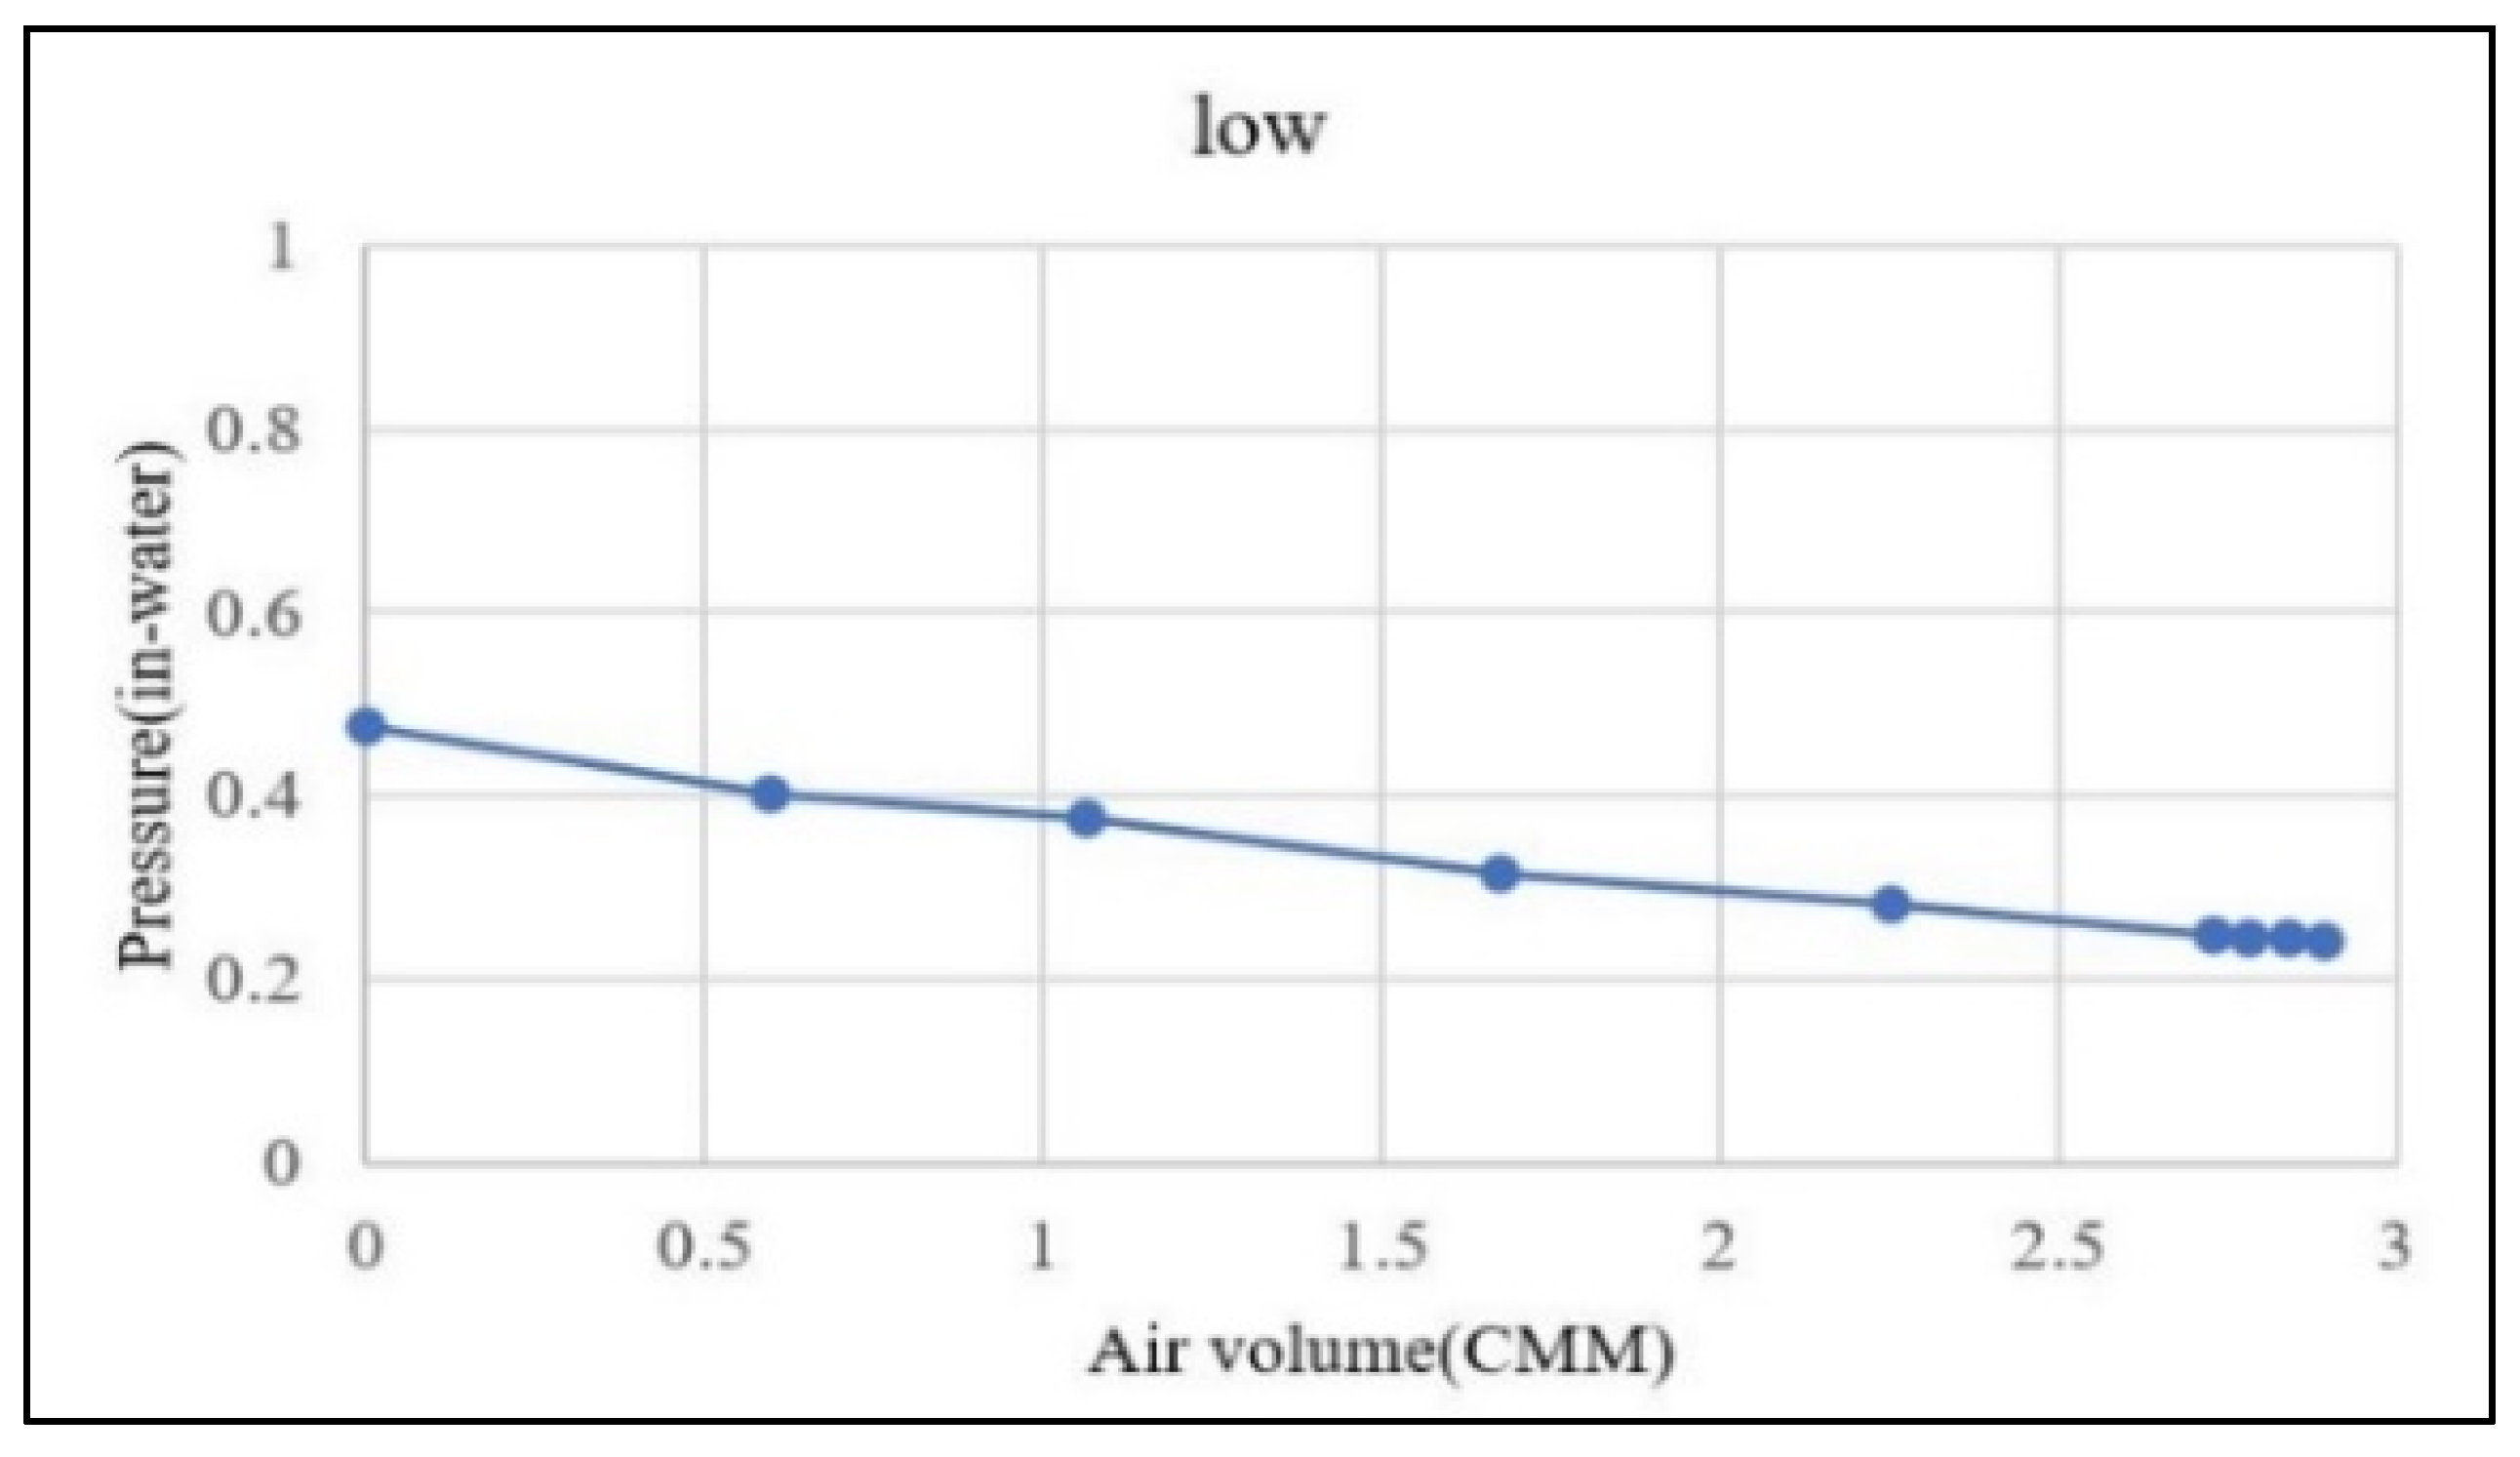
| Low rotation speed (LOW) | Air volume (CMM) | 0 | 0.5960 | 1.0621 | 1.6743 | 2.2525 | 2.7259 | 2.7810 | 2.8361 | 2.8912 |
| Pressure (in water) | 0.4770 | 0.4025 | 0.3759 | 0.3158 | 0.2821 | 0.2484 | 0.2464 | 0.2447 | 0.2435 | |
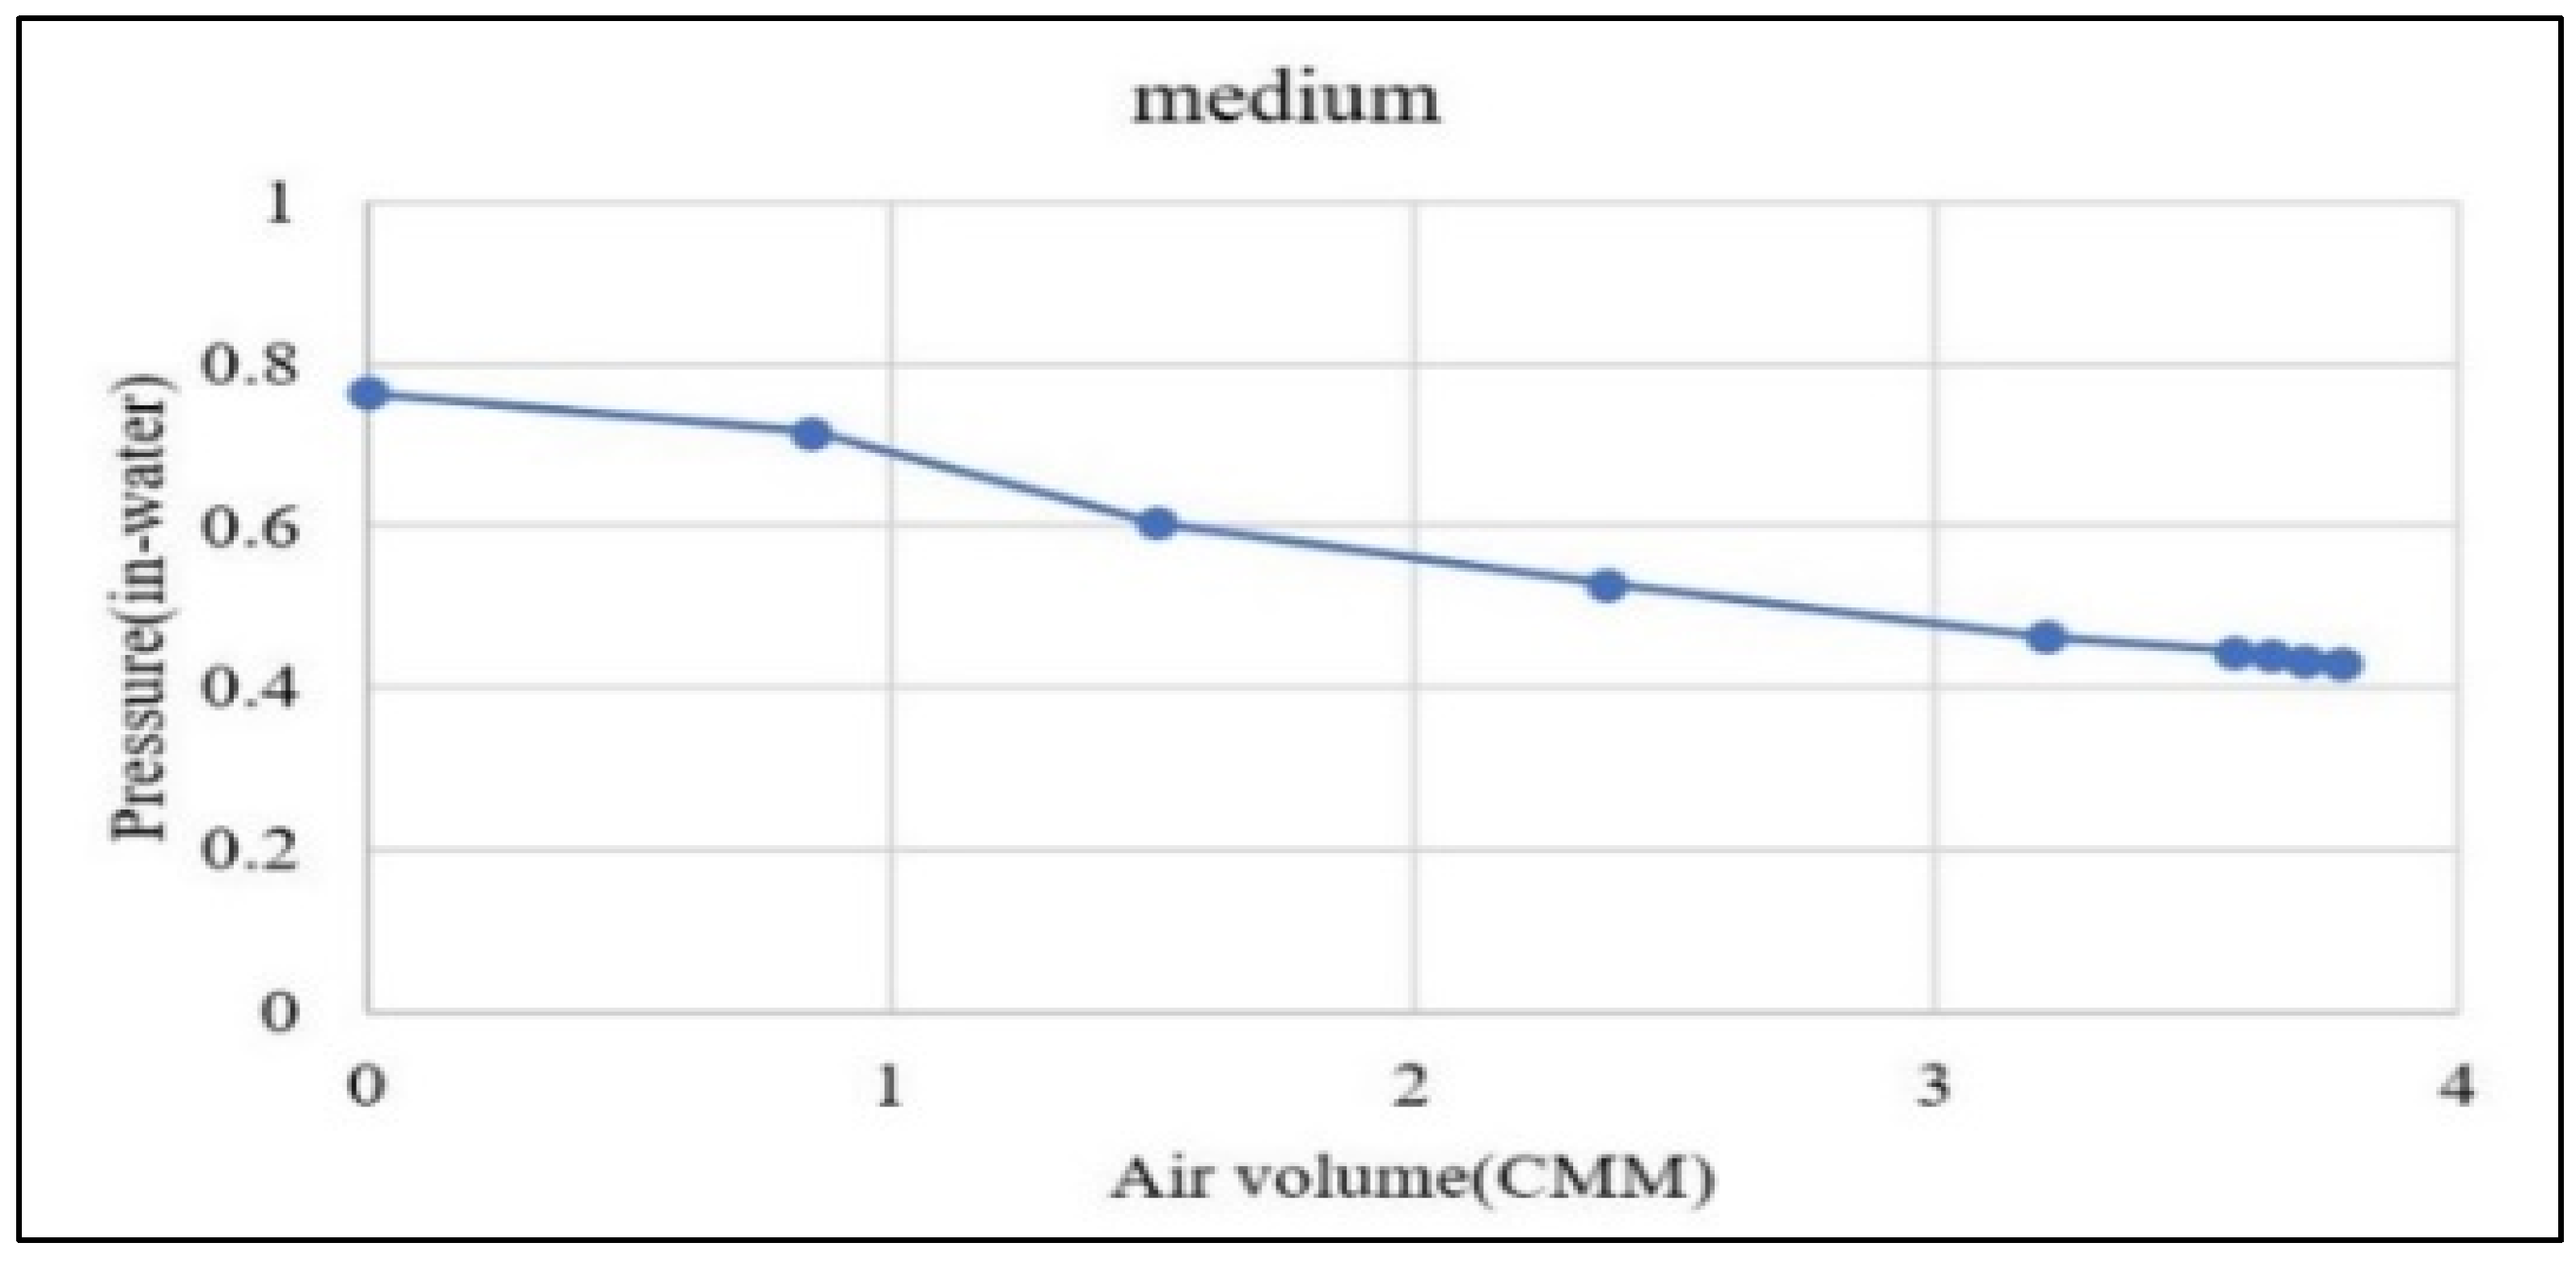
| Medium rotation speed (MEDIUM) | Air volume (CMM) | 0 | 0.8493 | 1.5122 | 2.3666 | 3.2118 | 3.5712 | 3.6388 | 3.7063 | 3.7747 |
| Pressure (in water) | 0.7647 | 0.7163 | 0.6036 | 0.5292 | 0.4640 | 0.4453 | 0.4404 | 0.4354 | 0.4308 | |
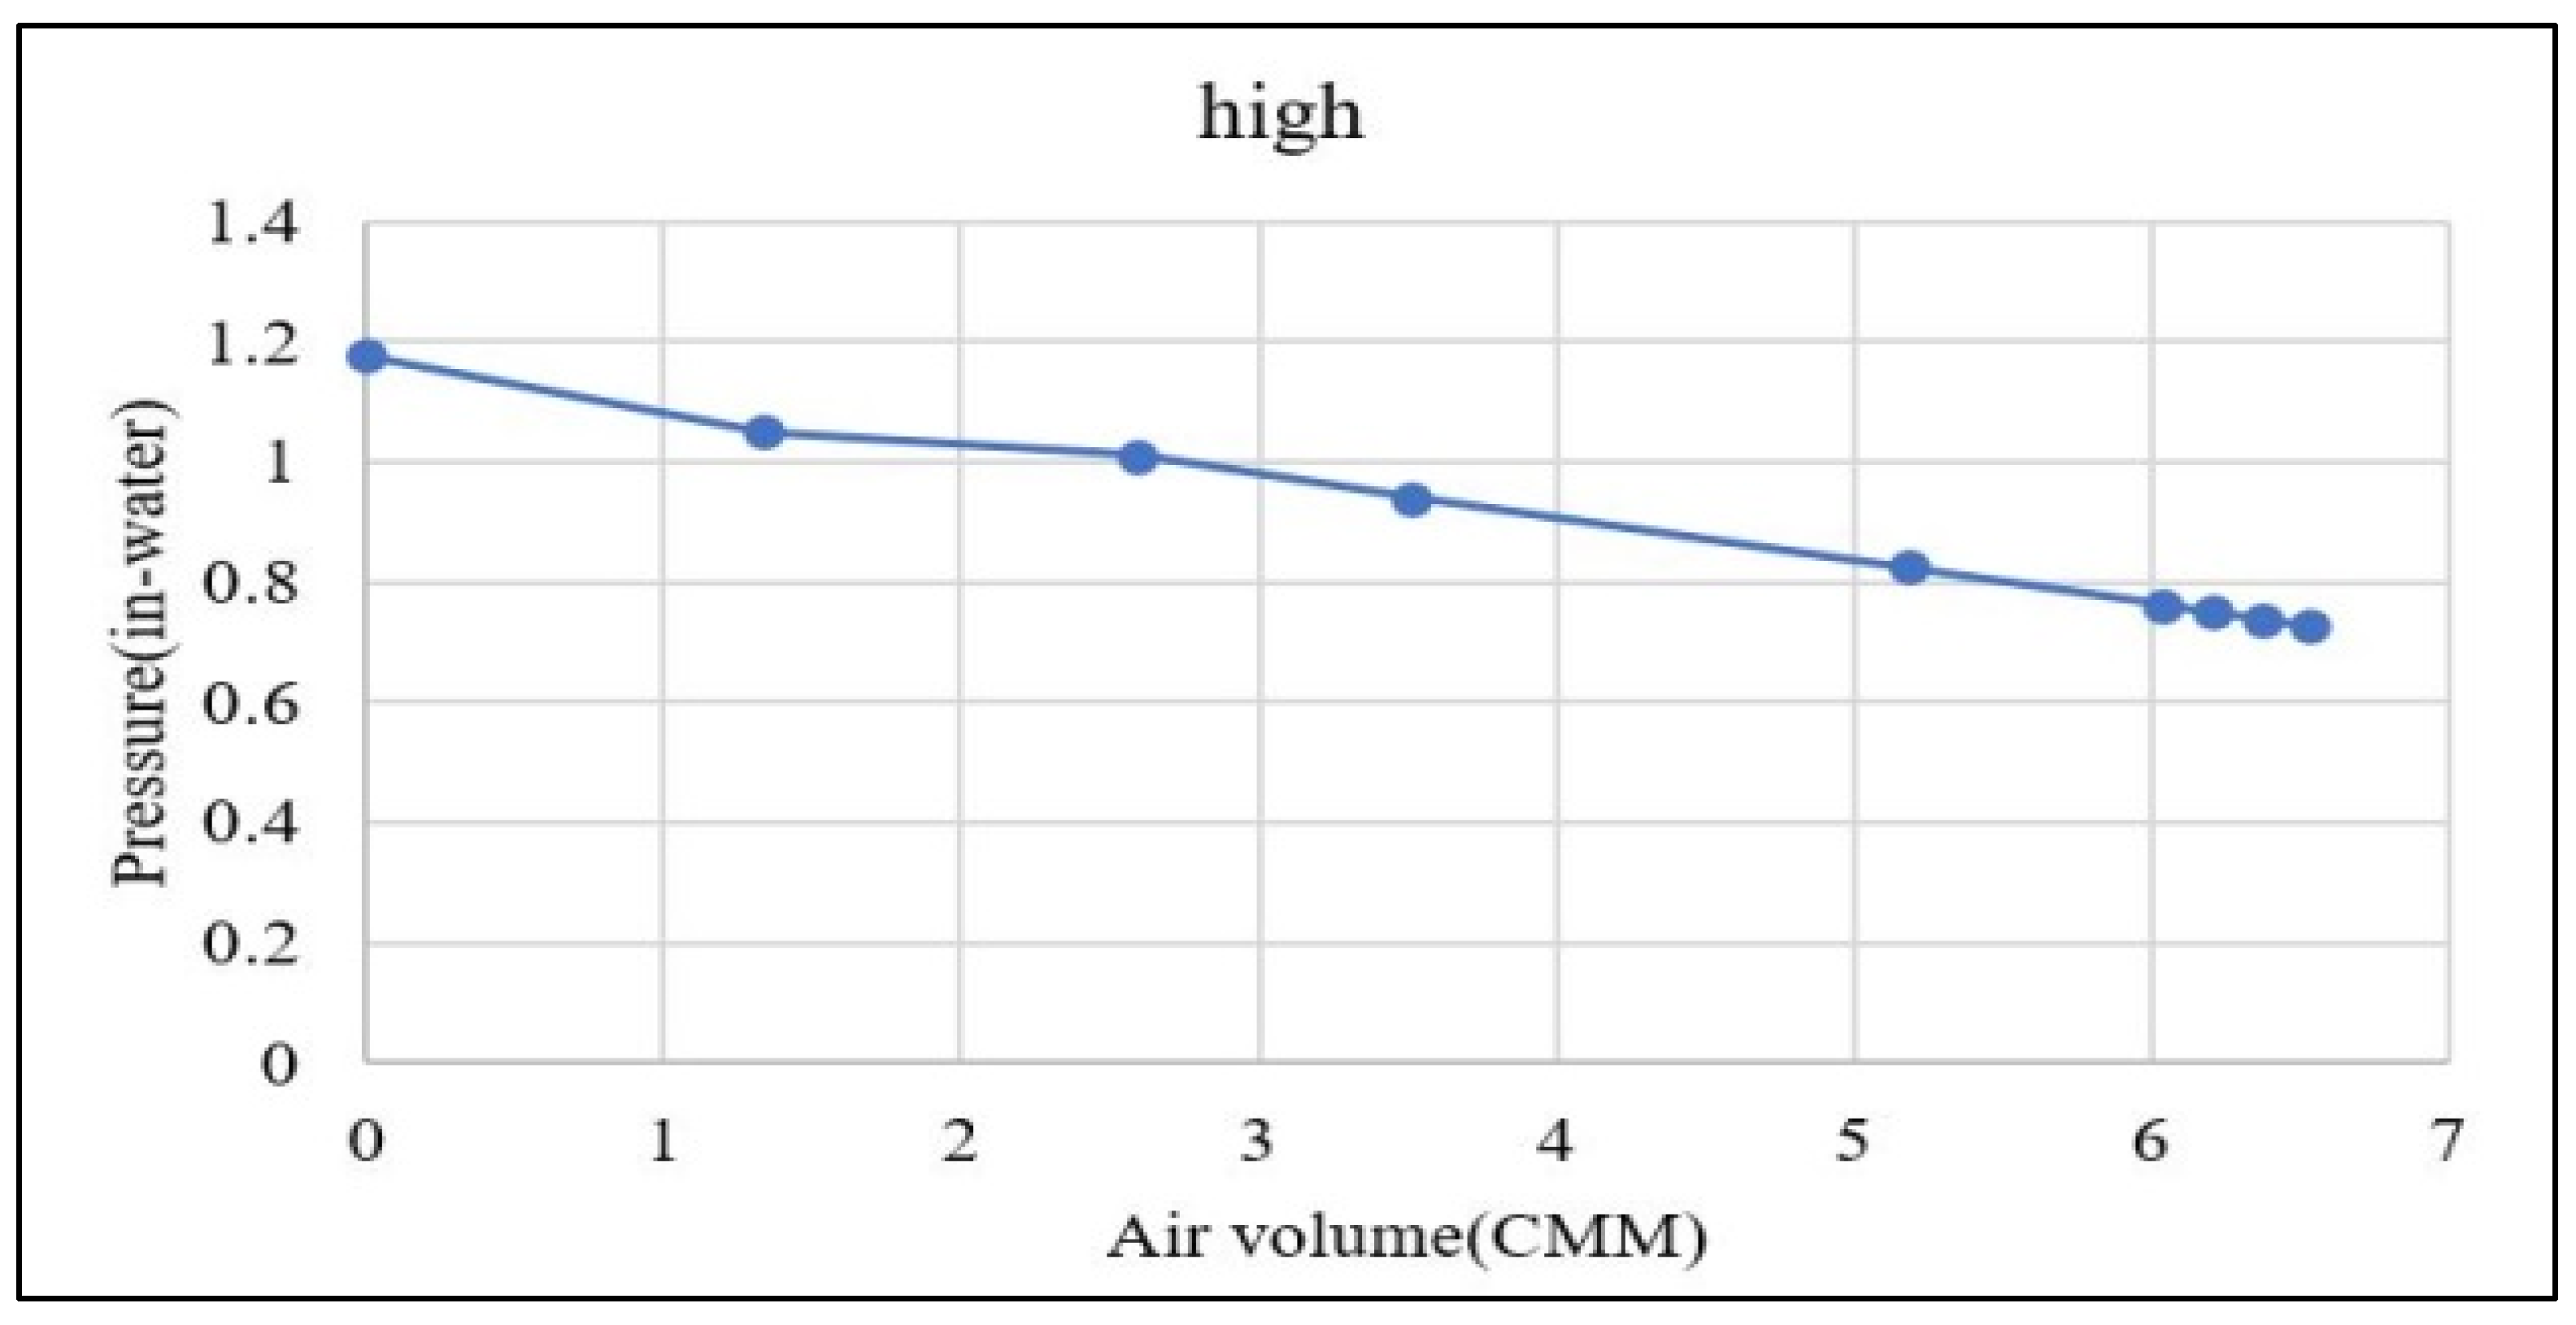
| High rotation speed (HIGH) | Air volume (CMM) | 0 | 1.3381 | 2.5906 | 3.5166 | 5.1802 | 6.0373 | 6.2046 | 6.3703 | 6.5371 |
| Pressure (in water) | 1.1774 | 1.0498 | 1.0105 | 0.9395 | 0.8245 | 0.7629 | 0.7510 | 0.7386 | 0.7271 |
| Measuring Points | 1 | 2 | 3 | 4 | 5 | 6 | 7 | 8 | 9 | |
|---|---|---|---|---|---|---|---|---|---|---|
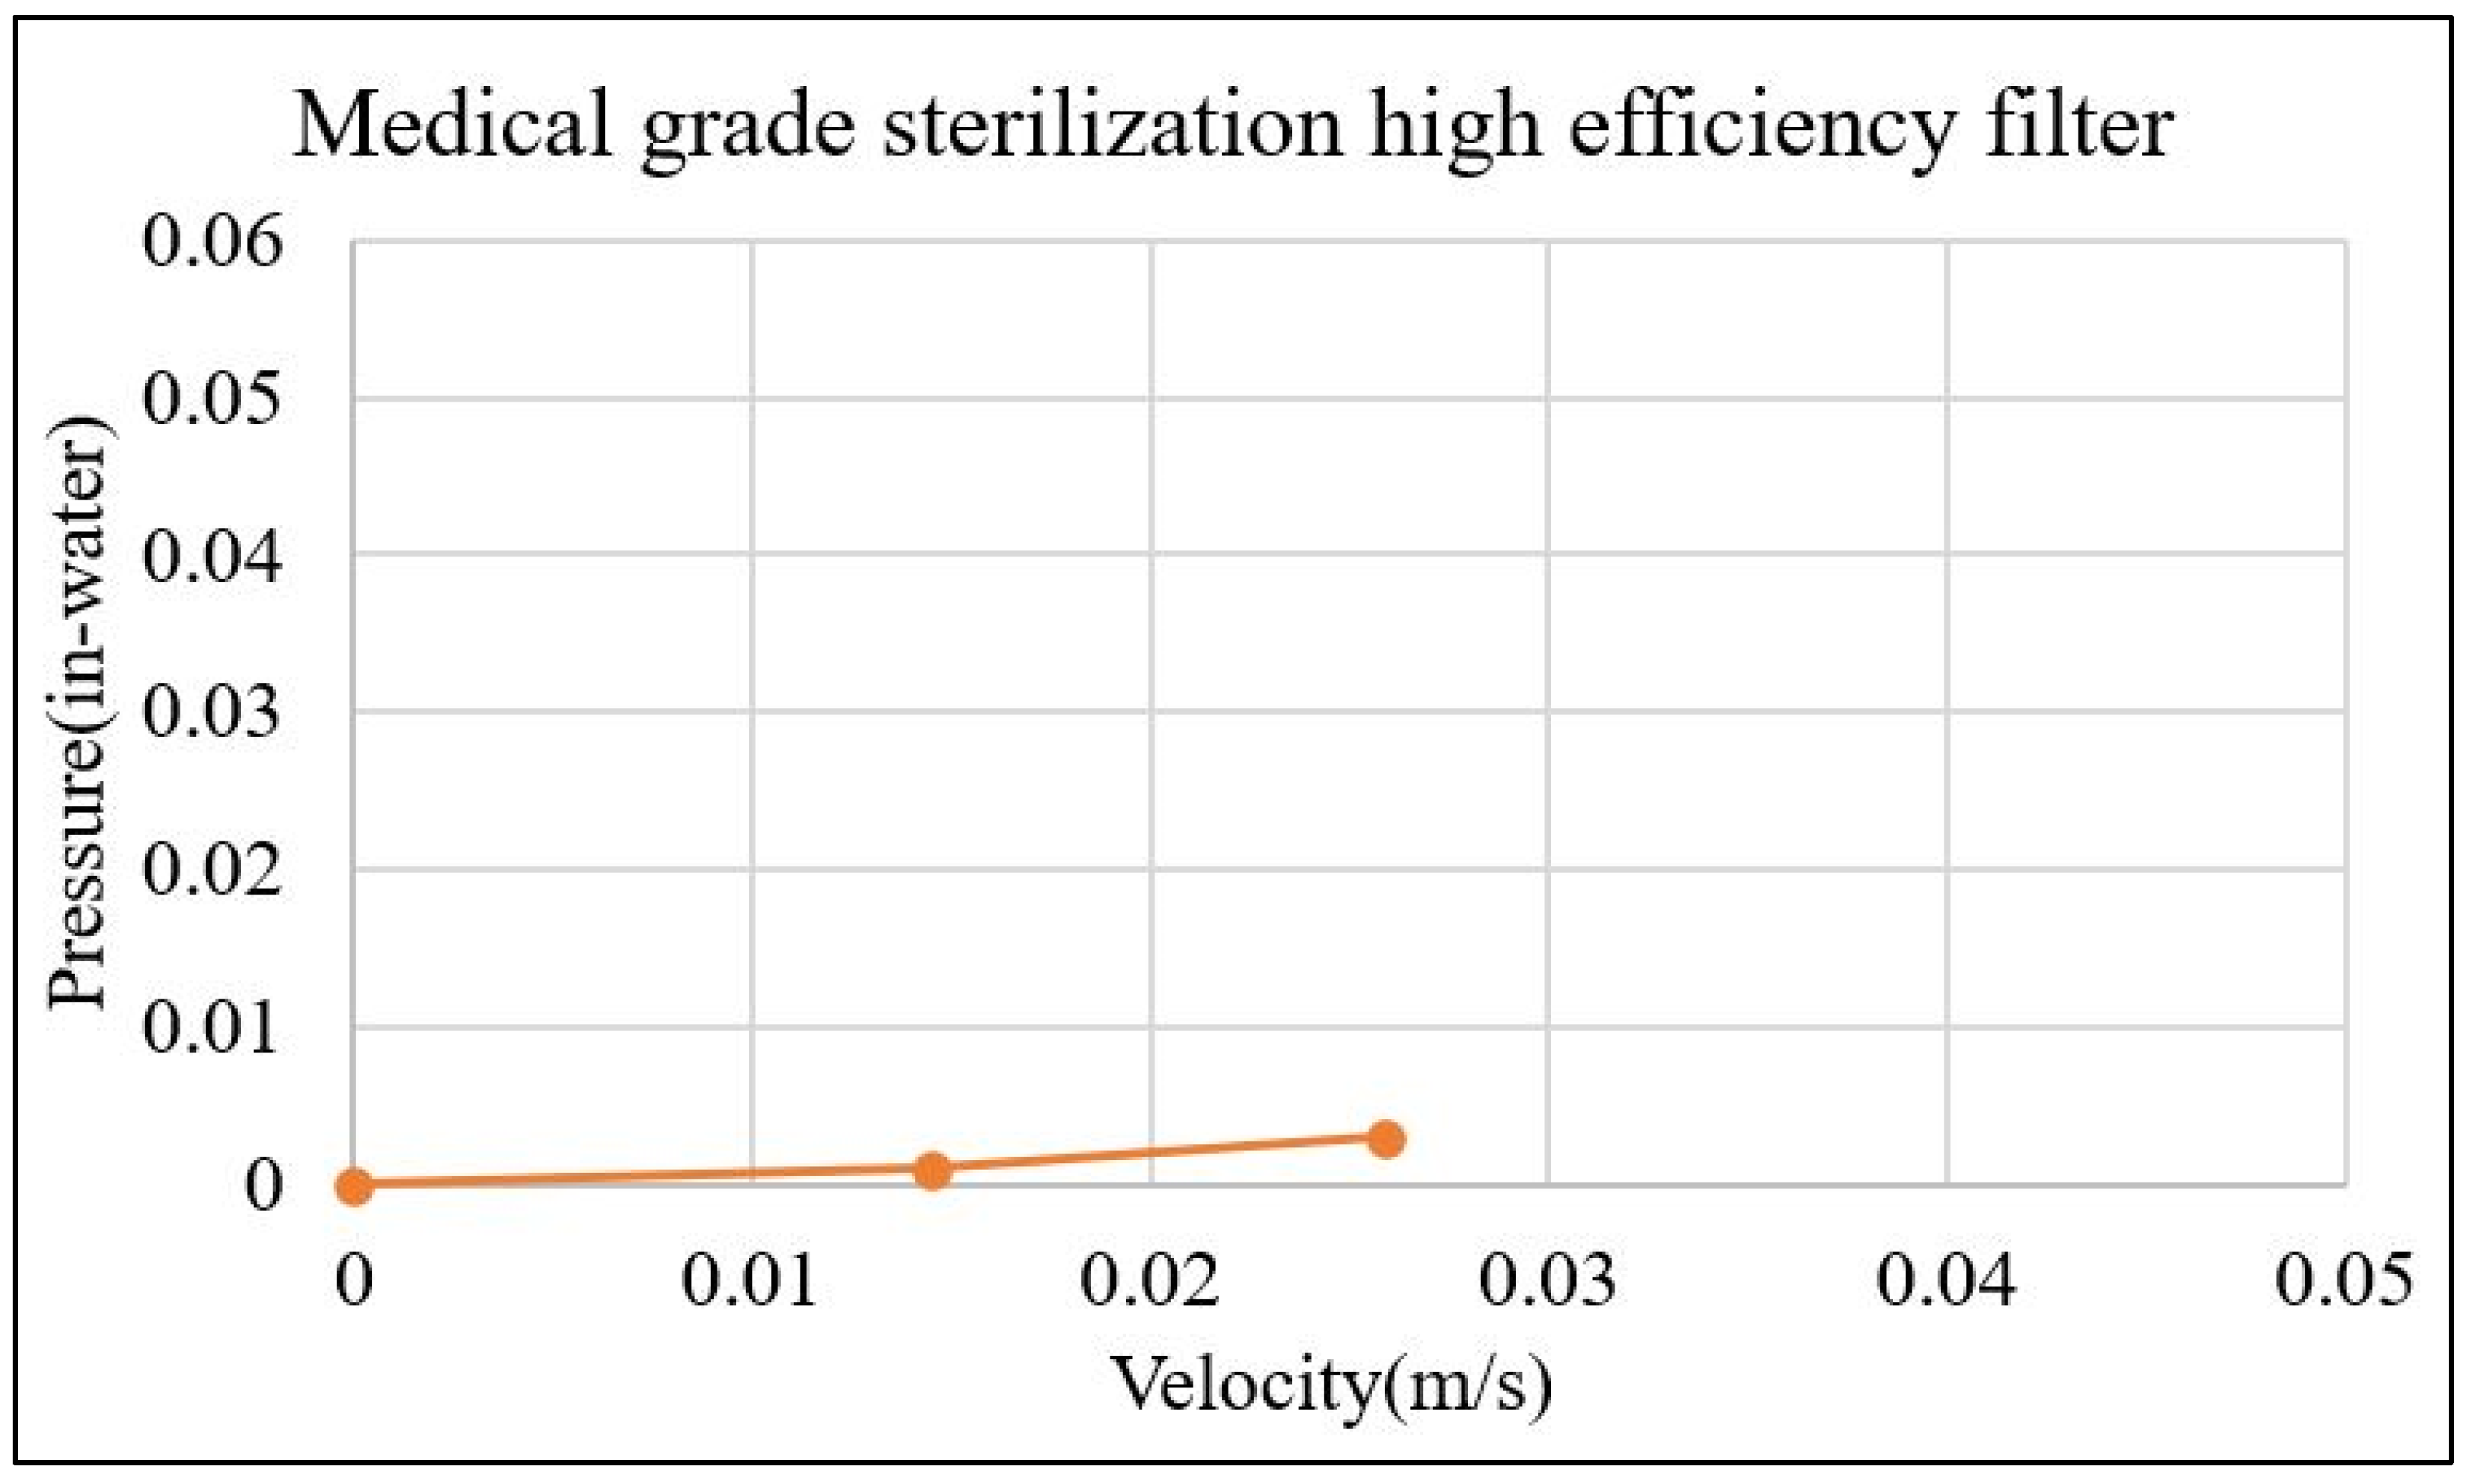
| High-efficiency medical sterilization filter screen (inner) | Velocity (m/s) | 0 | 0.0145 | 0.0259 | - | - | - | - | - | - |
| Pressure (in water) | 0 | 0.001 | 0.003 | - | - | - | - | - | - | |
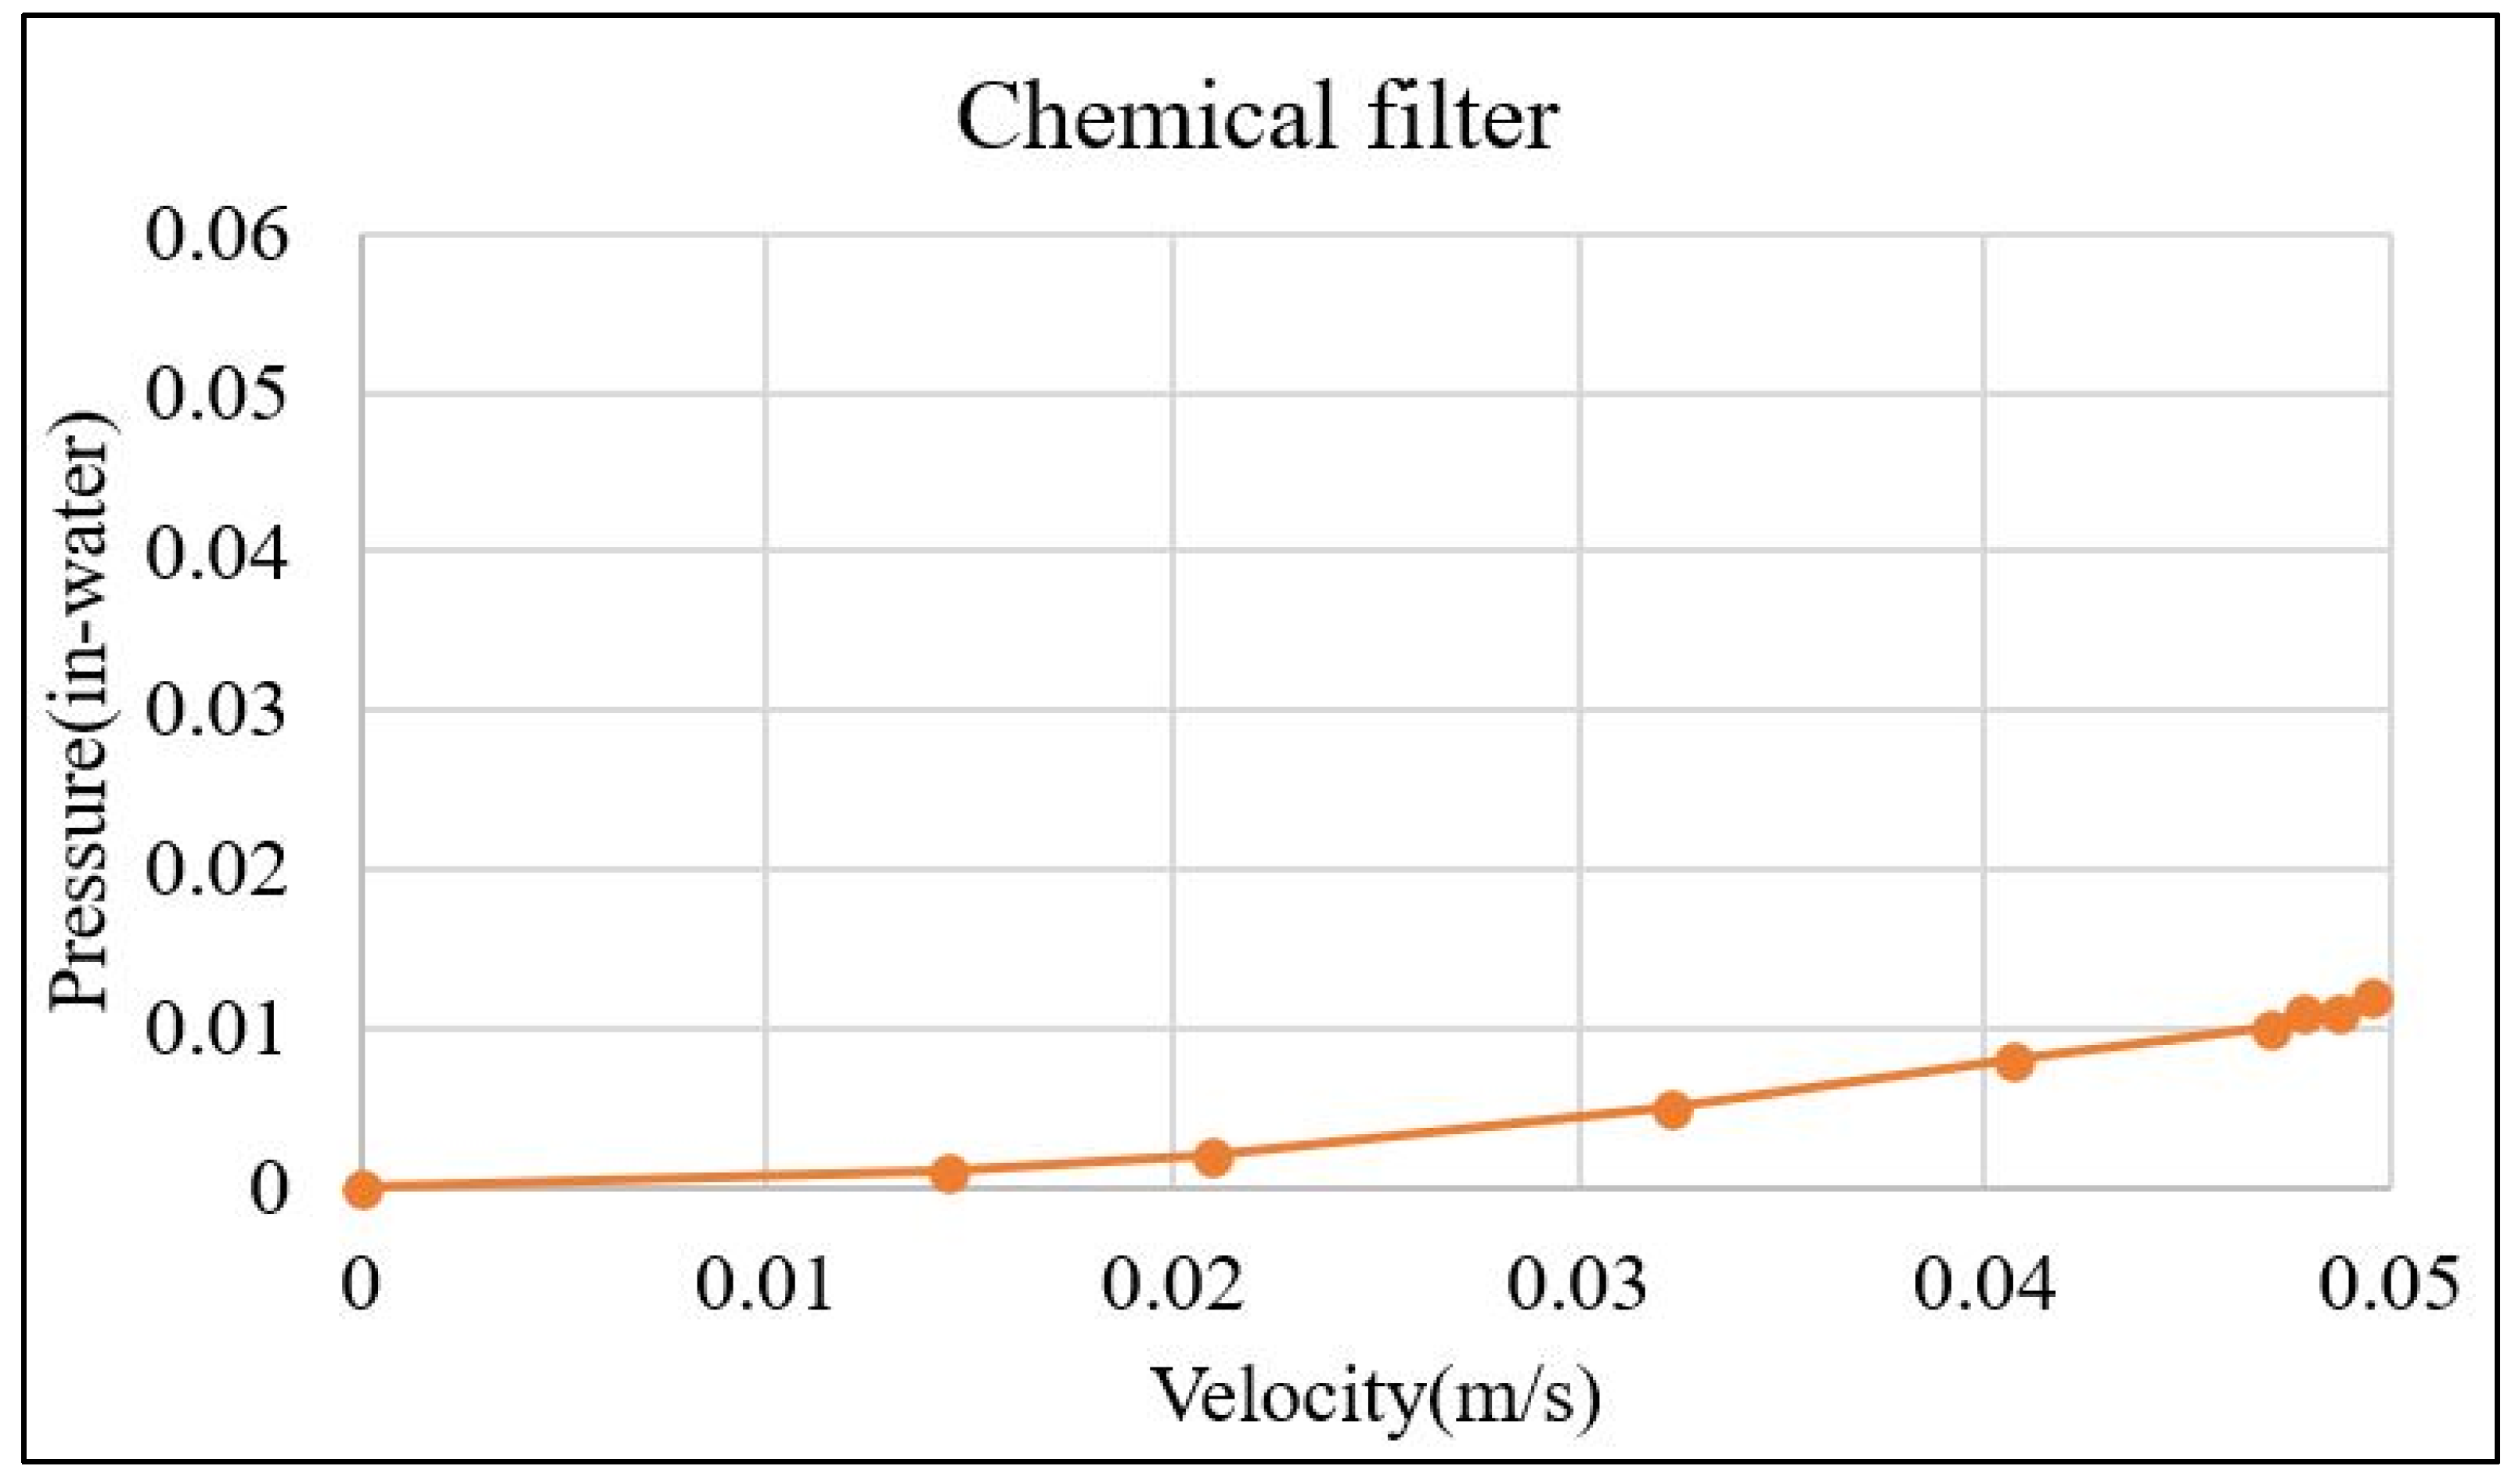
| Chemical filter screen (middle) | Velocity (m/s) | 0 | 0.0145 | 0.021 | 0.0323 | 0.0407 | 0.047 | 0.0478 | 0.0487 | 0.0495 |
| Pressure (in water) | 0 | 0.001 | 0.002 | 0.005 | 0.008 | 0.010 | 0.011 | 0.011 | 0.012 | |
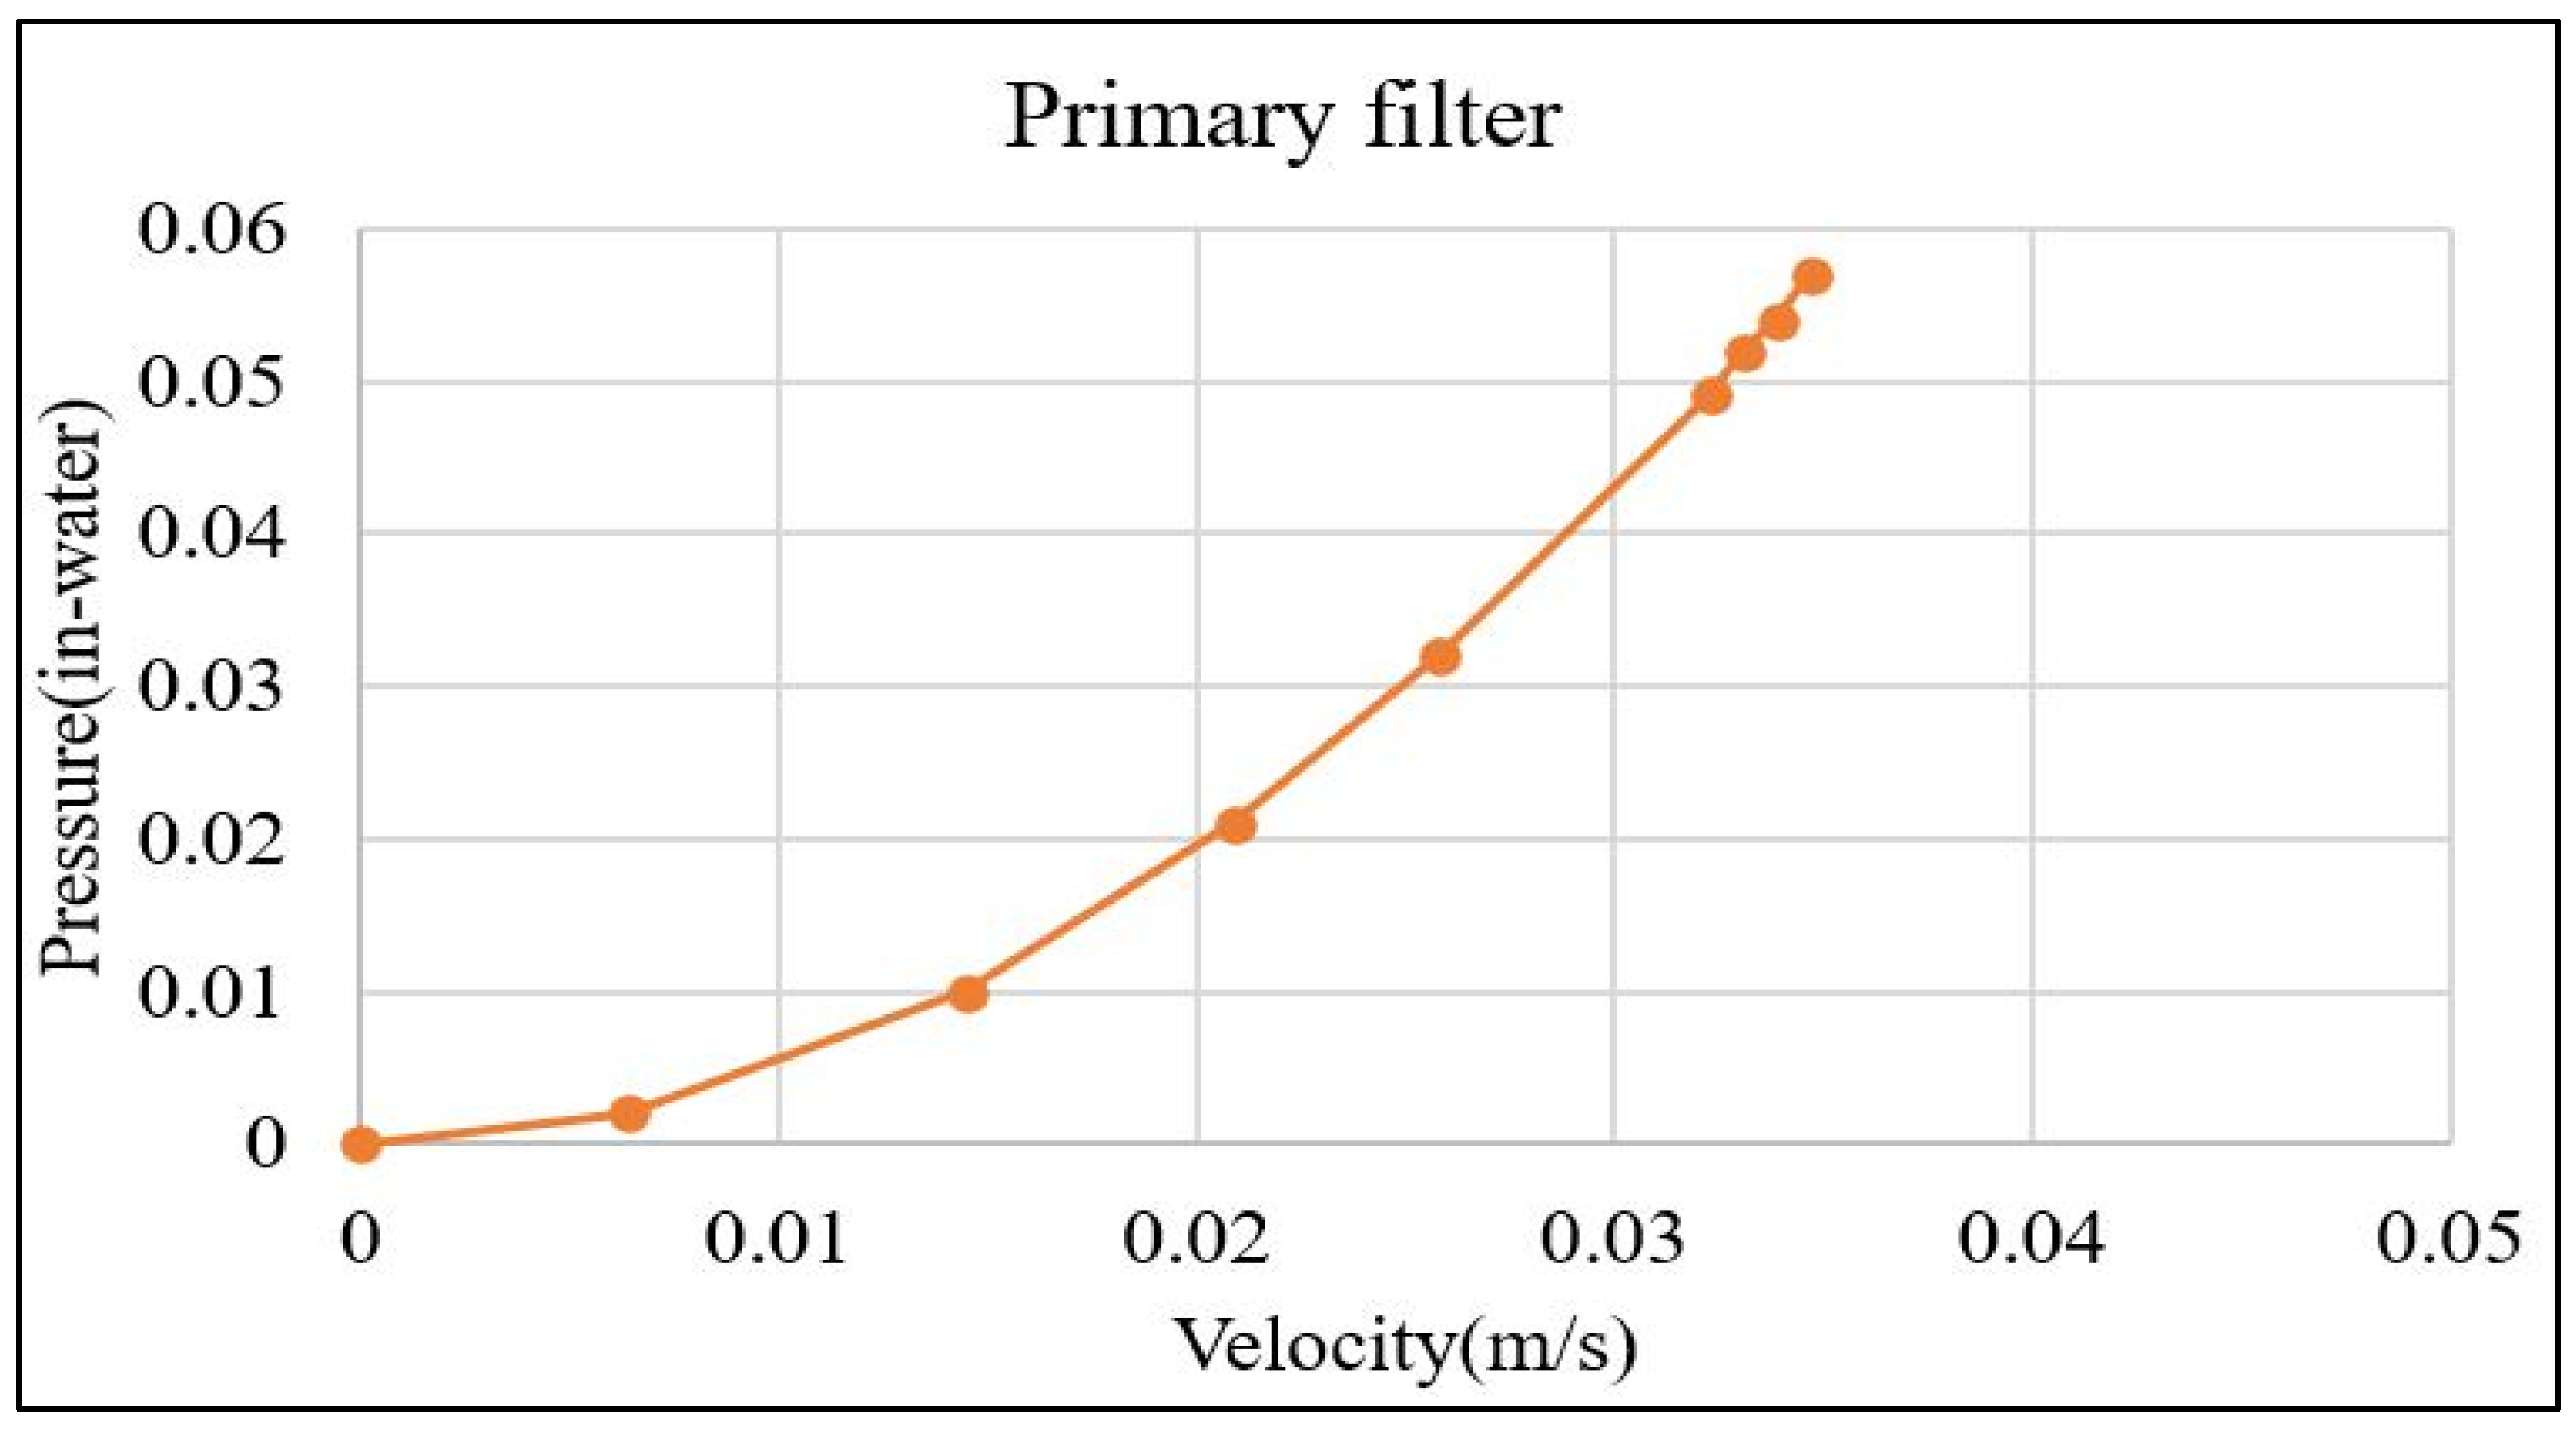
| Primary filter screen (outer) | Velocity (m/s)) | 0 | 0.0064 | 0.0145 | 0.0209 | 0.0258 | 0.0323 | 0.0331 | 0.0339 | 0.0347 |
| Pressure (in water) | 0 | 0.002 | 0.010 | 0.021 | 0.032 | 0.049 | 0.052 | 0.054 | 0.057 |
| Filter Screen Name | High-Efficiency Medical Sterilization Filter Screen | Chemical Filter Screen | Primary Filter Screen |
|---|---|---|---|
| Technical principles | The high-efficiency silver ion cleaning system filters PM2.5 and PM0.3, to achieve the sterilization effect effectively. | Filter formaldehyde and ozone, and effectively adsorb harmful substances, such as formaldehyde and ozone, to completely remove odor and maintain a fresh and clean medical environment. | Filter large particles, such as dust and floating objects in the air, to improve the service life of other filters. |
Publisher’s Note: MDPI stays neutral with regard to jurisdictional claims in published maps and institutional affiliations. |
© 2022 by the authors. Licensee MDPI, Basel, Switzerland. This article is an open access article distributed under the terms and conditions of the Creative Commons Attribution (CC BY) license (https://creativecommons.org/licenses/by/4.0/).
Share and Cite
Liu, Y.-L.; Kuan, Y.-D.; Luo, W.-J. A Study on Flow Field Characteristics and Air Purifier with Barrier Effects. Processes 2022, 10, 864. https://doi.org/10.3390/pr10050864
Liu Y-L, Kuan Y-D, Luo W-J. A Study on Flow Field Characteristics and Air Purifier with Barrier Effects. Processes. 2022; 10(5):864. https://doi.org/10.3390/pr10050864
Chicago/Turabian StyleLiu, Yu-Ling, Yean-Der Kuan, and Win-Jet Luo. 2022. "A Study on Flow Field Characteristics and Air Purifier with Barrier Effects" Processes 10, no. 5: 864. https://doi.org/10.3390/pr10050864
APA StyleLiu, Y.-L., Kuan, Y.-D., & Luo, W.-J. (2022). A Study on Flow Field Characteristics and Air Purifier with Barrier Effects. Processes, 10(5), 864. https://doi.org/10.3390/pr10050864