Article

Optimization of Repair Process Parameters for Open-Arc Surfacing Welding of Grinding Rolls Based on the Response Surface Method

School of Mechanical and Electrical Engineering, Shihezi University, Shihezi 832003, China
*
Author to whom correspondence should be addressed.
Processes 2022, 10(2), 321; https://doi.org/10.3390/pr10020321
Submission received: 9 January 2022 / Revised: 28 January 2022 / Accepted: 4 February 2022 / Published: 8 February 2022

Abstract

:
The dilution rate of surfacing layers and the quality of weld forming are important factors affecting the quality of surfacing layers in open-arc surfacing. They are determined by the interaction of various surfacing parameters. In this paper, the response surface method is used to optimize the process parameters of open-arc surfacing welding. Mathematical models of the surfacing current, surfacing voltage, surfacing speed, dilution rate and weld residual height were established, and the reliability of the models was verified by variance analysis. By performing an analysis of the perturbation diagram and response surface diagram, the influence law of each influencing factor on the response value was obtained. The parameters of surfacing welding were optimized by setting optimization targets, and the experimental results of optimized parameters were compared with the predicted results. The optimized surfacing parameters were tested by grinding roller surfacing repair. The experimental results show that the quality of the grinding roller can meet the repair requirements. This shows that the model can be used to guide the surface repair of rollers and is of great significance to ensure the surface-repair quality of rollers.

1. Introduction

Since the beginning of the 21st century, the power industry has developed rapidly, and the proportion of new energy sources such as solar, wind and nuclear power in total power generation has increased, but thermal power generation is still the main method of power supply due to the high amount of power generated [1]. A grinding roller is a key component in the preparation of coal powder for thermal power generation. Due to its harsh working environment, the surface of a grinding roller is severely worn [2]. When the surface of a grinding roller is worn to different degrees, the production efficiency of pulverized coal is seriously affected, thereby reducing the power-generation efficiency [3]. For severely worn grinding rollers, two methods are usually used, i.e., replacing new rollers and repairing old rollers for reuse. Obviously, the latter has lower economic costs [4,5,6,7].
A grinding roller is composed of a matrix and a surfacing layer. The matrix is usually cast from low-carbon steel, and the surfacing layer is a wear-resistant material with a certain thickness introduced on the surface of the grinding roller substrate by surfacing welding. This wear-resistant material is mainly high chromium cast iron, which has excellent wear resistance. This kind of surfacing composite manufacturing grinding roller has multiple surfacing repair characteristics. Compared with an integral casting grinding roller, it has better repairability, can be repeatedly surfaced, and has a lower cost. It is widely used in the thermal power industry [8]. Surfacing welding refers to welding that increases or restores the original size of parts or provides the surface of welded elements with special properties and the ability to deposit metal. Surface welding is achieved in two ways, the first uses the arc method to change the size of welded parts, where the surface properties of the welded parts are not changed; the second uses the surfacing method to obtain special features such as wear resistance, corrosion resistance or heat resistance on the surface of the welded parts. The performance of the surfacing layer changes, so the surface properties of the welded parts change. Open-arc surfacing welding is a kind of surfacing method. It has high cladding efficiency, simple operation and easy automation; as well as no preheating before welding; no slow cooling after welding; no protective measures during welding; and no cleaning. Slag can be continuously surfaced and it has the advantages of low energy consumption and low cost and is widely used to repair grinding rollers [9,10].
The properties of the surfacing layer are related to not only the properties of the surfacing material but also the dilution rate and weld-forming quality. The dilution rate refers to the volume percentage of the melted base metal in the weld metal during surfacing, that is, the percentage of melted base metal in the whole weld metal. It mainly affects the chemical composition and metallographic structure of the surfacing weld and then affects the mechanical properties of the surfacing layer [11]. The wear resistance of the roller surfacing material is better than that of roller base material, which is low-carbon steel and high-chromium cast iron. To increase the proportion of welding wire melting metal in the weld, the mechanical properties of the surfacing layer are improved, hopefully yielding a lower dilution rate. The weld morphology and dilution rate mainly depend on the welding line energy, which depends on the surfacing current, surfacing voltage and surfacing speed [12]. By establishing a regression equation, the influence of the surfacing parameters on the weld morphology and dilution rate can be better understood, which has important guiding significance for obtaining a high-quality wear-resistant surfacing layer. In this paper, the response surface method is used to establish a mathematical model of the repair process parameters (surfacing current, surfacing voltage, and surfacing welding speed) and response value (dilution rate and excess height) of grinding roller open-arc surfacing welding and to explore the effect of surfacing welding process parameters on the dilution rate. The influence of weld morphology, dilution rate and excess height are predicted, and the optimal combination of surfacing parameters is provided to obtain a high-quality wear-resistant surfacing layer and improve the quality of roller surfacing repair [13].

Experimental Methods

The experimental method used in this experiment is the response surface method. The response surface method can be used to study the nonlinear influence of different influencing factors on a response variable within a certain range and to optimize it according to actual needs. Therefore, the regression analysis method is usually used for data analysis, and the corresponding regression mathematical model, namely, the response surface model, is established. By observing the surface-change trend of the response surface model, we can intuitively see the change law of the response factor along with the influence factor. In short, the response surface method establishes a mathematical model between the impact factor and the response value to predict the response value. The more accurate the model is, the more accurate the prediction of the response value [14]. In recent years, the response surface methodology has been widely used as experimental method for parameter optimization in chemical engineering, agriculture, pharmaceuticals, environmental studies, and mechanical engineering. Scholars at home and abroad have carried out much research based on response surface methodology [15,16,17,18,19].
Combined with the practical application of the surfacing repair of grinding rollers and previous welding experiments, this paper determines the factors that have a great influence on the quality of surfacing welding of grinding rollers, namely, surfacing current, surfacing voltage, and surfacing speed. Then, based on the response surface method, Design-Expert 11 software is used to design a response surface experiment with the surfacing current, surfacing voltage, and surfacing speed as the influencing factors and the dilution rate and response factor of the weld height. The optimization level of the optimization parameters (surfacing current, surfacing voltage, and surfacing speed) was determined through preliminary experiments, three factors and five levels were designed, and a total of 20 groups of experiments were designed [20].

2. Design of the Experiment

2.1. Design of the Experiment Matrix

In the experimental design of the response surface method, CCD (central composite design) and BBD (Box–Behnken design) are two common second-order response surface designs. CCD is currently the most widely used. It can perform a consistent precision design to determine the most advantageous position. Therefore, this paper uses the CCD method to design a three-factor five-level experiment program based on the response surface method [21]. The relationship between the true value of the factor and the coded value is:
                                                            X i = 1.682 [ 2 X ( X m a x + X m i n ) ] / ( X m a x X m i n )
In the formula X is a real value between the maximum value Xmax and the minimum value Xmin of the design factor, and Xi is the coded value of the real value X. Among them, the actual values and coding values of the experimental design factors are shown in Table 1.

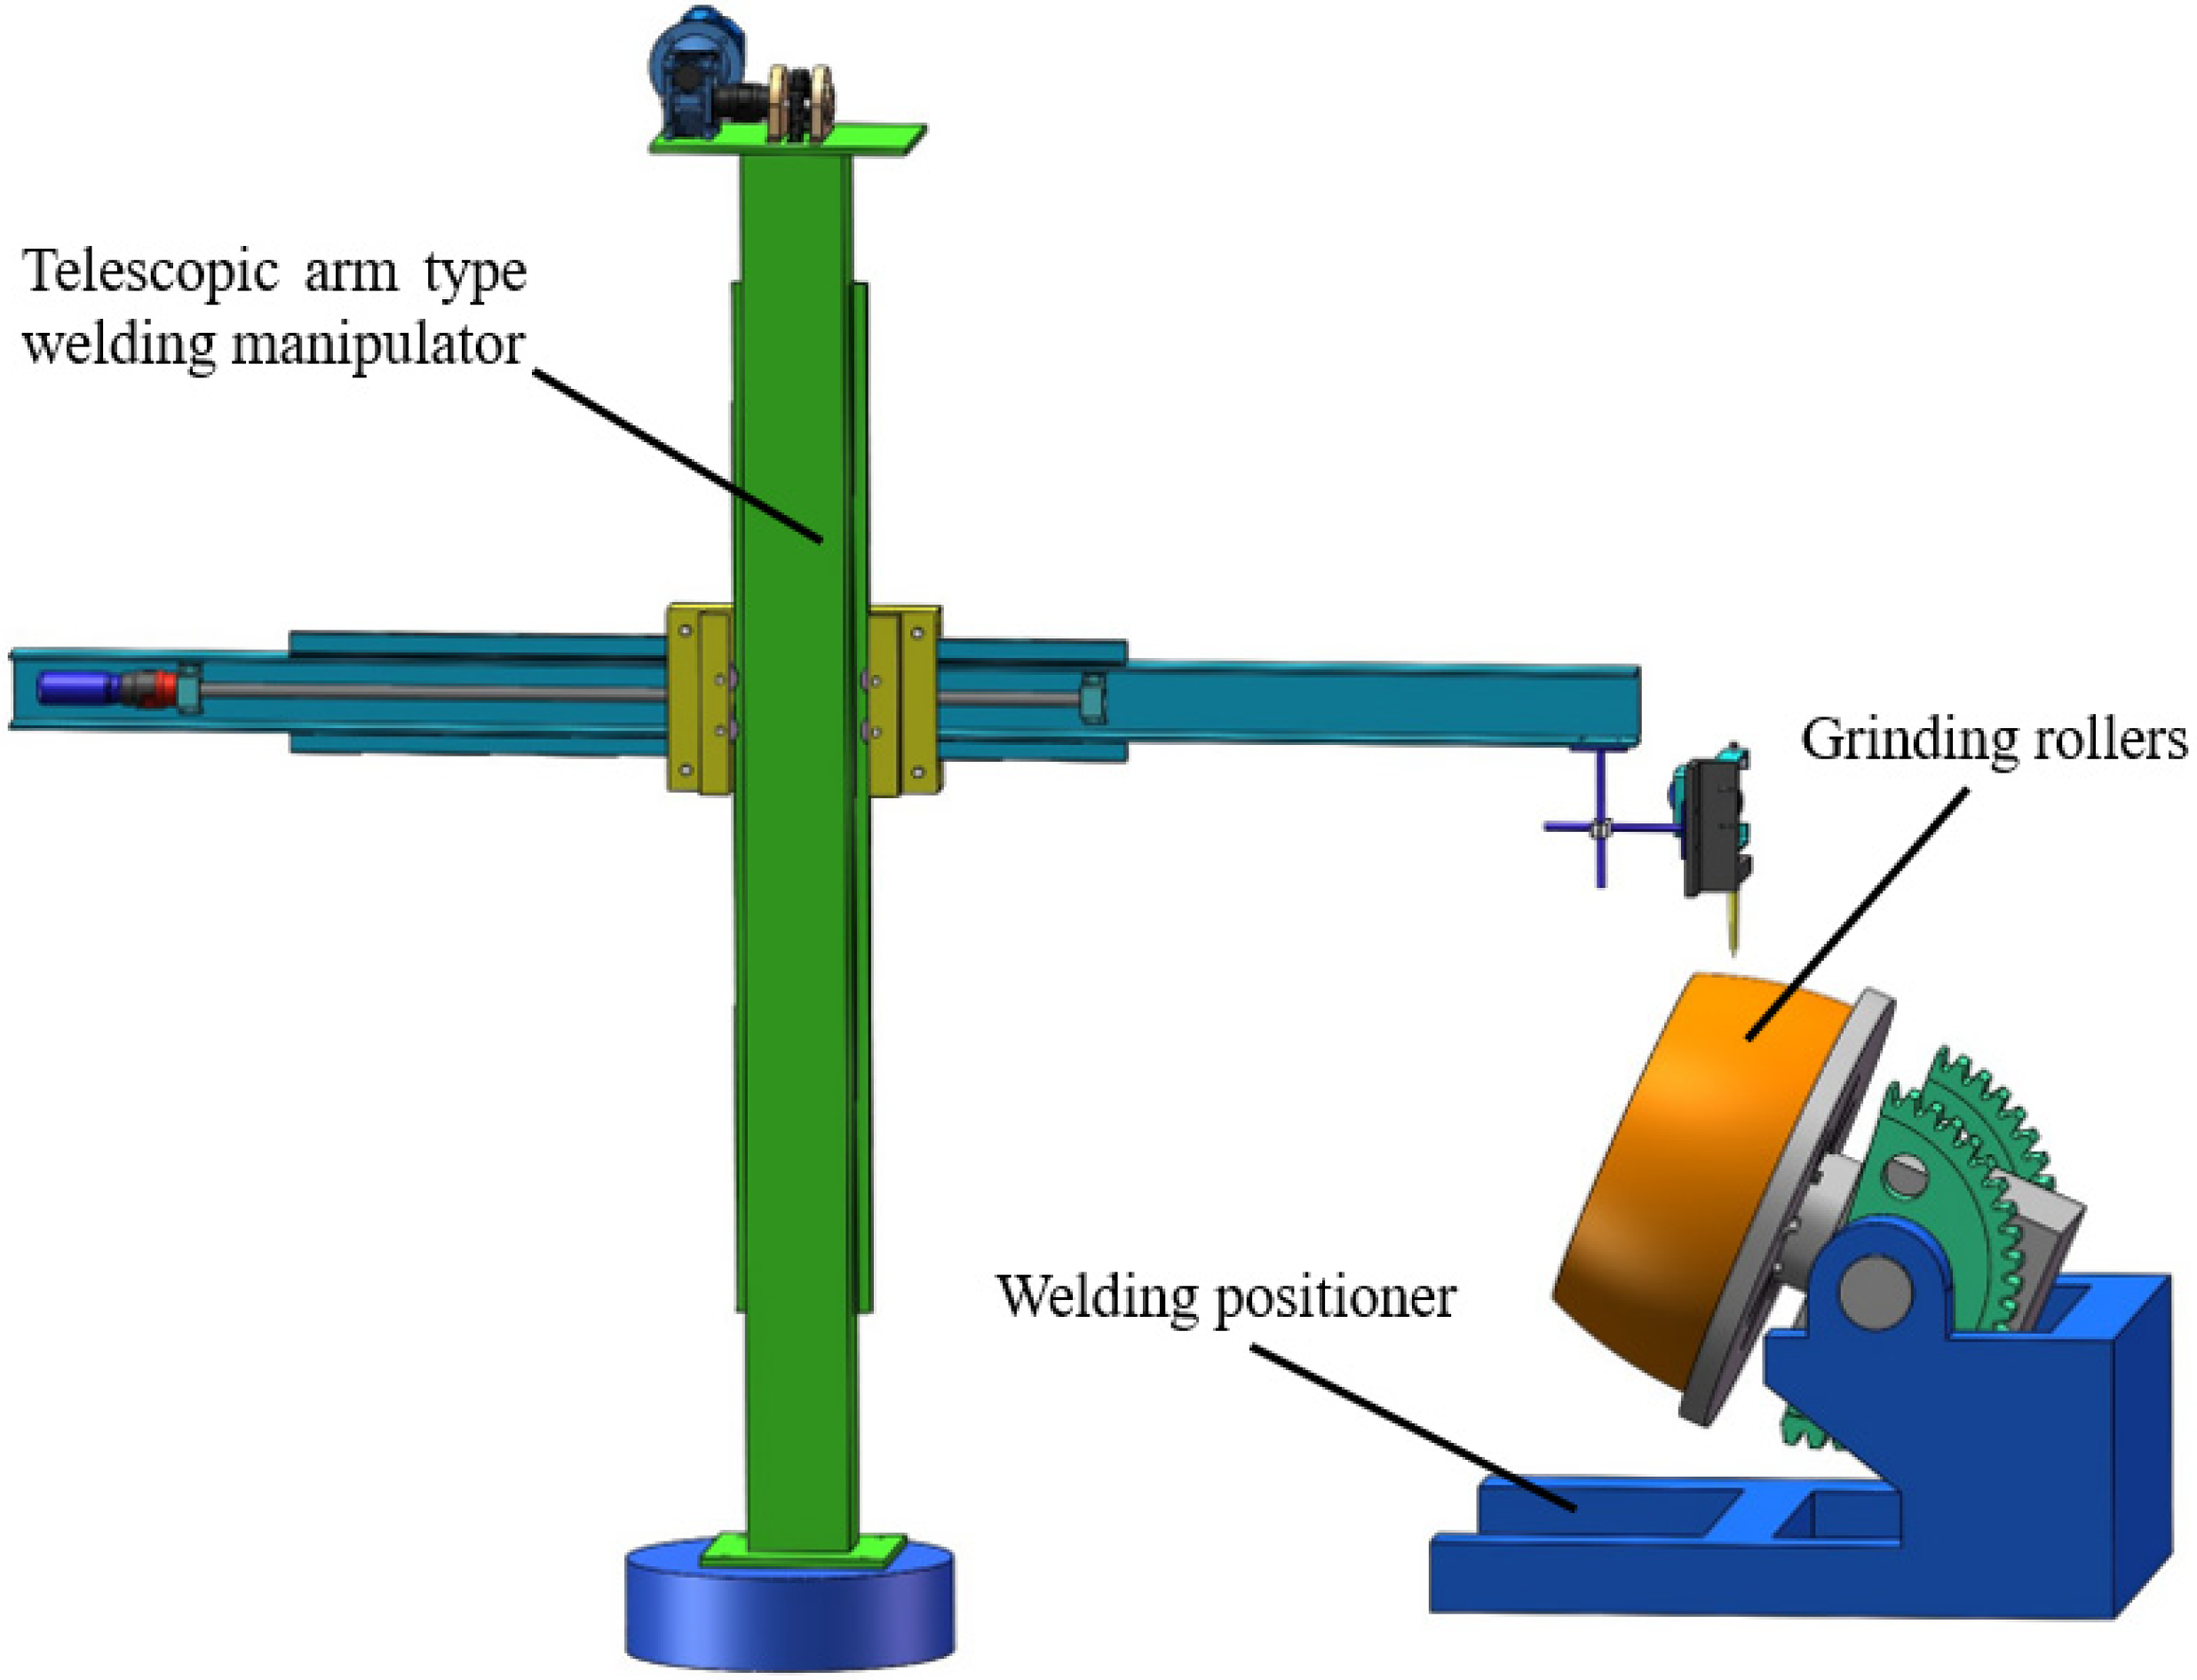
2.2. Experimental Equipment and Materials

The experiment adopts the open-arc surfacing process, the welding machine adopts a ZD5-1000 type open-arc power source, and the welding equipment is a telescopic arm welding manipulator. The base metal used in the experiment is a 45# steel plate, and the size of the steel plate is 650 mm × 300 mm × 15 mm. The welding material is high-chromium cast iron alloy flux-cored welding wire, and the welding wire grade is S-100Mo-C (the diameter of the welding wire is Φ2. 8 mm, and the manufacturer of the welding wire is Beijing Saiyi Technology, China.). The chemical compositions of the base metal and welding consumables are shown in Table 2. In the experiment, the length of each weld was uniformly 200 mm, and the interval between each weld was 30 mm.

2.3. Experimental Process

According to the design of the factor level, the experimental plan is generated by Design-Expert 11 software, and then the single-layer and single-pass surfacing experiment was carried out. The experimental process was as follows:
First, the steel plate was derusted and polished to remove impurities on the surface of the steel plate that may cause pores, weld flashes, slag inclusions and other factors that may affect the welding quality during the surfacing process. Then, open-arc surfacing equipment was used to perform single-layer single-pass surfacing on the flat plate. In the surfacing process, to prevent the residual heat remaining after the surfacing of the previous weld and the heat accumulation effect of multiple welds from affecting the formation of the weld, the temperature of each weld was detected by an infrared temperature measuring gun to ensure that each weld was surfaced at room temperature. After all the weld overlays were completed, each weld was separated and then cut in its middle to obtain the weld section. Then, an angle grinder was used to smooth the obtained welded seam section, and sandpaper with different mesh numbers was used on the grinding and polishing machine for further grinding. Finally, 4% nitric acid alcohol solution was used to etch the weld section. The obtained weld profile is shown in Figure 1. Vernier calipers were used to measure the bead height (H) and bead depth (h) of the weld, and then, the measured data were substituted into Formula (2) to calculate the dilution rate. The response values were entered into the experimental protocol table, as shown in Table 3.
D = h ( H + h ) × 100 %

3. Experimental Results and Analysis

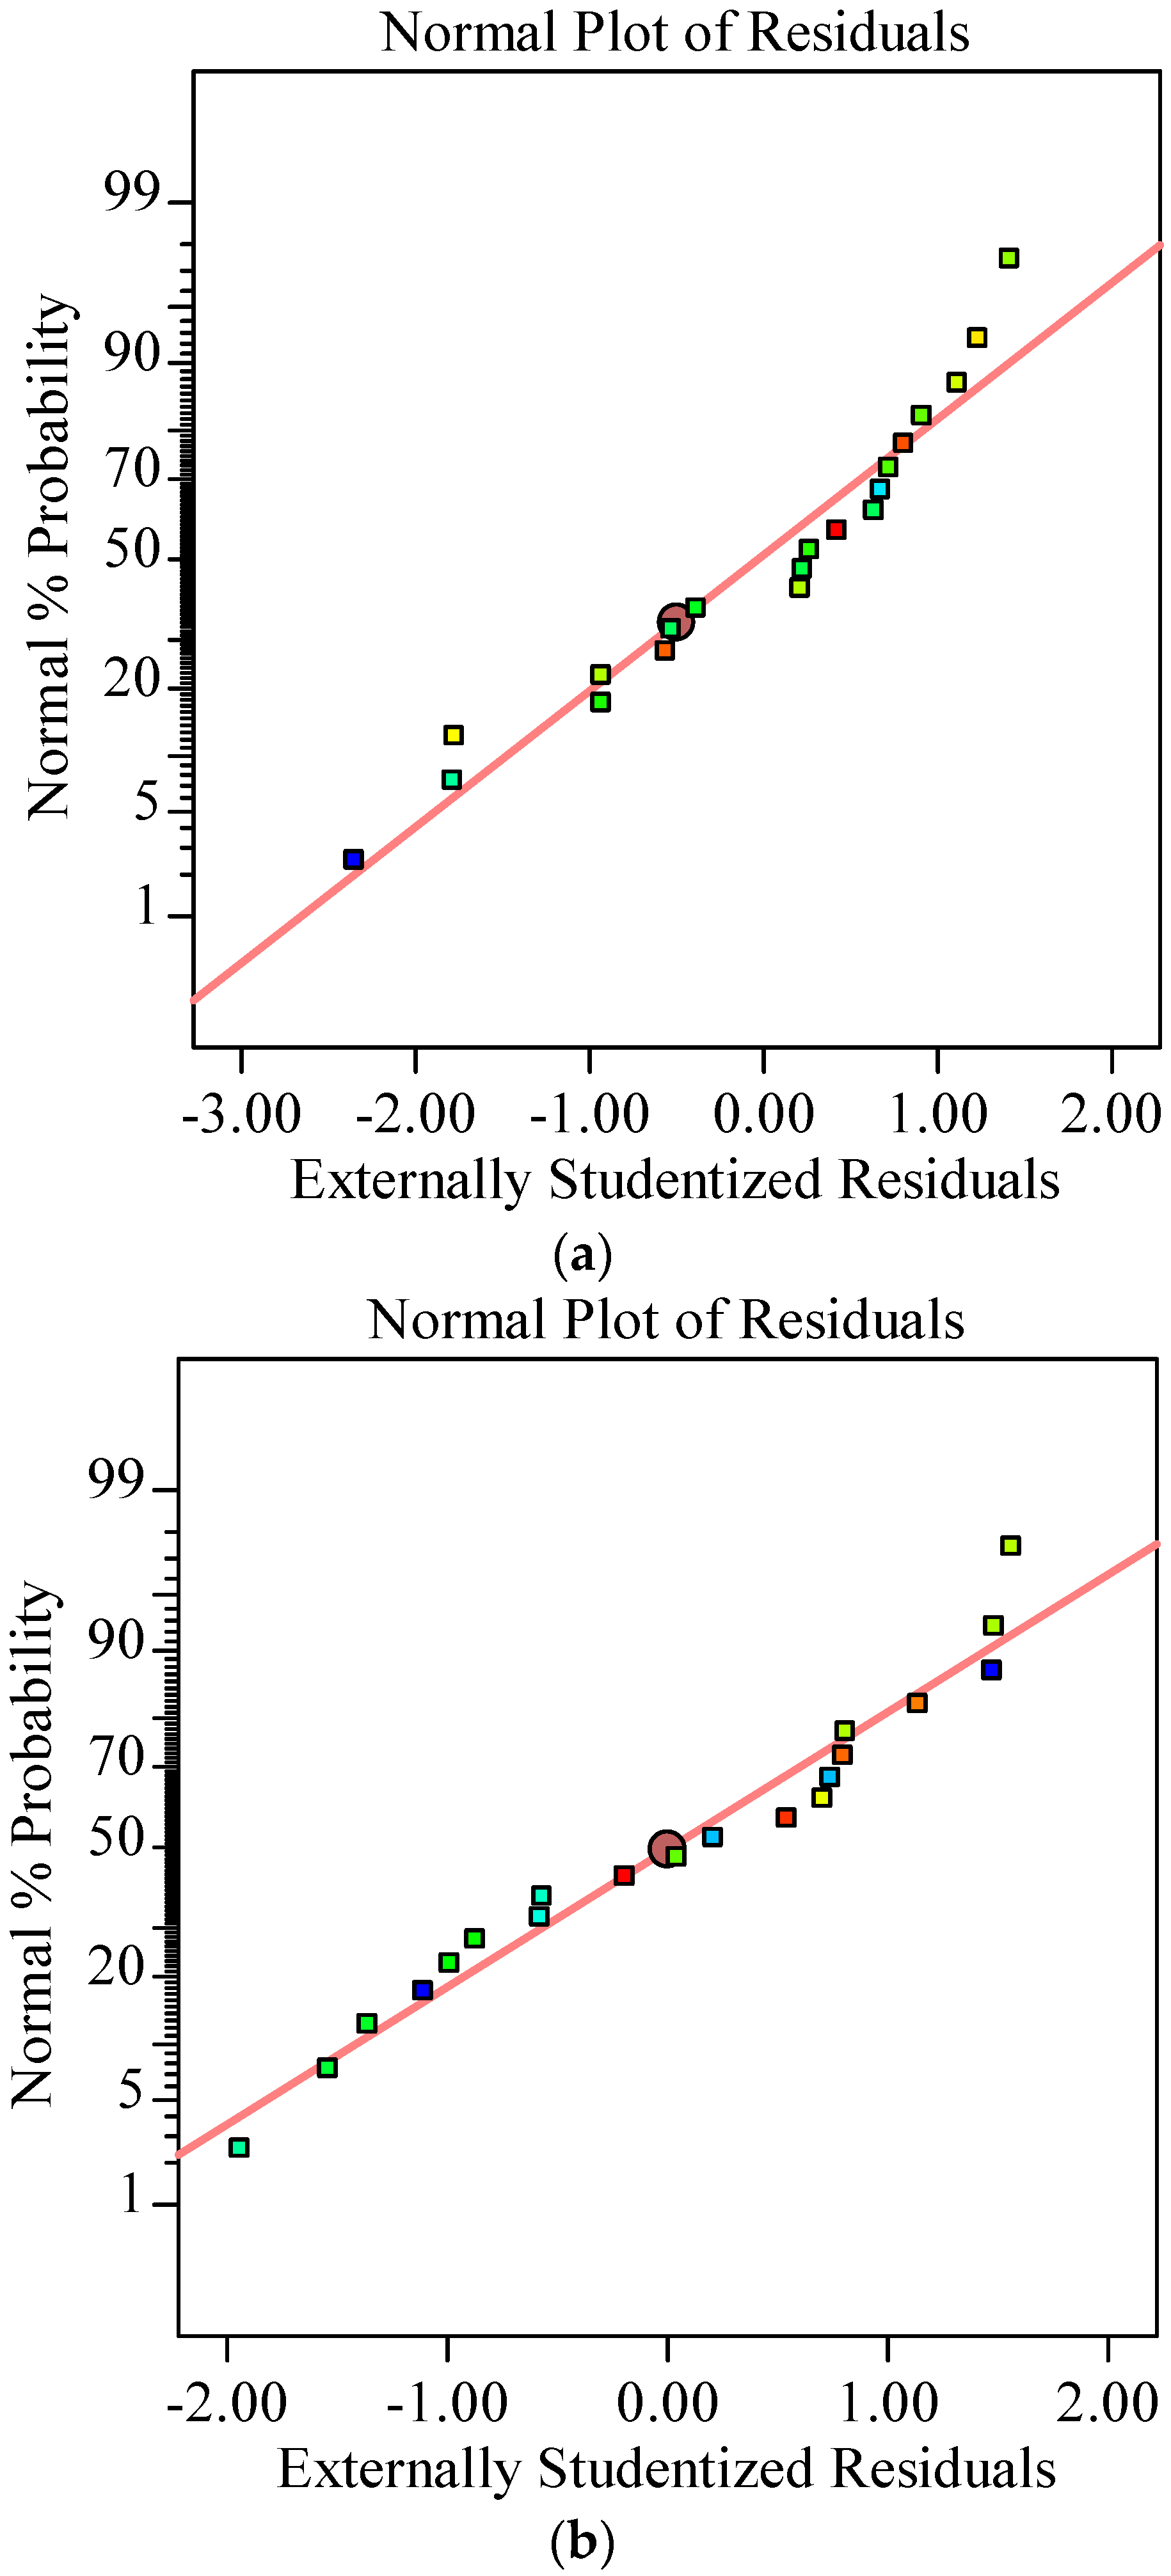
3.1. Mathematical Model Establishment and Fitting Result Analysis

The response surface method was used to establish a mathematical model that can predict the height and dilution rate of the surfacing layer. According to the factors I, Ve, and Vo selected in the experiment, the response equation can be expressed as
Y = f ( I , v e , v o )
The regression equation used to describe the corresponding faces of the three factors can be expressed as
D = β 0 + i = 1 3 β i X i + i = 1 3 β i i X i 2 + i = 1 , i < j 3 β i j X i X j + ε
where D is the dilution rate; Xi is the investigation factor; and β0, βi, βii, and βij are regression coefficients.
According to the experimental data in Table 3, a secondary regression response surface analysis was performed. In the dilution rate model, A, B, C, AC, and B2 were the significant influencing factors. The p values of AB, BC, A2, and C2 were 0.10, 0.14, 0.94, and 0.22, respectively, which are nonsignificant influencing factors, so were removed from the table to ensure the accuracy of the model; in addition, in the expression of the bead height model, A, B, C, AC, and B2 were found to be significant influencing factors, with p values of AB, BC, A2, and C2 are 0.59, 0.41, 0.12, and 0.09, respectively, making them nonsignificant influencing factors. To ensure the accuracy of the model, these factors were also removed from the model [22]. Thus, the coded value regression equations with the surfacing speed, surfacing voltage, and surfacing current as the variables, and the bead height and the dilution rate as the response values were obtained, namely,
h = 3.65 + 0.70 I 0.32 V o 0.39 V e + 0.22 I V e 0.32 V o 2        
D = 29.55 + 4.63 I + 2.30 V o + 1.30 V e 0.64 I V e + V o 2  
The real value Equation of the bead height and the dilution rate of the response value are
h = 60.45 0.02 I + 4.89 V o 1.59 V e + 0.003 I V e 0.08 V o 2
D = 272.41 + 0.79 I 36.42 V o + 14.31 V e 0.03 I V e + 0.59 V o 2      
Table 4 shows that the model F value of 18.80 implies that the model is significant. There is only a 0.01% chance that an F value this large could occur due to noise. A p value less than 0.0500 indicates that the model terms are significant [23]. The lack of fit F value of 0.86 implies that the lack of fit is not significant relative to the pure error. There is a 60.37% chance that a lack of fit F value this large could occur due to noise. A nonsignificant lack of fit is good [24]. The predicted R² of 0.7196 is in reasonable agreement with the adjusted R² of 0.8241. The difference is less than 0.2. ‘Adeq Precision’ measures the signal to noise ratio. A ratio of greater than 4 is desirable. A ratio of 14.566 indicates an adequate signal. This model can be used to navigate the design space.
As seen from Table 5, the model F value of 29.79 implies that the model is significant. There is only a 0.01% chance that an F value this large could occur due to noise. A p value of less than 0.0500 indicates that the model terms are significant [23]. The lack of fit F value of 1.6 implies that the lack of fit is not significant relative to the pure error. There is a 31.43% chance that a lack of fit F value this large could occur due to noise. A nonsignificant lack of fit is good [24]. The predicted R² of 0.7910 is in reasonable agreement with the adjusted R² of 0.8834. The difference is less than 0.2. ‘Adeq Precision’ measures the signal to noise ratio. A ratio of greater than 4 is desirable. A ratio of 20.070 indicates an adequate signal. This model can be used to navigate the design space.
Figure 2 shows the normal probability plot of residuals for the dilution rate and bead-height model. The figure shows that the residual distributions of the two models are on both sides of the straight line, close to the straight line, indicating that the regression equation model fits well. The error distribution is relatively uniform, there is no singularity with large deviation, and the model can accurately predict the response value [25].

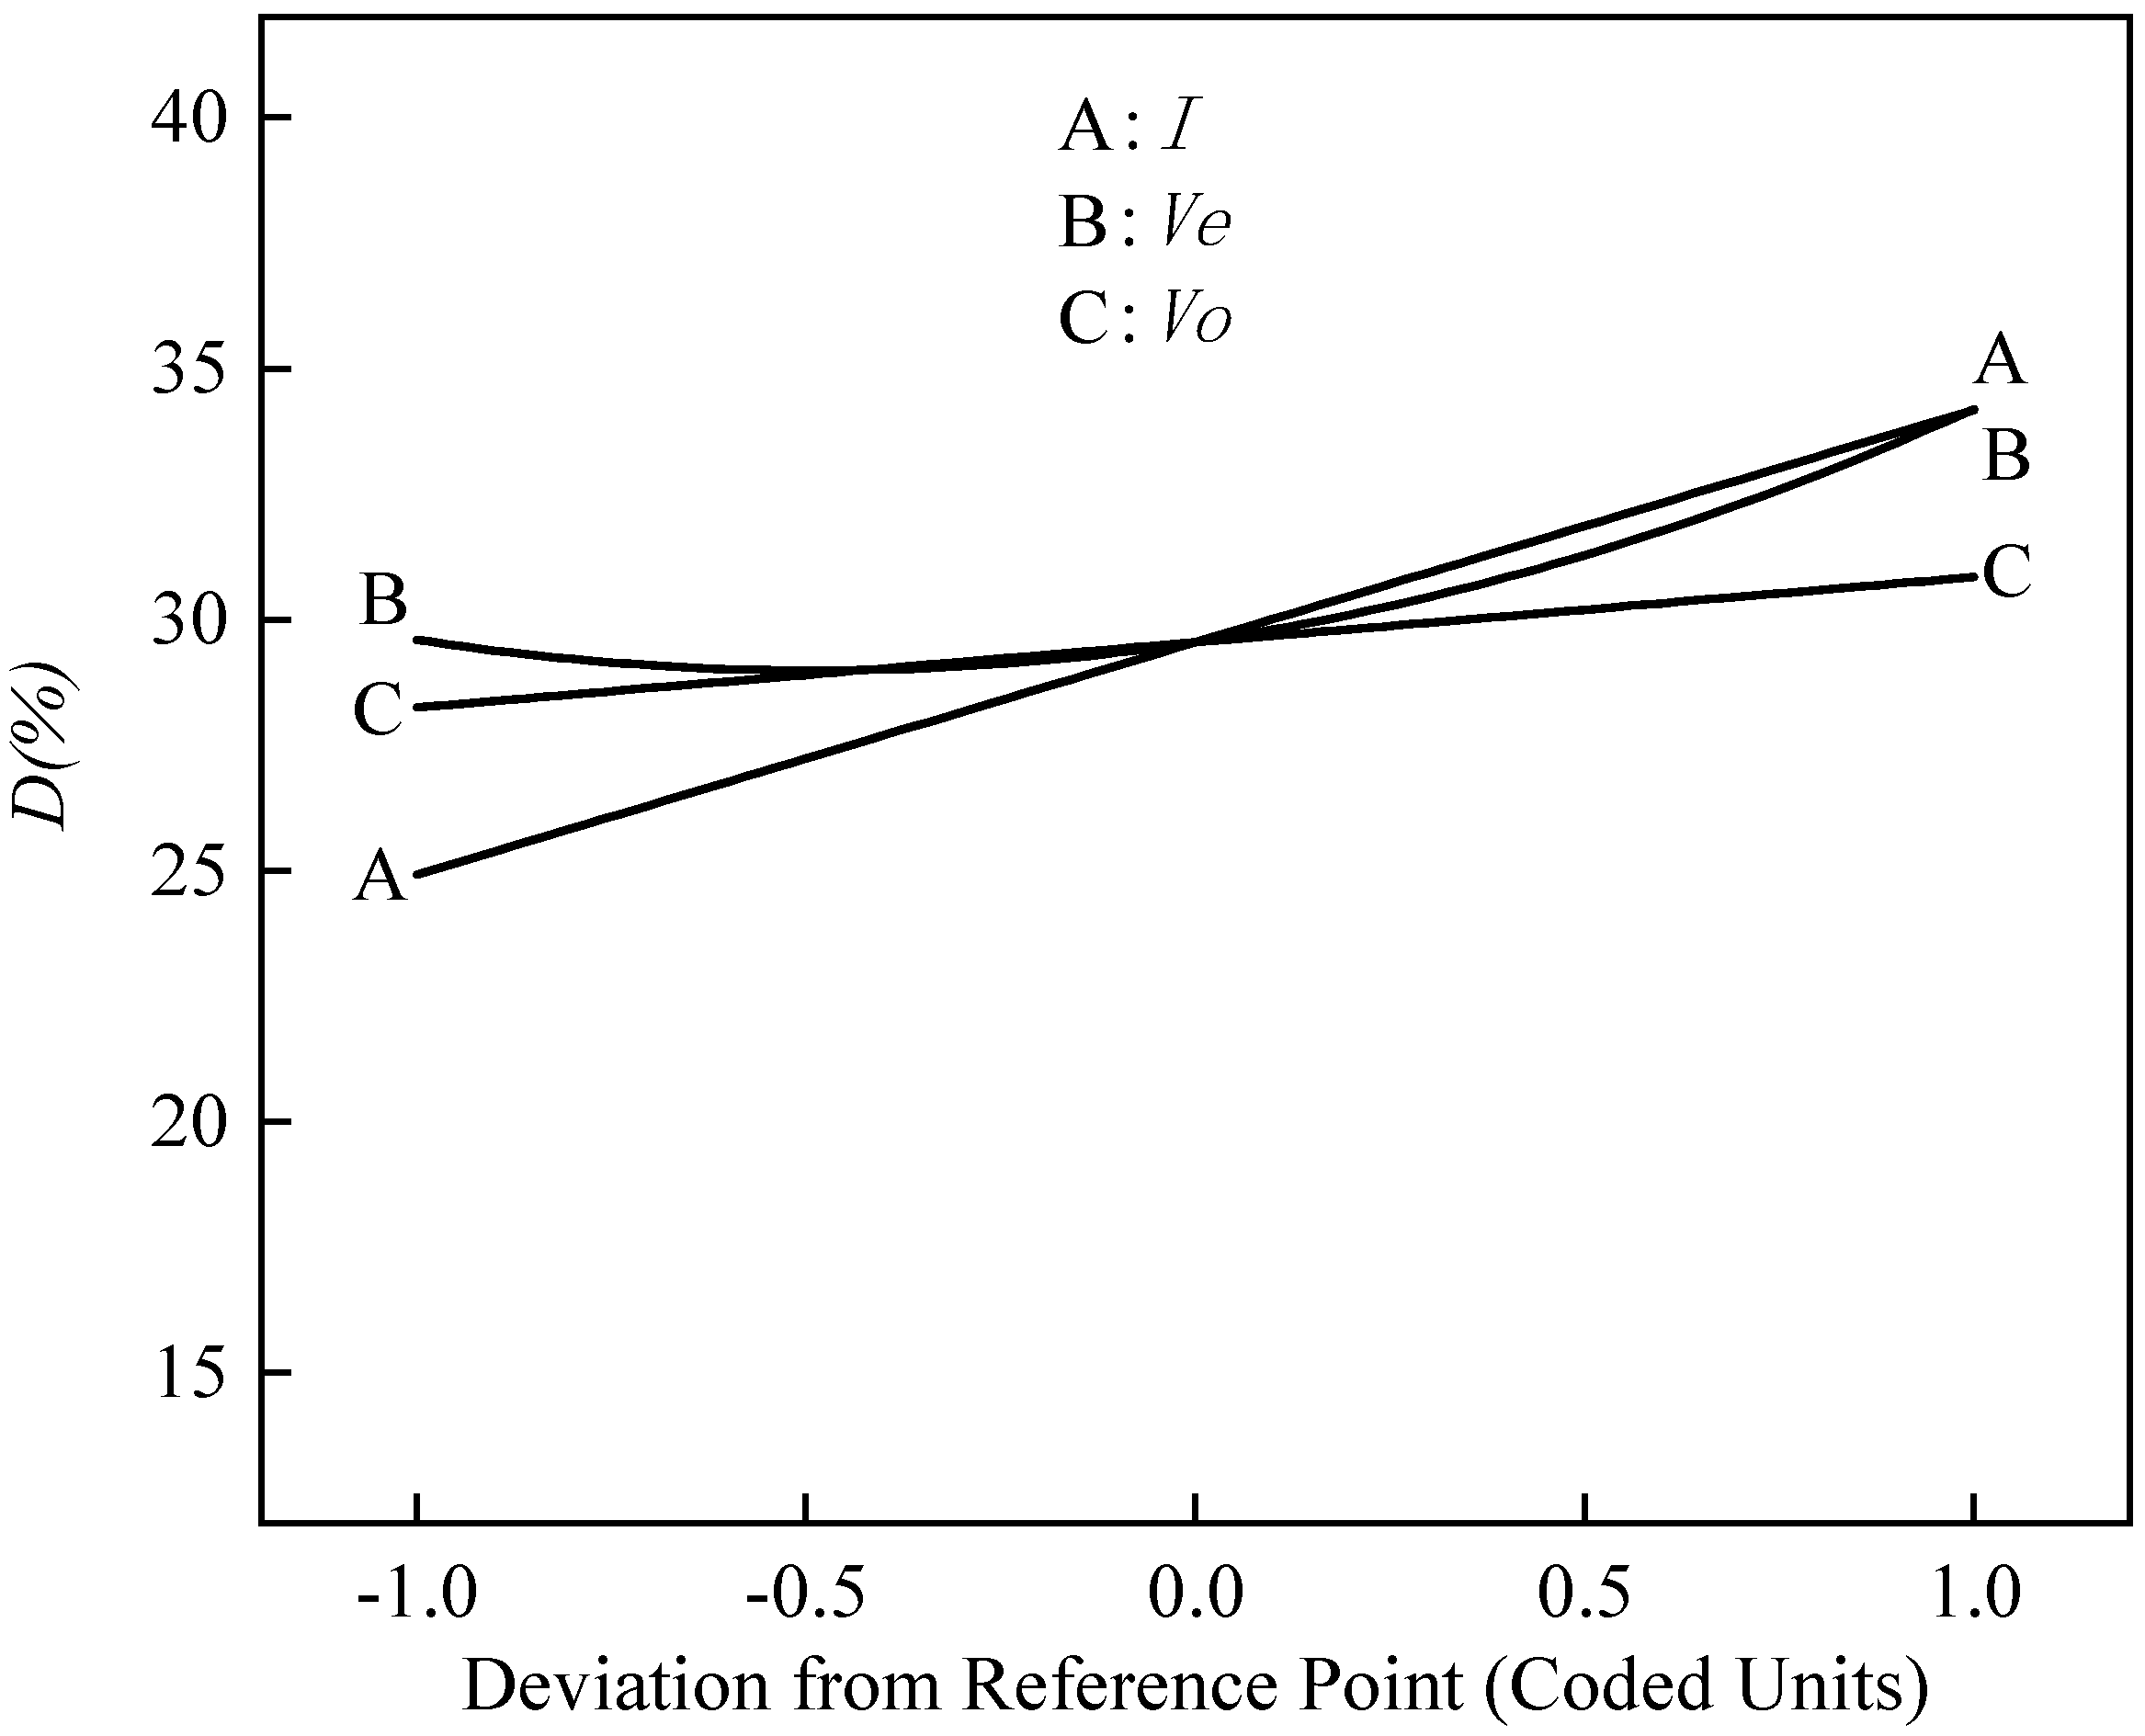
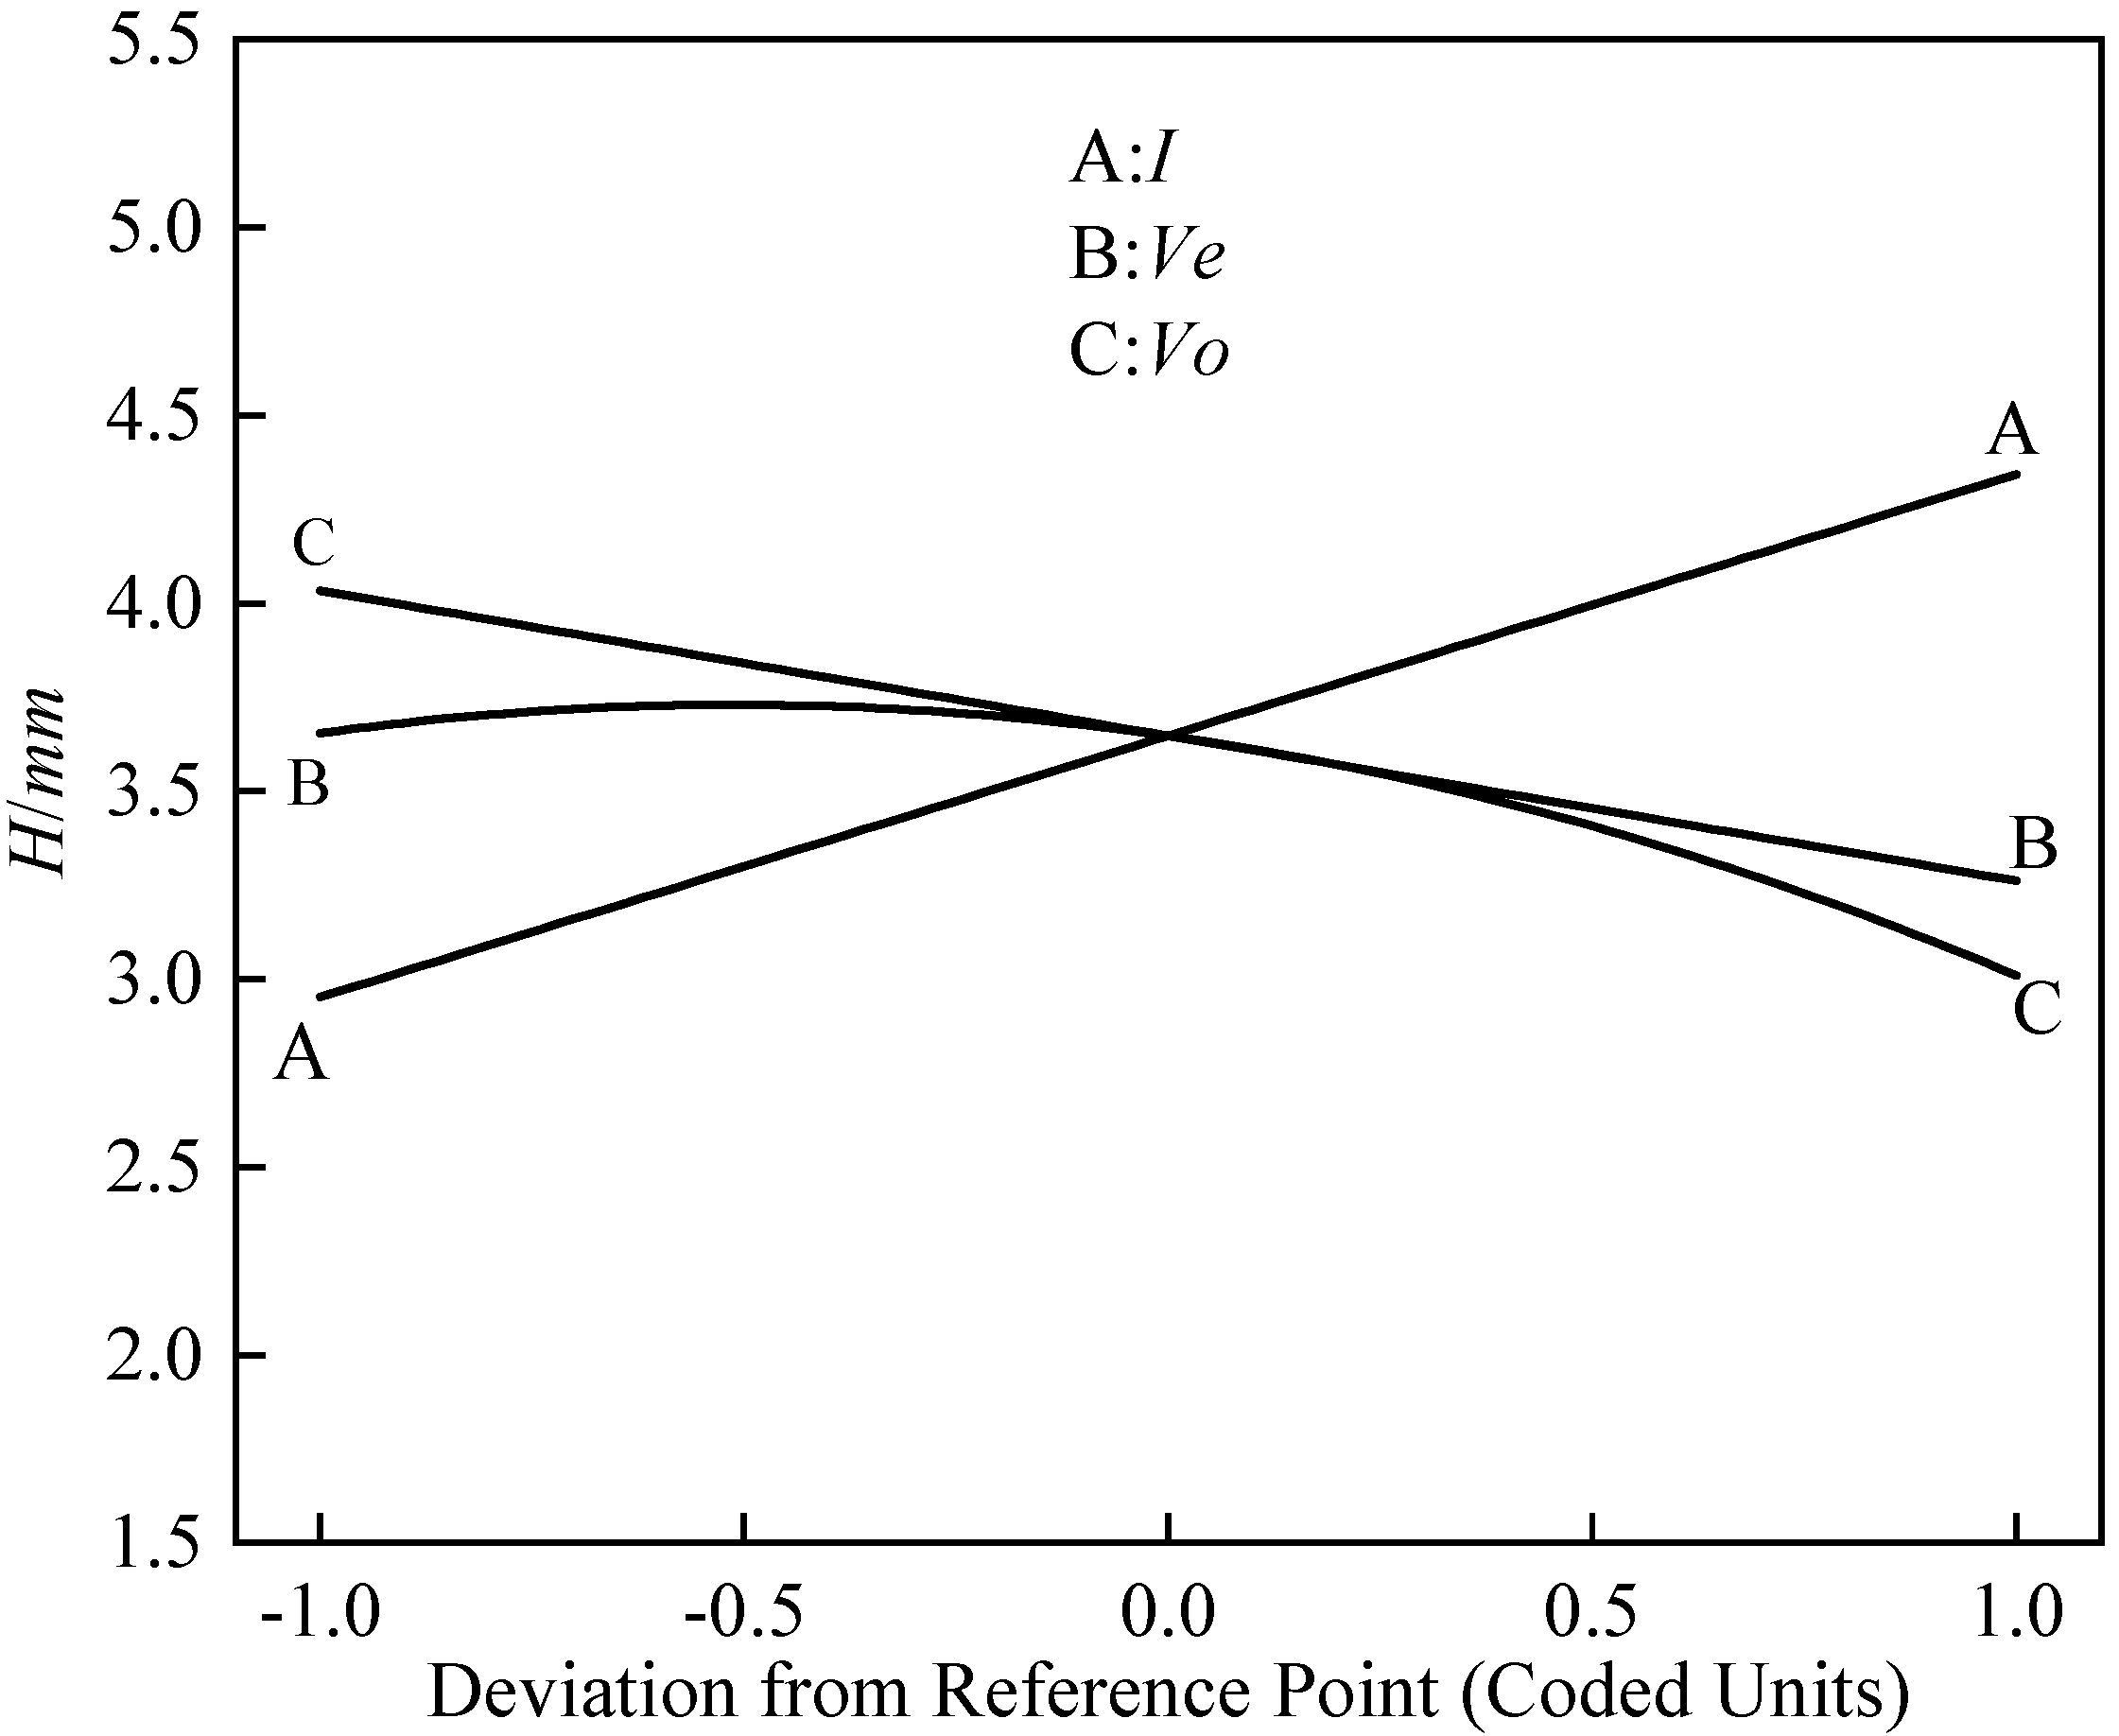
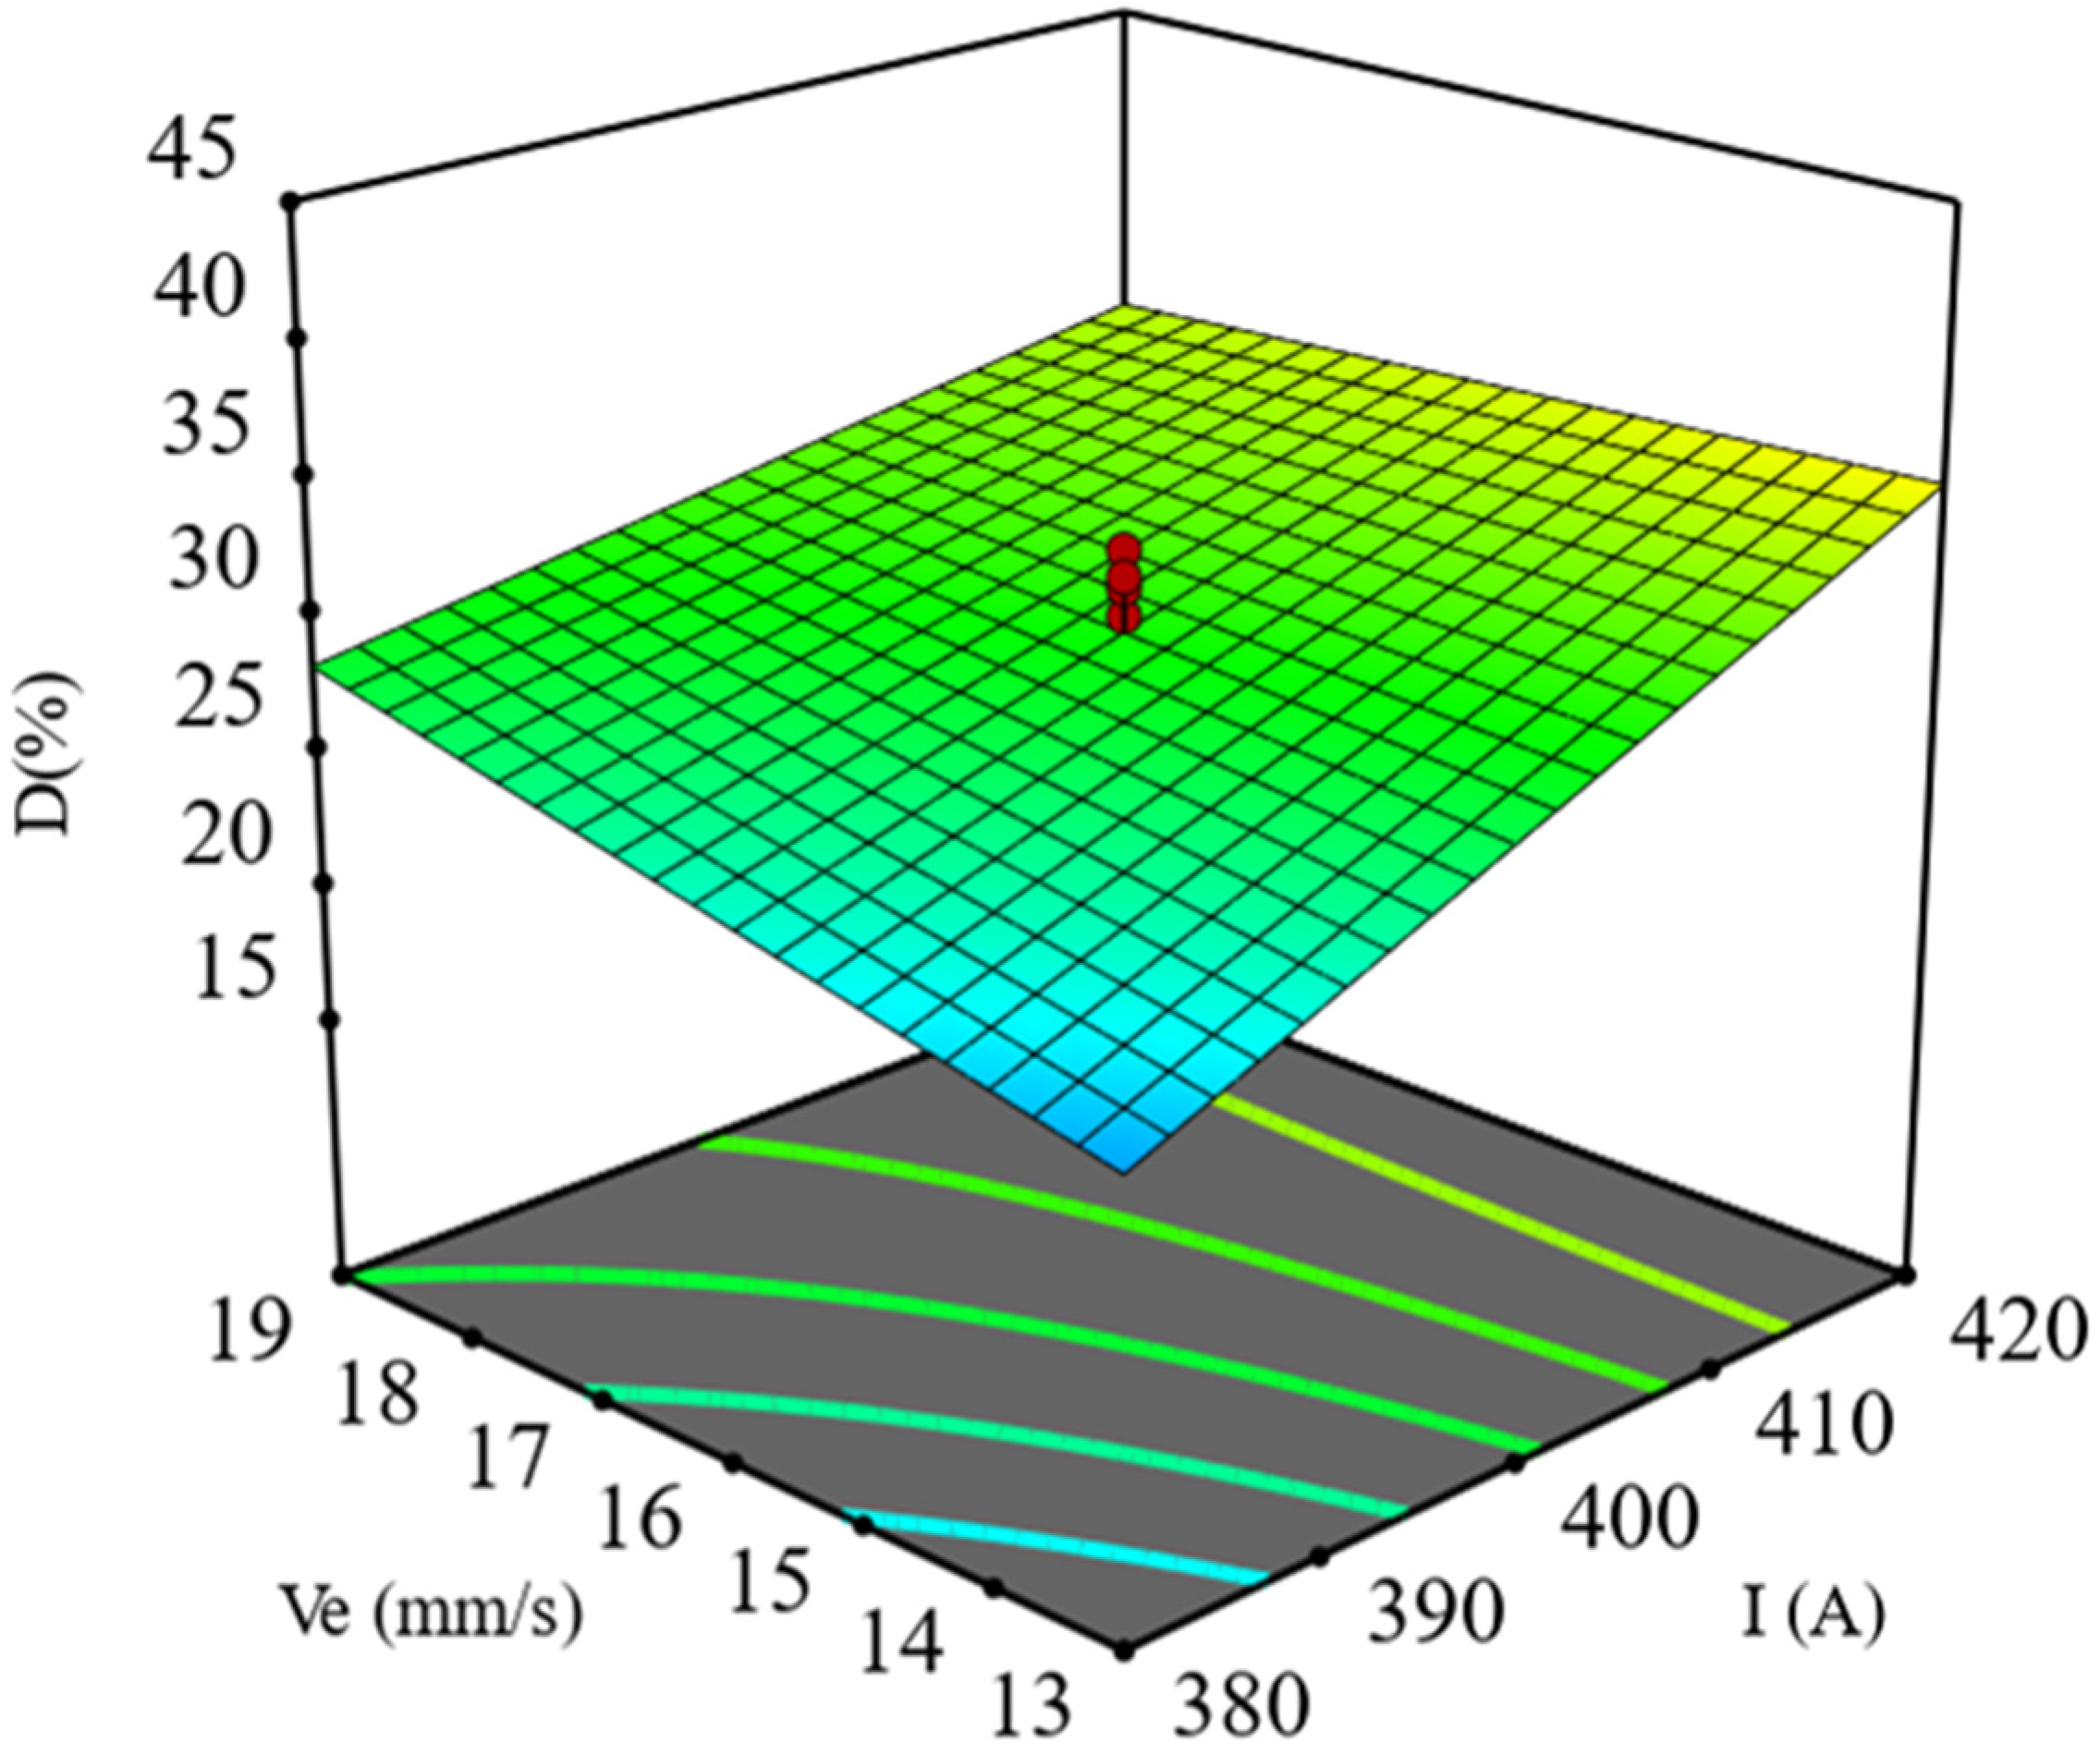
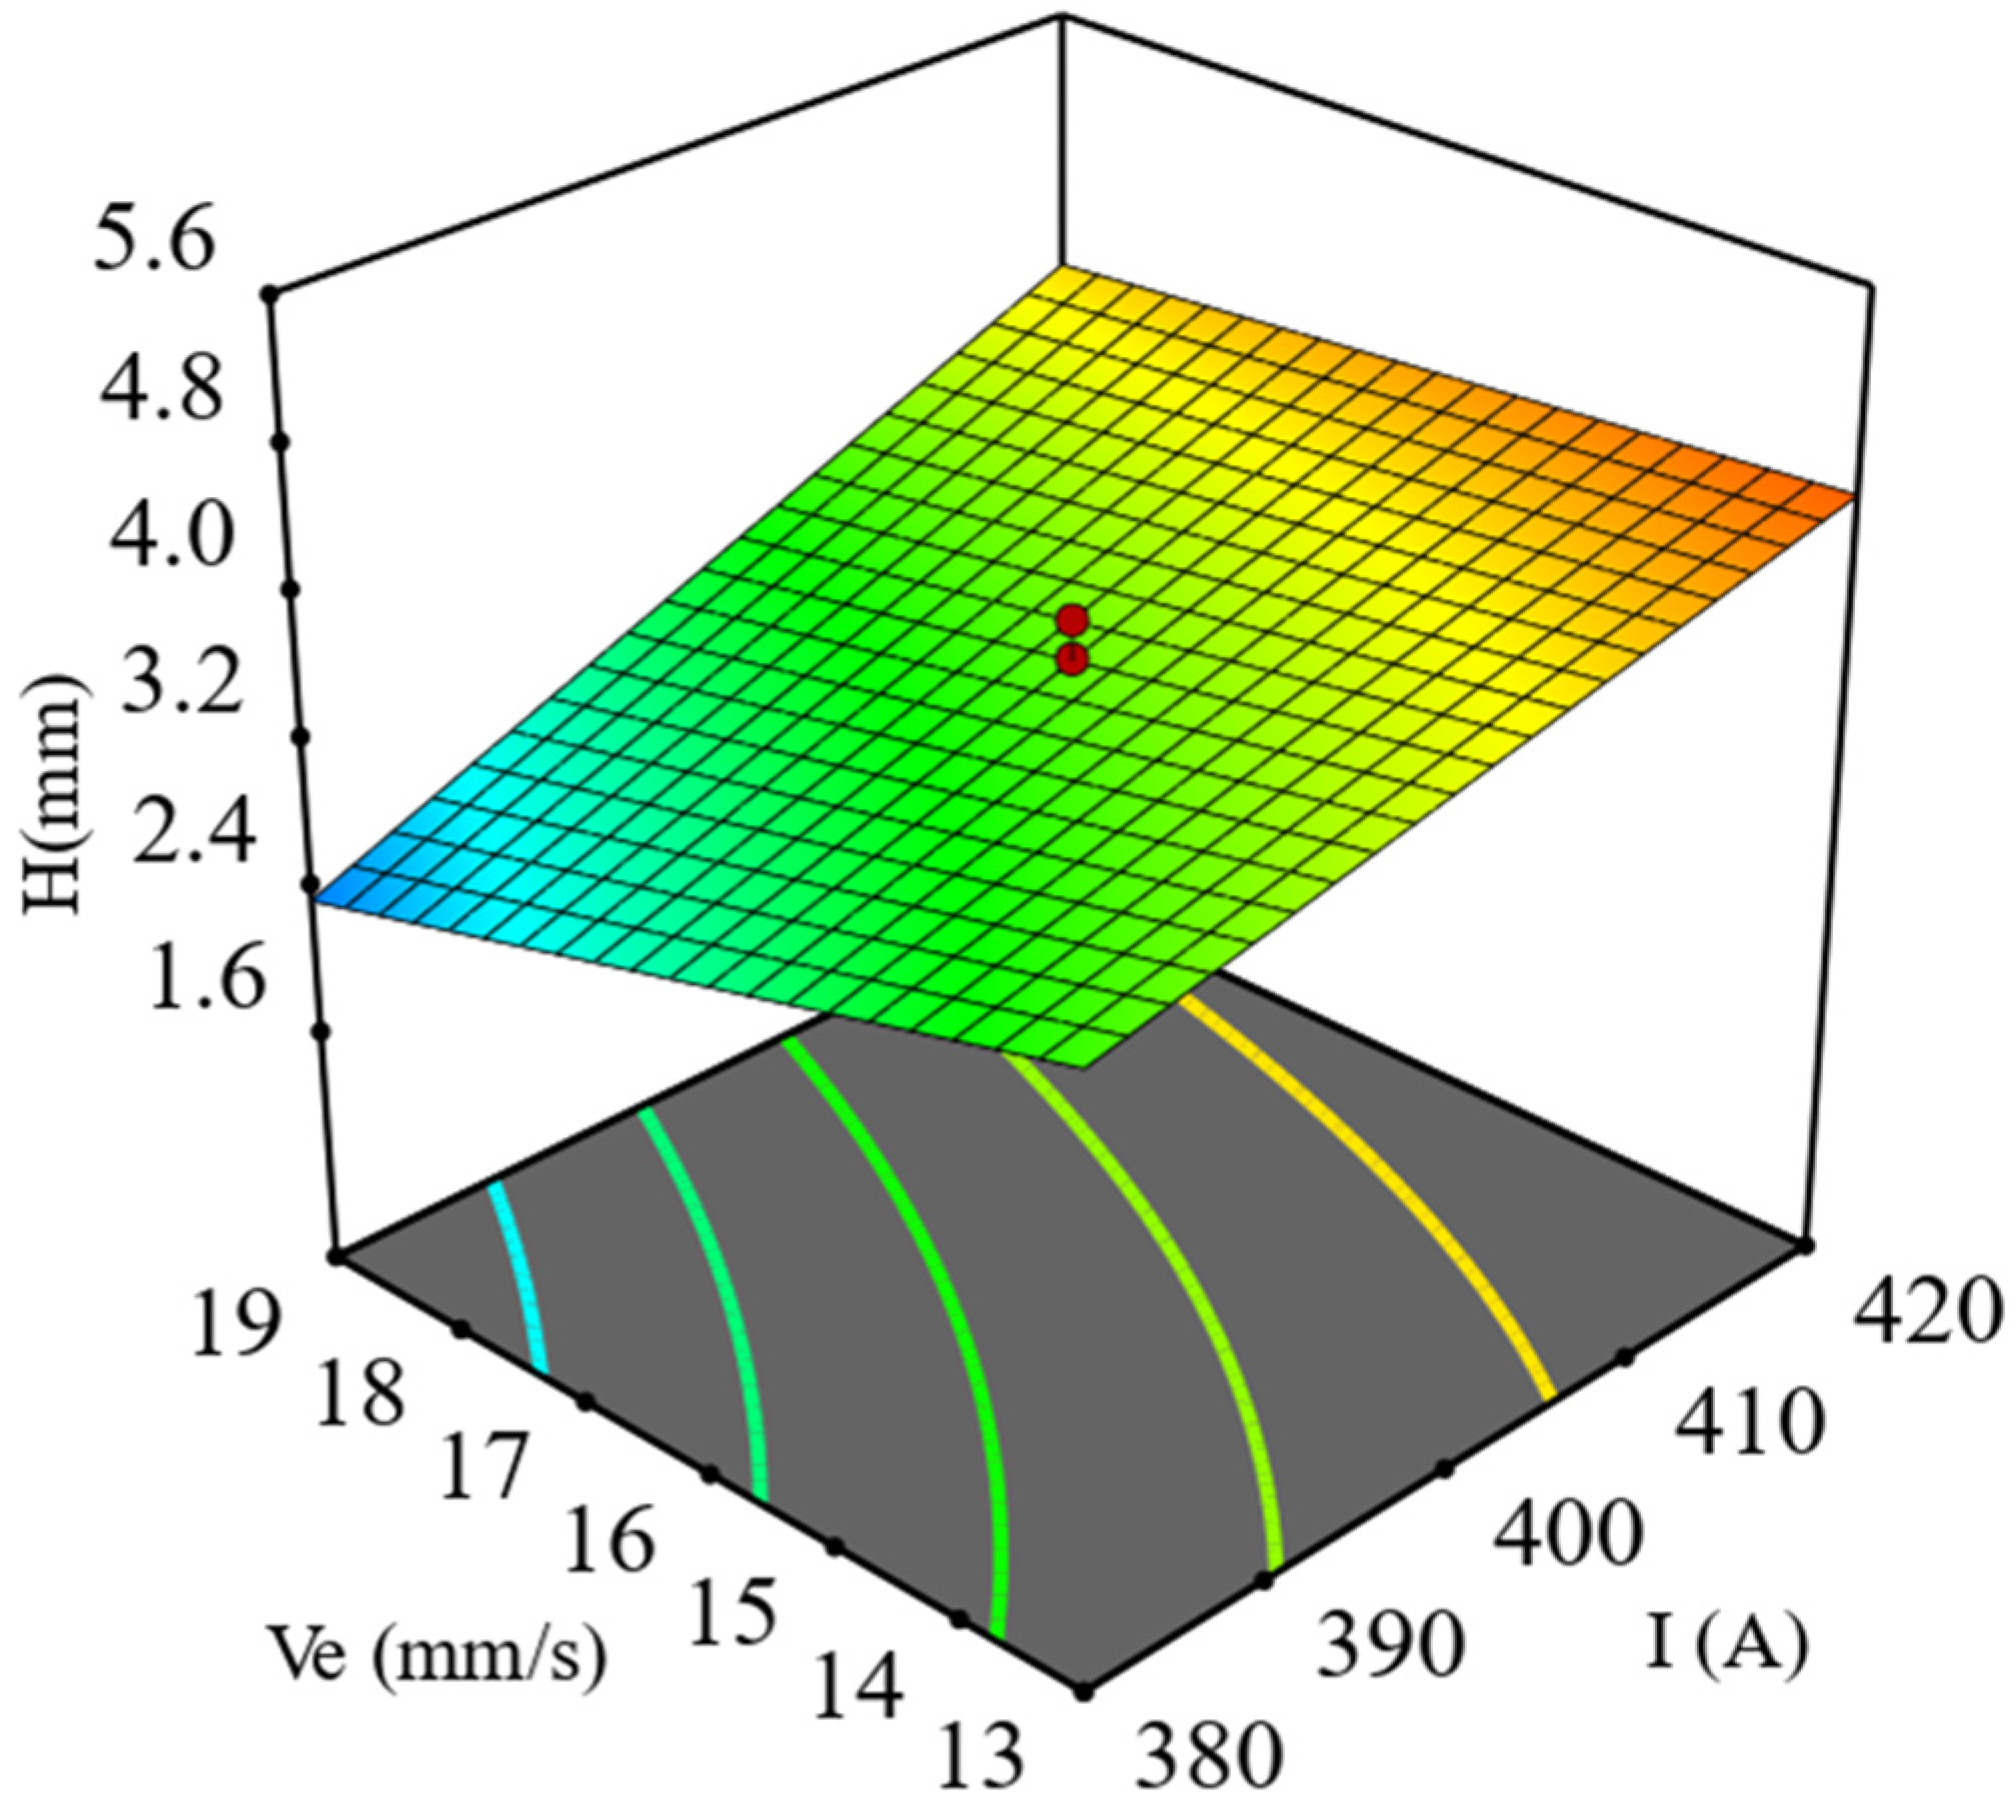
3.2. Influence of Surfacing Parameters on the Response Value

Figure 3 shows the dilution rate perturbation graph, which reflects the influence of various response factors (surfacing current, surfacing voltage, and surfacing welding speed) on the stack dilution rate. Combining the F experiment in the variance analysis results of the regression model of the dilution rate in Table 4, the order of the magnitude of the influence of each response factor on each response value is I > Ve > Vo; that is, the effect of the surfacing current on the dilution rate is the second largest surfacing speed. The impact of the surfacing voltage is minimal. Figure 3 shows that the dilution rate of the surfacing increases with increasing surfacing current, voltage, and speed. This is because the build-up welding current increases, which leads to an increase in the heat input of welding, which increases the amount of melted base metal and increases the dilution rate. Similarly, the increase in the surfacing voltage will also increase the welding input energy, but the voltage value change range is small; thus, the dilution rate does not change significantly. The surfacing speed has a dual effect on the dilution rate. On the one hand, an increase in the surfacing speed reduces the welding heat input and the dilution rate; on the other hand, the increase in the surfacing speed reduces the amount of welding wire deposited per unit time and change the dilution rate. Combining the two effects makes the effect of the surfacing welding speed on the dilution rate insignificant [25]. Figure 4 shows a three-dimensional response surface diagram of the influence of the interaction between the surfacing current and surfacing welding speed on the dilution rate. The dilution rate increases with increasing surfacing welding current and surfacing welding speed, which is consistent with the variation in the dilution rate perturbation graph [12].
Figure 5 shows a diagram of the high residual perturbation of the welding seam, which reflects the influence rule of each response factor (surfacing current, surfacing voltage, and surfacing speed) on the heap dilution rate. The F experiment in the regression model variance analysis results of the dilution rate in Table 4 shows that the order of the influence of each response factor on each response value is I > Ve > Vo; that is, the surfacing current has the greatest influence on the weld residual height, followed by the surfacing speed, and the surfacing voltage has the least influence. Figure 4 shows that the weld residual height increases with increasing surfacing current. This is because the increase in the surfacing current leads to an increase in the welding line energy, so that the amount of welding wire melted per unit time increases, and the weld residual height increases. The weld residual height decreases with increasing surfacing speed because the amount of wire welded per unit time decreases with increasing surfacing speed, so the weld residual height decreases. When the surfacing voltage increases, the weld residual height decreases, but not significantly [25]. Figure 6 shows the response surface diagram of the influence of the interaction of the surfacing current and surfacing welding speed on bead height. The figure shows that the bead height increases with an increase in the surfacing current, and decreases with an increase in the surfacing speed, which is the same as the change law of the bead height perturbation diagram [12].

3.3. Optimization of the Surfacing Welding Parameters and Experimental Verification

The wear resistance of the high-chromium cast iron alloy surfacing layer is related not only to the composition of carbides in the surfacing layer but also to the dilution rate and weld formation, which have an important influence on the performance of the surfacing layer. In the surfacing repair of grinding rollers, the dilution rate must be as small as possible. At the same time, there are also requirements for the stacking height of the weld, and the surfacing current and voltage must also be controlled within a certain range. For the surfacing speed, considering the surfacing efficiency, larger values are better. Therefore, it is of great significance to propose the optimal combination of surfacing current, surfacing voltage and surfacing speed to ensure the repair quality of the grinding roller. The parameter optimization function of Design-Expert 11 software was used to optimize the parameters. The surfacing current and surfacing voltage were set to “in range”, the surfacing speed to “Maximize”, the dilution rate to “minimize”, the residual height to “target→3.7” [26]. Twenty-two sets of solutions were solved. Here, a group of parameters with the highest satisfaction (surfacing current of 399 A, surfacing voltage of 31 V, surfacing speed of 16 mm/s, predicted dilution rate of 28.782, and predicted residual height 3. 7 mm) were selected for the experiment. The experimental results and errors are shown in Table 6. Both the experimental value and the model predicted value are less than 5%, indicating that the model prediction is more accurate and that the model is reliable.

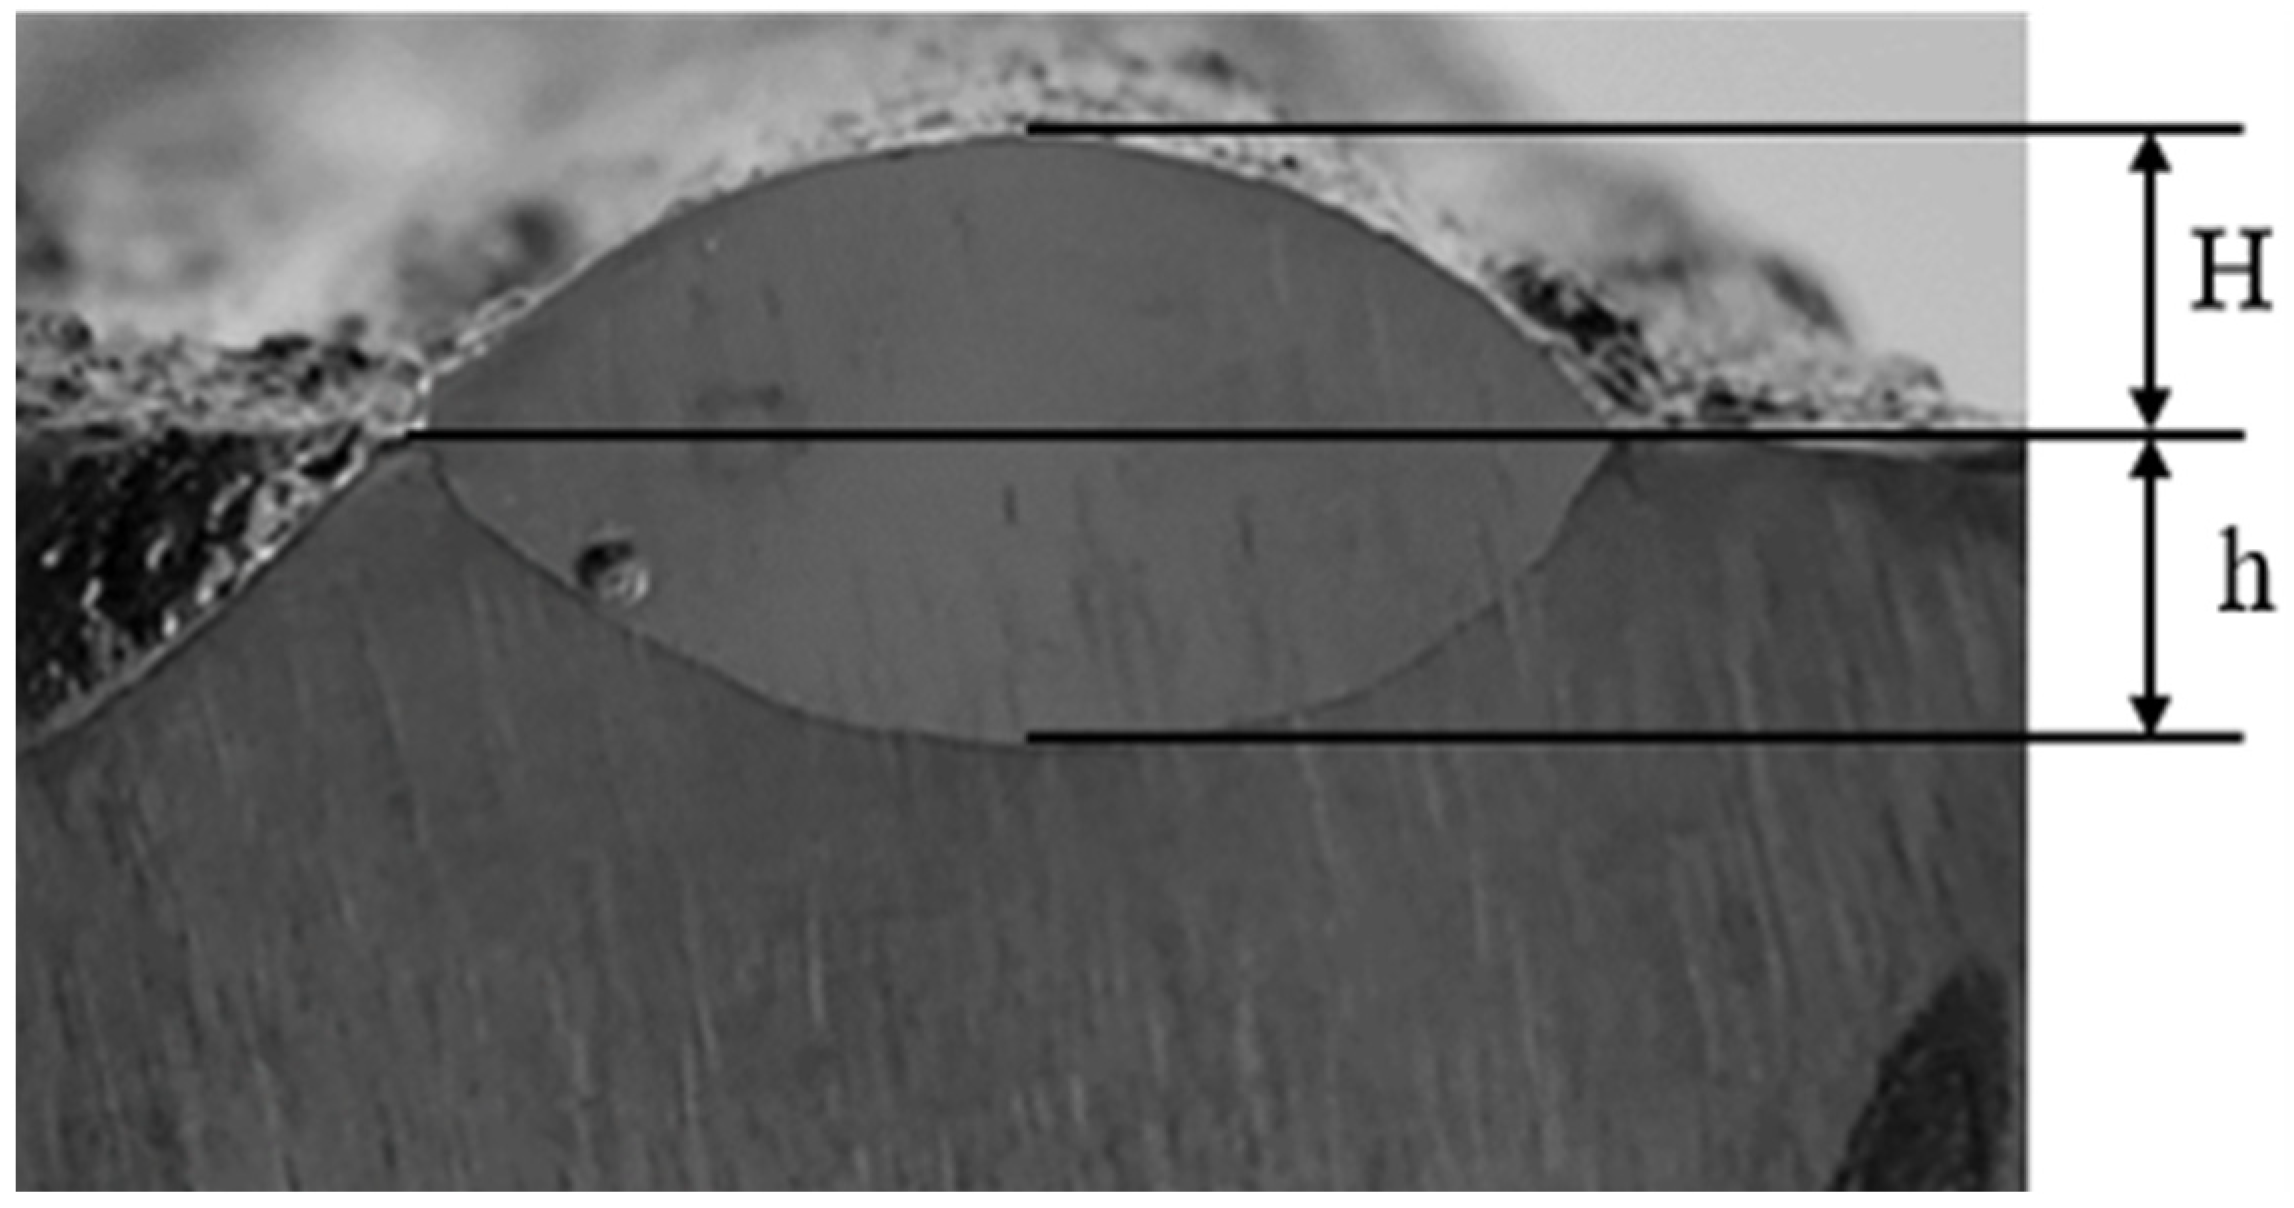
3.4. Roller Repair Quality Test

To verify the optimized surfacing process parameters, this study carried out a grinding roller surfacing repair experiment. The surfacing equipment used in this experiment consists of a telescopic arm-welding manipulator and a welding positioner. As shown in Figure 7, the repaired grinding roller is an HP843 coal mill grinding roller.
The welds on the surface of repaired grinding rollers are immaculate, and there are no welding defects such as slag inclusions or weld flashes, as shown in Figure 8. Moreover, longitudinal cracks are distributed on the surface of the surfacing layer. This kind of crack is different from surfacing cracks that affect the performance of the surfacing layer. It can play a role in releasing stress and preventing the grinding roller from being affected by the internal stress of the surfacing layer during the working process. The hardness of the surfacing layer on the surface of a grinding roller is also an important indicator used to measure the repair quality of the grinding roller. To verify the reliability of the optimized results, the hardness of the grinding roller surface was tested. To measure the hardness value more accurately and to better reflect the real hardness of the surfacing layer, multiple locations were selected. At each location, multiple points were selected for measurement, and the average value was obtained. Before testing the hardness, the test points were ground flat with an angle grinder and then measured. This measurement uses a portable Blok hardness tester, and the measurement results are shown in Table 7. The measurement results show that the average value of the three measured hardness values is greater than an HRC of 56, indicating that the surface of the grinding roller has better wear resistance [27]. The surfacing repair test of the grinding roller verifies the feasibility of the optimized process parameters, and illustrates that the mathematical model of the surfacing process parameters and the dilution rate and the weld morphology established by the experimental design based on the response surface method can be used for surfacing welding of the grinding roller. The repair has important guiding significance.

4. Conclusions

In this paper, a mathematical model of the surfacing parameters, the weld height and the dilution rate was obtained using the response surface test design, and the reliability of the model prediction was verified by a variance analysis and the surfacing test. The surfacing process parameters obtained by model optimization were a surfacing current of 399 A, a surfacing voltage of 31 V, and a surfacing speed of 16 mm/s, and experimental verification was carried out. The verification results show that the error between the model prediction value and the data measured by the test was less than 5%. The grinding roller surfacing repair test was carried out with the optimized process parameters. The weld seam of the surfacing layer on the surface of the grinding roller after repair was immaculate, and there were no welding defects that would affect the performance of the surfacing layer. The hardness of the grinding roller surface had an HRC of greater than 56, with good wear resistance. This shows that the model can be used to guide the surfacing repair of grinding rollers, which is of great significance to ensure the quality of the surfacing repair of grinding rollers.

Author Contributions

J.W. conceptualized the work; M.W. and J.H. executed the experiments, interpreted the data, and prepared the manuscript. Y.W. curated the data. C.R. performed formal analysis, software operation, validation, and data curation. All authors have read and agreed to the published version of the manuscript.

Funding

Not applicable.

Institutional Review Board Statement

Not applicable.

Informed Consent Statement

Not applicable.

Data Availability Statement

Not applicable.

Conflicts of Interest

The authors declare no conflict of interest.

References

  1. Xie, L. Research and Prospects of Energy Consumption of Thermal Power Generation in China. Comm. Pow. Techol. 2016, 33, 165–166. [Google Scholar]
  2. Mu, X.R.; Ma, J.P.; Liu, J.F.; Bai, B.; Duan, B.; Nie, Z.H.; Song, S.X. Manufacturing Technology of Surfacing Welding of Grinding Roller of Coal Mill. Modern. Metall. 2010, 3, 23–25. [Google Scholar]
  3. Liu, J. Wear-resisting Surfacing Repair Technology for Grinding Rollers of Medium-speed Flat Disc Coal Mill. Hebei Electr. Power 1998, 17, 44–45. [Google Scholar]
  4. Zuo, W.S. Application of on-Line Surface Repair Technology for Grinding Plate of Slag Vertical Mill Roller. Shandong Metall. 2020, 42, 79–80. [Google Scholar]
  5. Li, G.Z. Surfacing Repair of Coal Mill Rollers. Cement Tech. 2012, 4, 85–87. [Google Scholar]
  6. Qiang, W. Analysis of on-line Surfacing Repair Process of Vertical Mill. Sci. Techol. Assoc. Forum 2010, 10, 30–31. [Google Scholar]
  7. Zhen, F.J. Study on Repair Process of Roller Welding for Intermediate Speed Mills. Electr. Power Constr. 1999, 20, 3–5. [Google Scholar]
  8. Zhi, Q.H.; Wei, Y.; Xin, W. Application of ZD-O Series Flux-Cored Welding Wire in Surfacing of Grinding Rollers. Metal Proce. 2010, 4, 33–35. [Google Scholar]
  9. Tian, S.T. Research on High Chromium Slag-Shielded Open-Arc Slag-Free Hardfacing Flux-Cored Wire; Xiangtan University: Xiangtan, China, 2012. [Google Scholar]
  10. Chao, X.C.; Zhen, B.D.; Dong, W. Open-Arc Surfacing Welding Process for the Milling Roller. Found Techol. 2009, 30, 133–135. [Google Scholar]
  11. Dong, J. Optimization and Experimental Study on Process Parameters of Metal Overlay Welding; Xinjiang University: Xiangtan, China, 2019. [Google Scholar]
  12. En, B.L.; Sheng, S.H.; Zhi, J.W. Optimization of GTAW Cladding Process of Inconel 625 on Carbon Steel Using Response Surface Methodology. Rans. China Weld. Inst. 2016, 37, 85–88. [Google Scholar]
  13. Srivastava, S.; Garg, R.K. Process Parameter Optimization of Gas Metal Arc Welding on IS: 2062 Mild Steel Using Response Surface Methodology. J. Manuf. Process. 2017, 25, 296–305. [Google Scholar] [CrossRef]
  14. Subasi, A.; Sahin, B.; Kaymaz, I. Multi-objective optimization of a honeycomb heat sink using Response Surface Method. Int. J. Heat Mass Transf. 2016, 101, 295–302. [Google Scholar] [CrossRef]
  15. Muthukumar, V.; Rajesh, N.; Venkatasamy, R.; Sureshbabub, A.; Senthilkumarc, N. Mathematical Modeling for Radial Overcut on Electrical Discharge Machining of Incoloy 800 by Response Surface Methodology. Procedia Mater. Sci. 2014, 6, 1674–1682. [Google Scholar] [CrossRef] [Green Version]
  16. Ruqayyah, T.; Jamal, P.; Alam, M.; Jaswirb, I.; Ramlic, N. Application of Response Surface Methodology for Protein Enrichment of Cassava Peel as Animal Feed by the White-Rot Fungus Panus Tigrinus M609RQY. Food Hydrocolloid. 2014, 42, 298–303. [Google Scholar] [CrossRef]
  17. Yang, P.; Fang, M.; Liu, Y.W. Optimization of a Phase Adjuster in a Thermo-Acoustic Stirling Engine Using Response Surface Methodology. Energy Procedia 2014, 61, 1772–1775. [Google Scholar] [CrossRef] [Green Version]
  18. You, D.J.; Hong, Y.G.; Xing, P.J.; Chen, T.S.; Zhi, W.Z.; Pei, Q.X.; Ze, H.L. Simulation and Optimization of Automobile Fuel Tank Tray Based on Response Surface and Genetic Algorithm. J. Plast. Eng. 2021, 12, 29–35. [Google Scholar]
  19. Fa, T.; Bao, Y.X.; Kai, Z. Strength Prediction Model of Clinched Joints of Aluminum Alloy Based on Response Surface Method. J. Plast. Eng. 2021, 12, 216–221. [Google Scholar]
  20. Meng, F.L.; Luo, Z.; Jiang, Y.; Hao, J.; Li, F.; Ren, J.G. Optimization of A-TIG Welding Parameters Based on Response Surface Method. Weld. Tech. 2012, 41, 22–25. [Google Scholar]
  21. Gang, W. Research on Shot Peening Parameters Optimization and Fatigue Properties of 42CrMo Steel for Automobile Shafts; Wuhan University of Technology: Wuhan, China, 2018. [Google Scholar]
  22. Cui, L.; Zhang, M.; Guo, S.R.; Yan, L.C.; Wen, H.Z.; Xiao, L.L.; Bo, Z. Multi-Objective Numerical Simulation of Geometrical Characteristics of Laser Cladding of Cobalt-Based Alloy Based on Response Surface Methodology. Meas. Control 2021, 54, 1125–1135. [Google Scholar] [CrossRef]
  23. Sathiya, P.; Ajith, P.; Soundararajan, R. Genetic algorithm based optimization of the process parameters for gas metal arc welding of AISI 904 L stainless steel. J. Mech. Sci. Technol. 2013, 27, 2457–2465. [Google Scholar] [CrossRef]
  24. Kiaee, N.; Aghaie-Khafri, M. Optimization of Gas Tungsten Arc Welding Process by Response Surface Methodology. Mater. Des. 2014, 54, 25–31. [Google Scholar] [CrossRef]
  25. Zhi, H.J.; Xiao, H.W.; De, L.G. Optimization of UHFP-GTAW Process Based on Response Surface Method. Rans. China Weld. Inst. 2020, 41, 90–96. [Google Scholar]
  26. Liu, Y.J.; Guo, Z.Y.; Fang, H.P. Optimization of MIG Surfacing Process Parameters of GH3128 Nickel Base Alloy Based on RSM. Hot. Working. Techol. 2020, 49, 3–5. [Google Scholar]
  27. Cong, X.Z. Wear Mechanism and Repair Process of MPS Type Mill Roller. Electr. Power Constr. 2006, 27, 12–15. [Google Scholar]
Figure 1. Cross sectional view of a weld.
Processes 10 00321 g001
Figure 2. Normal probability plot of residuals for the model. (a) dilution rate; (b) bead height.
Processes 10 00321 g002
Figure 3. Dilution-rate perturbation graph.
Processes 10 00321 g003
Figure 4. Combined effects of Ve and I(A) on D.
Processes 10 00321 g004
Figure 5. Bead-height perturbation graph.
Processes 10 00321 g005
Figure 6. Combined effects of Ve and I(A) on dilution rate.
Processes 10 00321 g006
Figure 7. Grinding roller surfacing equipment.
Processes 10 00321 g007
Figure 8. Repaired roller surface.
Processes 10 00321 g008
Table 1. Process parameters and their levels.
Surfacing Current
I/(A)
Surfacing Voltage
Ve/(V)
Surfacing Speed
Vo/(mm/s)
−1.682366.3628.63610.954
−13803013
04003216
14203419
1.682433.6435.36421.046
Table 2. Chemical composition of the base metal and welding wire.
CSiMnCrNiCuNbMoFe
45#0.42~0.50.17~0.370.5~0.8≤0.25≤0.30≤0.25 Bal.
S-100Mo-C4.5~5.00.8~1.20.6~1.027~290.12~0.17 0.11~0.200.8~1.0Bal.
Table 3. DOE Table with Responses.
RUNIVeVoD (%) H/mm
1−1−1−123.552.89
21−1−135.294.64
3−11−125.363.09
411−134.824.53
5−1−1129.232.30
61−1134.693.86
7−11127.332.42
811132.844.05
9−1.6821023.102.53
101.6821038.924.77
110−1.682034.002.97
1201.682032.373.51
1300−1.68227.814.49
14001.68234.082.36
1500030.153.66
1600031.173.29
1700028.663.41
1800030.543.07
1900032.573.25
2000031.583.38
Table 4. ANOVA table for bead height.
SourceSum of SquaresdfMean SquareF Valuep-Value
Model503.115100.6218.80<0.0001Significant
A292.591292.5954.67<0.0001
B71.95171.9513.440.0025
C23.03123.034.300.0570
AC34.65134.656.470.0234
B280.90180.9015.110.0016
Residual74.93145.35
Lack of fit45.5195.060.85930.6037Not significant
Pure Error29.4255.88
Cor Toal578.0419
R20.8704Adjusted R20.8241
Predicted R20.7196Adeq Precision14.5657
Table 5. ANOVA table for dilution rate.
SourceSum of SquaresdfMean SquareF Value p Value
Model11.9052.3829.79<0.0001Significant
A6.6016.6082.64<0.0001
B1.4211.4217.770.0009
C2.0312.0325.460.0002
AC0.382810.38284.790.0461
B21.4611.4618.270.0008
Residual1.12140.0799
Lack of fit0.830690.09231.600.3143Not significant
Pure Error0.288350.0577
Cor Toal13.0219
R20.9141Adjusted R20.8834
Predicted R20.7910Adeq Precision20.0695
Table 6. Experimental verification results.
NumberH(mm) D(%)
Measured ValueErrorsMeasured ValueErrors
13.823.2%30.1124.6%
23.874.6%29.8953.7%
33.782.2%29.3672.0%
Table 7. Hardness experiment results.
Measuring PositionMeasuring PointHardness Value/(HRC)Average Hardness Value/(HRC)
A156.156.7
256.8
357.2
B158.158.4
258.3
358.7
C157.357.7
257.5
358.2
Publisher’s Note: MDPI stays neutral with regard to jurisdictional claims in published maps and institutional affiliations.

