Abstract
Innovations in food extrusion technology are enabling its rapid expansion and applicability in diverse areas related to bioprocessing and value addition. This study relates raw material particulate rheology to the granular flow in a single screw food extruder. Raw materials based on corn (i.e., meal, flour, and starch), wheat (i.e., farina, flour, and starch), and sucrose (i.e., granulated, superfine, and powdered) were used as model particulate systems for the study. Various particulate-scale characteristics and flow parameters of these nine materials were determined using a powder rheometer, a promising new offline tool. Properties such as basic flow energy, specific energy, cohesion, stability index, flow function, and effective angle of internal friction were good indicators of flowability in an extruder. Corn meal exhibited lower energy requirements and a higher propensity for flow than corn flour (6.7 mJ/g versus 10.7 mJ/g, and “free-flowing” versus “cohesive,” according to Flow Function classifications), with wheat farina showing similar results when compared to wheat flour (5.8 mJ/g versus 7.9 mJ/g, and “highly free-flowing versus “cohesive,” according to Flow Function classifications), although both wheat systems showed comparatively lower energy requirements than their comparable corn systems. Sugar, being of a different base material and particle shape, behaved differently than these starch-based materials—flow energy decreased and propensity to flow increased (51.7 mJ/g versus 8.0 mJ/g, and “free-flowing” versus “highly free-flowing”). This large energy requirement for coarse sugar particles may be attributed more to particle shape than composition, as the sharp edges of sugar can interlock and increase restriction to movement through the sample. The starch-based results were validated in a particulate flow study involving the above model systems (corn meal, corn flour, wheat farina, and wheat flour) in a pilot-scale single screw extruder. Visualization data, obtained using a transparent plexiglass window during extrusion, confirmed that the flours exhibited higher flow energy requirements and a lower flow factor when compared to the coarser-particle size corn meal during extrusion, seen by the increased peak heights and barrel fill.
Keywords:
granular flow; particulate flow; extrusion; food powders; powder rheology; particle size; composition; corn; wheat; sugar 1. Introduction
In extrusion processing, material flow starts in a hopper and is fed through a feeder screw, through a preconditioning system and finally into the extruder. All of this flow takes place as a granular material. After entering into the kneading and cooking zones (in the extruder), the granular material undergoes pressure and temperature changes and begins the transition into a fluidized mass before exiting the die at the end of the barrel.
While this is a simplified illustration of an extrusion system, each target product has different optimal processing parameters: moisture, thermal energy, screw profile, barrel temperature, and physiochemical changes that occur in these zones. The analysis of flow and cook patterns changes with each zone, as the material transitions from individual granules to a compacted solid to a viscous melt, but the understanding of these patterns leads to improved developments of screw configuration, screw/barrel metallurgy, and operational parameters. In the feeding zone, specifically, understanding the behavior of particle flow as a function of size and composition is the key to these developments. As extrusion occurs in an enclosed system with forward movement aided by a rotating screw, particle-surface interactions (i.e., the interactions between particles and the screw and barrel) play a significant role in flow, in addition to interparticle forces. Flowability is a result of physical, chemical, and environmental variables. Determining the flow properties (dynamic, bulk, and shear) of these granular materials is necessary to predict how efficiently these materials are conveyed from the start of the barrel into the kneading and cooking zones [1]. If a material will not flow well upon entering the feeding zone, the entire process can back up, choking the extruder and resulting in time lost due to clearing the blockage [2]. Even if a material flows, a blended mixture may have components that behave differently: (i) one element being more adhesive to the barrel surface, and (ii) another agglomerating to like particles more. As such, it is important to understand how the individual raw materials will behave during the extrusion process to predict the flow problems in the extruder barrel as well as to estimate the system performance.
Beyond the particle-wall interactive forces present in this system, additional factors impact the effectiveness of material flow, such as particle shape. Yamane et al., [3] performed discrete element modeling on the dynamic angle of repose of non-spherical mustard seeds compared to spherical particles, with the non-spherical particles showing a greater angle of repose at any given rotational speed of a drum. These observations were similar to the observations of Dury et al., [4], where two species of mustard seeds were compared against spherical glass beads rotated in a drum, and an increased coefficient of friction was observed for both varieties of non-spherical seeds over the spherical beads. Additionally, particles that are irregularly shaped, with sharp corners or other non-rounded sides/edges, have even higher angles of internal friction than lenticular or ellipsoidal particles due to their ability to interlock and subsequently resist flow action [5].
The composition of the material also contributes to the differences in flow patterns. The starch-based, protein-based, and sucrose-based powders all have different roles in extrusion processing for achieving the desired end product. All these materials have different flow properties and contribute to the flow problems in the extruder. Fitzpatrick et al., [6] analyzed flow functionality of one dozen food powders which have similar particle sizes (fine) and found that the flow index of these powders was influenced by composition (including equilibrium moisture). However, there were no other extensive studies on comparing the flow functionality of food powders in the extrusion process. This study was undertaken to characterize the flow behavior of commonly used food powders (corn, wheat, and sucrose) in the extrusion process. The specific objectives of this study are to:
- Explore the significance of particle size on the flow functionality and energy requirements of corn, wheat, and sucrose powders.
- Explore the correlation between composition of food powders and their flow behavior patterns in the extruder.
2. Materials and Methods
2.1. Materials
The materials used for this experiment were as follows: Corn Starch (Argo, Engelwood Cliffs, NJ, USA), corn flour (Bunge, Atchison, KS, USA), corn meal (Aunt Jemima, Chicago, IL, USA), wheat starch (MGP Ingredients, Atchison, KS, USA), wheat flour (Gold Medal, Minneapolis, MN, USA), wheat farina (Hal Ross Mill, Kansas State University, Manhattan, KS), powdered sugar (C&H, Yonkers, NY, USA), superfine sugar (C&H, Yonkers, NY, USA), and granulated sugar (C&H, Yonkers, NY, USA). The moisture content of the food powders was determined using AOAC Standard 925.10 [7] by drying 2–3 g of sample in a hot air oven at 130 °C for 60 min.
2.2. Particle Size Measurement
Preliminary particle size was measured via Rotap sieve shaker (W.S. Tyler, Mentor. OH, USA). The particle size measurements were carried out on representative 100 g samples using the ASABE Standard S319.4 method [8]. The average particle size of the food powders was calculated using Equation (1) as follows:
2.3. Flow Properties
The Freeman Technology FT4 Powder Rheometer (FT4, Freeman Technologies, Tewkesbury, UK) was used to evaluate the flow properties of the powders. The detailed description of this equipment and its use in powder flow characterization can be found in Freeman [1]. The usage of equipment and description is described briefly here for enhanced readability and completeness of this manuscript.
2.3.1. Dynamic Flow Properties of Food Powders
The basic Flowability Energy (BFE) is the total energy required to establish a specific flow pattern in the food powders when they are confined in a storage container [1]. The higher this value, the more energy is required to establish the flow. The BFE was calculated using Equation (2).
where T = rotation resistance or torque experienced by the blade (N·m); F = vertical resistance or force experienced by the blade (N); = angular speed of the blade (rad/s); vx = vertical speed of the blade (m/s); and Δx = vertical distance traversed by the blade.
Specific Basic Flow Energy (SBFE) is BFE divided by total mass of product in the cylinder to give Joules/gram, which allows for a more uniform comparison across products with different densities, as formulations for products are mixed on a per-mass basis, not per-volume basis.
In contrast to BFE, Specific Energy (SE) represents the energy taken to move from the base of the cylinder to the top, representing unconfined flow, and is calculated by dividing with the mass of the sample to give a per-unit-mass value (Equation (3)):
where FE6 = upward flow energy required during test cycle 6 (mJ); FE7 = upward flow energy required during test cycle 7 (mJ); and m = mass of sample (g).
Stability Index (SI) shows whether a powder expands, compacts, or remains at the same volume through the test cycles. A value near 1.00 indicated the powder maintains its volume, while a value greater or less than 1.00 indicated the powder had a tendency to compact or expand, respectively [1]. The SI is computed using Equation (4) below.
where BFE1 = Flow energy required during test cycle 1; and BFE7 = Flow energy required during test cycle 7.
The rate at which the flours are handled in the extrusion system varies from time to time. To account for these variations and to understand the process of conveyance in the extrusion system, the Flow Rate Index (FRI) is computed using Equation (5) as follows:
where BFE8 = Flow energy required during test cycle 8; and BFE11 = Flow energy required during test cycle 11.
Eleven different blade tip speeds were used in computing the FRI, to account for the variations in the handling and conveyance of the food powders.
2.3.2. Compressibility
The compressibility tests accounts for the changes in density of the food powders as a result of mechanical compaction that occurs during the pre-conditioning and conditioning steps of the extrusion process. For the compressibility test, a 48 mm helical blade was used to condition the sample, with a glass cylinder of 85 mm × 50 mm used for the base. After the conditioning cycle was completed, the blade was replaced by a 48 mm-diameter vented piston. The top cylinder was split to remove excess powder, leaving a standard volume of product, and then the piston was lowered at increasing force levels: 0.5, 1, 2, 4, 6, 8, 10, 12, and 15 kPa. The percentage compression of the powder was recorded at each force interval. Then, compressibility is calculated as a percentage change in volume.
2.3.3. Shear Flow Properties of Food Powders
Testing of shear properties allows for further understanding of the inter-particulate forces that powders are subjected to during handling and processing, such as the yield point of powder flow initiation. Preparation for the shear cell test involved using the 48 mm helical blade, followed by the 48 mm diameter vented piston, and then splitting the two 85 mm × 50 mm glass cylinders, leaving a compacted volume of sample for the test. The shear cell attachment, with the same radius as the vented piston but with small blades on the underside, was used to carry out the test by inducing rotational and vertical stress. Once the powder bed in the cylinder yielded to the stress applied by the shear head, the stress value was recorded.
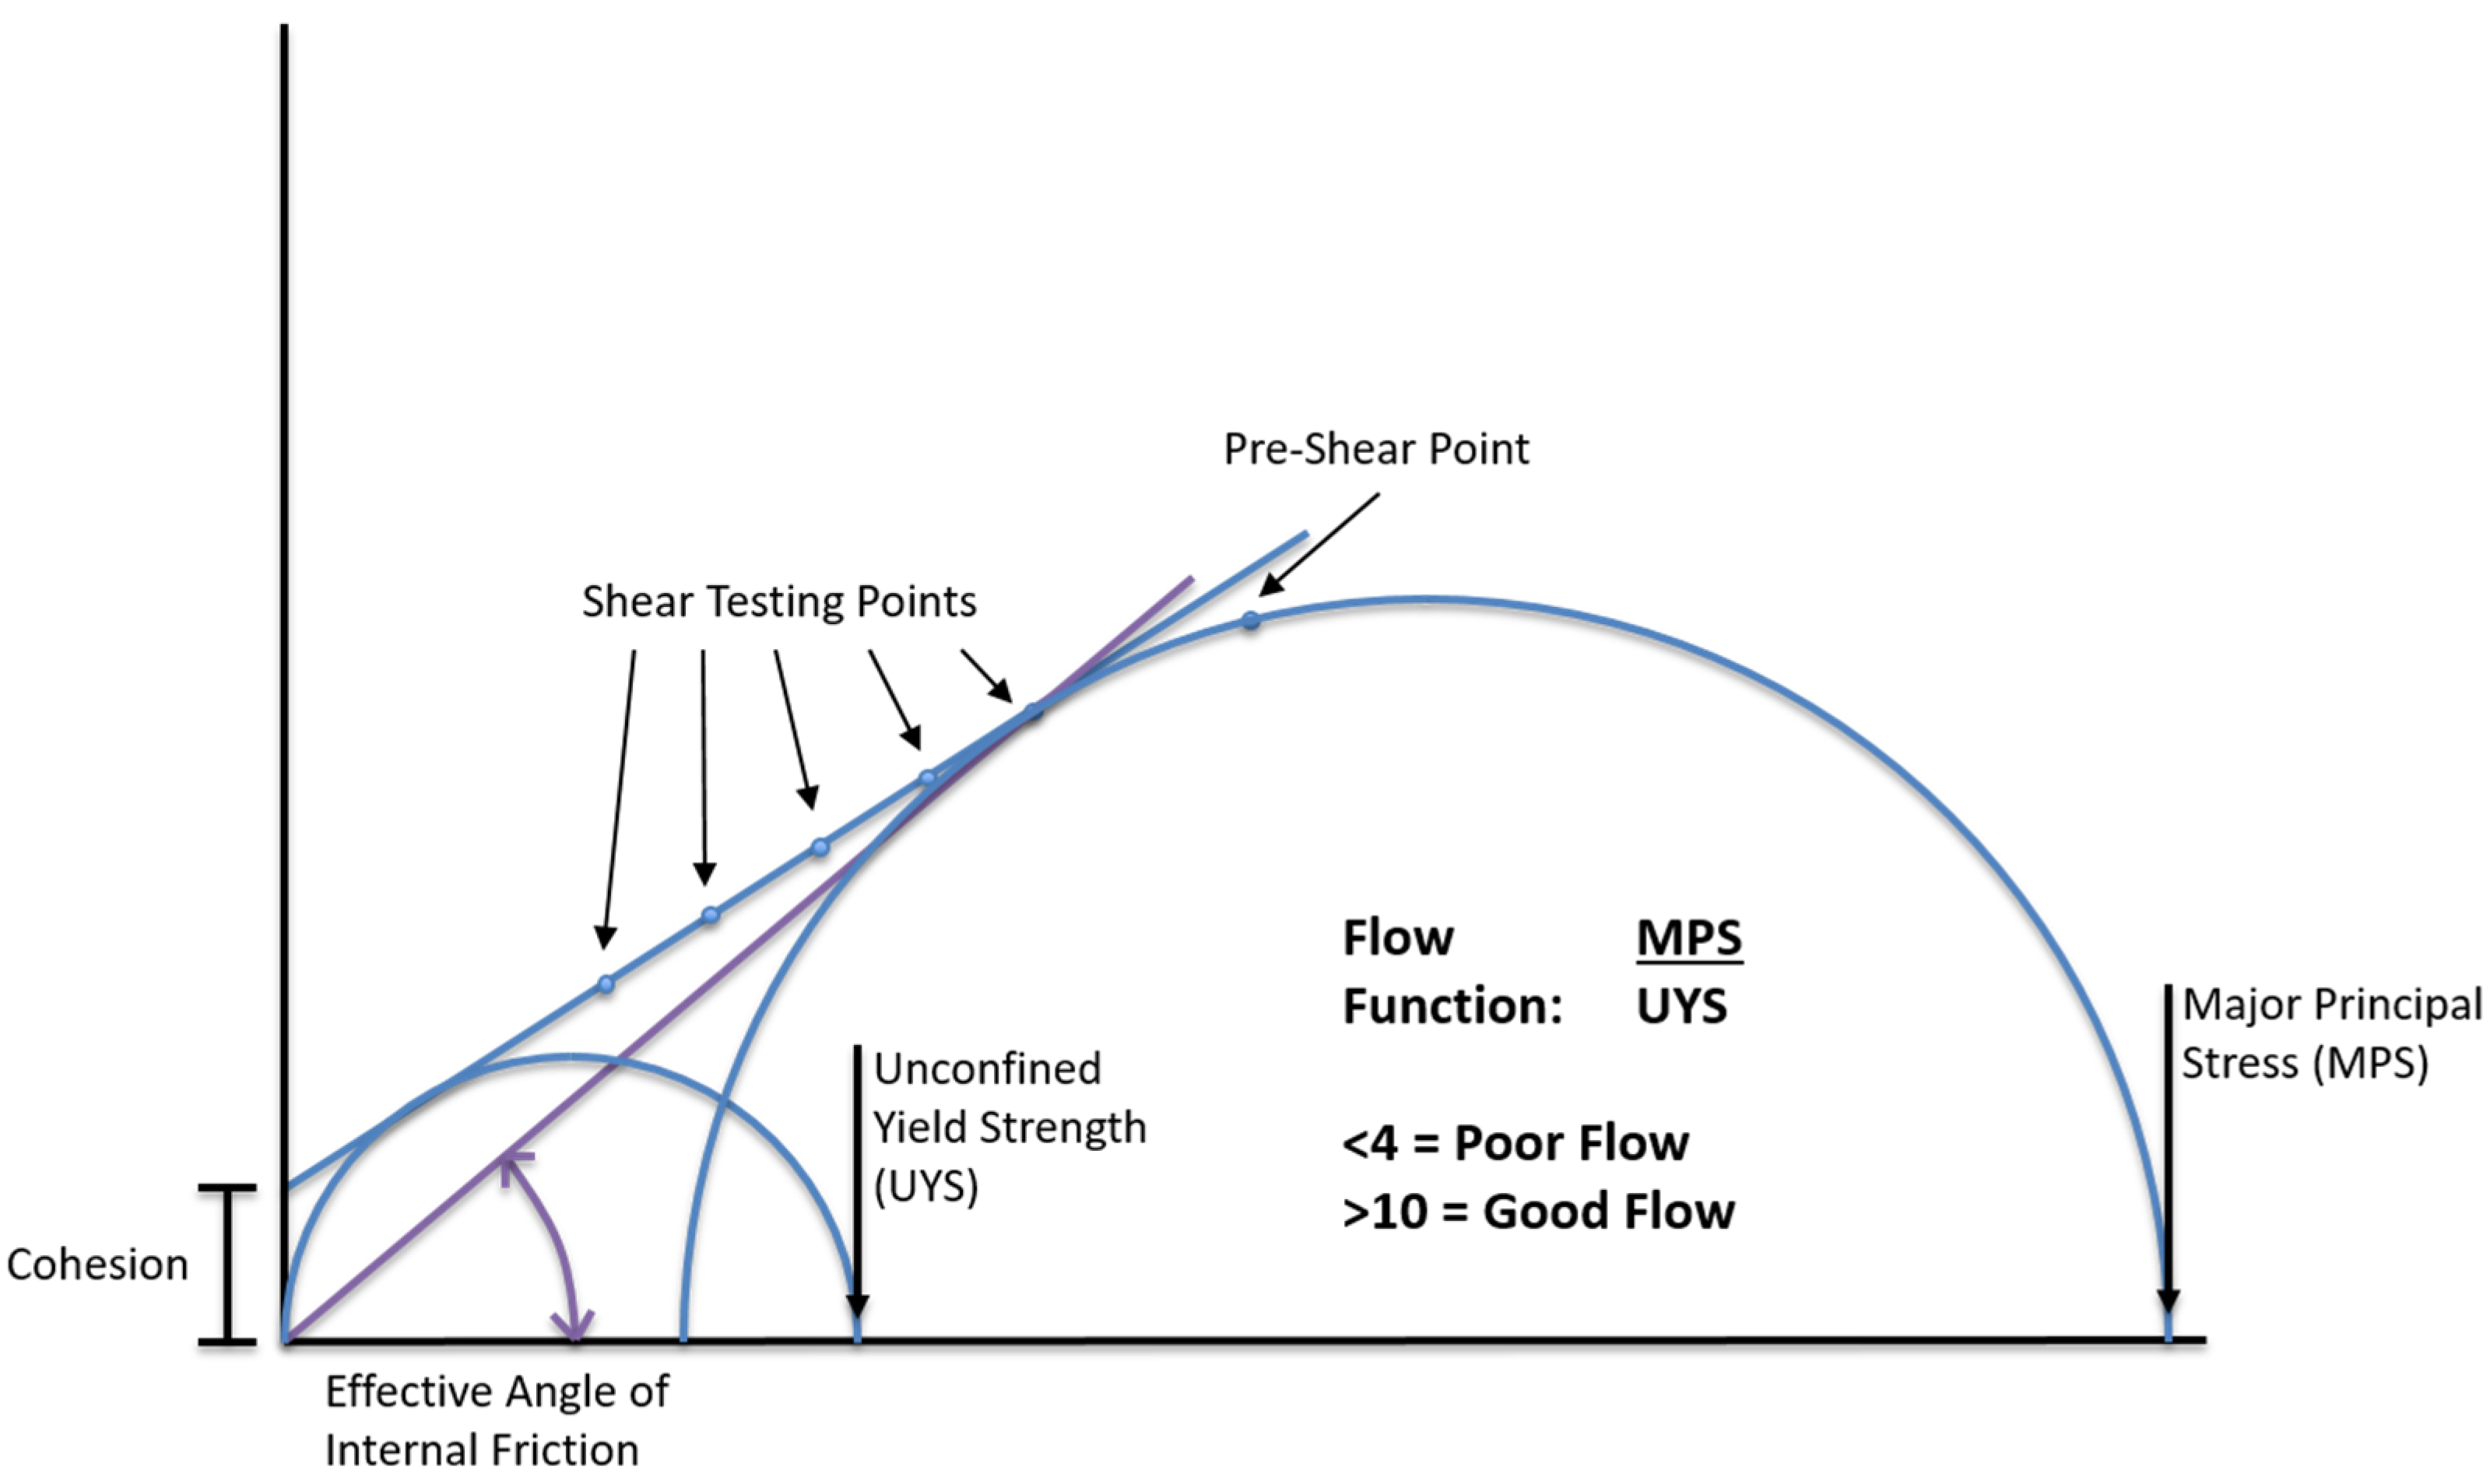
These results utilized Mohr Circle analysis to calculate values such as cohesion, major principle stress, unconfined yield strength, and flow factor, as illustrated in Figure 1. Test points were plotted along a graph to determine cohesion factor (y-intercept value of yield locus—line through data points) and effective angle of internal friction (angle of line drawn between farthest test point and origin compared to x-axis). Unconfined Yield Strength (UYS) was developed by drawing a half-circle from the origin, tangent to the yield locus, and the point the half-circle crossed the x-axis was labeled as the UYS. Major Principal Stress (MPS) was calculated in a similar matter, with a semi-circle drawn between the farthest test point and the pre-shear point, with the higher end of the semi-circle labeled as the MPS.
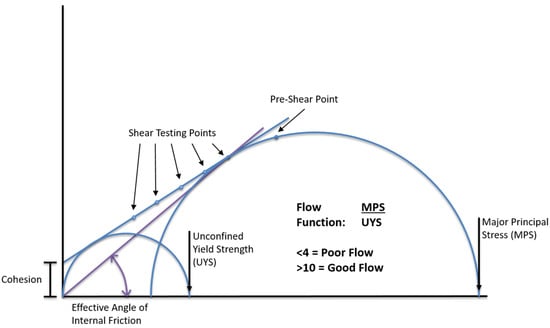
Figure 1.
Typical Mohr Circle plot.
Flow Function (FF) was calculated using Equation (6), which directly indicates how easily a powder will flow, with a higher value indicating a greater propensity to flow and a lower number indicating a resistance to flow [9]. These values have been elaborated by Thomas and Schubert [10] and divided into the categories seen in Table 1.

Table 1.
Classification of particulate flowability based on flow function.
2.3.4. Wall Friction
This test measures the resistance of flow of powders in relation to the process equipment surface by using a friction disc head that applies both vertical and rotational stress on a powder at rest to determine the torque necessary to overcome the resistance of the powder bed. Preparation for the Wall Friction test involved using the 48 mm helical blade, followed by the 48 mm diameter vented piston, and then splitting the two 85 mm × 50 mm glass cylinders, leaving a compacted volume of sample for the test. A Wall Friction disc, with a friction coefficient value of 0.05 (low friction interference), was used for the test.
The torque required to maintain the rotational momentum of the disc was measured and used to calculate a ‘steady-state’ shear stress. The normal stress was maintained at a constant value throughout the measurement. From the relationship between normal stress (σw) and shear stress (τw), the wall friction angle (Φ), is calculated using Equation (7) as follows:
2.4. Extrusion Visualization
A pilot-scale X-20 37.3 kW single-screw extruder (Wenger Manufacturing, Sabetha, KS, USA) was used for in-line powder flow visualization trials with a plexiglass window along one-third of the circumference of the barrel. The screw diameter was 82.1 mm and the L:D ratio 8:1. Four regularly spaced steam locks were used dispersed along the length of the extruder screw, which in a typical extrusion process provide resistance to flow, increase material fill, and lead to the desired mechanical energy input. In the visualization trials, the steam locks developed peaks of flowing material along the length of the barrel, which were subjectively evaluated for determining flowability of corn meal, corn flour, wheat farina, and wheat flour. There was no die or any other restriction at the end of the screw. Material feed rate was set at 80 kg/hr. An extruder screw speed of 125 rpm was used for corn meal and wheat farina and 250 rpm for corn flour and wheat flour.
2.5. Data Analysis
All flow property tests were performed in triplicate and new food powder samples were used for each test. The flow property values were expressed as mean (standard deviation). Mean flow property values were analyzed using the GLIMMIX procedure with mean comparisons done using the Tukey’s HSD procedure (p ≤ 0.05). All analyses were conducted using SAS 9.3 software (SAS Institute, Cary, NC, USA).
3. Results and Discussion
3.1. Particle Size
Particle size of food powders, measured as average particle size diameter, is a critical factor in the determining the powder’s usefulness and application in the extrusion process. The average particle size for each material was determined to be: corn starch (12 µm), corn flour (154 µm), corn meal (622 µm); wheat starch (23 µm), wheat flour (72 µm), wheat farina (410 µm); powdered sugar (12 µm), superfine sugar (150 µm), and granulated sugar (450 µm).
Since food particles are a variety of shapes, there is error associated with the assumption that all particles are spherical. The diversity of shapes also creates error in sieve measurements, as a long skinny particle may or may not pass through a screen opening, depending on its orientation. If it passes through an opening when it orients vertically, it is counted as being smaller than if it had not bounced to that orientation and thus remained on the larger sieve screen.
3.2. Moisture Content
Moisture content for each material was found to be as follows: corn starch, 10.32; corn flour, 11.04; corn meal, 13.13; wheat starch, 9.40; wheat flour, 12.28; wheat farina, 13.73; powdered sugar, 0.38; superfine sugar, 0.09; and granulated sugar, 0.06 (%wet basis).
3.3. Dynamic Flow Properties
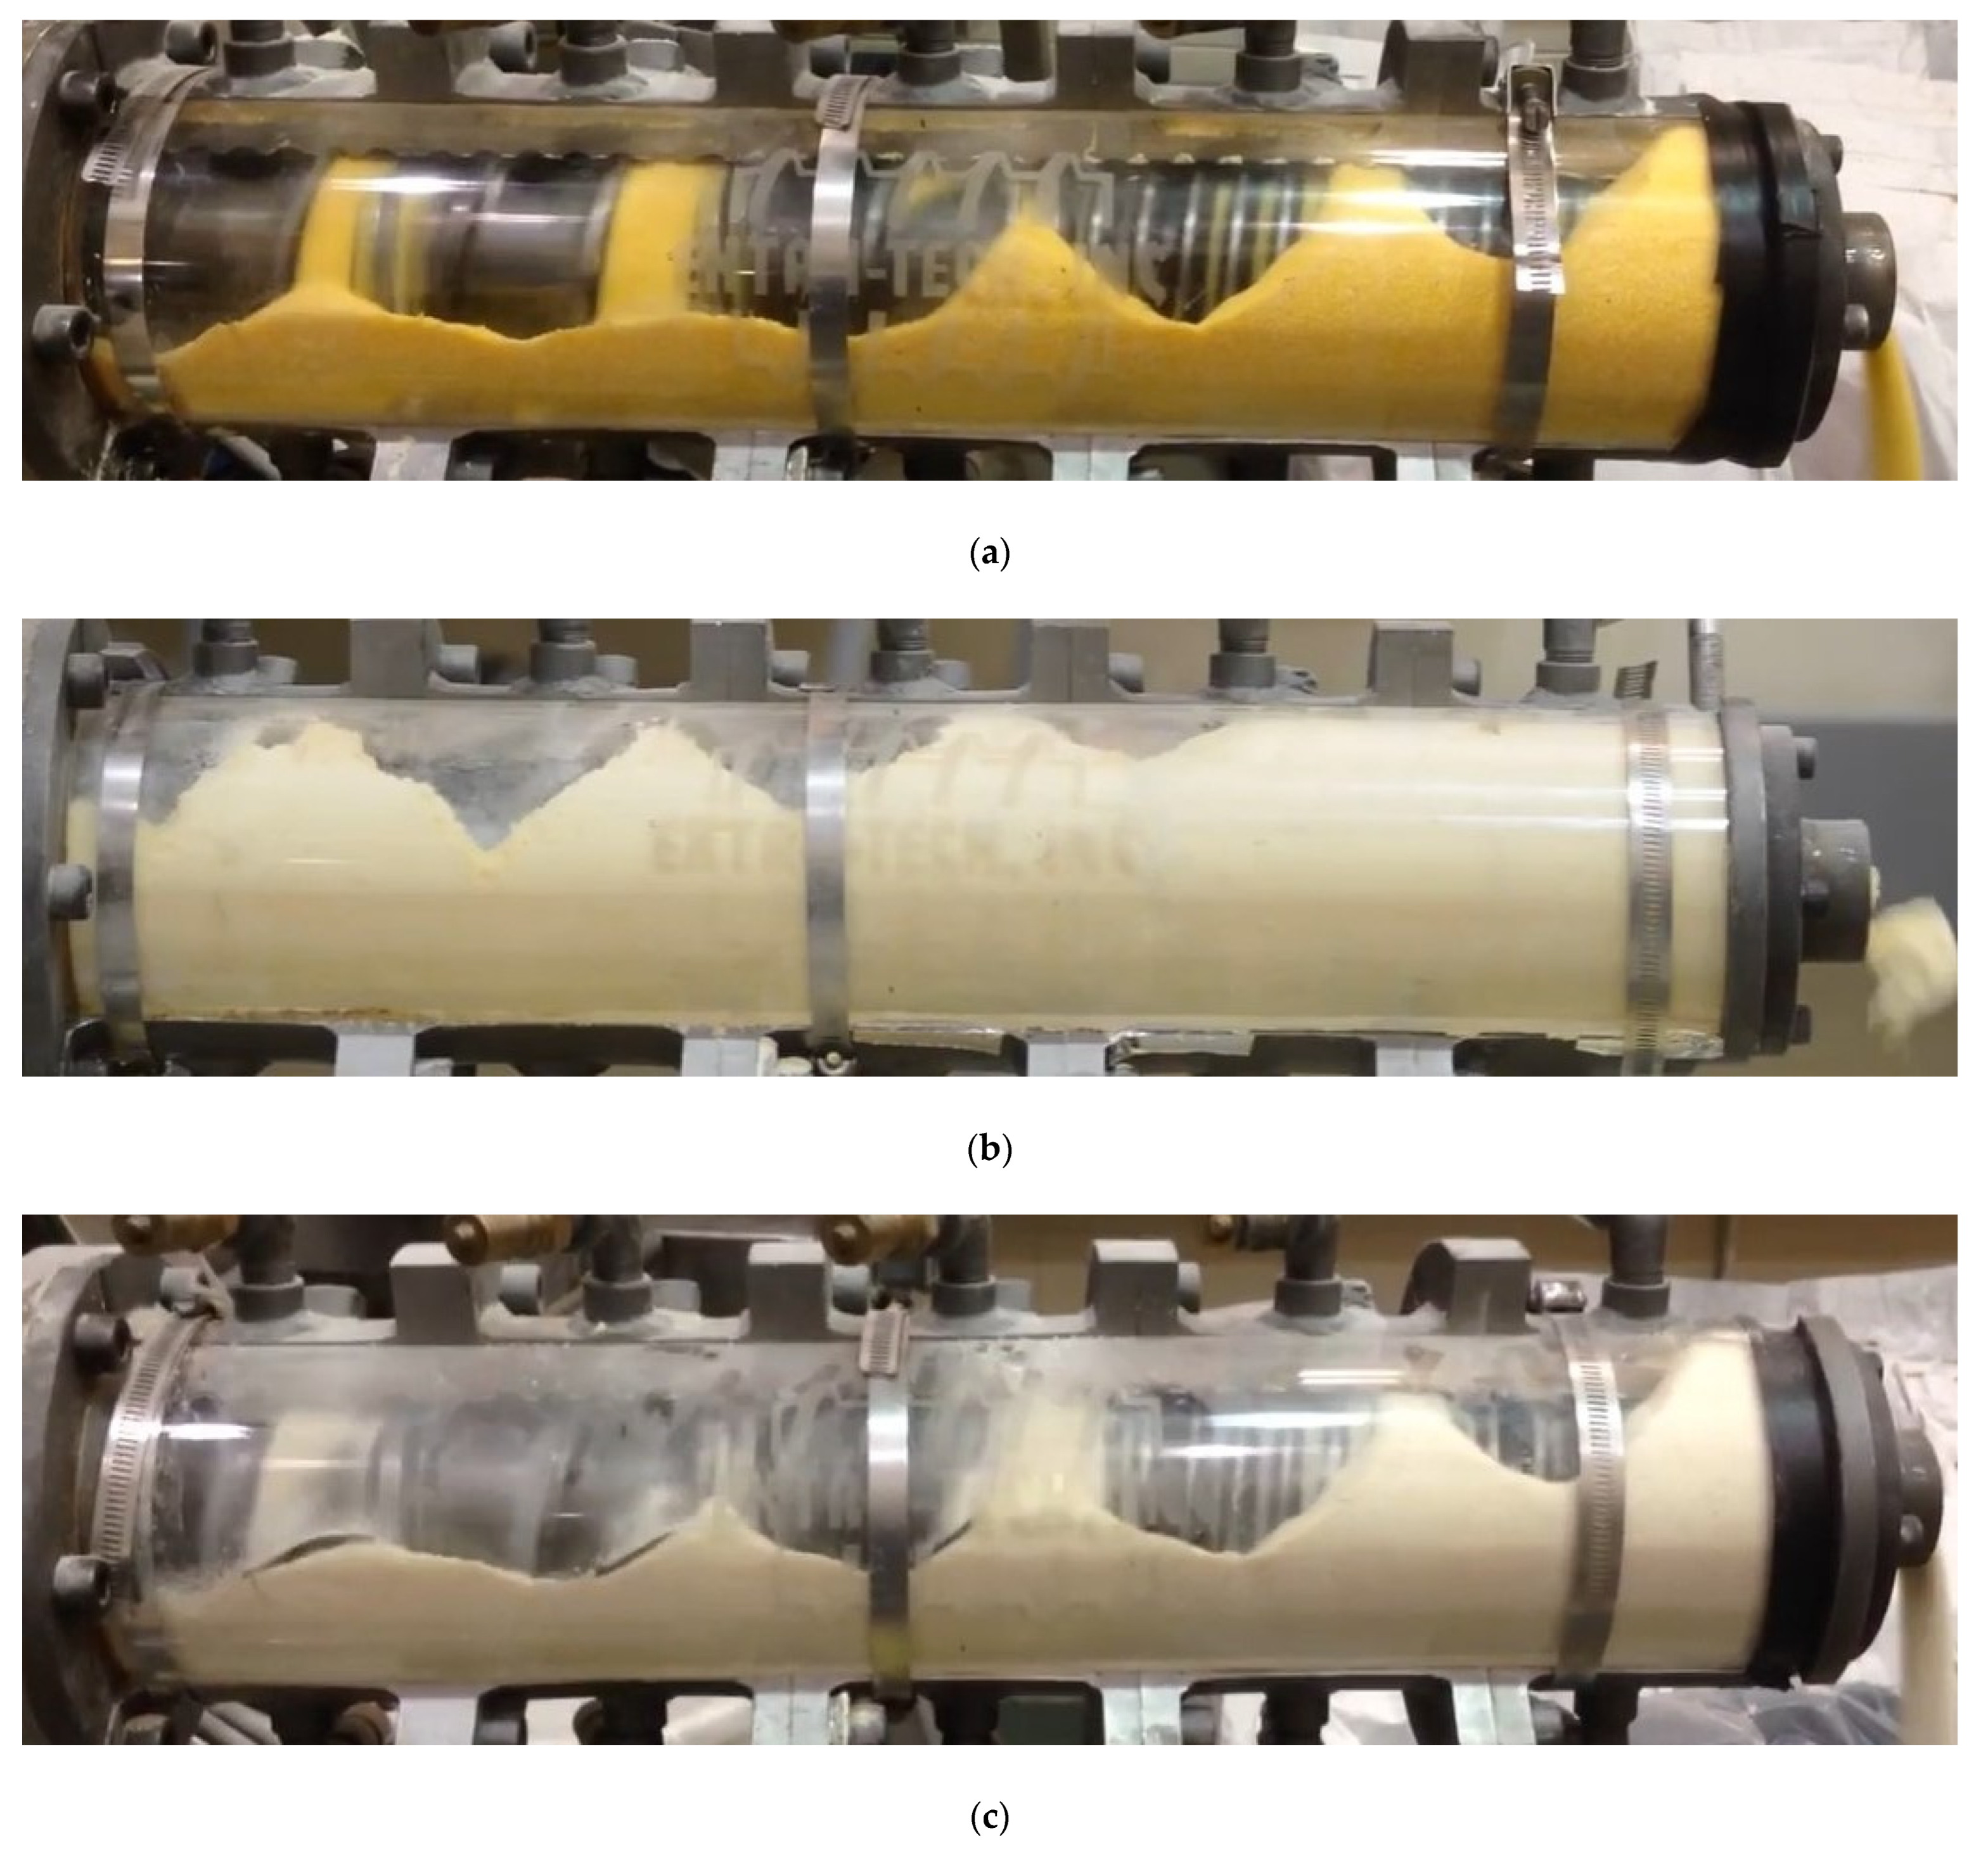
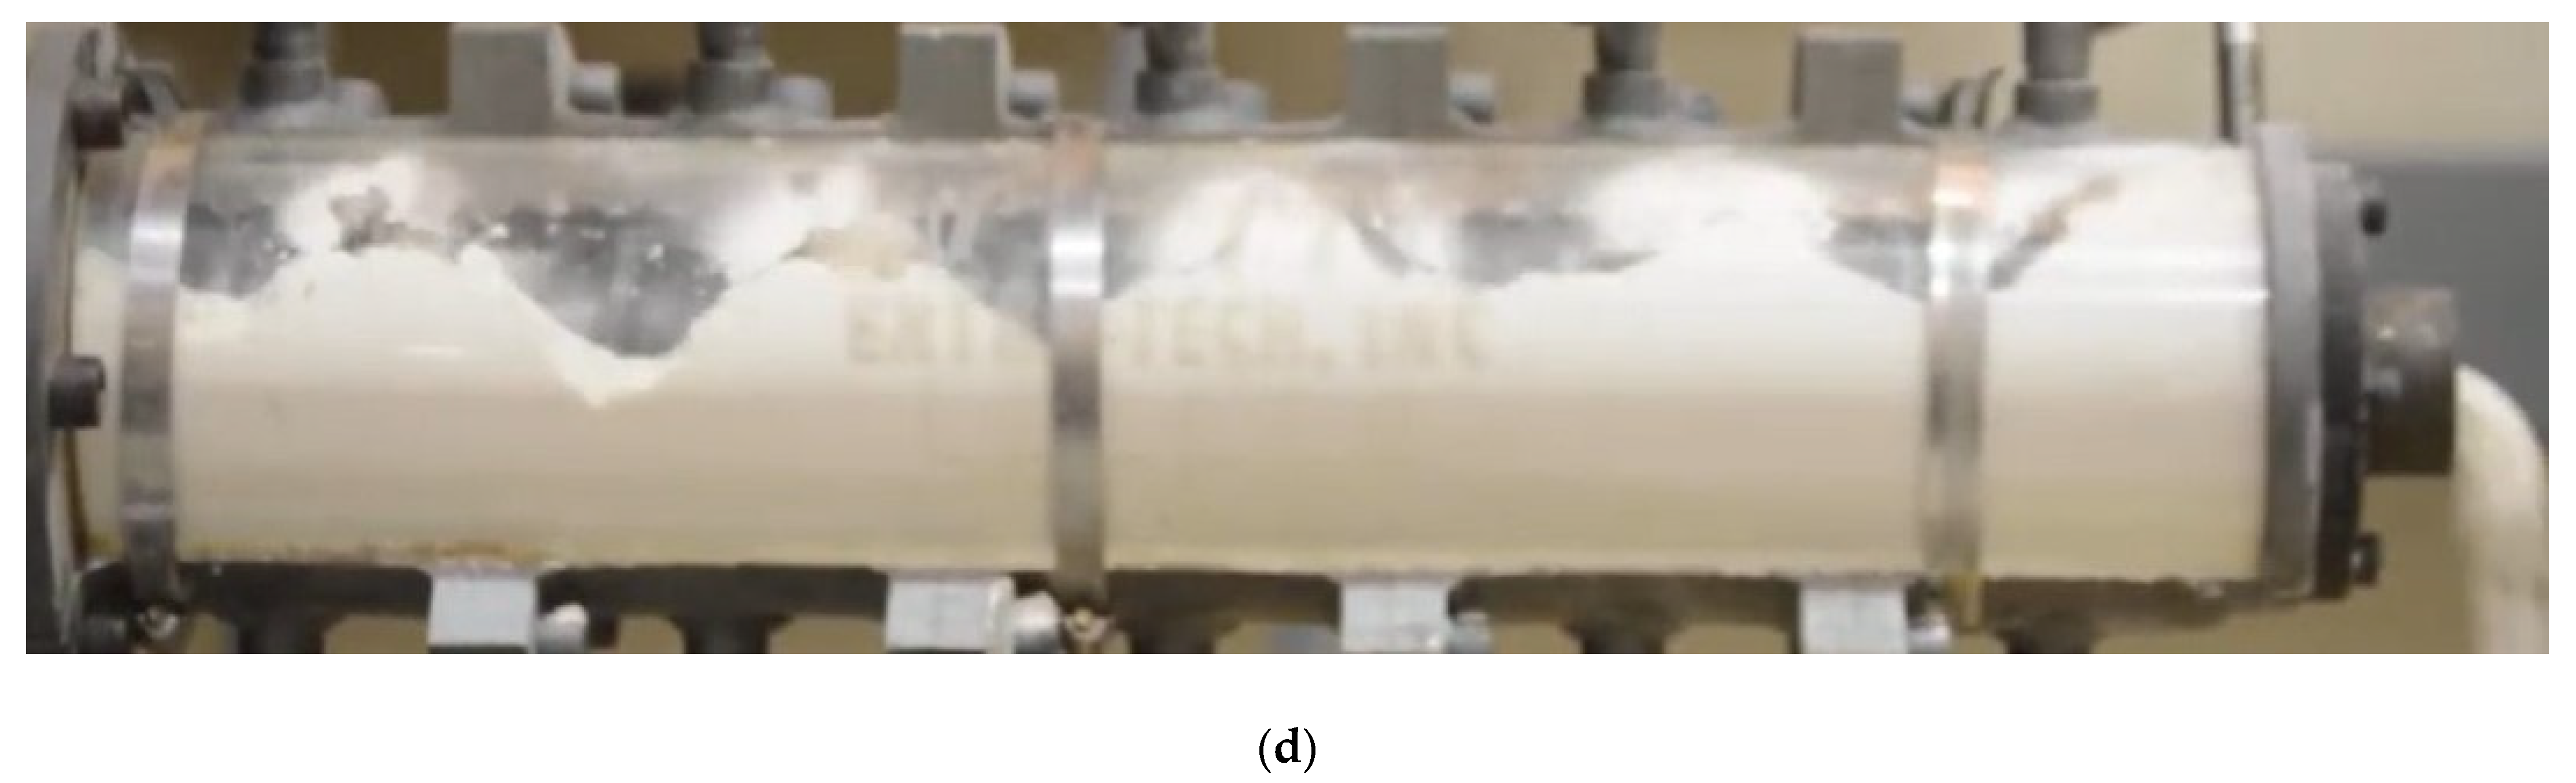
Stability and variable flow rate testing shows that, as particle size increases (for corn and wheat powders), the energy requirements for confined and unconfined flow decreases (Table 2). The increase in energy with smaller particles can be attributed to an increase in surface area that increased the interparticle friction resulting in higher resistance to flow [1]. This higher flow resistance with decreasing particle size translated to poor granular flow in extrusion as could be seen from the visualization trials on the pilot-scale single screw extruder (Figure 2). Higher barrel fill for corn flour versus corn meal, and similarly higher barrel fill for wheat flour versus wheat farina, was a direct result of poor flowability of the finer particle size material in each case. Trials for corn and wheat starches on the extruder were not done, but it is reasonable to extrapolate from the above results that they will exhibit poorest flow, as has also been noted anecdotally. The SI results shows that corn flour and corn starch both compact during the testing, while corn meal slightly expands as the blade rotates through the sample (Table 2). The FRI shows that corn starch is more sensitive to changes in blade speed when compared to corn flour and corn meal. The FRI also shows that wheat starch was more sensitive to changes in blade speed when compared to wheat flour or wheat farina (Table 2). This could be due to the shape of the particles, as the SI of 1.0 indicates that farina tends to neither compact nor expand throughout the testing process. Contrarily, the starch and flour powders settled and compacted during the conditioning of the test and required noticeably more energy when blade speed was reduced for FRI testing. With a FRI value of < 1.0 for farina (Table 2), it can be inferred that a slower blade speed is more energy efficient for moving through the particles. From this test, it can also be concluded that for mixing or conditioning the wheat farina samples, slower mixing blade speeds have to be employed.
Table 2.
Dynamic flow properties of food powders.

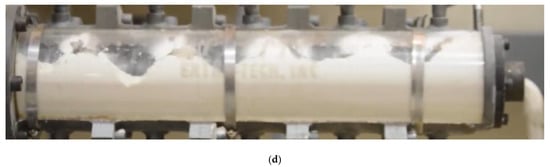
Figure 2.
In-line visualization of powder flow in a pilot-scale single screw extruder using (a) corn meal, (b) corn flour, (c) wheat farina, and (d) wheat flour.
Sugar, being the only non-starch-based powder tested, showed different results with increments in particle size (Table 2). While powdered and superfine sugar resulted in similar trends (as that of corn and wheat powders) for SBFE and SE tests, the granulated sugar required over four times the energy for both the tests (Table 2). This could be partly due to the shape of the powder, as powdered and superfine sugars are both more rounded particles, while granulated sugar is longer with asymmetrical edges [11]. This shape may cause granules to interlock and create a more difficult matrix for the blade to traverse, in both confined and unconfined flow. Conversely, as particle size increased, sensitivity to blade tip speed was reduced, denoted by the decreasing FRI value. Powdered sugar was the most sensitive food powders (among the tested powders), to a ten-fold decrease in blade speed, while superfine sugar was mostly unaffected. Granulated sugar, with a SI value of < 1.0 (Table 2), indicates that a slower blade speed was more efficient for traversing through the powder. Particle geometry may again explain this, as a slower tip speed could gently disrupt the interlocking particles smoother than the faster blade speed (similar to how non-Newtonian fluids behave as solids when acted upon by high forces, but flow freely when forces below the threshold for behaving as a solid are applied).
3.4. Shear Flow Properties
The shear testing results provide further understanding on whether the food powders will flow through the extrusion process or whether bridging, caking, and choking in the extruder are likely. According to the shear test results and classification of powders by Jenike [9], corn starch, wheat starch, and super fine sugar are free flowing powders as the FF values of these powders are very close to or greater than 10 (Table 3). The cohesion values of these powders (corn starch, wheat starch and super fine sugar, and also wheat farina) are lesser than the other powders (Table 3). This could be due to the spherical shape and smother texture of the starch particles [12], which might have resulted slipping movement of the particles. However, this result could also be attributed to the constant stress the powders are under during testing, once corn starch (or any material) is under enough constant pressure, it fluidizes and results in the inflated values that reflect a free-flowing liquid. Marston et al., [13] found that decreasing particle size of materials resulted in behavior more similar to water when struck with a solid object at a constant velocity, although specific values for fluidization were not found. This does explain the deviation from dynamic flow properties discussed above. Corn starch, other starches, and similar fine particulate materials are known for not flowing well in an extruder, especially during unconfined, granular flow in the feeding section, which is predicted reasonably from the dynamic flow tests parameters such as specific energy. The high FF of corn starch appears contrary, but this type of particulate fluidization for very fine granulation materials is not observed in extrusion feeding zone due to the low pressure and compaction regime. The lower FF and cohesive resistance of corn flour as compared to corn meal is, however, consistent with the higher specific energy observed for the former in dynamic testing and its lower propensity to flow in an extruder.
Table 3.
Shear flow properties of food powders.
Shear flow results for wheat starch, flour, and farina followed the same trend as corn-based powders. The FF for superfine sugar was the highest of all powders (Table 3), while powdered sugar was lowest of all, which is confirmed by the cohesion values being the lowest and highest, respectively. The shear flow property results of granulated and powdered sugars were in agreement with the results reported by Stasiak and Molenda [14].
Cohesion values (Table 3) tended to relate to yield stress, flow function, and angle of internal friction. The greater the cohesion value a powder has, the more the particles interact with each other, which results in a higher yield strength, lower flow function, and greater angle of internal friction. The corn flour, wheat flour, and powdered sugar have higher cohesion values (Table 3). This could be due to the smaller size of the particles. As in the production smaller particles, more forces are applied in the production process which results in unusual rough texture of the particles. This surface roughness combined with the higher surface area would tend to promote mechanical bridging and result in higher cohesion. Corn and wheat starches are an exception as they are not produced via isolation or separation techniques rather than size reduction.
The angle of internal friction or AIF indicates the interparticle friction as powder starts to slide. The powders with higher AIF values are more resistant to flow than the powders with lower AIF values. The flour powders (corn and wheat) and powdered sugar have higher AIF values, indicating that these powders are more resistant to flow than the other powders.
3.5. Compressibility
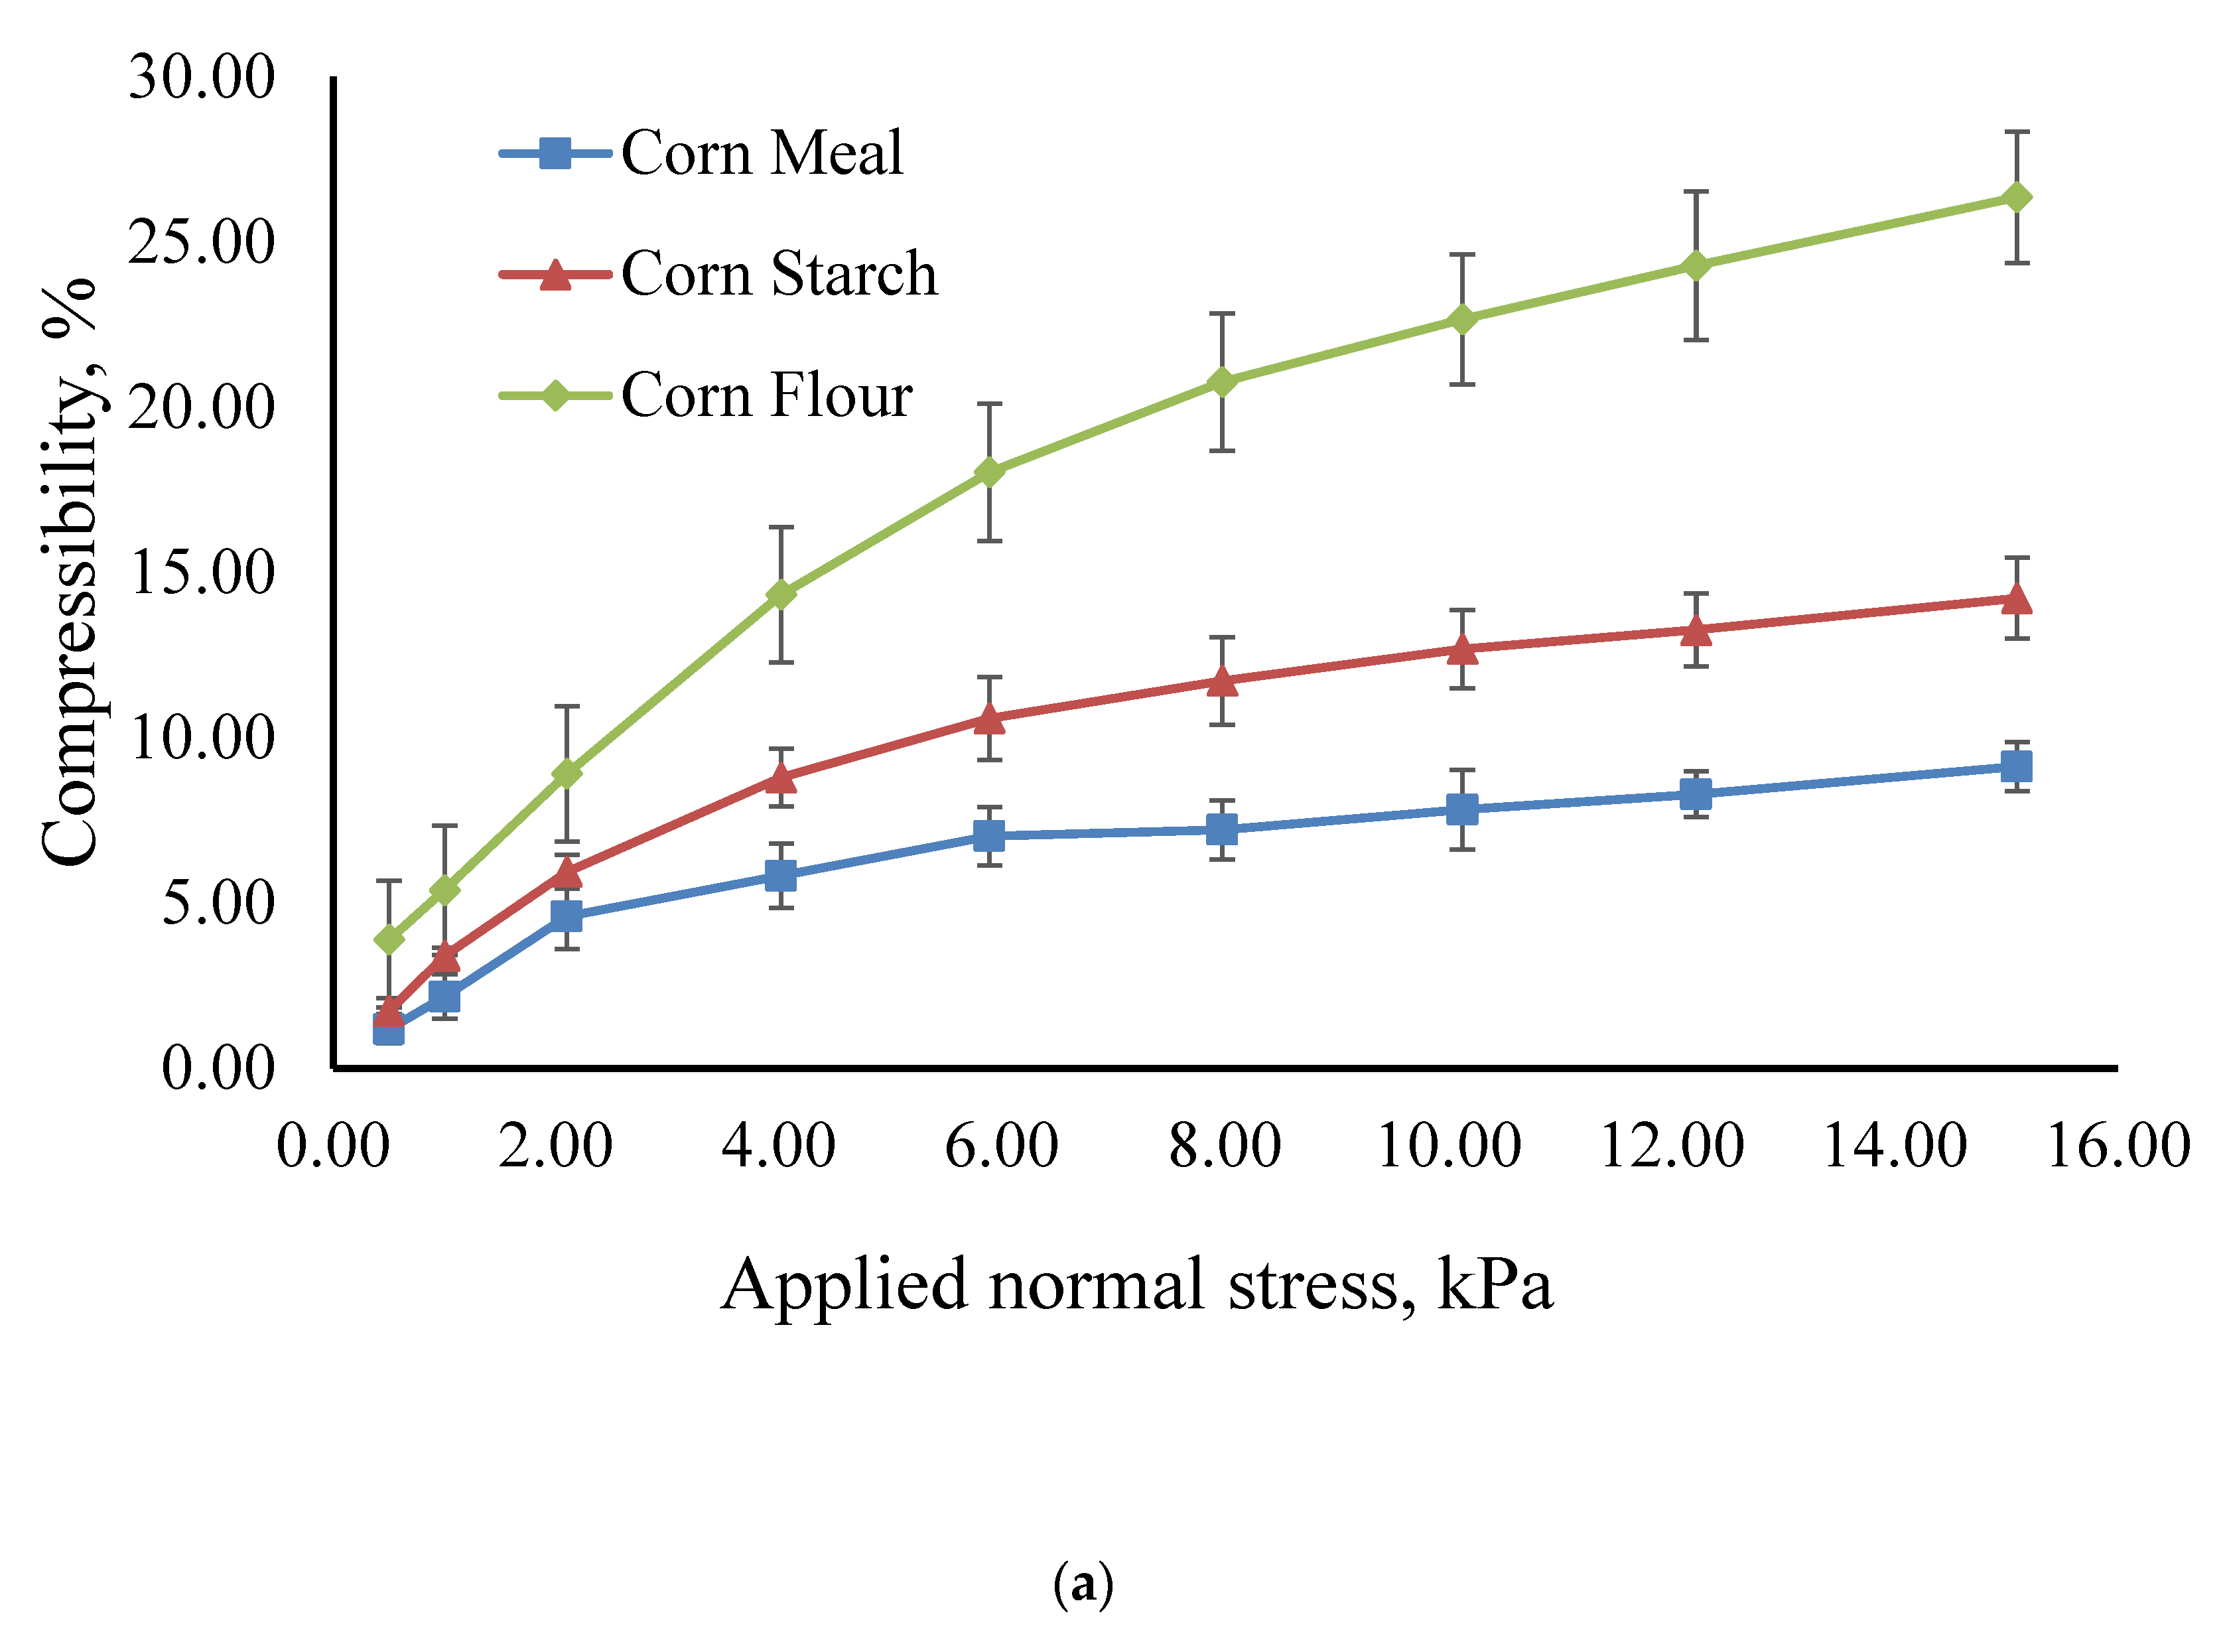
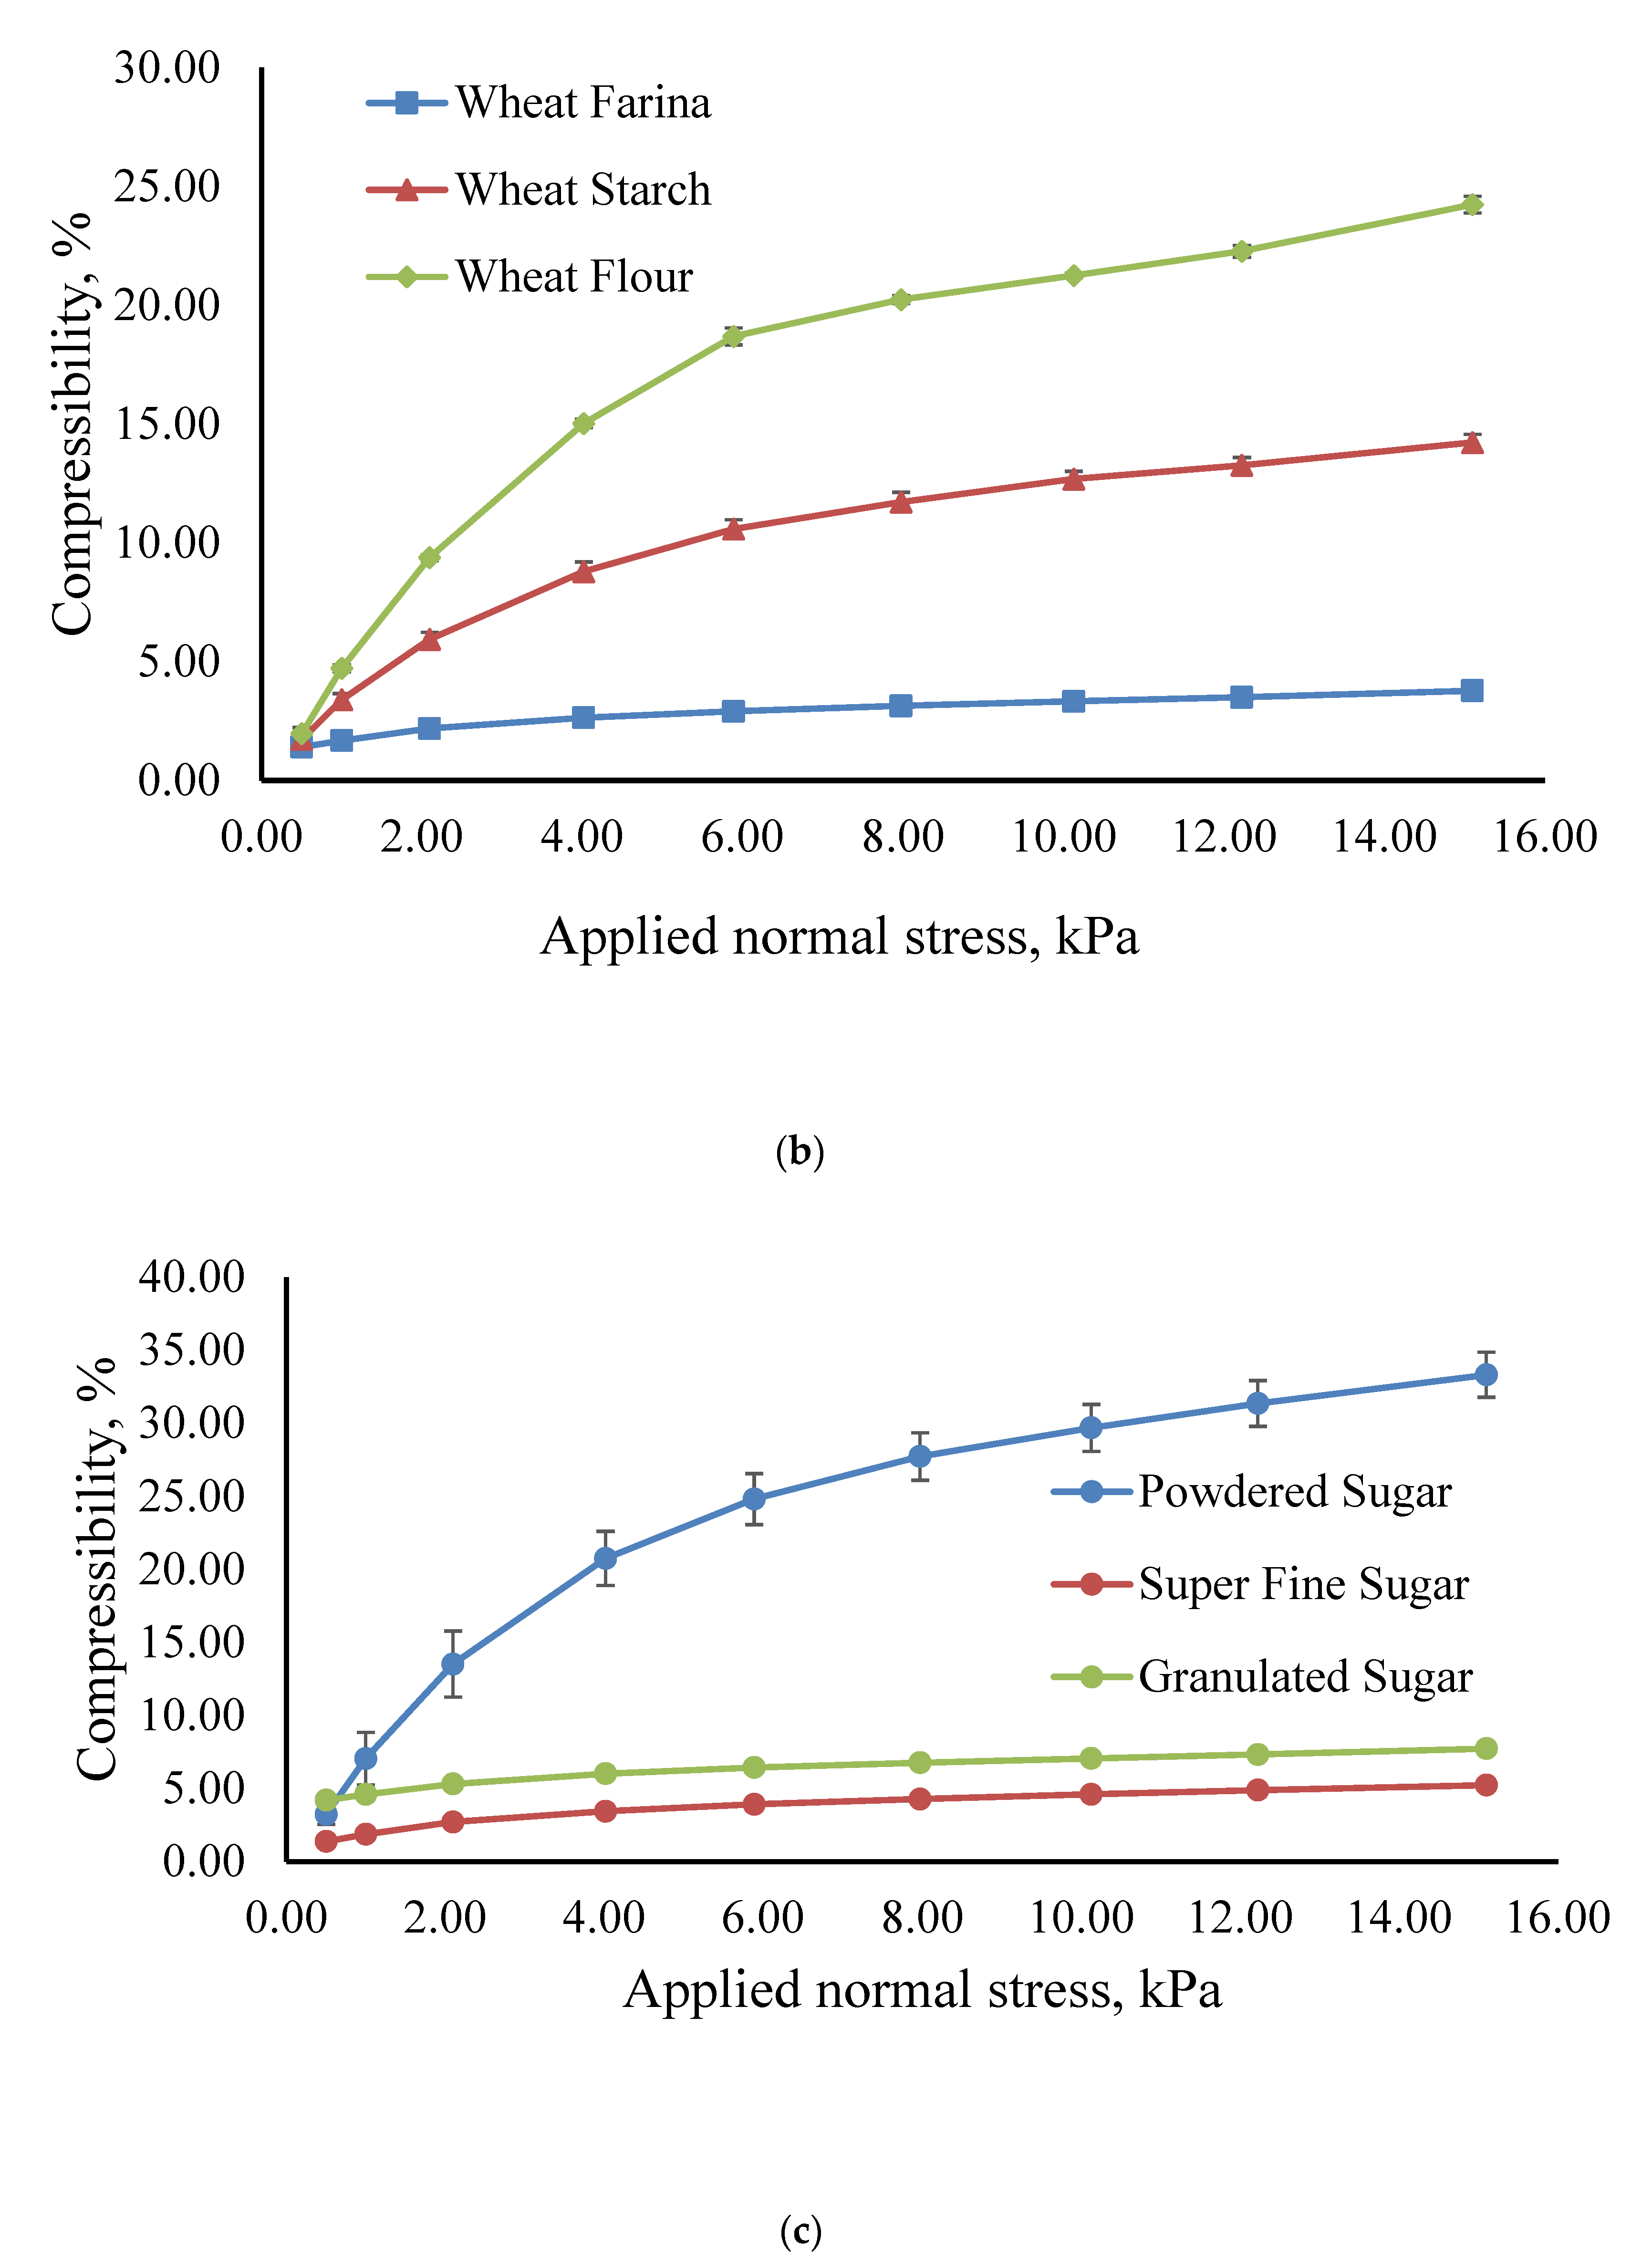
The compressibility tests results showed a correlation with the cohesion results for corn flour, wheat flour, as they had the highest cohesion value and was compressed the most (Figure 3). However, corn meal was shown to be more cohesive but less compressible than corn starch, despite having a higher cohesion value. Like corn and wheat powders, sugar showed a correlation between cohesion and compressibility (Figure 3c). Powdered sugar had the highest cohesion of any of the nine powders tested and was the most compressible, as well. Both superfine and granulated sugars had low cohesion values, which was reflected in a low compressibility (comparatively lower compressibility for superfine than granulated sugar, to match with the comparatively lower cohesion value). These results contribute to the hypothesis that the constant rotational stress in the previous test fluidized corn starch and yielded artificially lowered results. Cohesive powders have interparticle forces that create bridges and void spaces in a given volume, whereas non-cohesive powders tend to flow freely to occupy as much of a given volume as possible. The latter results in very little compressibility due to the lack of void space available for particles to nestle into when force is applied. The former, however, has much more space (further increasing as cohesiveness increases) that allows for particles to compact, resulting in increasing compressibility in tandem with increasing cohesive properties [15].

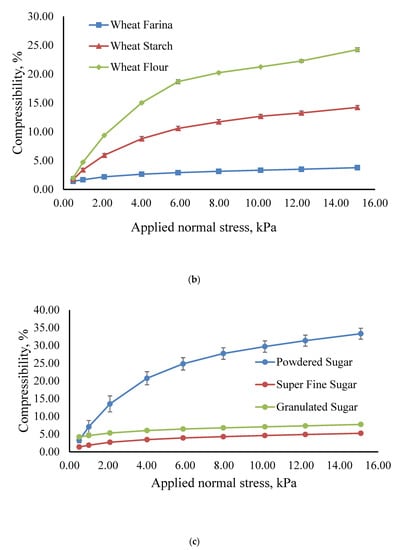
Figure 3.
Effect of applied normal stress on compressibility of (a) corn (b) wheat, and (c) sugar powders.
3.6. Wall Friction Angle (WFA)
The wall friction testing showed that the wall friction angle decreases with increment in particle size for corn and wheat powders (Table 3). A greater decrease in the wall friction angle is observed between corn starch and corn flour than from corn flour to corn meal, similar to the trends cohesion values (Table 3). This indicates a relationship between cohesion and wall friction: an increase in interparticle forces results in a decrease in the impact of external forces, such as friction from a wall. Due to the differences in particle sizes between wheat flour and farina was much less than corn flour and meal, the values for wheat were much closer in this test. Additional forces, such as interparticle friction or cohesion, may play a role in these values as well; a greater internal influence may negate or lessen the effect of external forces applied to a powder.
The wall friction testing for sugar powders yielded results that appear to run contrary to the corn and wheat powders (Table 3). The cohesion values had an inverse relationship with wall friction angle of corn and wheat; particle size appeared to have an inverse correlation with wall friction angle for sugar. This could be due to the differences in surface chemical composition of the sugar powders when compared to that of wheat and corn powders.
4. Conclusions
For starch-based powders, energy per unit mass tends to decrease as particle size increases. The larger particles also flow more readily, which makes them ideal for systems such as extruders where flowability is an important factor that controls formulation flexibility and production rates, while granulated sugar was shown to be much higher in energy consumption in confined and unconfined flow. All these experiments were run at ambient moisture contents, which are very much different from that of the extruder moisture contents, and the effect of moisture will be studied in future research. As extruder barrels completely encase the food powders, the wall friction values determined in this study will be useful in predicting the flow of the tested food powders. The determined shear and dynamic flow property values also correspond to granular flow in an extruder. Thus, the efficiency of the extruder screw to move different formulations or mixes from the beginning of the barrel to the subsequent zones can be predicted and potentially altered based on the type of powder, to achieve maximum efficiency.
The stability and flow rate indices illustrate the impact that changing the screw speed would have on these food powders, as well as the impact of using a gravimetric feed system into the process-with powders that have an SI smaller or larger than 1 (essentially every tested powder, to varying degrees of severity), volume will change to be greater or lesser, respectively, than the initial volume, and could lead to under- or over-feeding the extruder. Cohesion results, in tandem with SBFE and FF results provide an insight to the working principle of the extruder’s feeding zone, as understanding the impendence or propensity to flow of a powder can allow proactive modifications to be made to a system. Changes to recipes, increasing or reducing screw speed at start-up (or process throughout) to ensure material is sufficiently conveyed forward, or adding water to agglomerate or reduce the intensity of interparticle forces and thus aid in forward conveying are just some of the potential solutions for a more efficient extrusion process.
Author Contributions
Conceptualization, S.A.; methodology, C.M., R.P.K.A. and S.A.; formal analysis, C.M. and K.S.; investigation, C.M., S.A. and K.S.; resources, R.P.K.A. and S.A.; data curation, C.M. and K.S.; writing—original draft preparation, C.M.; writing—review and editing, K.S. and S.A.; visualization, C.M.; supervision, S.A.; project administration, S.A.; funding acquisition, S.A. All authors have read and agreed to the published version of the manuscript.
Funding
This research received no external funding.
Institutional Review Board Statement
Not applicable.
Informed Consent Statement
Not applicable.
Data Availability Statement
Data is contained within the article.
Acknowledgments
The authors would like to acknowledge Wenger Manufacturing, Inc. (Sabetha, KS) for their support to the Kansas State University Extrusion Lab and Eric Maichel for his assistance with the extrusion visualization studies.
Conflicts of Interest
The authors declare no conflict of interest.
References
- Freeman, R.E. The Flowability of Powder-an Empirical Approach. In Powder to Bulk/International Conference on Powder and Bulk Solids Handling International Conference on Powder and Bulk Solids Handling; Wiley: New York, NY, USA, 2000; pp. 545–556. [Google Scholar]
- Alavi, S.; Ambrose, R.P.K. Particulate Flow and Agglomeration in Food Extrusion. In Production, Handling and Characterization of Particulate Materials; Springer: Cham, Germany, 2016; pp. 257–289. [Google Scholar]
- Yamane, K.; Nakagawa, M.; Altobelli, S.A.; Tanaka, T.; Tsuji, Y. Steady Particulate Flows in a Horizontal Rotating Cylinder. Phys. Fluids. 1998, 10, 1419–1427. [Google Scholar] [CrossRef]
- Dury, C.M.; Ristow, G.H.; Moss, J.L.; Nakagawa, M. Boundary Effects on the Angle of Repose in Rotating Cylinders. Phys. Rev. E. 1998, 57, 4491–4497. [Google Scholar] [CrossRef] [Green Version]
- Juliano, P.; Muhunthan, B.; Barbosa-Cánovas, G.V. Flow and Shear Descriptors of Preconsolidated Food Powders. J. Food Eng. 2006, 72, 157–166. [Google Scholar] [CrossRef]
- Fitzpatrick, J.J.; Barringer, S.A.; Iqbal, T. Flow Property Measurement of Food Powders and Sensitivity of Jenike’s Hopper Design Methodology to the Measured Values. J. Food Eng. 2004, 61, 399–405. [Google Scholar] [CrossRef]
- AOAC International. Official Methods of Analysis, 17th ed.; AOAC International: Gaithersburg, MD, USA, 2006. [Google Scholar]
- ASABE Standards. S3194.4: Method of Determining and Expressing Fineness of Feed Materials by Sieving; ASABE Standards: St. Joseph, MI, USA, 2008. [Google Scholar]
- Jenike, A.W. Gravity Flow of Bulk Solids; Bulletin No. 108; The University of Utah: Salt Lake City, UT, USA, 1961. [Google Scholar]
- Thomas, J.; Schubert, H. Particle Characterization. Proc. Partec. 1979, 79, 301–319. [Google Scholar]
- Rogé, B.; Mathlouthi, M. Caking of Sucrose Crystals: Effect of Water Content and Crystal Size. Zuckerindudtrie 2000, 125, 336–340. [Google Scholar]
- Siliveru, K.; Kwek, J.W.; Lau, G.M.L.; Ambrose, R.P.K. An Image Analysis Approach to Understand the Differences in Flour Particle Surface and Shape Characteristics. Cereal Chem. 2016, 93, 234–241. [Google Scholar] [CrossRef]
- Marston, J.O.; Li, E.Q.; Thoroddsen, S.T. Evolution of Fluid-like Granular Ejecta Generated by Sphere Impact. J. Fluid Mech. 2012, 704, 5–36. [Google Scholar] [CrossRef] [Green Version]
- Stasiak, M.; Molenda, M. Direct Shear Testing of Flowability of Food Powders. Res. Agric. Eng. 2004, 50, 6–10. [Google Scholar] [CrossRef] [Green Version]
- Peleg, M.; Mannheim, C.H.; Passy, N. Flow Properties of Some Food Powders. J. Food Sci. 1973, 38, 959–964. [Google Scholar] [CrossRef]
Publisher’s Note: MDPI stays neutral with regard to jurisdictional claims in published maps and institutional affiliations. |
© 2022 by the authors. Licensee MDPI, Basel, Switzerland. This article is an open access article distributed under the terms and conditions of the Creative Commons Attribution (CC BY) license (https://creativecommons.org/licenses/by/4.0/).