
Validation of Serum Biomarkers That Complement CA19-9 in Detecting Early Pancreatic Cancer Using Electrochemiluminescent-Based Multiplex Immunoassays

Abstract
:1. Introduction
2. Materials and Methods
2.1. Specimens
2.2. Reagents and Antibodies
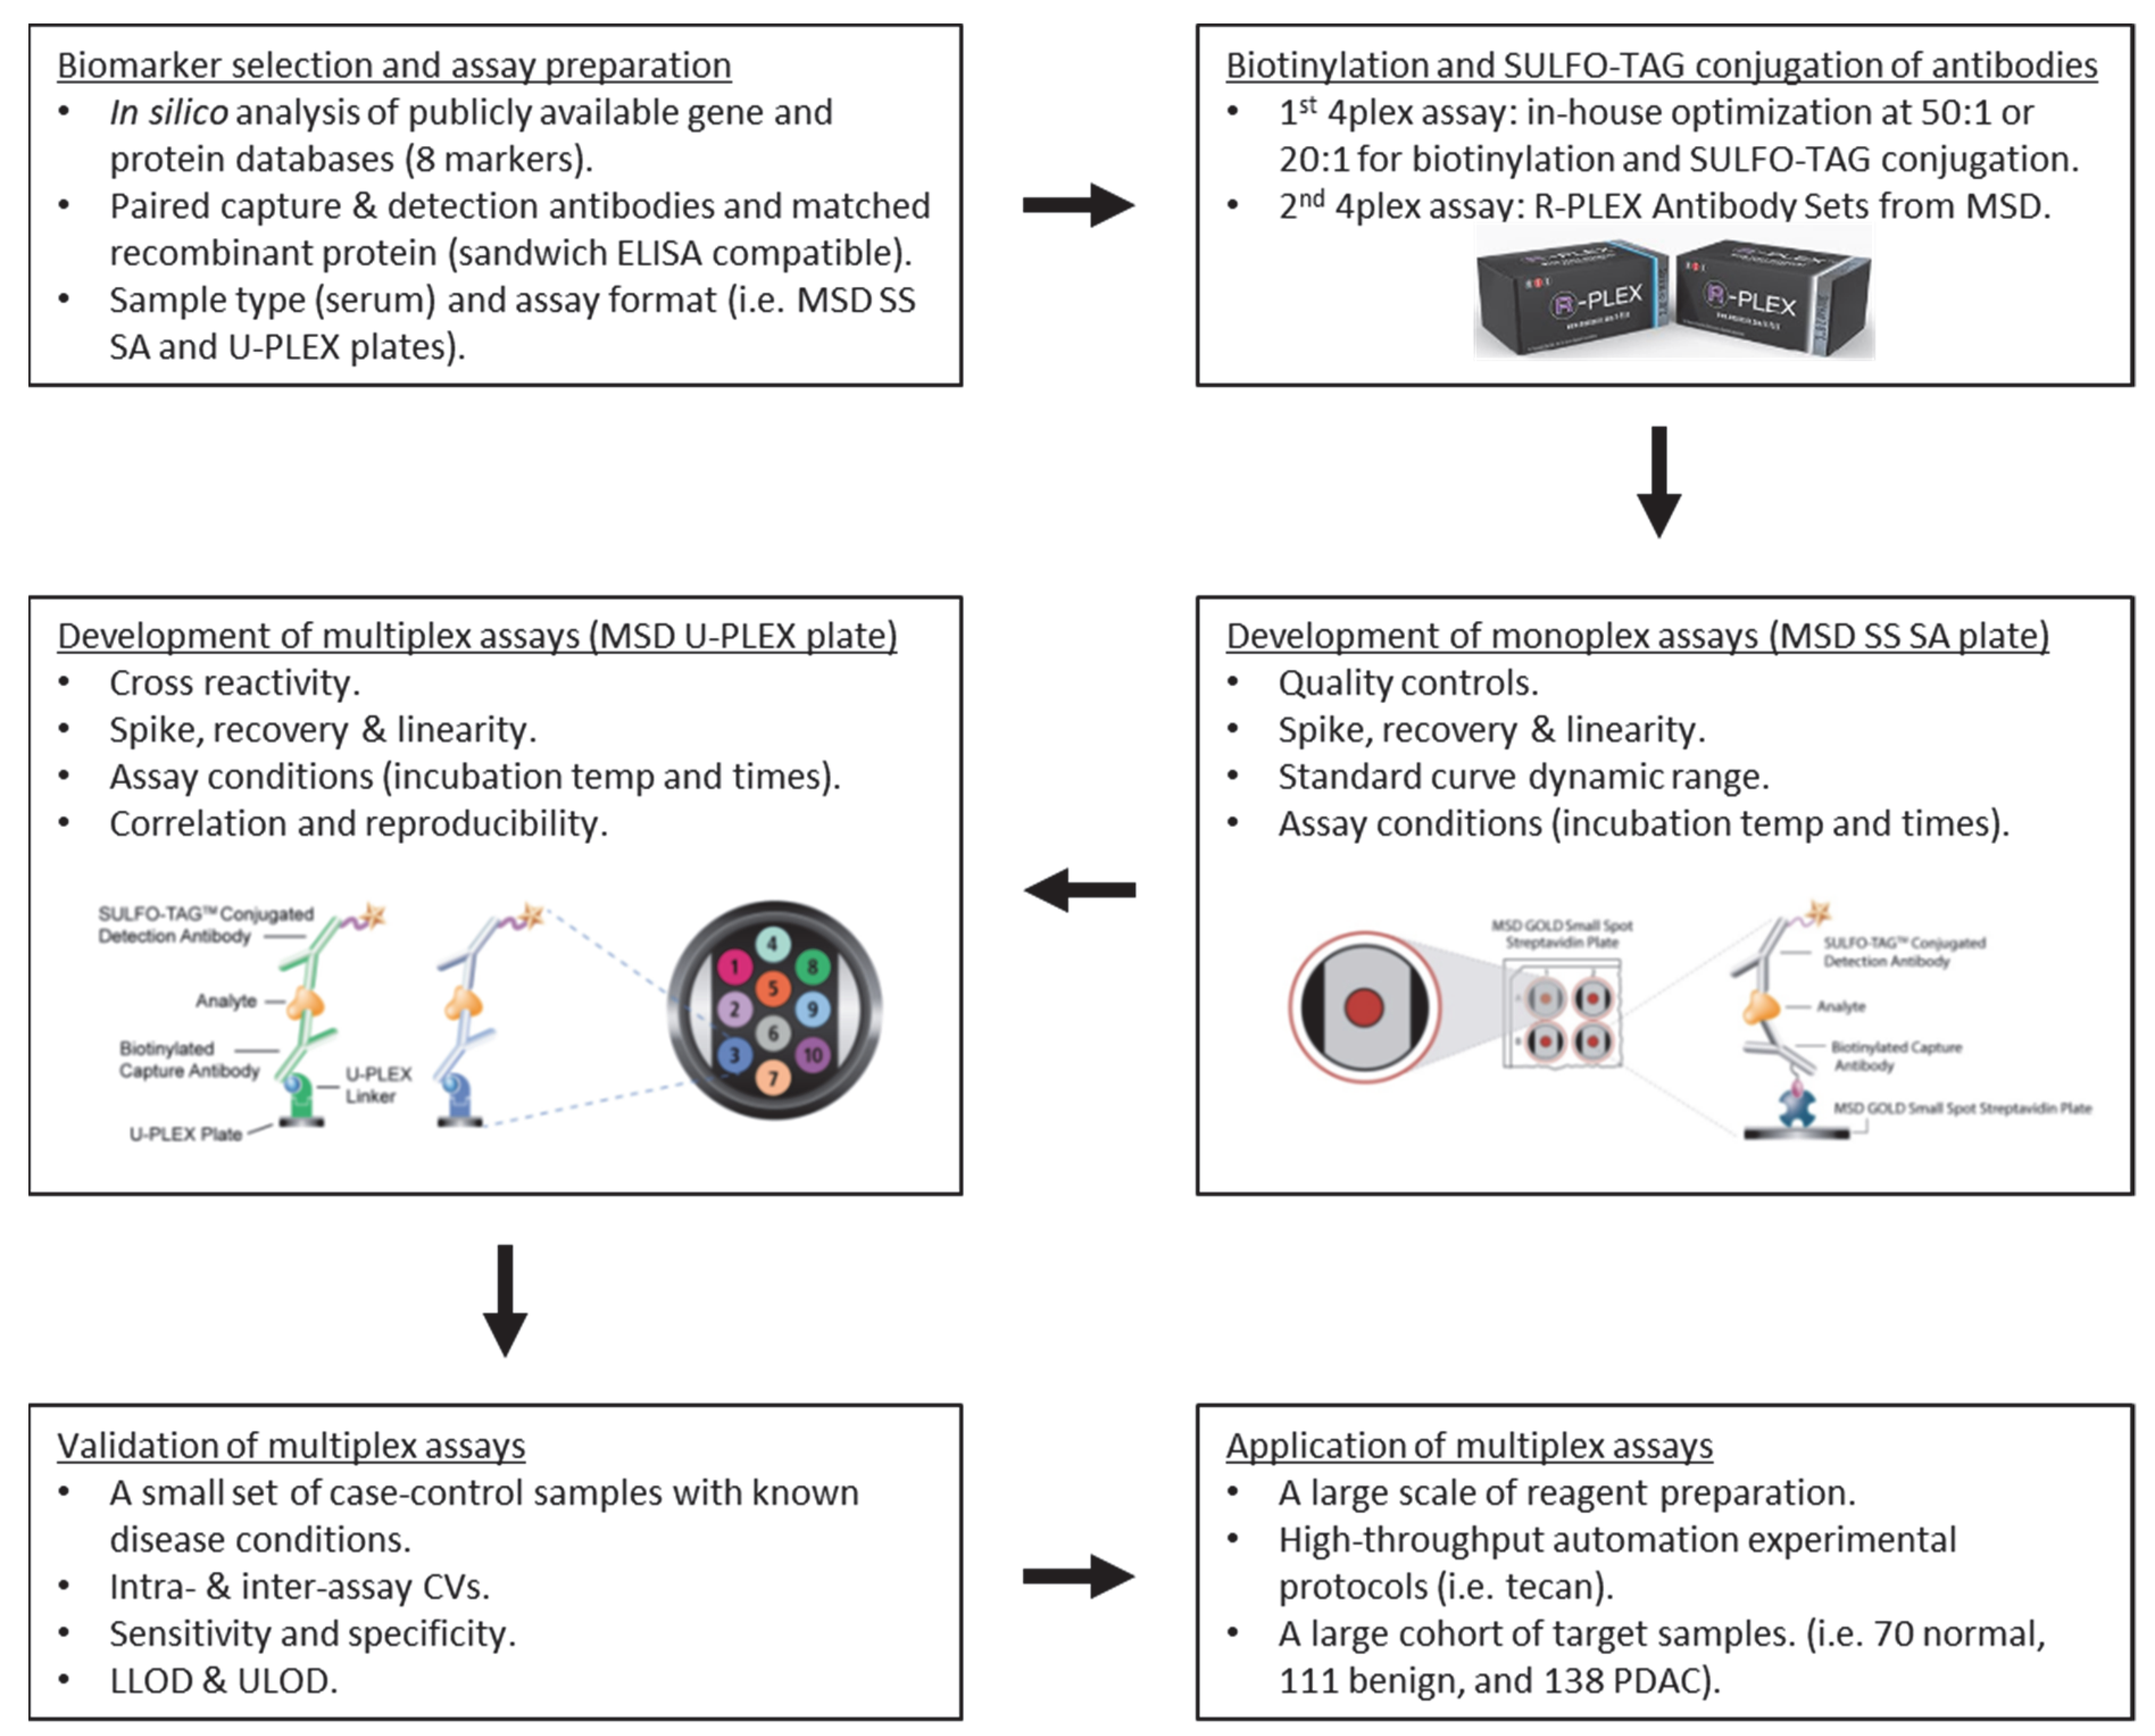
2.3. Biotinylation and SULFO-TAG Conjugation of Antibodies
2.4. Multiplex Immunoassay
2.5. Data Analysis
3. Results
4. Discussion
5. Conclusions
Supplementary Materials
Author Contributions
Funding
Institutional Review Board Statement
Conflicts of Interest
Abbreviations
References
- Michaud, D.S. Epidemiology of pancreatic cancer. Minerva Chir. 2004, 59, 99–111. [Google Scholar]
- Vincent, A.; Herman, J.; Schulick, R.; Hruban, R.H.; Goggins, M. Pancreatic cancer. Lancet 2011, 378, 607–620. [Google Scholar] [CrossRef]
- Brand, R.E.; Matamoros, A. Imaging techniques in the evaluation of adenocarcinoma of the pancreas. Dig. Dis. 1998, 16, 242–252. [Google Scholar] [CrossRef] [PubMed]
- Duffy, M.J.; Sturgeon, C.; Lamerz, R.; Haglund, C.; Holubec, V.L.; Klapdor, R.; Nicolini, A.; Topolcan, O.; Heinemann, V. Tumor markers in pancreatic cancer: A European Group on Tumor Markers (EGTM) status report. Ann. Oncol. 2010, 21, 441–447. [Google Scholar] [CrossRef] [PubMed]
- Goonetilleke, K.S.; Siriwardena, A.K. Systematic review of carbohydrate antigen (CA 19-9) as a biochemical marker in the diagnosis of pancreatic cancer. Eur. J. Surg. Oncol. (EJSO) 2007, 33, 266–270. [Google Scholar] [CrossRef] [PubMed]
- Locker, G.Y.; Hamilton, S.; Harris, J.; Jessup, J.M.; Kemeny, N.; Macdonald, J.S.; Somerfield, M.R.; Hayes, D.F.; Bast, R.C., Jr.; ASCO. ASCO 2006 update of recommendations for the use of tumor markers in gastrointestinal cancer. J. Clin. Oncol. 2006, 24, 5313–5327. [Google Scholar] [CrossRef]
- Fu, Q.; Zhu, J.; Van Eyk, J.E. Comparison of multiplex immunoassay platforms. Clin. Chem. 2010, 56, 314–318. [Google Scholar] [CrossRef] [PubMed]
- Houser, B. Bio-Rad’s Bio-Plex(R) suspension array system, xMAP technology overview. Arch. Physiol. Biochem. 2012, 118, 192–196. [Google Scholar] [CrossRef] [PubMed] [Green Version]
- Song, J.; Ma, S.; Sokoll, L.J.; Eguez, R.V.; Hoti, N.; Zhang, H.; Mohr, P.; Dua, R.; Patil, D.; May, K.D.; et al. A panel of selected serum protein biomarkers for the detection of aggressive prostate cancer. Theranostics 2021, 11, 6214–6224. [Google Scholar] [CrossRef] [PubMed]
- Song, J.; Merbs, S.L.; Sokoll, L.J.; Chan, D.W.; Zhang, Z. A multiplex immunoassay of serum biomarkers for the detection of uveal melanoma. Clin. Proteom. 2019, 16, 10. [Google Scholar] [CrossRef] [PubMed] [Green Version]
- Song, J.; Sokoll, L.J.; Pasay, J.J.; Rubin, A.L.; Li, H.; Bach, D.M.; Chan, D.W.; Zhang, Z. Identification of Serum Biomarker Panels for the Early Detection of Pancreatic Cancer. Cancer Epidemiol. Biomark. Prev. A Publ. Am. Assoc. Cancer Res. Cosponsored Am. Soc. Prev. Oncol. 2019, 28, 174–182. [Google Scholar] [CrossRef] [PubMed] [Green Version]
- Song, J.; Zhang, Z.; Chan, D.W. Detection of Uveal Melanoma by Multiplex Immunoassays of Serum Biomarkers. Methods Mol. Biol. 2021, 2265, 447–459. [Google Scholar] [CrossRef] [PubMed]
- Chan, A.; Prassas, I.; Dimitromanolakis, A.; Brand, R.E.; Serra, S.; Diamandis, E.P.; Blasutig, I.M. Validation of biomarkers that complement CA19.9 in detecting early pancreatic cancer. Clin. Cancer Res. 2014, 20, 5787–5795. [Google Scholar] [CrossRef] [PubMed] [Green Version]
- Cwik, G.; Wallner, G.; Skoczylas, T.; Ciechanski, A.; Zinkiewicz, K. Cancer antigens 19-9 and 125 in the differential diagnosis of pancreatic mass lesions. Arch. Surg. 2006, 141, 968–973, discussion 974. [Google Scholar] [CrossRef] [Green Version]
- Haglund, C. Tumour marker antigen CA125 in pancreatic cancer: A comparison with CA19-9 and CEA. Br. J. Cancer 1986, 54, 897–901. [Google Scholar] [CrossRef] [PubMed] [Green Version]
- Luo, G.; Xiao, Z.; Long, J.; Liu, Z.; Liu, L.; Liu, C.; Xu, J.; Ni, Q.; Yu, X. CA125 is superior to CA19-9 in predicting the resectability of pancreatic cancer. J. Gastrointest. Surg. 2013, 17, 2092–2098. [Google Scholar] [CrossRef] [PubMed]
- Xu, H.X.; Liu, L.; Xiang, J.F.; Wang, W.Q.; Qi, Z.H.; Wu, C.T.; Liu, C.; Long, J.; Xu, J.; Ni, Q.X.; et al. Postoperative serum CEA and CA125 levels are supplementary to perioperative CA19-9 levels in predicting operative outcomes of pancreatic ductal adenocarcinoma. Surgery 2017, 161, 373–384. [Google Scholar] [CrossRef] [Green Version]
- Wu, L.; Dai, Z.Y.; Qian, Y.H.; Shi, Y.; Liu, F.J.; Yang, C. Diagnostic value of serum human epididymis protein 4 (HE4) in ovarian carcinoma: A systematic review and meta-analysis. Int. J. Gynecol. Cancer 2012, 22, 1106–1112. [Google Scholar] [CrossRef]
- Huang, T.; Jiang, S.W.; Qin, L.; Senkowski, C.; Lyle, C.; Terry, K.; Brower, S.; Chen, H.; Glasgow, W.; Wei, Y.; et al. Expression and diagnostic value of HE4 in pancreatic adenocarcinoma. Int. J. Mol. Sci. 2015, 16, 2956–2970. [Google Scholar] [CrossRef] [Green Version]
- Ge, X.; Zhang, X.L.; Li, M.; Deng, F.; Shan, W.L.; Chen, S.H. The value of serum HE4 in pancreatic adenocarcinoma diagnosis. Int. J. Clin. Exp. Pathol. 2017, 10, 5618–5623. [Google Scholar]
- Chen, H.M.; Tsai, C.H.; Hung, W.C. Foretinib inhibits angiogenesis, lymphangiogenesis and tumor growth of pancreatic cancer in vivo by decreasing VEGFR-2/3 and TIE-2 signaling. Oncotarget 2015, 6, 14940–14952. [Google Scholar] [CrossRef] [Green Version]
- Li, D.; Chiu, H.; Gupta, V.; Chan, D.W. Validation of a multiplex immunoassay for serum angiogenic factors as biomarkers for aggressive prostate cancer. Clin. Chim. Acta 2012, 413, 1506–1511. [Google Scholar] [CrossRef] [PubMed] [Green Version]
- Brown, J.M.; Vessella, R.L.; Kostenuik, P.J.; Dunstan, C.R.; Lange, P.H.; Corey, E. Serum osteoprotegerin levels are increased in patients with advanced prostate cancer. Clin. Cancer Res. 2001, 7, 2977–2983. [Google Scholar] [PubMed]
- Holen, I.; Shipman, C.M. Role of osteoprotegerin (OPG) in cancer. Clin. Sci. 2006, 110, 279–291. [Google Scholar] [CrossRef] [PubMed] [Green Version]
- Brand, R.E.; Nolen, B.M.; Zeh, H.J.; Allen, P.J.; Eloubeidi, M.A.; Goldberg, M.; Elton, E.; Arnoletti, J.P.; Christein, J.D.; Vickers, S.M.; et al. Serum biomarker panels for the detection of pancreatic cancer. Clin. Cancer Res. 2011, 17, 805–816. [Google Scholar] [CrossRef] [PubMed] [Green Version]
- Kemik, O.; Purisa, S.; Kemik, A.S.; Tuzun, S. Increase in the circulating level of hepatocyte growth factor in pancreatic cancer patients. Bratisl. Lek. Listy 2009, 110, 627–629. [Google Scholar]
- Cohen, J.D.; Javed, A.A.; Thoburn, C.; Wong, F.; Tie, J.; Gibbs, P.; Schmidt, C.M.; Yip-Schneider, M.T.; Allen, P.J.; Schattner, M.; et al. Combined circulating tumor DNA and protein biomarker-based liquid biopsy for the earlier detection of pancreatic cancers. Proc. Natl. Acad. Sci. USA 2017, 114, 10202–10207. [Google Scholar] [CrossRef] [PubMed] [Green Version]
- Boeck, S.; Wittwer, C.; Heinemann, V.; Haas, M.; Kern, C.; Stieber, P.; Nagel, D.; Holdenrieder, S. Cytokeratin 19-fragments (CYFRA 21-1) as a novel serum biomarker for response and survival in patients with advanced pancreatic cancer. Br. J. Cancer 2013, 108, 1684–1694. [Google Scholar] [CrossRef] [Green Version]
- Brockmann, J.G.; St Nottberg, H.; Glodny, B.; Heinecke, A.; Senninger, N.J. CYFRA 21-1 serum analysis in patients with esophageal cancer. Clin. Cancer Res. 2000, 6, 4249–4252. [Google Scholar] [PubMed]
- Haas, M.; Kern, C.; Kruger, S.; Michl, M.; Modest, D.P.; Giessen, C.; Schulz, C.; von Einem, J.C.; Ormanns, S.; Laubender, R.P.; et al. Assessing novel prognostic serum biomarkers in advanced pancreatic cancer: The role of CYFRA 21-1, serum amyloid A, haptoglobin, and 25-OH vitamin D3. Tumour Biol. 2015, 36, 2631–2640. [Google Scholar] [CrossRef]
- Nakata, B.; Takashima, T.; Ogawa, Y.; Ishikawa, T.; Hirakawa, K. Serum CYFRA 21-1 (cytokeratin-19 fragments) is a useful tumour marker for detecting disease relapse and assessing treatment efficacy in breast cancer. Br. J. Cancer 2004, 91, 873–878. [Google Scholar] [CrossRef] [PubMed] [Green Version]
- Pujol, J.L.; Molinier, O.; Ebert, W.; Daures, J.P.; Barlesi, F.; Buccheri, G.; Paesmans, M.; Quoix, E.; Moro-Sibilot, D.; Szturmowicz, M.; et al. CYFRA 21-1 is a prognostic determinant in non-small-cell lung cancer: Results of a meta-analysis in 2063 patients. Br. J. Cancer 2004, 90, 2097–2105. [Google Scholar] [CrossRef]
- Leung, F.; Bernardini, M.Q.; Brown, M.D.; Zheng, Y.; Molina, R.; Bast, R.C., Jr.; Davis, G.; Serra, S.; Diamandis, E.P.; Kulasingam, V. Validation of a Novel Biomarker Panel for the Detection of Ovarian Cancer. Cancer Epidemiol. Biomark. Prev. A Publ. Am. Assoc. Cancer Res. Cosponsored Am. Soc. Prev. Oncol. 2016, 25, 1333–1340. [Google Scholar] [CrossRef] [PubMed] [Green Version]
- Moris, D.; Damaskos, C.; Spartalis, E.; Papalampros, A.; Vernadakis, S.; Dimitroulis, D.; Griniatsos, J.; Felekouras, E.; Nikiteas, N. Updates and Critical Evaluation on Novel Biomarkers for the Malignant Progression of Intraductal Papillary Mucinous Neoplasms of the Pancreas. Anticancer Res. 2017, 37, 2185–2194. [Google Scholar] [CrossRef] [Green Version]
- Ballehaninna, U.K.; Chamberlain, R.S. Biomarkers for pancreatic cancer: Promising new markers and options beyond CA 19-9. Tumour Biol. 2013, 34, 3279–3292. [Google Scholar] [CrossRef] [PubMed]
- Brosens, L.A.; Hackeng, W.M.; Offerhaus, G.J.; Hruban, R.H.; Wood, L.D. Pancreatic adenocarcinoma pathology: Changing “landscape”. J. Gastrointest. Oncol. 2015, 6, 358–374. [Google Scholar] [CrossRef] [PubMed]
- Tanaka, M. International consensus on the management of intraductal papillary mucinous neoplasm of the pancreas. Ann. Transl. Med. 2015, 3, 286. [Google Scholar] [CrossRef]
- Dumlu, E.G.; Karakoc, D.; Ozdemir, A. Intraductal Papillary Mucinous Neoplasm of the Pancreas: Current Perspectives. Int. Surg. 2015, 100, 1060–1068. [Google Scholar] [CrossRef] [PubMed] [Green Version]
- Springer, S.; Masica, D.L.; Dal Molin, M.; Douville, C.; Thoburn, C.J.; Afsari, B.; Li, L.; Cohen, J.D.; Thompson, E.; Allen, P.J.; et al. A multimodality test to guide the management of patients with a pancreatic cyst. Sci. Transl. Med. 2019, 11. [Google Scholar] [CrossRef]
- Boulaiz, H.; Ramos, M.C.; Grinan-Lison, C.; Garcia-Rubino, M.E.; Vicente, F.; Marchal, J.A. What’s new in the diagnosis of pancreatic cancer: A patent review (2011-present). Expert Opin. Ther. Pat. 2017, 27, 1319–1328. [Google Scholar] [CrossRef] [PubMed]
- Cao, L.; Huang, C.; Cui Zhou, D.; Hu, Y.; Lih, T.M.; Savage, S.R.; Krug, K.; Clark, D.J.; Schnaubelt, M.; Chen, L.; et al. Proteogenomic characterization of pancreatic ductal adenocarcinoma. Cell 2021, 184, 5031–5052.e26. [Google Scholar] [CrossRef] [PubMed]
- Loosen, S.H.; Neumann, U.P.; Trautwein, C.; Roderburg, C.; Luedde, T. Current and future biomarkers for pancreatic adenocarcinoma. Tumour Biol. 2017, 39, 1010428317692231. [Google Scholar] [CrossRef] [PubMed] [Green Version]
- Bristow, R.E.; Smith, A.; Zhang, Z.; Chan, D.W.; Crutcher, G.; Fung, E.T.; Munroe, D.G. Ovarian malignancy risk stratification of the adnexal mass using a multivariate index assay. Gynecol. Oncol. 2013, 128, 252–259. [Google Scholar] [CrossRef] [PubMed]
- Zhang, Z. An In Vitro Diagnostic Multivariate Index Assay (IVDMIA) for Ovarian Cancer: Harvesting the Power of Multiple Biomarkers. Rev. Obstet. Gynecol. 2012, 5, 35–41. [Google Scholar] [PubMed]
- Zhang, Z.; Chan, D.W. The road from discovery to clinical diagnostics: Lessons learned from the first FDA-cleared in vitro diagnostic multivariate index assay of proteomic biomarkers. Cancer Epidemiol. Biomark. Prev. A Publ. Am. Assoc. Cancer Res. Cosponsored Am. Soc. Prev. Oncol. 2010, 19, 2995–2999. [Google Scholar] [CrossRef] [Green Version]

| Marker Name | CA-125 | HE4 | KRT19 | FOLR1 | CEA | HGF | OPG | Tie-2 | |
|---|---|---|---|---|---|---|---|---|---|
| Quality control, Mean, pg/mL (Intra-/inter-assay CV%) | Sigma | 1116.3 (4.4/11.1) | 302.4 (3.8/2.5) | 1103.1 (10.6/14.0) | 333.0 (5.2/5.7) | 260.0 (2.2/5.4) | 240.2 (2.7/3.4) | 217.4 (5.6/5.4) | 6230.8 (3.2/3.5) |
| Low | 1873.7 (5.8/9.1) | 83.0 (7.8/8.8) | 726.7 (4.7/10.6) | 393.4 (3.9/11.0) | |||||
| High | 84,223.9 (6.6/9.6) | 1116.8 (7.9/9.6) | 897.7 (9.3/6.0) | 899.5 (4.3/8.2) | |||||
| %Recovery, mean (range) | 96 (87–110) | 99 (81–110) | 102 (91–124) | 101 (91–108) | 101 (95–126) | 111 (81–149) | 103 (73–124) | 100 (89–116) | |
| HillSlope | 0.9400 | 0.9800 | 1.1700 | 0.8700 | 0.9999 | 1.3771 | 1.1541 | 0.9974 | |
| R2 | 0.9999 | 0.9999 | 0.9999 | 0.9978 | 0.9998 | 0.9982 | 0.9926 | 1.0000 | |
| LLOD (pg/mL) | 8.5 | 0.0 | 98.4 | 4.7 | 1.5 | 9.0 | 7.7 | 1.2 | |
| ULOD (pg/mL) | 500,000.0 | 7500.0 | 37,500.0 | 175,000.0 | 50,000.0 | 12,000.0 | 100,000.0 | 40,000.0 | |
| 4-plex vs. Monoplex, Pearson R * | 0.9969 | 0.9924 | 0.9655 | 0.9668 | 0.999 | 0.9892 | 0.9599 | 0.9883 | |
| 4-plex vs. Commercial kit, Pearson R # | 0.9715 | ND | ND | ND | ND | ND | ND | ND |
| Variables | Number (%) |
|---|---|
| Total | 319 |
| Healthy controls | 70 (21.9) |
| Age (years) | |
| Mean ± SD | 33 ± 14 |
| Range (Median) | 21–67 (27) |
| Gender | |
| Male | 35 (50.0) |
| Female | 35 (50.0) |
| Benign conditions | 111 (34.8) |
| Age (years) | |
| Mean ± SD | 57 ± 15 |
| Range (Median) | 13–84 (59) |
| Gender | |
| Male | 62 (55.9) |
| Female | 49 (44.1) |
| CP | 58 (52.3) |
| IPMN | 53 (47.7) |
| PDAC | 138 (43.3) |
| Age (years) | |
| Mean ± SD | 65 ± 10 |
| Range (Median) | 30–92 (65) |
| Gender | |
| Male | 64 (46.4) |
| Female | 74 (53.6) |
| Early stage | 56 (40.6) |
| IA/IB/IIA/IIB | 5/6/9/36 |
| Late stage | 82 (59.4) |
| III/IV | 19/63 |
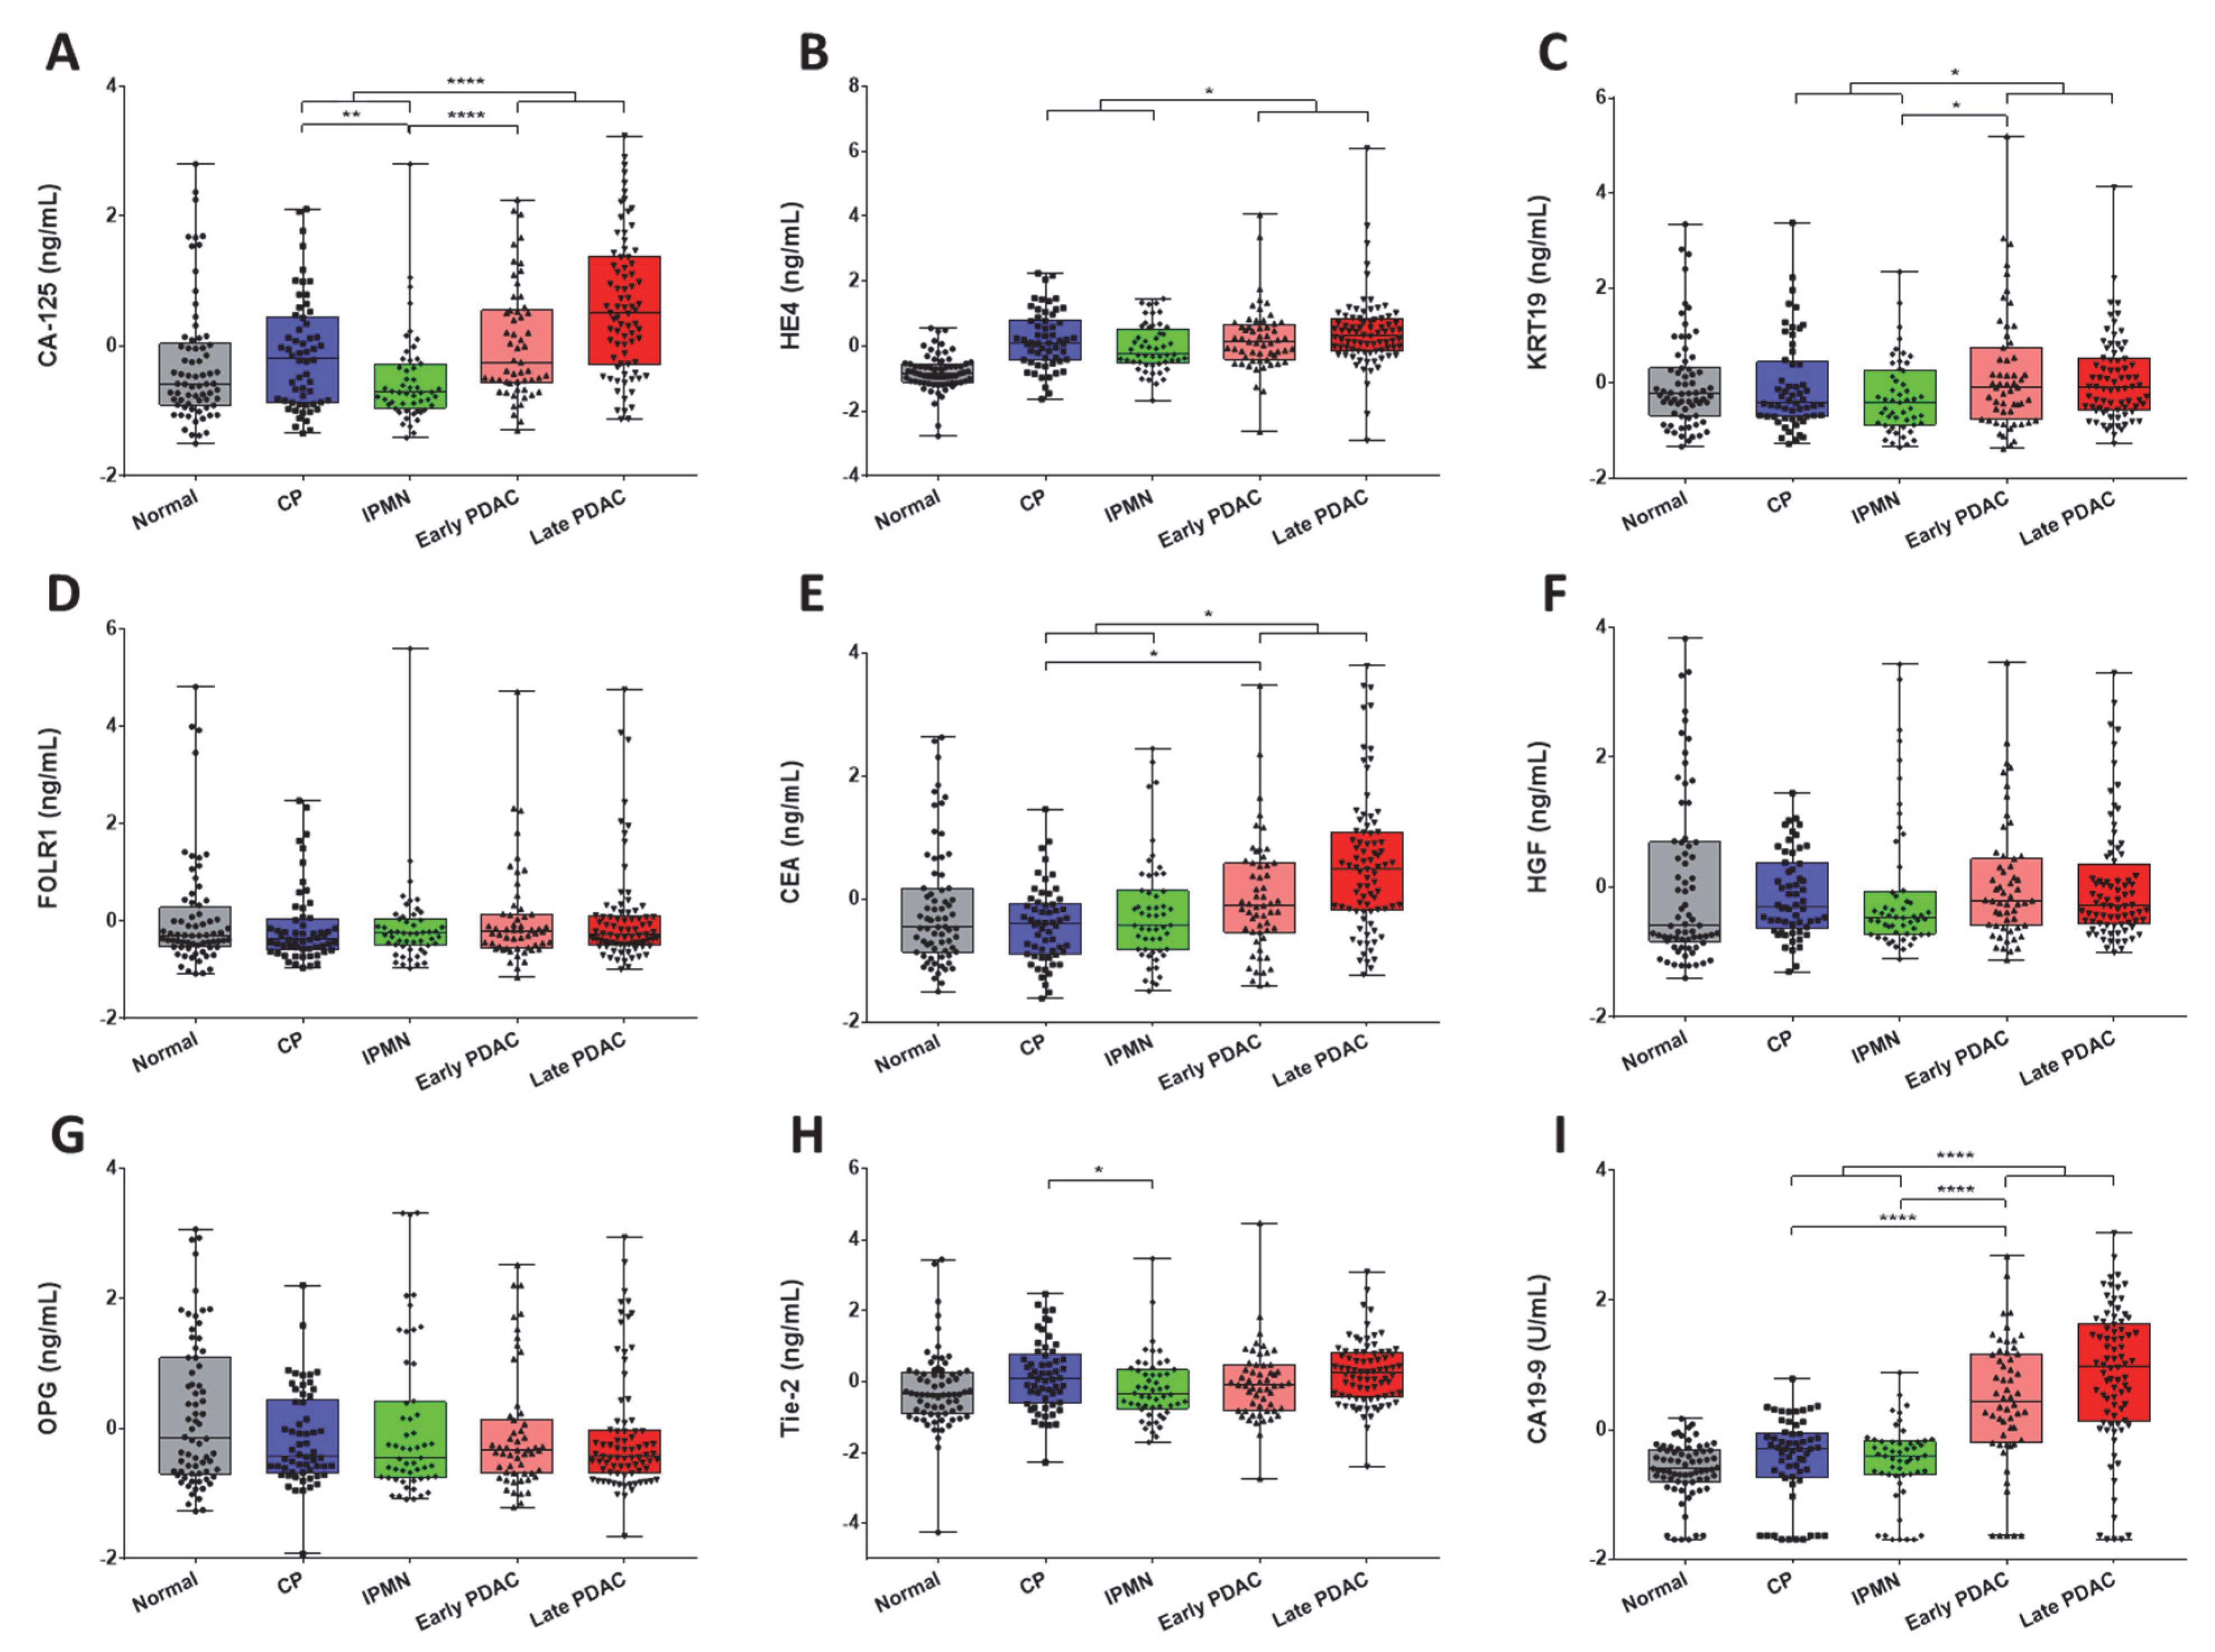
| Biomarker | Subgroup | Number | Min | Max | Median | Mean | IQR |
|---|---|---|---|---|---|---|---|
| CA-125 | Controls | 70 | 1.7 | 505.9 | 5.8 | 29.9 | 9.0 |
| CP | 58 | 2.1 | 201.4 | 9.8 | 23.0 | 18.2 | |
| IPMN | 52 a | 1.9 | 506.1 | 4.8 | 17.4 | 4.8 | |
| Early stage | 55 a | 2.2 | 244.7 | 8.9 | 29.6 | 19.8 | |
| Late stage | 79 a | 2.8 | 896.7 | 24.4 | 79.0 | 67.4 | |
| HE4 | Controls | 70 | 0.4 | 1.8 | 1.0 | 1.0 | 0.3 |
| CP | 58 | 0.7 | 3.9 | 1.5 | 1.7 | 0.8 | |
| IPMN | 52 a | 0.7 | 2.7 | 1.3 | 1.5 | 0.6 | |
| Early stage | 56 | 0.4 | 8.6 | 1.5 | 1.8 | 0.7 | |
| Late stage | 80 a | 0.4 | 21.2 | 1.7 | 2.1 | 0.7 | |
| KRT19 | Controls | 67 a | 0.7 | 115.5 | 2.4 | 7.6 | 2.8 |
| CP | 57 a | 0.7 | 119.1 | 1.9 | 6.6 | 3.2 | |
| IPMN | 51 a | 0.7 | 38.7 | 1.9 | 3.6 | 2.8 | |
| Early stage | 55 a | 0.7 | 866.5 | 2.7 | 24.0 | 5.5 | |
| Late stage | 76 a | 0.8 | 267.6 | 2.7 | 7.9 | 3.6 | |
| FOLR1 | Controls | 68 a | 0.7 | 174.4 | 1.5 | 7.6 | 1.3 |
| CP | 57 a | 0.8 | 20.0 | 1.4 | 2.7 | 0.9 | |
| IPMN | 52 a | 0.8 | 360.5 | 1.6 | 8.7 | 0.8 | |
| Early stage | 55 a | 0.7 | 158.5 | 1.6 | 5.5 | 1.1 | |
| Late stage | 79 a | 0.8 | 165.4 | 1.6 | 6.2 | 1.0 | |
| CEA | Controls | 70 | 0.4 | 55.0 | 1.3 | 4.9 | 2.0 |
| CP | 58 | 0.3 | 13.3 | 1.4 | 1.9 | 1.3 | |
| IPMN | 53 | 0.4 | 44.0 | 1.3 | 3.9 | 1.8 | |
| Early stage | 56 | 0.4 | 152.8 | 2.0 | 6.3 | 3.3 | |
| Late stage | 82 | 0.5 | 224.3 | 4.1 | 14.9 | 6.6 | |
| HGF | Controls | 70 | 1.2 | 57.5 | 2.2 | 6.3 | 3.8 |
| CP | 58 | 1.3 | 9.8 | 2.7 | 3.4 | 2.3 | |
| IPMN | 53 | 1.5 | 43.0 | 2.4 | 5.2 | 1.2 | |
| Early stage | 55 a | 1.5 | 43.8 | 2.9 | 4.9 | 2.5 | |
| Late stage | 80 a | 1.6 | 38.8 | 2.7 | 4.8 | 2.0 | |
| OPG | Controls | 70 | 0.3 | 367.8 | 2.0 | 25.2 | 14.1 |
| CP | 58 | 0.1 | 90.7 | 1.3 | 4.9 | 4.1 | |
| IPMN | 53 | 0.4 | 552.8 | 1.2 | 38.2 | 4.1 | |
| Early stage | 54 a | 0.4 | 150.6 | 1.5 | 10.9 | 2.3 | |
| Late stage | 79 a | 0.2 | 300.4 | 1.3 | 12.7 | 1.6 | |
| Tie-2 | Controls | 70 | 14.2 | 182.1 | 51.6 | 58.1 | 20.3 |
| CP | 58 | 27.3 | 131.9 | 59.9 | 65.0 | 26.5 | |
| IPMN | 53 | 33.0 | 183.8 | 51.5 | 57.4 | 18.8 | |
| Early stage | 55 a | 23.5 | 255.9 | 56.2 | 61.0 | 23.5 | |
| Late stage | 79 a | 26.2 | 162.0 | 63.5 | 65.9 | 25.9 | |
| CA19-9 | Controls | 70 | <0.1 | 71.6 | 11.4 | 15.0 | 13.3 |
| CP | 58 | <0.1 | 203.2 | 20.3 | 31.3 | 33.1 | |
| IPMN | 53 | <0.1 | 386.9 | 16.7 | 28.8 | 18.5 | |
| Early stage | 56 | <0.1 | 27027.8 | 130.8 | 1169.7 | 725.1 | |
| Late stage | 82 | <0.1 | 25110.7 | 354.8 | 1693.2 | 1569.7 |
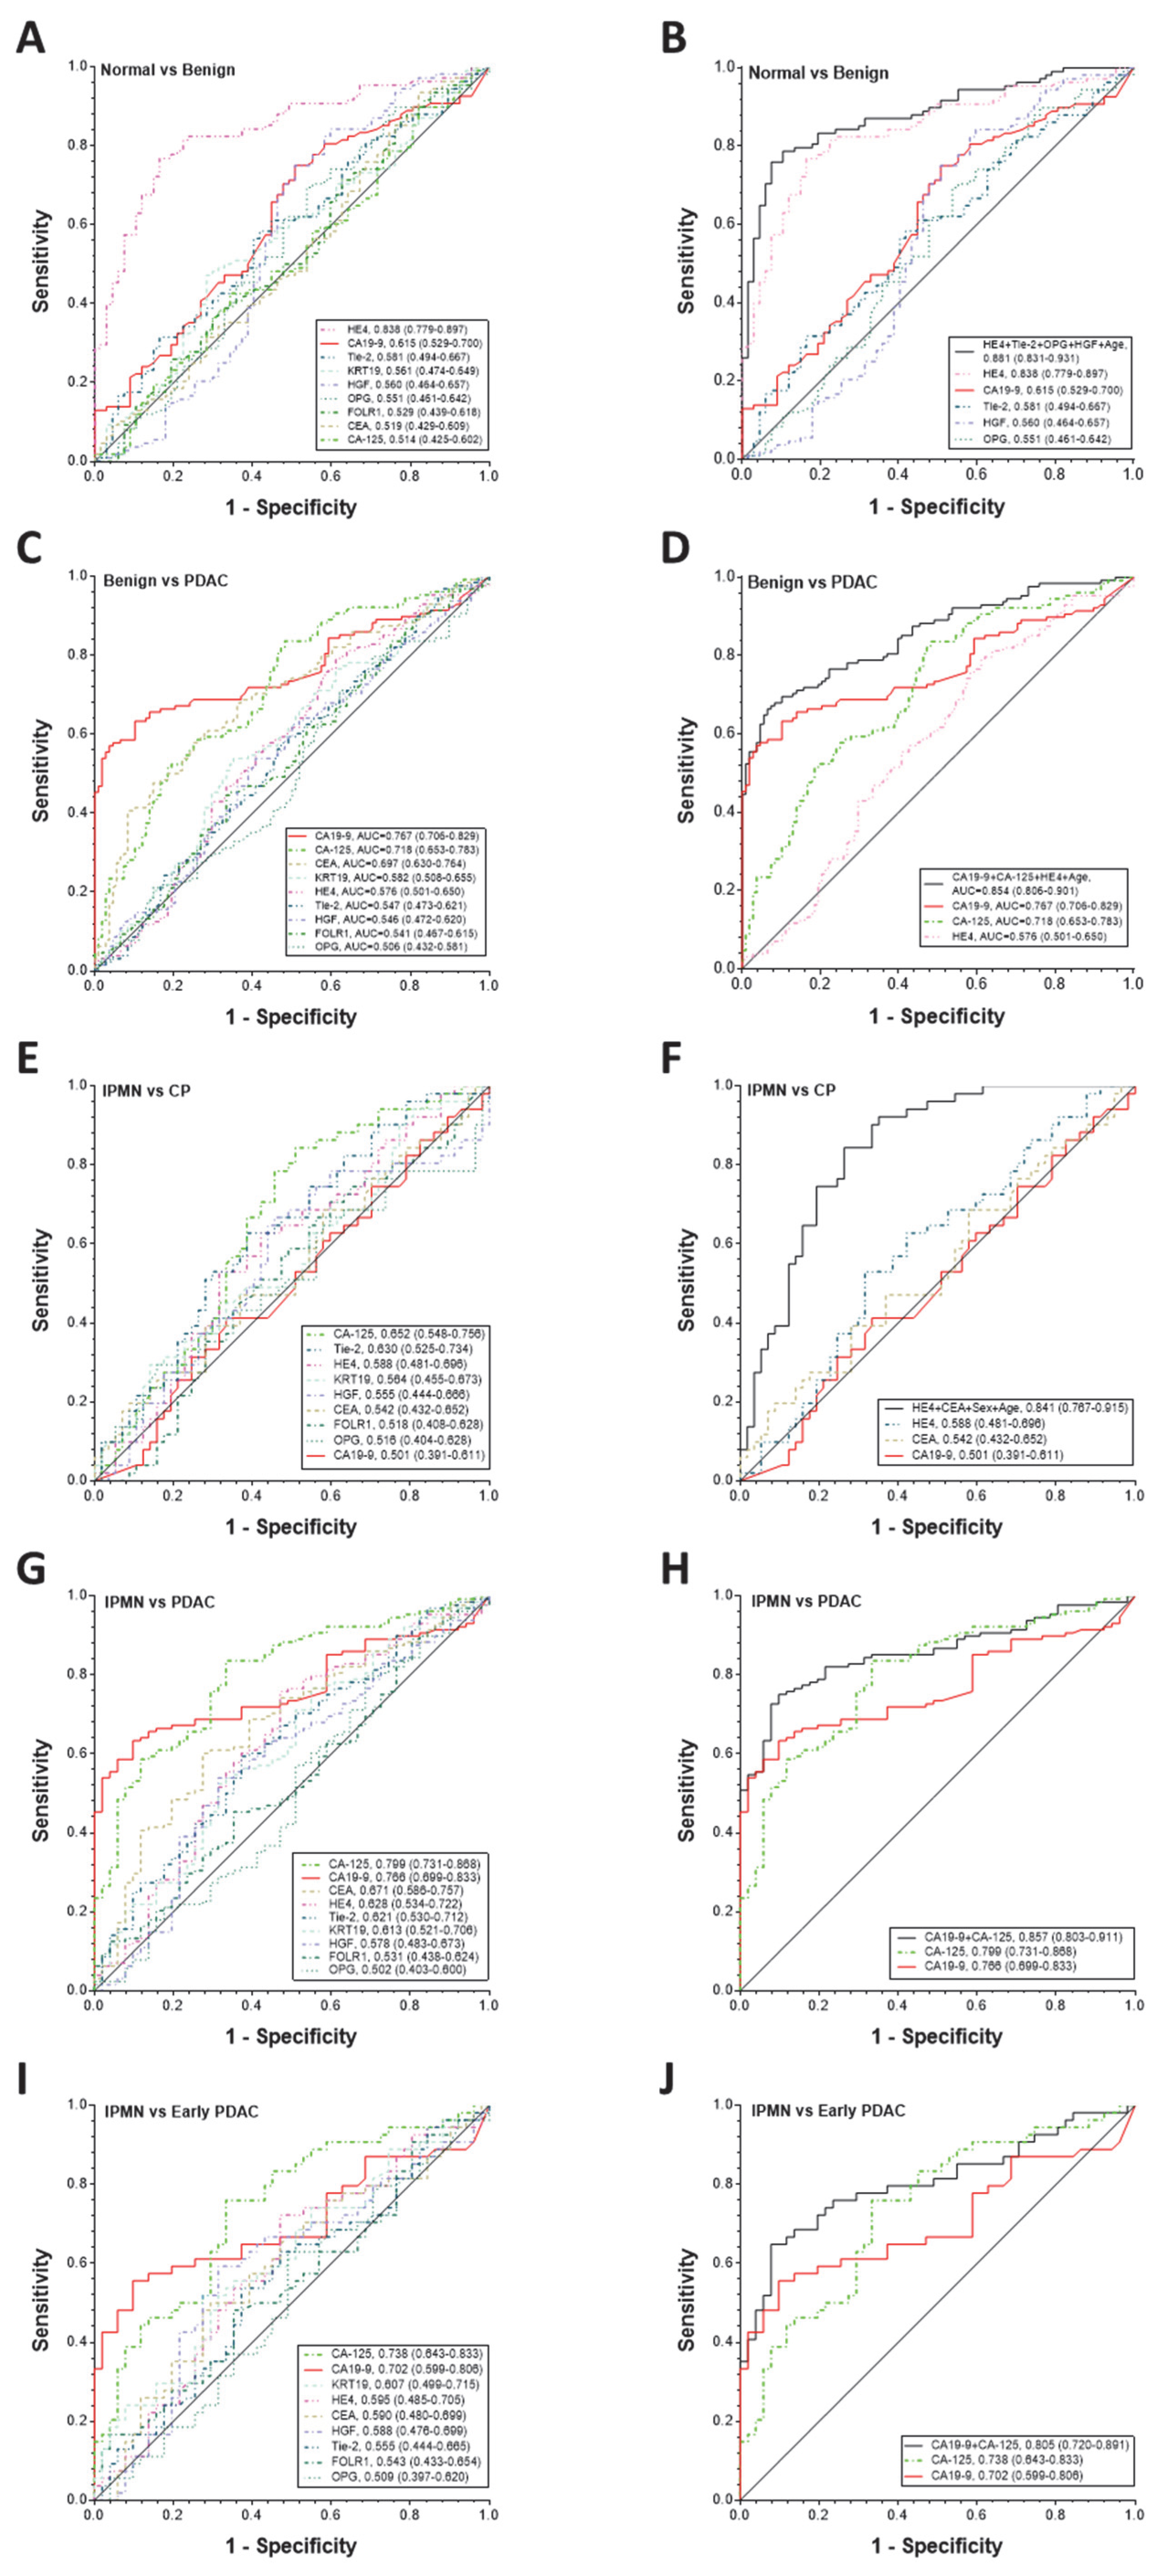
| AUC (95% CI) | SN (%) | SP (%) | |
|---|---|---|---|
| IPMN vs. CP | |||
| CA19-9 | 0.501 (0.391–0.611) | 21 | 80 |
| HE4 | 0.588 (0.481–0.696) | 25 | 80 |
| CEA | 0.542 (0.432–0.654) | 27 | 80 |
| HE4 + CEA + Sex + Age | 0.841 (0.767–0.915) | 74 * | 80 |
| IPMN vs. PDAC | |||
| CA19-9 | 0.766 (0.699–0.833) | 41 | 80 |
| CA-125 | 0.799 (0.731–0.868) | 66 | 80 |
| CA19-9 + CA-125 | 0.857 (0.803–0.911) | 78 @ | 80 |
| IPMN vs. Early stage PDAC | |||
| CA19-9 | 0.702 (0.599–0.806) | 59 | 80 |
| CA-125 | 0.738 (0.643–0.833) | 48 | 80 |
| CA19-9 + CA-125 | 0.805 (0.720–0.891) | 72 # | 80 |
Publisher’s Note: MDPI stays neutral with regard to jurisdictional claims in published maps and institutional affiliations. |
© 2021 by the authors. Licensee MDPI, Basel, Switzerland. This article is an open access article distributed under the terms and conditions of the Creative Commons Attribution (CC BY) license (https://creativecommons.org/licenses/by/4.0/).
Share and Cite
Song, J.; Sokoll, L.J.; Chan, D.W.; Zhang, Z. Validation of Serum Biomarkers That Complement CA19-9 in Detecting Early Pancreatic Cancer Using Electrochemiluminescent-Based Multiplex Immunoassays. Biomedicines 2021, 9, 1897. https://doi.org/10.3390/biomedicines9121897
Song J, Sokoll LJ, Chan DW, Zhang Z. Validation of Serum Biomarkers That Complement CA19-9 in Detecting Early Pancreatic Cancer Using Electrochemiluminescent-Based Multiplex Immunoassays. Biomedicines. 2021; 9(12):1897. https://doi.org/10.3390/biomedicines9121897
Chicago/Turabian StyleSong, Jin, Lori J. Sokoll, Daniel W. Chan, and Zhen Zhang. 2021. "Validation of Serum Biomarkers That Complement CA19-9 in Detecting Early Pancreatic Cancer Using Electrochemiluminescent-Based Multiplex Immunoassays" Biomedicines 9, no. 12: 1897. https://doi.org/10.3390/biomedicines9121897
APA StyleSong, J., Sokoll, L. J., Chan, D. W., & Zhang, Z. (2021). Validation of Serum Biomarkers That Complement CA19-9 in Detecting Early Pancreatic Cancer Using Electrochemiluminescent-Based Multiplex Immunoassays. Biomedicines, 9(12), 1897. https://doi.org/10.3390/biomedicines9121897