Article

miR-154 Influences HNSCC Development and Progression through Regulation of the Epithelial-to-Mesenchymal Transition Process and Could Be Used as a Potential Biomarker

by
Weronika Tomaszewska
1,*,
Joanna Kozłowska-Masłoń
2,3,4,
Dawid Baranowski
1,
Anna Perkowska
1,
Sandra Szałkowska
1,
Urszula Kazimierczak
1,
Patricia Severino
5,
Katarzyna Lamperska
2,3 and
Tomasz Kolenda
2,3,*
1
Department of Cancer Immunology, Chair of Medical Biotechnology, Poznan University of Medical Sciences, 8 Rokietnicka Street, 60-806 Poznan, Poland
2
Laboratory of Cancer Genetics, Greater Poland Cancer Centre, Garbary 15, 61-866 Poznan, Poland
3
Research and Implementation Unit, Greater Poland Cancer Centre, Garbary 15, 61-866 Poznan, Poland
4
Faculty of Biology, Institute of Human Biology and Evolution, Adam Mickiewicz University, Uniwersytetu Poznańskiego 6, 61-614 Poznań, Poland
5
Centro de Pesquisa Experimental, Albert Einstein Research and Education Institute, Hospital Israelita Albert Einstein, Av. Albert Einstein, 627-Jardim Leonor, São Paulo 05652-900, SP, Brazil
*
Authors to whom correspondence should be addressed.
Biomedicines 2021, 9(12), 1894; https://doi.org/10.3390/biomedicines9121894
Submission received: 30 September 2021 / Revised: 3 December 2021 / Accepted: 8 December 2021 / Published: 13 December 2021

Abstract

:
MicroRNAs and their role in cancer have been extensively studied for the past decade. Here, we analyzed the biological role and diagnostic potential of miR-154-5p and miR-154-3p in head and neck squamous cell carcinoma (HNSCC). miRNA expression analyses were performed using The Cancer Genome Atlas (TCGA) data accessed from cBioPortal, UALCAN, Santa Cruz University, and Gene Expression Omnibus (GEO). The expression data were correlated with clinicopathological parameters. The functional enrichment was assessed with Gene Set Enrichment Analysis (GSEA). The immunological profiles were assessed using the ESTIMATE tool and RNAseq data from TCGA. All statistical analyses were performed with GraphPad Prism and Statistica. The study showed that both miR-154-5p and miR-154-3p were downregulated in the HNSCC samples and their expression levels correlated with tumor localization, overall survival, cancer stage, tumor grade, and HPV p16 status. GSEA indicated that individuals with the increased levels of miR-154 had upregulated AKT-MTOR, CYCLIN D1, KRAS, EIF4E, RB, ATM, and EMT gene sets. Finally, the elevated miR-154 expression correlated with better immune response. This study showed that miR-154 is highly involved in HNSCC pathogenesis, invasion, and immune response. The implementation of miR-154 as a biomarker may improve the effectiveness of HNSCC treatment.

1. Introduction

Head and neck squamous cell carcinomas (HNSCCs) account for about 90% of all cancers in the head and neck area and are among the most common neoplasms worldwide [1]. This group includes tumors of the upper part of the digestive and respiratory system, particularly the oral cavity, larynx, and pharynx [2]. HNSCC is typically diagnosed at the advanced stage, resulting in high morbidity and mortality [3]. It is mainly associated with exposure to tobacco, alcohol abuse, and human papillomavirus (HPV), particularly type 16, which plays a crucial role in HNSCC development [4,5]. HPV-positive HNSCC tumors are more frequently found in the oropharyngeal area, with a younger age of onset, and also show less molecular diversity and higher sensitivity to radiation or chemotherapy when compared to HPV-negative tumors [6]. Moreover, HPV-positive HNSCC patients have significantly longer overall survival (OS) [6]. However, the five-year survival rate in HNSCC is significantly lower compared with other malignancies such as breast, cervical, or colorectal cancer [7]. The high mortality rate is associated with a lack of diagnostic biomarkers, leading to failure in early diagnosis and insufficient effectiveness of therapeutic methods [7]. Molecular biomarkers are important tools to diagnose, assess the likely course of the disease, and predict response to the treatment. Additionally, they are necessary to implement personalized treatment [8,9]. Although many biomarkers seem to affect the diagnosis and prognosis of HNSCC patients, only a few of them are approved for clinical use [7,10].
MicroRNAs (miRNAs) are single-stranded ncRNA molecules with 21–23 nucleotides in length. They are involved in the post-transcriptional regulation of gene expression through translational inhibition or even destabilization of the targeted messenger RNA (mRNA) [11]. They play a pivotal role in maintaining tissue homeostasis by regulating processes such as cell proliferation, differentiation, or apoptosis [12]. miRNAs can act as tumor suppressors or oncogenes. The discovery of their exact role is pivotal for understanding the molecular pathways involved in the development of HNSCC, both HPV-negative and HPV-positive [13,14,15,16]. miRNAs have been extensively studied as potential cancer biomarkers mainly due to their stability in a variety of biological materials, their specificity, and because they are easy to process and analyze with current protocols [17].
In this study, using data from The Cancer Genome Atlas (TCGA), we analyzed the expression and biological role of miR-154 strands 5p and 3p and determined their potential utility as HNSCC biomarkers. It is known that the expression level of miR-154 is down-regulated in melanoma [18], glioma [19], non-small-cell lung (NSCLC) [20], breast [21], bladder [22], gastric cancers [23], and laryngeal squamous cell carcinoma [24] and up-regulated in renal cell carcinoma [25]. Analysis of miR-154 functions revealed that this miRNA acts as a regulator of proliferation, cell viability, invasion, and migration, apoptosis of cancer cells in vitro and regulates tumor growth in vivo [18,22,23,24,25,26]. Nevertheless, there is a lack of studies discussing how each miR-154 strand is expressed and how they affect the molecular characteristics of the tissue or the immune profile of the patients. In recent years, many reports have emphasized the importance of analyzing both miRNA strands separately [27,28,29,30]. It has been proven that these molecular species can be co-expressed in different tissues and display different modulatory roles in tumorigenic processes independently and/or cooperatively [27,28,29,30]. Therefore, within this study, we performed such an analysis of miR-154 for the first time. Our in silico investigation was based on a cohort of HNSCC patients and aimed to elucidate whether miR-154 could be further considered for clinical applications.

2. Materials and Methods

2.1. Data Collection

The TCGA expression data of miR-154-3p, miR-154-5p, and selected genes, along with clinical data, were downloaded from the cBioPortal developed at Memorial Sloan Kettering Cancer Center, USA (Head and Neck Squamous Cell Carcinoma, TCGA, Provisional, 530 samples dataset) [31], UALCAN databases (http://ualcan.path.uab.edu/index.html; level 3 TCGA RNA-seq data (accessed on 9 December 2021)) [32] and using USCS Xena Browser from the University of California, Santa Cruz databases, USA (TCGA Head and Neck Cancer; dataset ID: TCGA.HNSC.sampleMap/HiSeqV2_PANCAN (accessed on 9 December 2021); pan-cancer normalized log2(norm_count + 1); and dataset ID: TCGA.HNSC.sampleMap/HNSC_clinicalMatrix (accessed on 9 December 2021) [33]. For validation of the results, available datasets GSE31277 (n = 16) [34] and GSE144711 (n = 88) [35] from Gene Expression Omnibus (GEO) (accessed on 9 December 2021)were used.
Additional information about the tumors’ biological and genetic features was obtained from the supporting data presented by Thorsson et al. [36].
All the data are available online with unrestricted access and does not require the patients’ consent or other permissions. The use of the data does not violate the rights of any person or any institution.

2.2. Pathological and Clinical Analysis

The expression levels of miR-154-3p and miR-154-5p were analyzed depending on the clinicopathological parameters such as age (≤60 vs. >60; n = 250 and n = 269 for -5p and n = 247 and n = 264 for -3p), gender (women vs. men; n = 147 and n = 373 for -5p and n = 43 and n = 369 for -3p), documented alcohol history (yes vs. no; n = 337 and n = 173 for -5p and n = 331 and n = 171 for -3p), tobacco smoking history (yes vs. no/ex; n = 302 and n = 203 for -5p and n = 296 and n = 201 for -3p), cancer stage (I + II vs. III + IV; n = 125 and n = 382 for -5p and n = 123 and n = 376 for -3p), T-stage (T1 + T2 vs. T3 + T4; n = 189 and n = 316 for -5p and n = 189 and n = 308 for -3p), N-stage (N0 vs. N2 + N2 + N3; n = 252 and n = 248 for -5p and n = 245 and n = 246 for -3p), cancer grade (G1 + G2 vs. G3 + G4; n = 370 and n = 126 for -5p and n = 361 and n = 127 for -3p), HPV p16 marker (positive vs. negative; n = 38 and n = 65 for -5p and n = 36 and n = 65 for -3p), perineural invasion (positive vs. negative; n = 171 and n = 192 for -5p and n = 169 and n = 188 for -3p), and lymphoid neck dissection status (positive vs. negative; n = 416 and n = 102 for -5p and n = 407 and n = 102 for -3p) for all the HNSCC anatomical subsites available. Next, subgroups of high and low expression of miR-154-5p and miR-154-3p were selected using the average expression as a cutoff. Disease-free survival (DFS) (nhigh = 215 and nlow = 204 for -5p and nhigh = 194 and nlow = 218 for -3p) and OS (nhigh = 258 and nlow = 259 for -5p and nhigh = 248 and nlow = 261 for -3p) were assessed in these subgroups.
For the GSE31277 dataset from GEO, the expression levels of miR-154-5p and miR-154-3p were analyzed depending on sample type (cancers vs. surgical margin; n = 15 and n = 15 for both), T-stage (T1 + T2 vs. T3 + T4; n = 6 and n = 9 for both), N-stage (N0 vs. N2 + N2 + N3; n = 6 and n = 9 for both), and histological differentiation (well-differentiated vs. moderate; n = 10 and n = 5 for both). The second GEO dataset, GSE144711, was analyzed according to cancer stage (I + II vs. III + IV; n = 13 and n = 53 for both), T-stage (T1 + T2 vs. T3 + T4; n = 17 and n = 54 for both), N-stage (N0 vs. N2 + N2 + N3; n = 29 and n = 42 for both), and histological differentiation (well-differentiated vs. moderate vs. poor; n = 15, n = 55, and n = 13 for all three).

2.3. Functional Enrichment Analysis and Prediction of Genes’ Function

Gene Set Enrichment Analysis (GSEA) software version 3.0 (http://www.gsea-msigdb.org/gsea/index.jsp (University of California, San Diego, USA, and Broad Institute, USA, accessed on 9 December 2021) was used for the analysis of functional enrichment [37]. The HNSCC patients were divided into two groups with high and low expression of miR-154 using the average expression as a cutoff. The input file contained expression data for 20,530 genes and 512 patients. We used 1000 gene set permutations for the analysis and pathways (oncogenic signatures (C), hallmark gene sets (H), and collection from MSigDB) with nominal p-value ≤0.05 and FDR q-value ≤0.25 considered significant.

2.4. Target Analysis

The genes negatively correlated with miR-154 were verified as potential targets using data from the Encori database (StarBase 2.0, Sun Yat-sen University, China, accessed on 9 December 2021) comparing information from di9 December 2021erent prediction tools: PITA (Segal Lab of Computational Biology, Israel, accessed on 9 December 2021), RNA22 (Thomas Jefferson University, USA, accessed on 9 December 2021) [38], miRmap (https://mirmap.ezlab.org/app/ (Swiss Institute of Bioinformatics, Switzerland, accessed on 9 December 2021)) [39], microT-CDS (http://diana.imis.athena-innovation.gr/DianaTools/index.php?r=microT_CDS/index (University of Thessaly, Grece, accessed on 9 December 2021)) [40,41], miRDB (http://www.mirdb.org (University School of Medicine, St Louis, MO, USA, accessed on 9 December 2021)) [42,43], PicTar (https://pictar.mdc-berlin.de (Center for Comparative Functional Genomics and the Max Delbruck Centrum, Germany, accessed on 9 December 2021)), and TargetScanHuman v7.2 (http://www.targetscan.org/vert_72/ (Bioinformatics and Research Computing (Whitehead Institute), USA, accessed on 9 December 2021)) [44]. Next, the correlation between expression levels of miR-154 and genes was calculated as described in Section 2.6. The interactions between genes predicted as targets for miR-154 were analyzed using the GeneMANIA prediction tool (http://genemania.org (University of Toronto, Canada, accessed on 9 December 2021)) [45]. DFS and OS of the HNSCC patients depending on the expression level of miR-154 targets were analyzed using data from the gene expression profiling interactive analysis (GEPIA 2) portal (http://gepia2.cancer-pku.cn/#index (Peking University, China, accessed on 9 December 2021)). The log-rank test with a hazard ratio (HR) and 95% CI (confidence interval) was applied, and subgroups of the patients divided based on the quartile of the expression level of a specific gene and for the panel of all the indicated miR-154-5p targets were compared [46].

2.5. Immune Profile Analysis

Analysis of the ESTIMATE, immune and stromal scores (Estimation of Stromal and Immune cells in Malignant Tumor tissues using Expression data) required downloading a specific dataset from https://bioinformatics.mdanderson.org/estimate/disease.html (MD Anderson Cancer Center, USA, accessed on 9 December 2021) [47]. Then, those scores were used to define the infiltration of immune cells into tumor tissues and infer tumor purity. Subpopulations of specific immune cells were assessed using supporting data presented by Thorsson et al. and compared between subgroups of the patients with high and low expression of miR-154-5p, as well as of miR-154-3p [36]. Individuals were assigned into groups based on the mean value of the studied miRNA expression level.
Populations of specific immune cells, lymphocytes (T and B cells with their subpopulations), neutrophils, eosinophils, mast cells, dendritic cells, and macrophages (M0, M1, and M2), as well as T cell receptor (TCR) and B cell receptor (BCR) parameters, TCGA immune subtypes (C1–C4 and C6), along with other immune features such as IFN gamma and transforming growth factor beta (TGF beta) response, macrophage regulation, lymphocyte infiltration, TIL regional fraction, intratumor heterogeneity, proliferation, wound healing, homologous recombination defects, SNV and indel neoantigens, silent and non-silent mutation rates, aneuploidy, and cancer/testis antigen score (CTA score) were determined by conducting analyses of the supporting data presented by Thorsson et al. [36]. The data downloaded for this study can be explored and visualized through the interactive portal CRI iAtlas (www.cri-iatlas.org (Institute for Systems Biology, USA, accessed on 9 December 2021)) [48]. The analysis was performed as described in Section 2.6 “Statistical Analysis”.

2.6. Statistical Analysis

All the statistical analyses were performed using GraphPad Prism 8 (GraphPad, San Diego, CA, USA) and Statistica v13.1 (Dell Software, Round Rock, TX, USA). The Shapiro–Wilk normality test, t-test, or Mann-Whitney U test was used for miR-154-5p and miR-154-3p expression levels (depending on the clinical parameters). The level of miR-154-5p and miR-154-3p (depending on the National Institute of Health classification of cancer location, as well as the TCGA molecular subtype) was determined using one-way ANOVA with Tukey’s multiple comparisons test or the Kruskal-Wallis test with Dunn’s multiple comparisons test. A negative correlation between miR-154-5p and miR-154-3p expression levels, as well as protein-coding genes, were analyzed in Statistica (correlation matrix) or GraphPad Prism 8 with the Pearson or Spearman’s correlation tests depending on the data distribution. All the TCGA data are displayed as the means with the standard error of the mean (SEM). For DSF and OS analyses, the log-rank (Mantel-Cox) and Gehan-Breslow-Wilcoxon tests were used, and the hazard ratio (Mantel-Haenszel; HR) and the 95% confidence interval (CI) of the ratio were calculated. Graphs presenting boxes use 5–95 percentile whiskers, and column bars show the means with 95% CI. In all the analyses, p < 0.05 was used to determine statistical significance.

2.7. Availability of Data and Materials

The datasets used and/or analyzed during this study are available from the corresponding author on reasonable request. Raw data are available on the cBioPortal, in the UALCAN and the University of California, Santa Cruz databases, and the published Supplementary Materials.

3. Results

miR-154-5p and miR-154-3p were downregulated in the cancer samples when compared to the cancer-free samples, in pharyngeal squamous cell carcinomas and in the atypical molecular subtype of HNSCC.
According to the Encori database (StarBase 2.0), the expression of miR-154-5p was significantly downregulated in the HNSCC samples (n = 497) compared to the normal tissue (n = 44), with a fold change of 0.52 (p = 3.6 × 10⁻⁶). The expression level of miR-154-3p in the normal (n =  44) and HNSCC tissues (n =  497) was significantly downregulated, with a fold change of 0.97 (p = 0.024) (Figure 1A). Subsequently, the changes were examined based on paired cancer and adjacent normal samples analysis (n = 43), and miR-154-5p expression levels were significantly different between the normal and HNSCC tissues (1.940 ± 0.09783 vs. 2.676 ± 0.1207, p < 0.0001) while no differences were observed for miR-154-3p (1.596 ± 0.09891 vs. 1.736 ± 0.09794, p = 0.2192) (Figure 1B). Next, ROC analysis of the paired cancer and adjacent normal samples (n = 43) was performed, and in the case of miR-154-5p, high ability to distinguish between the cancer and normal samples was determined (AUC = 0.7669, 95% CI = 0.6661–0.8677, p < 0.0001), in contrast to miR-154-3p which did not display this feature (AUC = 0.5554, 95% CI = 0.4327–0.6782, p = 0.3760) (Figure 1C).
Based on the National Institutes of Health (NIH) classification, all the samples were divided into three main cancer groups according to subsite: (i) oral cavity (n = 323 for miR-154-5p; n = 316 for miR-154-3p), (ii) larynx (n = 117 for miR-154-5p; n = 116 for miR-154-3p), and (iii) pharynx (n = 80 for miR-154-5p; n = 80 for miR-154-3p). Significantly higher expression of miR-154-5p and miR-154-3p was observed for tumors located in the oral cavity when compared with the pharynx (2.058 ± 0.04528 vs. 1.729 ± 0.1067, p = 0.0051 and 1.644 ± 0.04764 vs. 1.272 ± 0.09289, p = 0.0008, respectively). No significant differences (p > 0.05) were determined between other subsites (Figure 1D). Finally, expression levels of miR-154-5p and miR-154-3p were examined depending on the molecular subtype of HNSCC. The highest levels of miR-154-5p were detected in the mesenchymal subtype (2.123 ± 0.08424, p < 0.001; n = 64) in comparison to the atypical (1.390 ± 0.08961; n = 55), basal (1.627 ± 0.08081; n = 71), or classical subtypes (1.634 ± 0.1091; n = 44), and no differences (p > 0.05) were determined between the atypical vs. basal and classical subtypes as well as between the basal and classical subtypes. Similarly, in the case of miR-154-3p, the highest levels were observed in the mesenchymal subtype (1.811 ± 0.08717, p < 0.0001; n = 64) in comparison to the atypical (1.047 ± 0.08116; n = 55), basal (1.486 ± 0.1176; n = 68), or classical subtypes (1.414 ± 0.09748; n = 44), and no differences were determined between the basal vs. classical subtypes (p > 0.05) (Figure 1E).

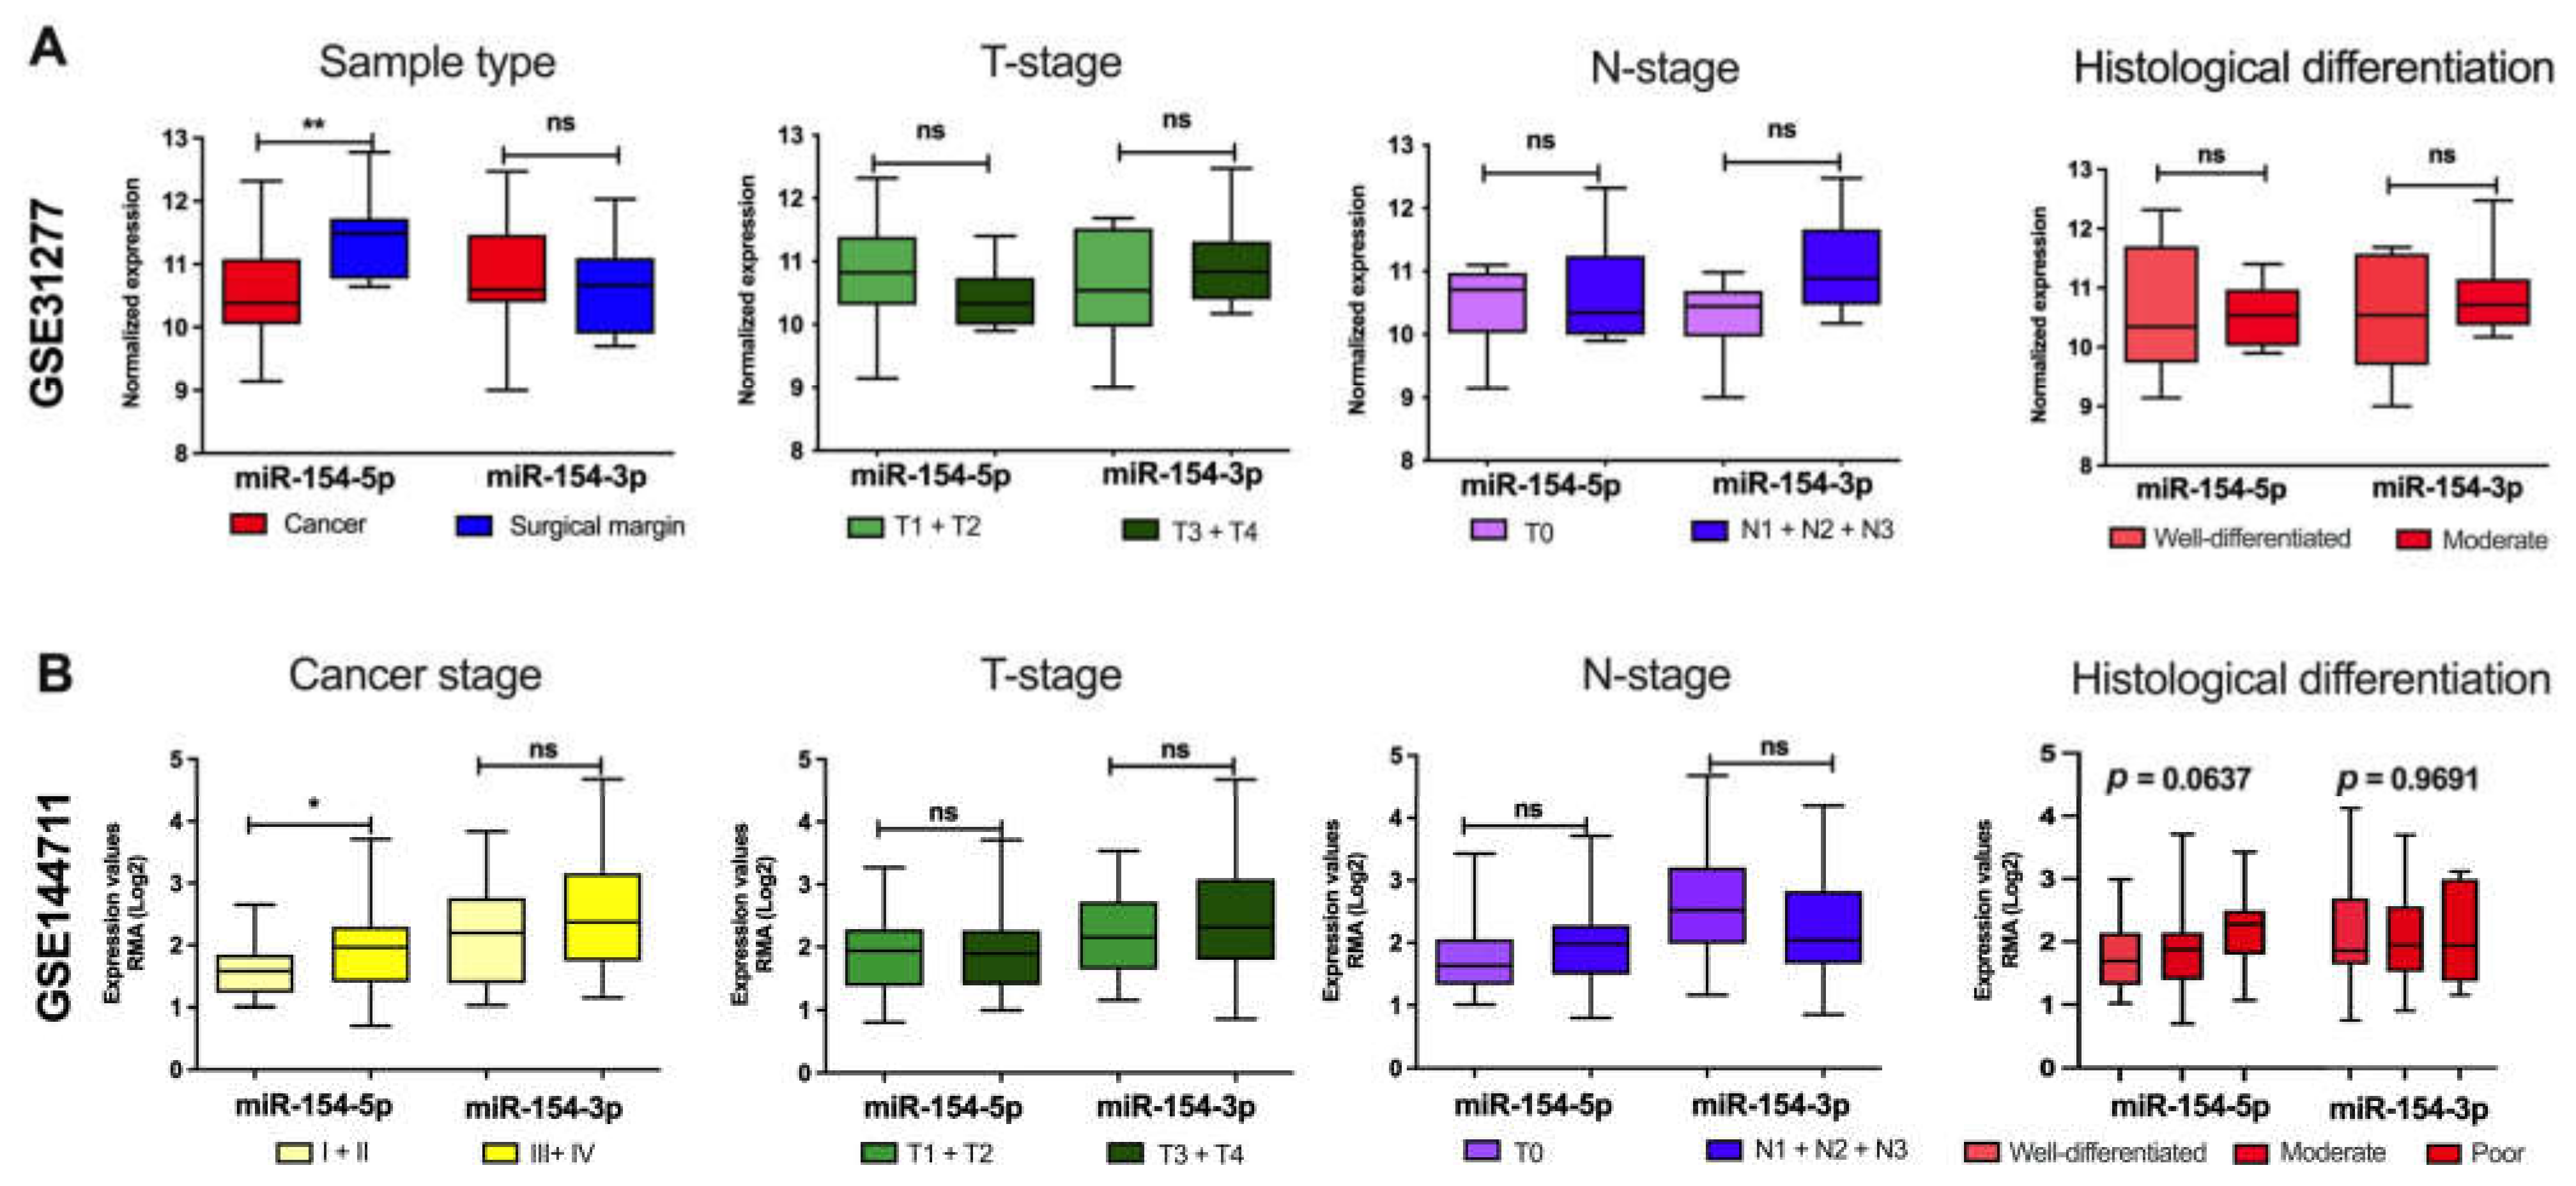
3.1. miR-154-5p and miR-154-3p Levels Differ Depending on the Clinicopathological Parameters

The expression levels of miR-154-5p and miR-154-3p were analyzed in the previously determined subgroups depending on the available clinicopathological parameters for all the HNSCC samples. Significant differences in the expression levels for miR-154-5p were observed in the N0 vs. N1 + N2 + N3 cancer N-stages (2.071 ± 0.8426 vs. 1.866 ± 0.8409, p = 0.0066), I + II vs. III + IV cancer stages (2.145 ± 0.8002 vs. 1.913 ± 0.8548, p = 0.0077), G1 + G2 vs. G3 + G4 cancer grades (1.913 ± 0.8247 vs. 2.182 ± 0.8299, p = 0.0017), and in the negative HPV p16/ish samples in comparison to the positive ones (1.492 ± 0.9784 vs. 1.943 ± 0.7552, p = 0.0102). The other analyzed parameters did not differ between the studied groups for miR-154-5p. Significant differences between the miR-154-3p expression levels were detected only between the N0 vs. N1 + N2 + N3 cancer N-stages (1.623 ± 0.8086 vs. 1.455 ± 0.7938, p = 0.0208) and in the negative HPV p16/ish samples in comparison to the positive ones (1.208 ± 0.7566 vs. 1.534 ± 0.6708, p = 0.0277); the other analyzed parameters did not vary between the studied groups. All the data are presented in Table 1.
Next, the results based on the TCGA data were tested using datasets GSE31277 and GSE144711 from the GEO database, and the expression levels of miR-154-5p and miR-154-3p depending on sample type, stages of cancer, and histological differentiation were assessed. In the case of GSE31277, significantly lower expression levels of miR-154-5p in the cancer samples in comparison to the surgical margin were observed (10.58 ± 0.1930 vs. 11.39 ± 0.1546, p = 0.0028), and no differences were observed for miR-154-3p (10.79 ± 0.2095 vs. 10.54 ± 0.1884, p = 0.3840). Moreover, no differences in the expression levels between the T- and N-stages as well as histological differentiation for both miR-154-5p (10.81 ± 0.4150 vs. 10.42 ± 0.1705, p = 0.2721; 10.48 ± 0.2890 vs. 10.64 ± 0.2696, p = 0.9546; and 10.54 ± 0.1617 vs. 10.64 ± 0.5214, p = 0.9530, respectively) and miR-154-3p (10.59 ± 0.3918 vs. 10.93 ± 0.2416, p = 0.6663; 10.29 ± 0.2760 vs. 11.12 ± 0.2484, p = 0.0933; and 10.88 ± 0.2226 vs. 10.62 ± 0.4764, p = 0.8825, respectively) were detected (Figure 2A). Next, analysis of the GSE144711 dataset revealed that miR-154-5p was upregulated in cancer with higher (III + IV) stages in comparison to the samples with I + II stages (1.603 ± 0.1322 vs. 1.951 ± 0.09924, p = 0.0028); however, those differences were not observed for miR-154-3p (2.161 ± 0.2289 vs. 2.447 ± 0.1106, p = 0.2756). Additionally, no differences were observed for the T- and N-stages for both miR-154-5p (1.857 ± 0.1534 vs. 1.925 ± 0.08823, p = 0.2721, and 1.764 ± 0.1166 vs. 2.003 ± 0.09912, p = 0.9546, respectively) and miR-154-3p (2.203 ± 0.1798 vs. 2.384 ± 0.1105, p = 0.6663, and 2.530 ± 0.1483 vs. 2.227 ± 0.1199, p = 0.9530, respectively) and histological differentiation (1.781 ± 0.1419 vs. 1.833 ± 0.08736 vs. 2.229 ± 0.1846, p = 0.0637, and 2.356 ± 0.2588 vs. 2.306 ± 0.09991 vs. 2.350 ± 0.2417, p = 0.0933, respectively) (Figure 2B).

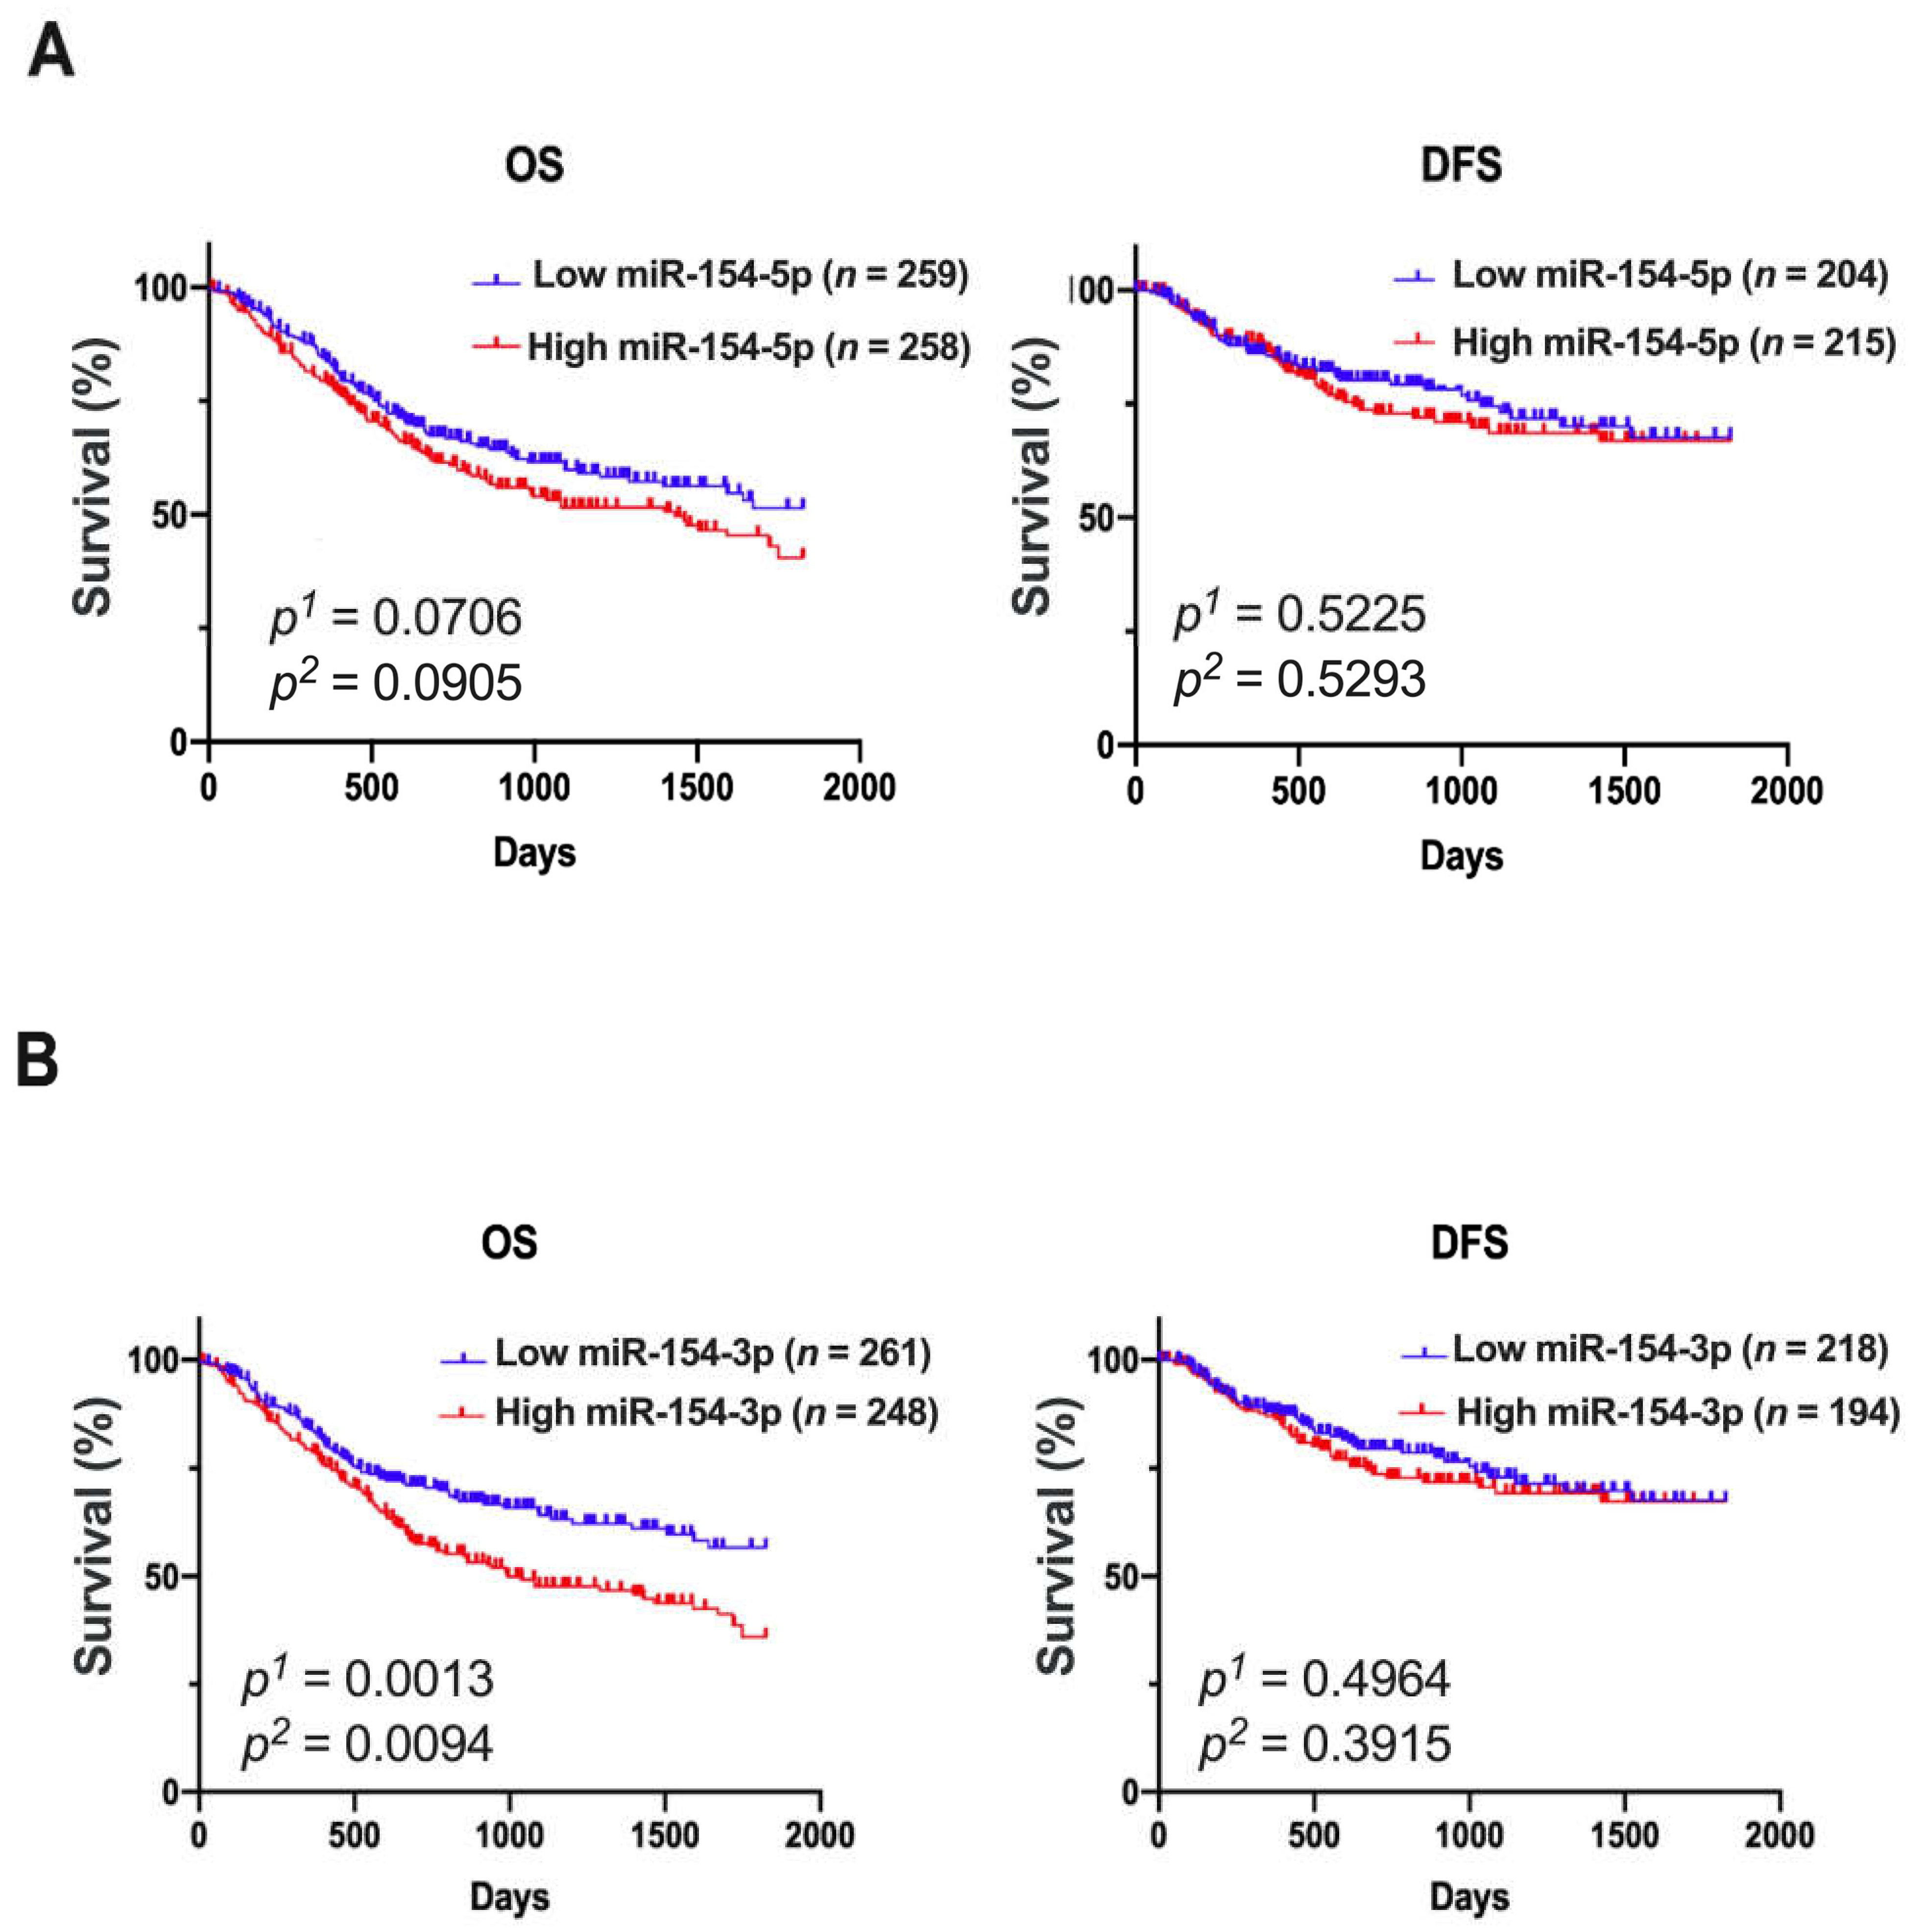
3.2. Patients with Low Expression of miR-154-3p Had a Significantly Extended Overall Survival

The HNSCC patients were divided into low and high miR-154-3p and miR-154-5p expression groups using the mean expression as a cutoff, and then the 5-year OS and DFS were assessed. Slight changes in the OS time between low and high miR-154-5p expression groups were observed (p = 0.0706 and p = 0.0905, respectively), and no differences (p > 0.05) for the DFS were seen (Figure 3A). However, a significantly longer 5-year OS was discovered in the patients with low miR-154-3p expression levels in comparison to the high expression group (p = 0.0013 and p = 0.0094, respectively). In the case of DFS, no difference between the patients with low and high expression levels of miR-154-3p was determined (Figure 3B).

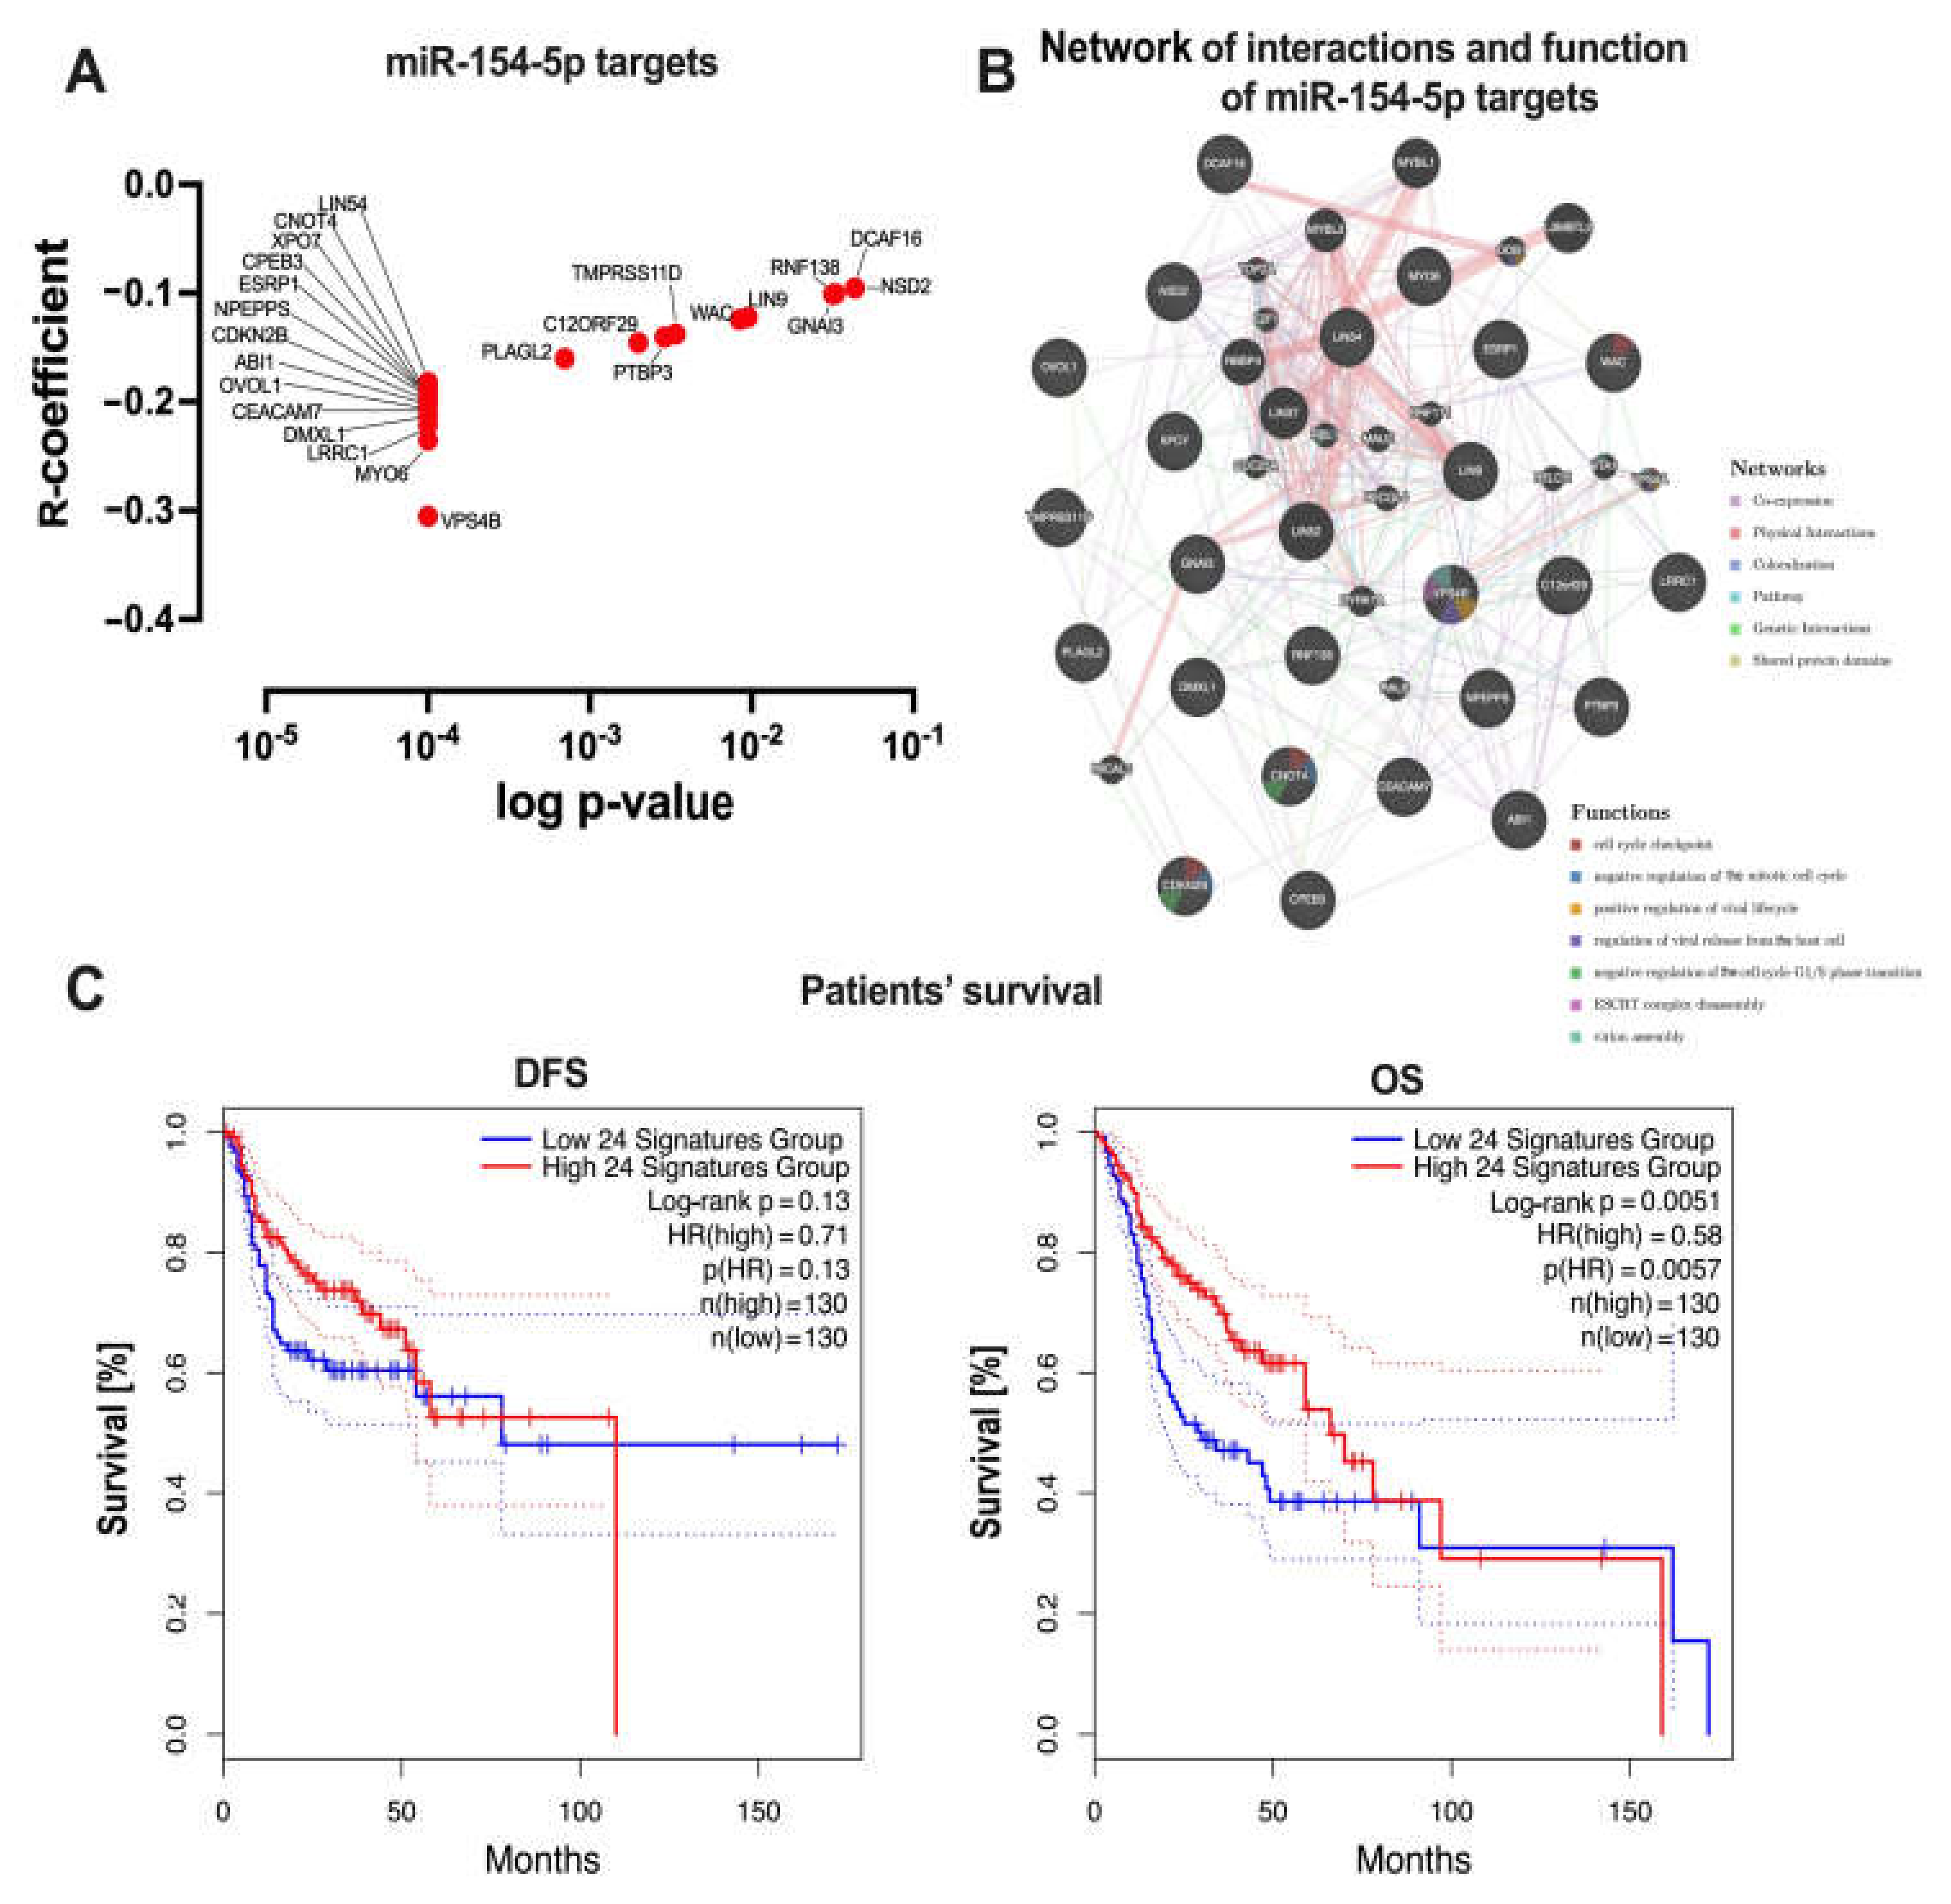
3.3. Higher Expression of miR-154-5p and miR-154-3p Was Associated with the Upregulation of Oncogenic Pathways in the HNSCC Patients

The biological influence of high and low expression levels of miR-154-5p and miR-154-3p was analyzed using GESA. In the case of all the HNSCC subsites, significant enrichment scores (p < 0.05 and FDR q-value <0.25) were observed for 36 gene sets from oncogenic signatures and five gene sets from cancer hallmark signatures for the patients with higher levels of miR-154-5p compared to the ones with lower expression of this miRNA. Similarly, for high levels of miR-154-3p, significant enrichment in 41 gene sets from oncogenic signatures and two gene sets from cancer hallmark signatures were detected. In both cases, those genes were implicated in AKT-MTOR, CYCLIN D1, KRAS, EIF4E, RB, as well as ATM pathways. Moreover, patients with higher levels of both strands displayed gene expression signatures characteristic of cancer stem-like cells, with features including genes downregulated during early stages of differentiation or connected with the WNT pathway. The above was supported by the enrichment of 194 genes associated with the Epithelial-to-Mesenchymal (EMT) process (NES = 1.930 for miR-154-5p and NES = 1.813 for miR-154-3p, respectively). It should be noted that gene enrichment analysis depending on the cancer subsite (oral cavity, larynx, or pharynx) also suggests a strong association of higher levels of both miR-154 strands with an aggressive phenotype of HNSCC. All the data are presented in Figure 4A,B and in Supplementary Table S1.
Next, gene sets from the processes selected by means of GSEA were screened for potential targets for miR-154-5p using miRNA target prediction databases, and the expression correlation between miR-154-5p and the genes was calculated. Based on this approach, 24 genes were selected: VPS4B, MYO6, LRRC1, DMXL1, CEACAM7, OVOL1, ABI1, CDKN2B, NPEPPS, ESRP1, CPEB3, XPO7, LIN54, CNOT4, PLAGL2, C12ORF29, PTBP3, TMPRSS11D, WAC, LIN9, RNF138, GNAI3, DCAF16, and NSD2 (with R-coefficient from −0.09532 to −0.3055 and p < 0.05) (Figure 5A). Using the GeneMANIA tool, the network of interactions and functions between the miR-154-5p targets was indicated. It was observed that those genes were co-expressed (61.19% of genes), had physical interactions (24.85% of genes), shared the same colocalization (7.83% of genes), and were from the same pathway (5.28% of genes). Moreover, these 24 genes are involved in the endosomal sorting complex required for transport (ESCRT), cell cycle, and viral replication (Figure 5B). Finally, the association of the miR-154-5p targets with the HNSCC patients’ survival was determined. In the case of higher expression of CEACAM7 and PLAGL2, a significantly longer DFS was observed (HR = 0.58, p = 0.022; HR = p = 0.036). Surprisingly, only for higher expression levels of CPEB3, longer OS time was observed (HR = 0.56, p = 0.0045). However, when the expression levels of all the 24 genes were compiled, a strong association between higher expression levels and longer OS time for the HNSCC patients was observed (HR = 0.58, p = 0.0051). No differences for DFS time were observed (HR = 0.71, p = 0.13) (Figure 5C). The detailed data are presented in Supplementary Table S2.

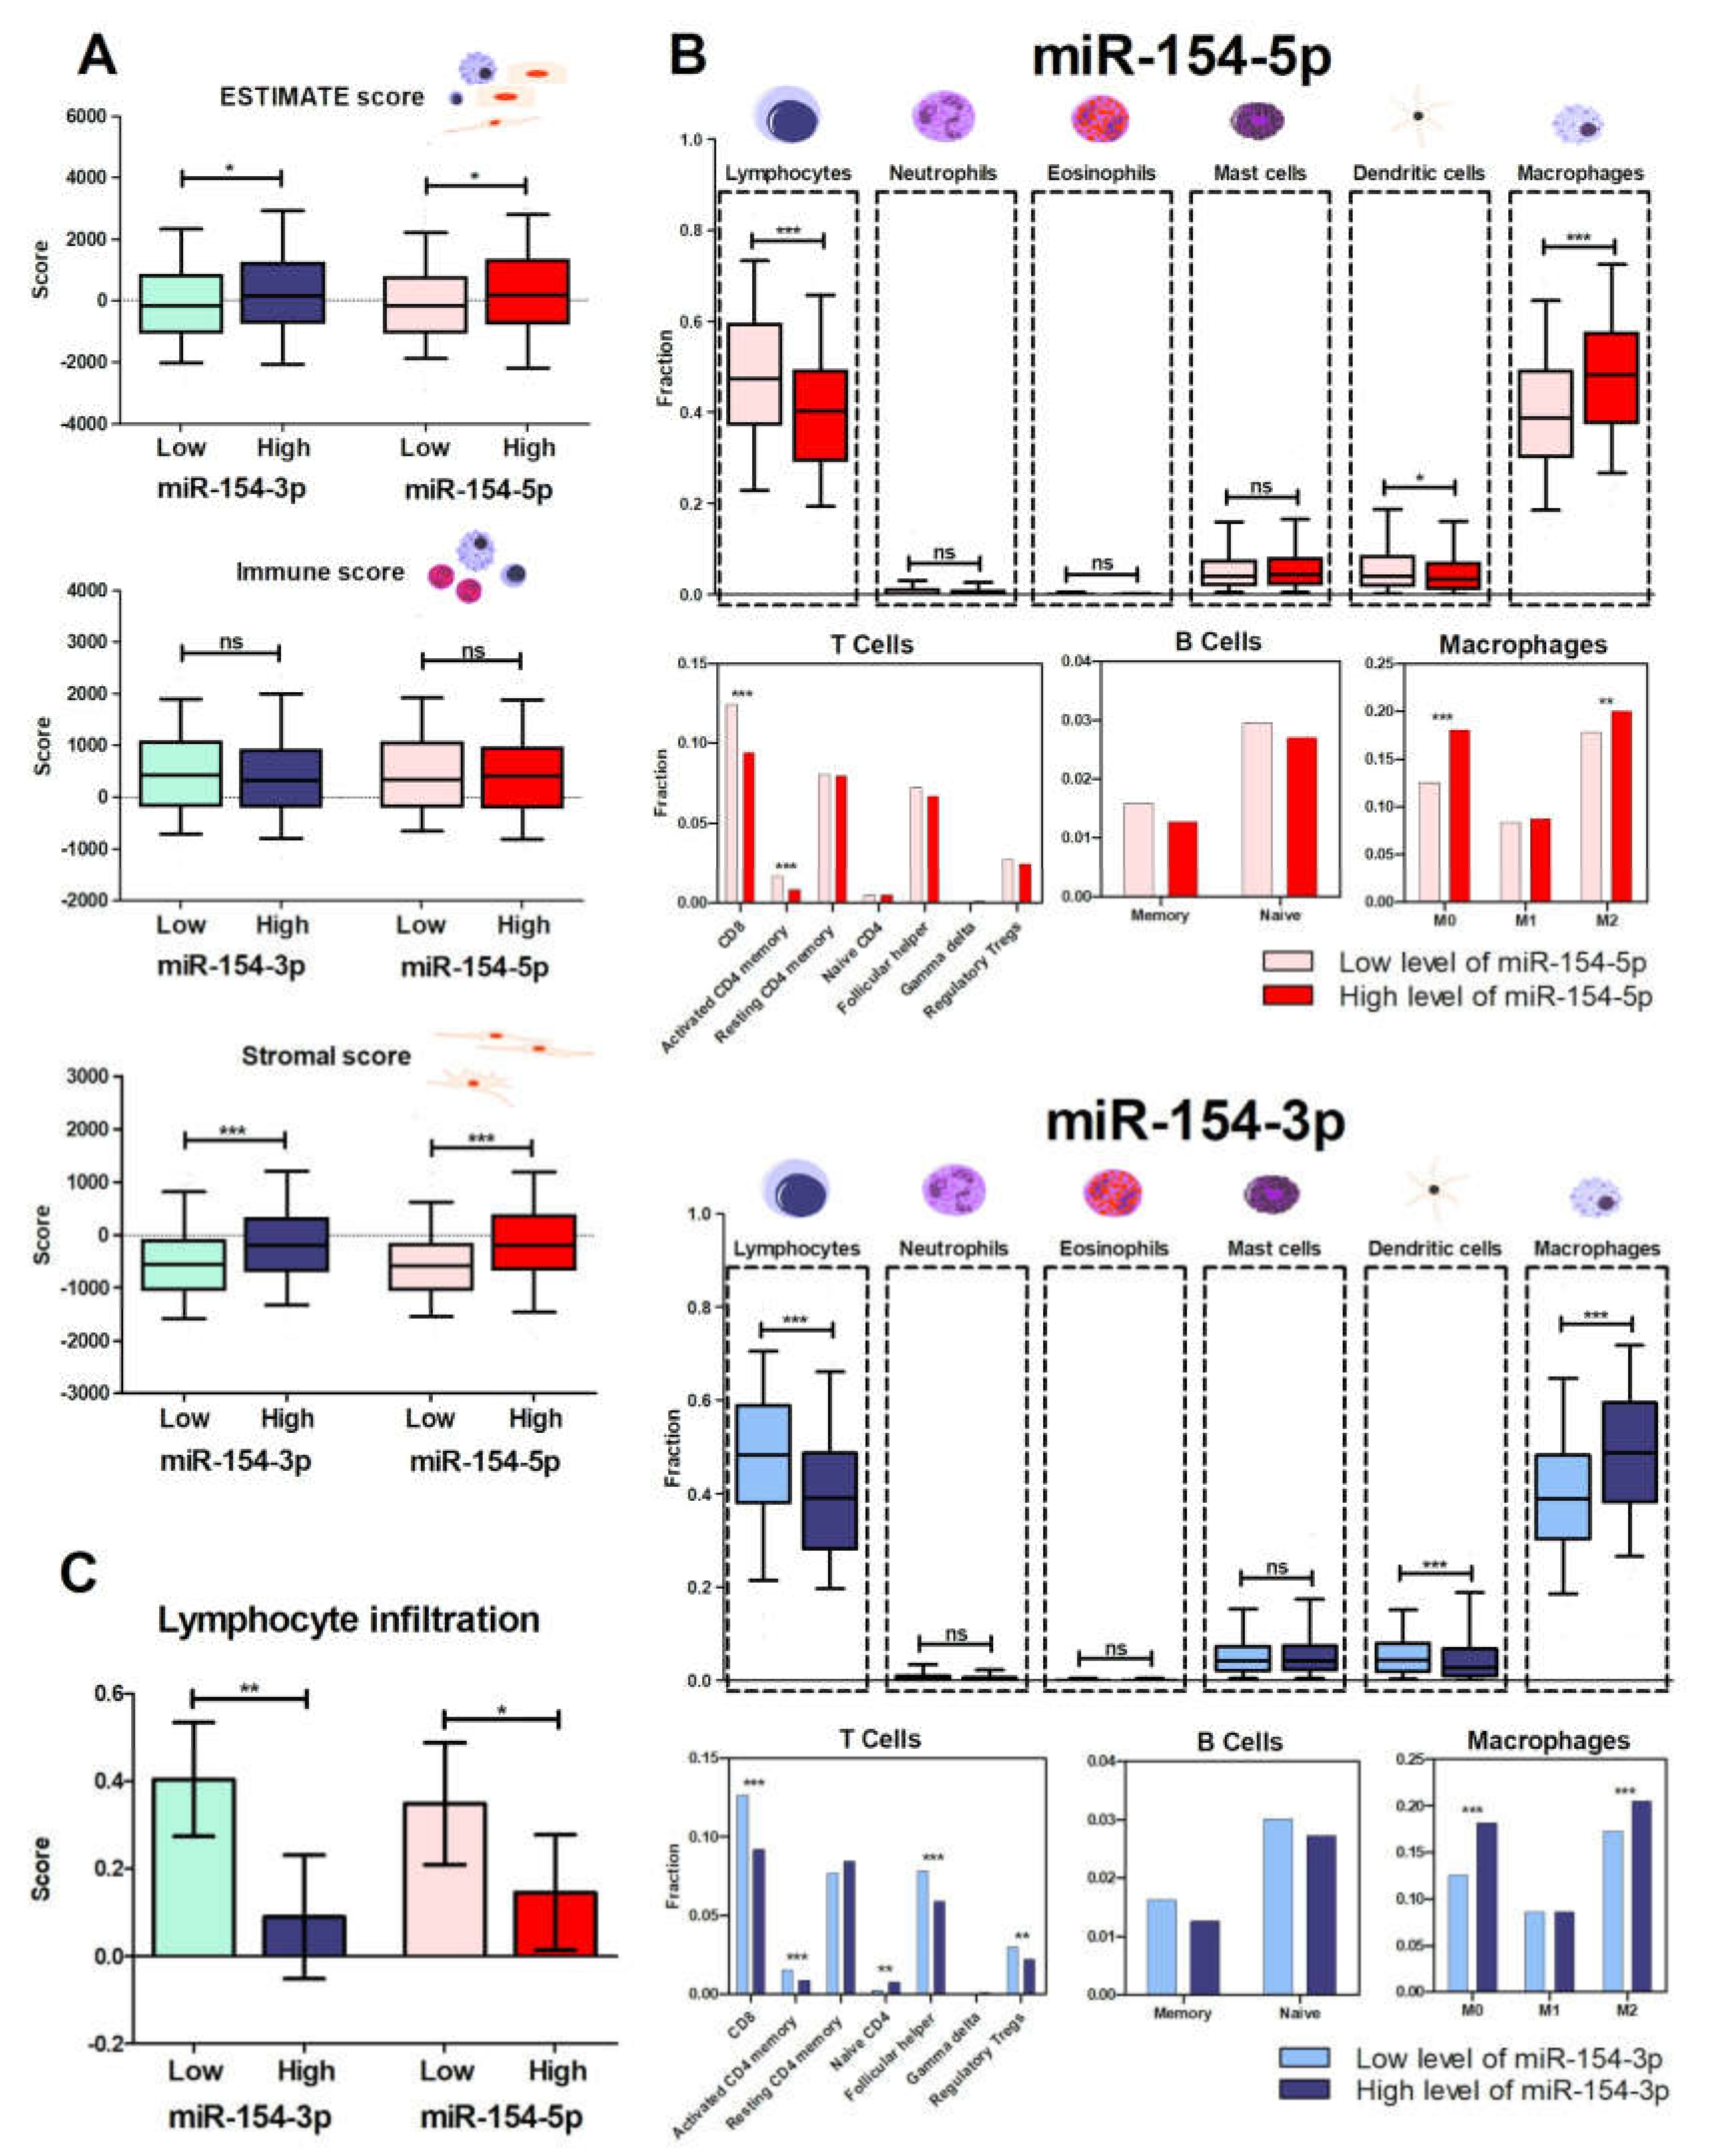
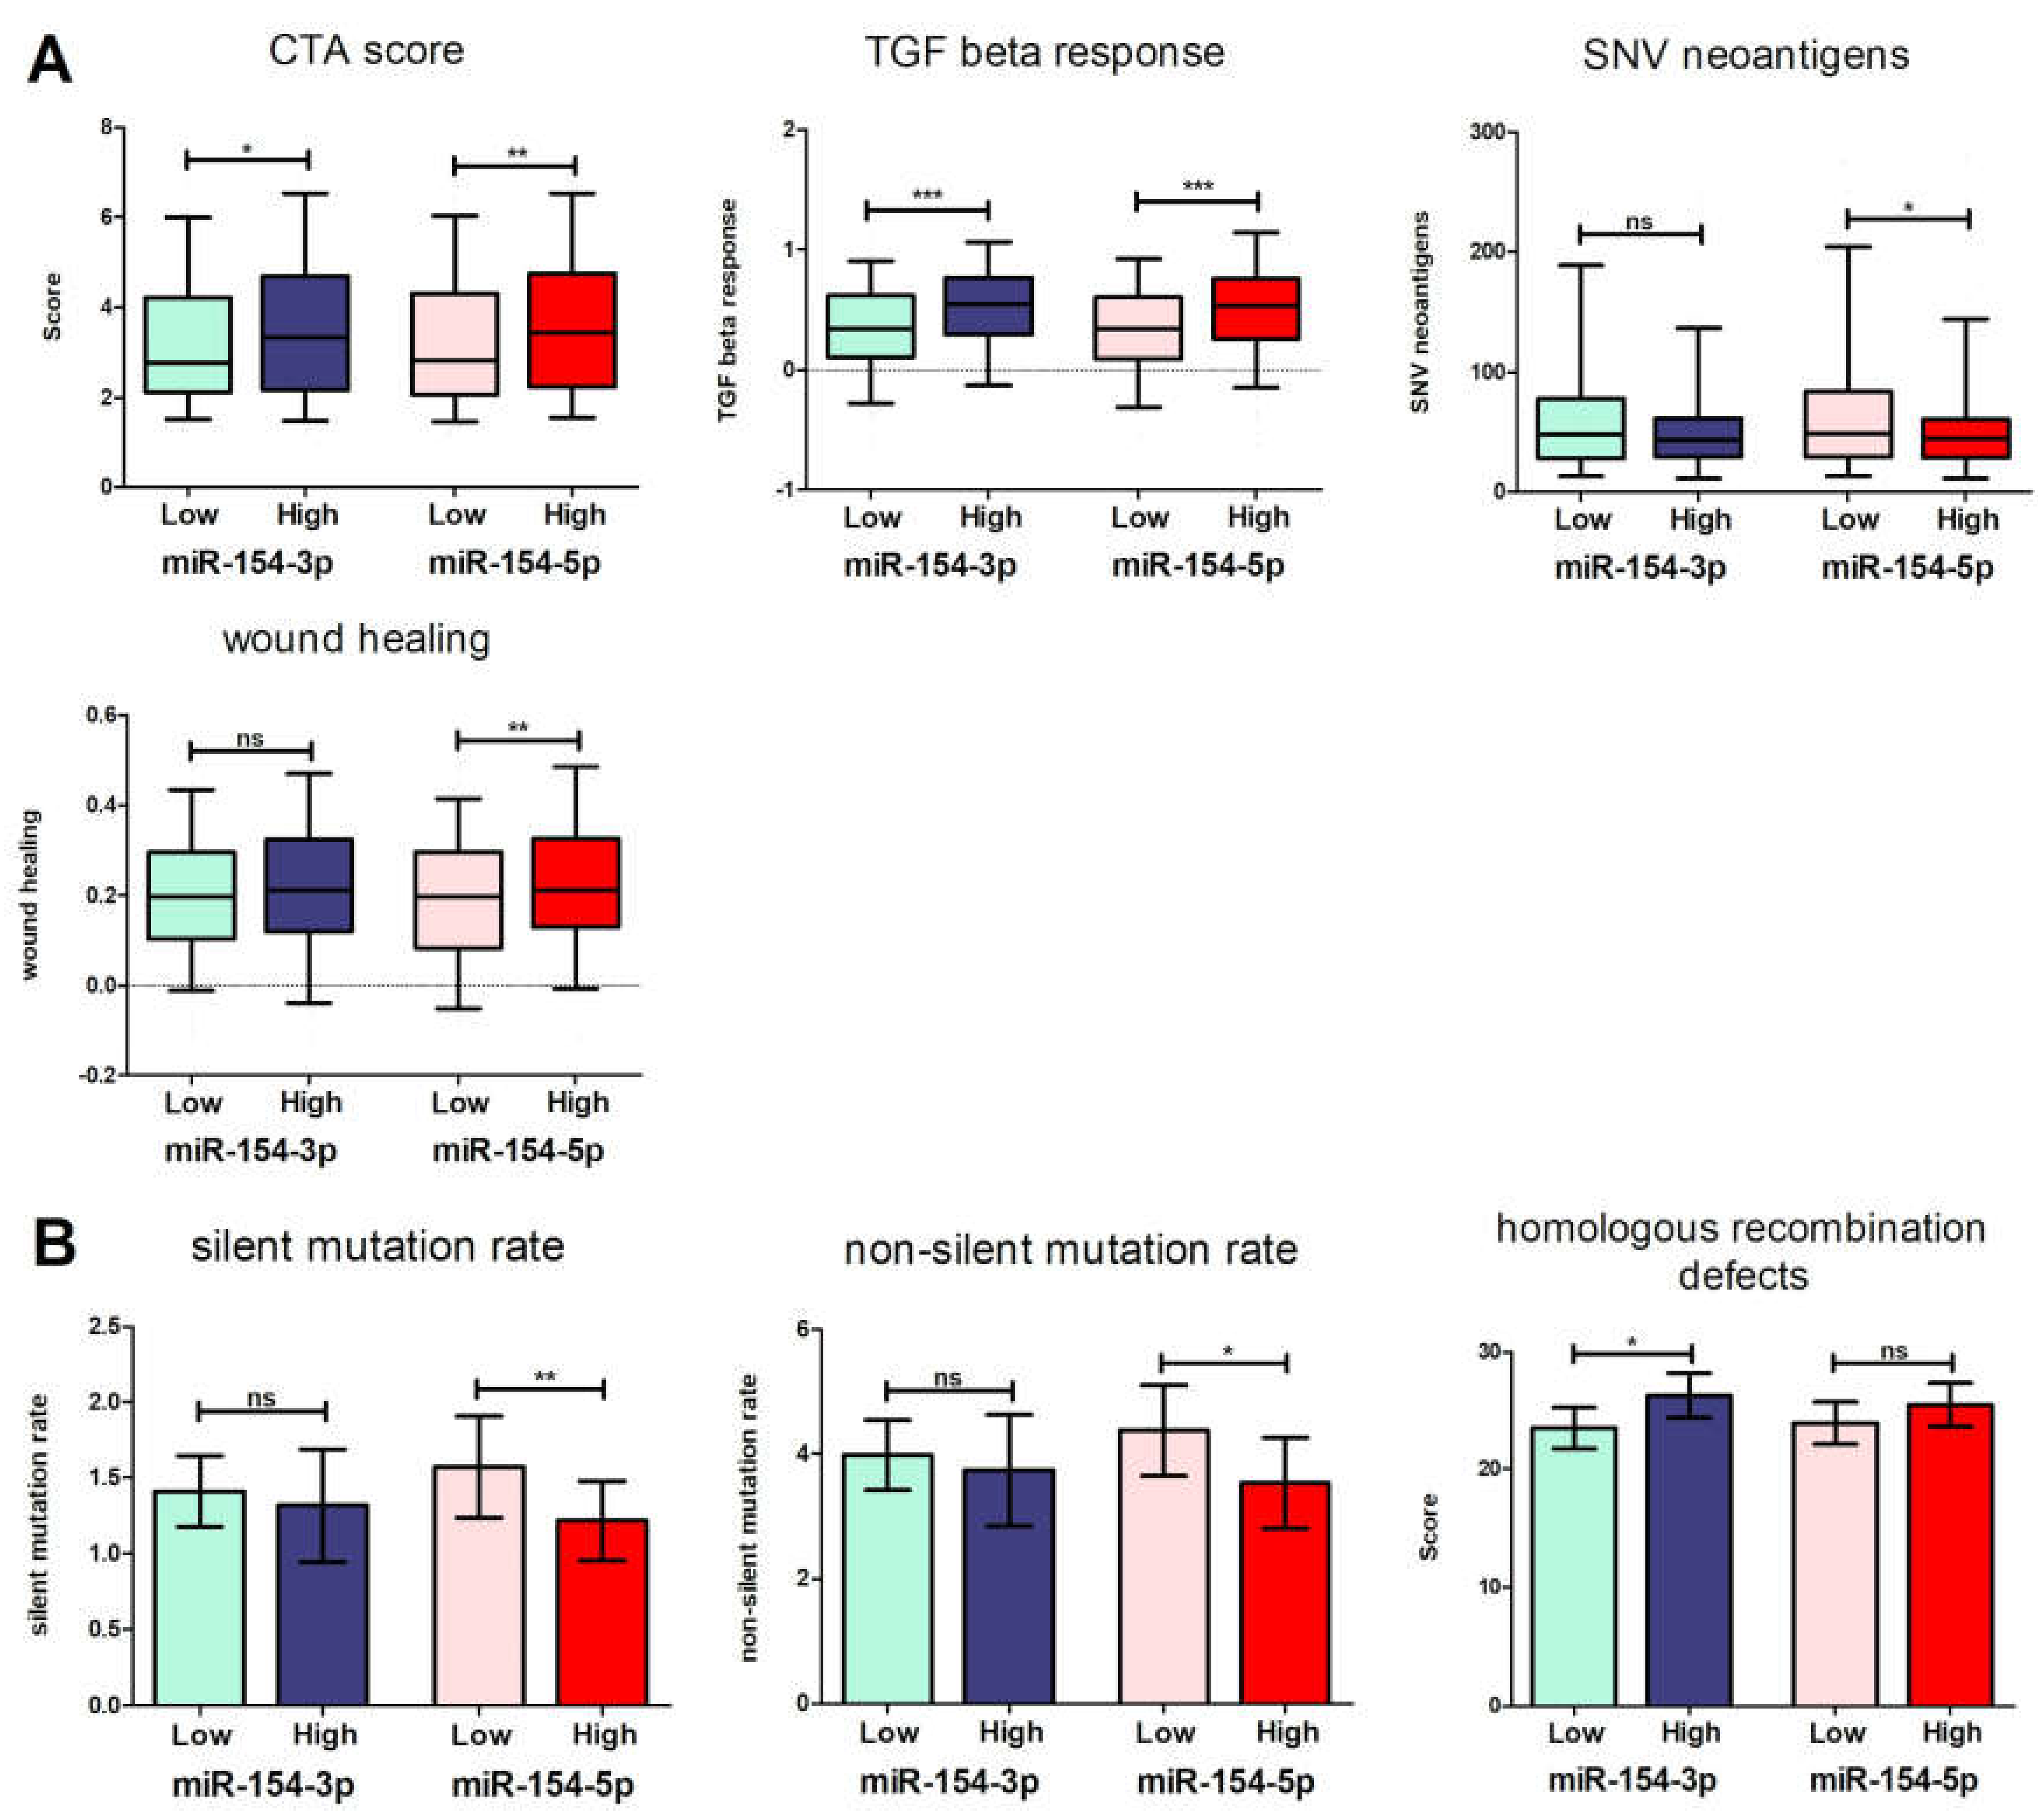
3.4. Patients with Low Levels of Both miR-154 Mature Strands Have a More Favorable Immunological Profile

The last step of this study was to assess the immune profile of the patients with high and low expression levels of miR-154-5p and miR-154-3p. The ESTIMATE analysis of the previously determined patient groups distinguished based on the mean miRNA expression values was conducted, and then the lymphocyte infiltration score and the distribution of the immune cell fractions among them were examined. Investigation of the ESTIMATE score, which determines the cellular composition (purity) of the tumor, showed statistically significant differences between individuals with high and low levels of miR-154-5p (p = 0.0112) as well as of miR-154-3p (p = 0.0373). Next, the immune score was analyzed, but no significant (p < 0.05) differences between the studied subgroups were observed. Subsequently, the stromal score, which indicates the presence of stroma in tumor tissue was assessed. It was indicated that the patients with low expression of both miR-154 strands had a significantly decreased stromal score (p < 0.0001 and p < 0.0001, respectively). All the data are presented in Figure 6A.
Even though the immune score did not show any differences between the studied groups, the infiltration of lymphocytes varied. Individuals with low expression levels of both miR-154-5p and miR-154-3p showed a higher lymphocyte infiltration signature score compared to the high expression subgroups (p = 0.0377 and p = 0.0014, respectively) (Figure 6B).
Finally, to complete the immunological profile of the patients, the fractions of lymphocytes, neutrophils, eosinophils, mast cells, dendritic cells, and macrophages were investigated. The patients with decreased levels of miR-154-3p and miR-154-5p manifested with an increased number of lymphocytes (0.4007 ± 0.009664 vs. 0.4825 ± 0.009494, p < 0.0001, and 0.4075 ± 0.009063 vs. 0.4770 ± 0.009941, p < 0.0001, respectively), as well as of dendritic cells (0.06019 ± 0.003871 vs. 0.04947 ± 0.003394, p = 0.0188, and 0.05744 ± 0.003241 vs. 0.05125 ± 0.004142, p = 0.0009, respectively). These individuals also had a less abundant fraction of macrophages in comparison to the high expression subgroups (0.3993 ± 0.009099 vs. 0.4799 ± 0.008778, p < 0.0001, and 0.3973 ± 0.008668 vs. 0.4856 ± 0.009344, p < 0.0001, respectively). Interestingly, analysis of T cell types showed precisely that the patients with decreased expression of both miR-154 strands were associated with an elevated number of CD8 cells (0.1244 ± 0.005575 vs. 0.09381 ± 0.004708, p < 0.0001, and 0.1265 ± 0.005365 vs. 0.09202 ± 0.004946, p < 0.0001, respectively) and activated CD4 memory T cells (0.01663 ± 0.001796 vs. 0.008100 ± 0.001094, p = 0.0002, and 0.01528 ± 0.001663 vs. 0.008664 ± 0.001272, p < 0.0001). Additionally, the low level of miR-154-3p was associated with an increased fraction of follicular helper (0.07836 ± 0.003174 vs. 0.05919 ± 0.002985, p < 0.0001) and regulatory T cells (0.02939 ± 0.001925 vs. 0.02206 ± 0.001910, p = 0.0019), along with the decreased number of CD4 naive cells (0.002255 ± 0.0006719 vs. 0.007444 ± 0.001656, p = 0.0055). Analysis of the different types of macrophages determined that the low miR-154-5p and miR-154-3p expression groups displayed a decreased fraction of M0 (0.1251 ± 0.008437 vs. 0.1806 ± 0.009722, p < 0.0001, and 0.1257 ± 0.008518 vs. 0.1819 ± 0.009964, p < 0.0001, respectively), as well as of M2 cells (0.1776 ± 0.005108 vs. 0.2002 ± 0.005761, p = 0.0035, and 0.1728 ± 0.005058 vs. 0.2048 ± 0.005938, p < 0.0001, respectively). All of the above data are presented in Figure 6C.
Considering the potential strong effect of the studied miRNA on immune cells, we decided to conduct analyses on the other data provided by Thorsson et al. concerning immune features [36]. It was found that the individuals with low expression levels of miR-154-3p and miR-154-5p manifest with a decreased CTA score (23.47 ± 0.8757 vs. 26.22 ± 0.9680, p = 0.0250, and 23.89 ± 0.9088 vs. 25.45 ± 0.9260, p = 0.0096, respectively) and weakened TGF beta response (0.3419 ± 0.02382 vs. 0.5294 ± 0.02439, p < 0.0001, and 0.3399 ± 0.02426 vs. 0.5129 ± 0.02402, p < 0.0001, respectively). Additionally, the group of patients with downregulated miR-154-5p had an elevated number of SNV neoantigens (74.77 ± 6.190 vs. 61.12 ± 7.012, p = 0.0358), along with worse wound healing (0.1883 ± 0.009551 vs. 0.2273 ± 0.009850, p = 0.0047) (Figure 7A).
Low levels of miR-154-5p were associated with elevated silent (1.570 ± 0.1701 vs. 1.216 ± 0.1324, p = 0.0067), and non-silent mutation rates (4.368 ± 0.3700 vs. 3.521 ± 0.3681, p = 0.0172). The patients with high miR-154-3p levels had an increased homologous recombination defect score in comparison to the low expression level group (23.47 ± 0.8757 vs. 26.22 ± 0.9680, p = 0.0243) (Figure 7B).
Analysis of the TCR and BCR parameters revealed statistically significant differences between the BCR Shannon entropy scores in the low and high expression groups of miR-154-3p (2.662 ± 0.1064 vs. 2.321 ± 0.1092, p = 0.0191) and miR-154-5p (2.711 ± 0.1086 vs. 2.281 ± 0.1070, p = 0.0071) (Figure 8A). It was also found that the individuals with a low expression level of miR-154-3p manifested with an increased TCR Shannon entropy value (2.500 ± 0.07305 vs. 2.259 ± 0.08075, p = 0.0261), (Figure 8B) and richness scores (22.03 ± 1.625 vs. 17.57 ± 1.621, p = 0.0063) (Figure 8C) in comparison to the opposite group of patients. Interestingly, high levels of miR-154-5p were associated with decreased BCR evenness value (0.8393 ± 0.009476 vs. 0.8642 ± 0.007099, p = 0.0361) (Figure 8B) and richness scores (67.57 ± 6.809 vs. 44.97 ± 5.597, p = 0.0207) (Figure 8C).

4. Discussion

Head and neck cancers are a group of neoplasms with a strong ability to metastasize to local lymph nodes, which in consequence leads to a high mortality rate [1,49]. Moreover, the standard treatment based on radiotherapy, chemotherapy, as well as immunotherapy does not bring satisfactory results and needs to be improved [50,51,52]. Personalization of therapy requires the use of biomarkers, which could help to diagnose and predict the patient outcome. The molecular biomarkers seem to be the best option because they may describe molecular states of the cell and dictate treatment strategies [53,54,55]. Among the widely studied types of molecules, which could become valuable oncology biomarkers, are RNAs. It was demonstrated that both protein-coding and non-coding RNAs such as miRNAs or long non-coding RNAs (lncRNAs) are dysregulated in HNSCC and are potentially useful in clinical practice [56,57,58,59,60,61].
In this study, we used data from TCGA to analyze the expression and the biological role of miR-154-5p and -3p strands, as well as their usefulness as biomarkers in HNSCCs.
Our first important observation was that miR-154-5p and miR-154-3p are downregulated in HNSCC patients, and miR-154-5p specifically distinguishes cancer-free from cancer tissue. GEO datasets were used to validate the results obtained with TCGA data. Our results corroborate the previous studies regarding laryngeal squamous cell carcinoma, showing that the expression level of miR-154 in tumors is decreased in comparison to the healthy tissue [18,19,20,21,22,23,24].
It was observed that the expression levels of miR-154 are significantly downregulated in oral squamous cell carcinoma (OSCC) tissues in comparison to tumor-free surgical margins [34].
Moreover, we indicated that neoplasms situated in the pharynx had the lowest expression levels of miR-154; however, the difference was statistically significant only when compared to the oral cavity. Niu et al. analyzed the expression of miR-154 and demonstrated its downregulation in laryngeal cancers, although the study focused only on the Chinese population [24]. In fact, extensive research concerning different HNSCC subsites is lacking. Our study analyzed TCGA data obtained from samples collected predominantly from Caucasians, and not Hispanic or Latino populations, but the results were confirmed using a GEO dataset generated from individuals from South America, improving the diversity and relevance of the findings.
We found that low expression of miR-154-5p and miR-154-3p was significantly associated with a higher N-stage. Decreased miR-154-5p was also linked with the III + IV cancer stages. Surprisingly, our results obtained using the GEO database were opposite; the expression of miR-154-5p was higher in stages III + IV. In agreement with TCGA dataset results, other studies showed that low levels of miR-154 correlate with more advanced disease (higher grade and/or cancer stages) [24,62,63] and could reflect different study populations. We observed the trend of higher expression levels of miR-154-5p depending on the histological differentiation status, where expression of that miRNA was the highest in the poorly differentiated cancers (GEO) and within the mesenchymal subtype (TCGA). However, as it had been previously indicated in gliomas, low expression of miR-154 was linked to the higher grade, large tumor size, and unfavorable Karnofsky score [19]. The same situation was described in the patients with bladder cancer, where miR-154 downregulation was significantly associated with more advanced tumor staging, higher histologic grades, and lymph node metastasis [22]. On the other hand, in melanoma tissues, the increased level of miR-154 correlated with higher stages of tumor development and ulceration [18].
In this study, there were no significant associations between miR-154 expression and age or sex in the patients from our dataset, which stays in agreement with other studies on various cancers [18,19,22]. Furthermore, we observed that the patients with positive HPV p16 status displayed low levels of both miR-154 strands. Vojtechova et al. indicated that two members of the miR-154 family, miR-323a-3p and miR-487a-3p, were dysregulated in HPV-positive compared to HPV-negative tonsillar tumors [64]. miR-154-5p and -3p are downregulated in HPV-positive cervical cancer cell lines, but their roles were not examined by the authors [65]. This observation was confirmed by Zhao et al. using different cervical tissues and cell lines. Knockdown of miR-154-5p in HPV-16-positive SiHa cells caused increased cell proliferation, migration, along with the invasive ability, and its upregulation led to the reversed effect. They proved that miR-154-5p directly binds to the 3′UTR of CUL2, the core component of the E3 ubiquitin protein ligase complex, which, in turn, regulates the steady-state levels and stability of pRb [66]. It is worth mentioning that no reports of the direct role of miR-154-5p or -3p in HPV-positive HNSCC are available, and their diagnostic and biological role should be determined in the future. The ambiguity of associations between miR-154 strands and various clinicopathological parameters corroborates the complex nature of this regulatory system. To draw precise conclusions, complex interaction networks should be considered, which we attempted with GSEA.
We investigated whether miR-154-5p and miR-154-3p could be used as prognostic biomarkers for the assessment of individuals with HNSCC. We observed that the patients with lower levels of miR-154-3p and miR-154-5p had better OS compared to the group with high expression. The results from a study by Lin et al. confirmed this finding in renal cell carcinoma; however, the expression level of this miRNA was upregulated in cancer tissues [25]. Niu et al. described the reverse correlation between miR-154 and laryngeal cancer patient survival compared to our results [24]. Moreover, the same observation was proved for melanoma [18], glioma [19], and bladder cancer [22]. However, there is no available information about the influence of the miR-154 expression level on the OS in NSCLC [20], breast cancer [21], and gastric cancer [23]. It should be emphasized that there are no other independent studies concerning miR-154 in HNSCC than that presented by Niu et al. The authors were aware of the discrepancies between the results of their analyses, e.g., of the association of low miR-154-3p with a higher N-stage (tumor-suppressive character) and better OS (oncogenic role); however, these types of correlations rarely provide unequivocal results when based on a single miRNA. Moreover, it is well-known that the biology of neoplastic cells differs significantly from that of normal cells, and primary neutral miRNAs regulating tens or even hundreds of mRNA transcripts can be turned into pro- or antitumor molecules [67].
GSEA showed an association of higher levels of miR-154-5p and miR-154-3p with the enrichment of genes from oncogenic and cancer hallmark signature sets. The most dysregulated genes were related with the signaling pathways such as AKT-MTOR, CYCLIN D1, KRAS, EIF4E, RB, and ATM, which play an essential role in cancer cell proliferation, survival, and response to external stimuli. For example, E2F transcriptional activity is tightly regulated throughout the cell cycle via transcriptional and translational regulation, post-translational modifications, protein degradation, binding to cofactors, and subcellular localization. Furthermore, E2F participates in apoptosis and cell differentiation. Alterations in components of this pathway coincide with poor prognosis in cancers, emphasizing their importance for the clinical cancer phenotype. An intriguing addition to the understanding of E2F crosstalks was the finding that their activity could be regulated by miRNAs whose dysregulation has been implicated in malignancy. In turn, miRNAs themselves are targets of the E2F family proteins establishing negative feedback loops [68,69]. In breast cancer tissues, E2F5 was identified as a target of miR-154 with the inversely correlated expression. Additionally, it has been reported that in breast cancer cell lines (MCF-7), overexpression of miR-154 significantly inhibited cell proliferation, migration, and invasion, as well as increased cell arrest at the G0/G1 stage. These findings indicate that miR-154 acts as a tumor suppressor targeting E2F5 in breast cancer [70]. In this study, we proved that genes from the E2F target dataset had a decreased expression in the group of patients with high miR-154 levels. Moreover, those genes are potential targets of miR-154-5p. Thus, E2F could be recognized as a potential target of miR-154, and as a result of its degradation, there may be a reduction in the expression of these transcription factors’ target molecules.
The genes involved in the G2/M checkpoint play a crucial role in progression through the cell division cycle. The G2 checkpoint prevents cells from entering mitosis when DNA is damaged, providing an opportunity for repair and inhibition of damaged cells proliferation. When mammalian cells contain damaged DNA, the p53 tumor suppressor and the Rb family of transcriptional repressors work together to downregulate a broad number of genes that encode proteins required for the G2 and M checkpoints. Elimination of these essential cell cycle proteins helps to keep the cells arrested in G2 [71,72]. Many studies have confirmed that miRNAs are involved in cell cycle arrest in the G2/M phase. In renal tubular cells, hypoxia induces G2/M arrest, leading to renal fibrosis via the miR-493-STMN-1 pathway [73]. miR-192 is responsible for the G2/M arrest in the proximal tubular epithelial cells after toxic injury by aristolochic acid [74]. On the other hand, evidence from endometriotic cells suggests that miR-210-3p attenuates the G2/M cell cycle checkpoint by inactivating the BRCA1 complex function in response to DNA damage under hypoxia via targeting the 3′ untranslated region of BARD1 mRNA [75].
We also observed enrichment in the TBK1 gene set supporting the data of Barbie et al. who studied the epithelial lung cancer cell lines upon overexpression of an oncogenic form of the KRAS gene and knockdown of the TBK1 gene by RNAi. In experiments on human cancer cell lines, the lack of TBK1 induced apoptosis which was specifically dependent on oncogenic KRAS expression. In these cells, TBK1 activated NF-kappaB antiapoptotic signals involving c-Rel and BCL-XL, which were essential for survival and provided mechanistic insights into this synthetic lethal interaction. These observations indicate that TBK1 and NF-kappaB signaling is fundamental in KRAS-mutated tumors and establishes a general approach for the rational identification of codependent pathways in cancer [76].
The most important finding from this study was that high miR-154-5p and miR-154-3p expression levels were positively correlated with the EMT pathway in the HNSCC patients. It should be emphasized that the EMT pathway was enriched in all the localizations of HNSCC tumors. It had been confirmed before that miR-154 promoted EMT in prostate cancer cells. In several isogenic prostate cancers, the ARCaP and LNCaP lines that drive the EMT and bone metastasis in mice were significantly increased in populations with high miR-154 levels. Inhibition of miR-154-3p (miR-154*) in mice led to a decrease in bone metastases along with an increase in survival [77,78]. Interestingly, Chen et al. proved that overexpression of miR-154-5p in nasopharyngeal carcinoma (NPC) cell line models suppresses their invasion and migration. Their mechanistic studies showed the regulatory function of the said miRNA which, by directly binding the 3′UTR of kinesin-like protein 14 (KIF14) mRNA, inhibits NPC metastasis [62].
Based on the target prediction tools, we selected 24 genes that were potential targets for miR-154-5p, and the expression levels of those genes were negatively correlated with the expression levels of miR-154-5p in the HNSCC patients. In that group VPS4B, LRRC1, DMXL1, NPEPPS, XPO7, LIN54, CEACAM7, CNOT4, C12ORF29, WAC, LIN9, RNF138, GNAI3, and DCAF16 had not been described previously in the context of the HNSCC nor EMT process. Our results indicated that those genes were co-expressed, had physical interactions, and were involved in the ESCRT, cell cycle, as well as viral replication.
The connections with HNSCC and EMT have been reported for ten genes. Zhang et al. observed that MYO6 (myosin VI) was upregulated in OSCC and was associated with the regulation of cell cycle progression and apoptosis [79]. In gastric cancer, MYO6 acts as a pro-metastatic or pro-EMT gene and is directly regulated by miR-143, as well as by miR-145 [80]. Moreover, the identified potential target of miR-154-5p was OVOL1 (ovo-like transcriptional repressor 1) which was described as an important transcription factor in the mesenchymal-to-epithelial transition (MET) process [81,82]. It was proved that OVOL1 together with OVOL2 influenced the cellular phenotype by regulation of transcription factor ZEB1 and epithelial splicing regulatory protein 1 (ESRP1), which regulated mRNA splicing [82]. It has also been postulated that the family of transcription factors OVOL play a multiway function in cellular phenotype regulation by preventing EMT, driving MET, regulating the transition state (hybrid epithelial/mesenchymal), and maintaining a two-step process of transition EMT and MET [83]. We also observed that ABI1 (abl interactor 1) was negatively correlated with miR-154-5p. It has been indicated that low ABI1 expression was associated with metastasis and shorter survival of prostate cancer patients. Based on the in vitro studies, it has been revealed that ABI1 causes activation of the noncanonical WNT signaling and EMT pathways [84]. Another study showed that ABI1 has an inverse function, and its upregulation induced the EMT process and increased stem cell activity in breast cancer [85]. Furthermore, Fang et al. showed that the SOS1/EPS8/ABI1 complex was pivotal for ovarian cancer cells during the EMT process [86]. We also identified CDKN2B as a potential target. Reduced expression of CDKN2B was determined as a marker of disease recurrence in oral cancer [87]. In the case of hepatocellular carcinoma, reduced expression of CDKN1A and CDKN2B is connected with the EMT process, migration, and cell cycle progression [88]. Another identified target within this study was ESRP1. ESRP1 and ESRP2 play an important role in alternative splicing, and their expression is reduced during the EMT process [89]. It has been indicated that both were upregulated in dysplastic samples of OSCC, but their reduction was probably restricted in the cells that had a motile phenotype acquired during cancer invasion [90]. The next two miR-154-5p targets connected with EMT were CPEB3 and PLAGL2. Zhong et al. demonstrated that CPEB3 played a crucial role in the EMT process by regulation of the interaction between cancer cells and tumor-associated macrophages (TAMs). Its functions included inhibition of IL-6R/STAT3 signaling by binding to IL-6R mRNA in cancer cells as well as inhibition of the IL-6 molecule in TAMs by CPEB3. Finally, CPEB3 prevented secretion of CCL2 molecules in cancer cells and caused a reversion of the polarity of M2 macrophages [91]. Moreover, the role of CPEB3 in the progression of cervical cancer as well as in tumorigenesis and metastasis of lung adenocarcinoma was shown [92,93]. PLAGL2 (PLAG1-like zinc finger 2) seems to have an opposite role to CPEB3. It has been shown that PLAGL2 promoted EMT by USP37-mediated deubiquitination of Snail1 in gastric cancer [94], as well as β-catenin-dependent regulation of ZEB1 in colorectal cancer [95]. Additionally, higher levels of PLAGL2 were associated with metastasis [95] and finally with worse patient survival [94]. It should be noted that Wang et al. identified PLAGL2 as well as MAPKAPK5-AS1 as the direct targets of miR-154-5p and the MAPKAPK5-AS1/PLAGL2/HIF-1α signaling loop that is responsible for progression and metastasis of hepatocellular carcinoma [96]. We indicated that the next potential target for miR-154-5p was PTBP3. Wu et al. observed that PTBP3 was responsible for migration through the regulation of E-cadherin, influencing the EMT process, and its higher expression was associated with shorter survival in NSCLC [97]. However, Hou et al. demonstrated that PTBP3 was associated with lymph node metastasis, advanced stages, and poor OS of breast cancer patients. PTBP3 directly regulates the EMT process and cancer stem cells by binding to the 3′UTR of ZEB1 [98]. The last two potential miR-154-5p targets were TMPRSS11D and NSD2. Both of them have been described in HNSCC. The first one, TMPRSS11D, was one of the nine hub genes significantly correlated with HNSCC, and its higher levels were associated with better survival [99]. The other one, NSD2, was identified as altered in 6% of HNSCCs and is one of the lysine methyltransferases [100]. It has been observed that the low expression level of NSD2 was correlated with reduced OS of HPV-positive patients [101]. Nevertheless, NSD2 was overexpressed in patients with advanced cancer, who had poorly differentiated tumors, and its levels were higher than in normal epithelia. NSD2 directly regulated the transcription of NIMA-related kinase-7 (NEK7), which is a cell cycle regulator [102]. Moreover, lower levels of NSD2 caused a higher expression of the E-cadherin protein and decreased N-cadherin as well as vimentin. NSD2 interacts with TWIST1 and causes upregulation of H3K36me2, which, in turn, is manifested with EMT promotion [103].
Finally, our analysis of immunological features in groups of patients with low or high expression of both miR-154 mature strands demonstrated some intriguing differences. The obtained results suggest that individuals with decreased miR-154-5p and miR-154-3p can be characterized by more favorable features. First of all, our assessment of the ESTIMATE score determined that these patients have lower tumor purity. Decreased values of this parameter were previously correlated with worse prognosis in, e.g., gastric cancers [104,105], colon cancer [106], and glioma [107]; however, it should be noted that the ESTIMATE score is calculated based on the stromal and immune scores. The large amount of stromal cells recruited from endogenous tissue promotes tumor growth and secrete many factors that influence angiogenesis, proliferation, and metastasis [108], though increased infiltration of immune cells is far more complicated to interpret.
Mandal et al. demonstrated that HNSCCs are among the most highly immune-infiltrated cancer types with an especially abundant T cell fraction, which indicates a better prognosis and response to immunotherapeutic approaches [109]. It should be emphasized that the positive impact is associated with high fractions of CD3+, CD8+, and regulatory T cells [109,110]. Interestingly, overexpression of CD3 is strongly correlated with better clinical outcomes of specifically HPV-negative individuals [110,111]. The increased counts of CD8+ lymphocytes do not bear an unequivocal prognostic function when correlated with the HPV infection status [110,112]. Nevertheless, Balermpas et al. showed that high levels of both CD3 and CD8 cells were significantly associated with improved distant metastasis-free survival (DMFS), which could imply the presence of a systemic immunosurveillance mechanism suppressing the development of micrometastases [110]. It is worth mentioning that da Silva et al. discovered a link between CD8+ T cells and expression of the genes coding CTA [113]. Protein products of these sequences can be found in only one healthy tissue—in the testis, and in a variety of tumor types, where they induce an immunological response [114]. It has been proven that in HNSCC, high levels of CTAs associated with a good prognosis are correlated with elevated counts of CD8+ T cells [113]. Our results also indicate the link between better OS and an increased level of CD8+ lymphocytes in low miR-154 expression groups; however, the CTA scores are higher in the opposite groups of patients. We believe it is due to the fact that we worked on Thorssons’ CTA score values, which were assessed using a pool of various CT genes, without distinguishing them into groups related to good or poor prognosis [36].
Analysis of immune cell fractions infiltrating the tumor showed a decreased number of macrophages in the groups of patients with low expression of both miR-154 strands. Kumar et al. proved that high density of TAMs, specifically of those with the M2-like phenotype, plays a crucial role in tumor progression, as well as metastasis, and correlates with worse clinicopathological features [115]. Interestingly, TAMs are characterized by downregulated expression of E-cadherin and elevated levels of mesenchymal markers, e.g., vimentin, Snail, and Slug, which could imply its involvement in the EMT [116]. A study by She et al. observed that CD163-positive macrophages (M2-like) play a pro-tumoral role and, when co-cultured with cancer cells, release TGF beta, epidermal growth factor (EGF) and upregulate ERK1/2, inducing tumor growth [116]. This type of macrophages inhibits proinflammatory M1-like ones through the production of, e.g., IL-10, TGF beta, as well as VEGF, leading to angiogenesis and tissue remodeling [117]. Additionally, IL-10 and TGF beta induce conversion of the M0 macrophages to the M2c type [118]. It should be emphasized that in HNSCC, pathways including TGF beta and FGFR are known to interact with EGFR signaling, which affects the wound healing process and could lead to EMT [119]. All of the above is reflected in our results, especially in the case of miR-154-5p. The high expression group had not only elevated macrophages, particularly M0 and M2, but also increased TGF beta response and elevated wound healing signatures, which confirms its substantial role in EMT and tumor progression. In addition, we determined that miR-154-5p reaches the highest expression level in the mesenchymal subtype of HNSCC in comparison to others, which seems to additionally corroborate the above statement. A recent study analyzing immune signatures in HNSCC proposed three different subtypes of these malignancies Immunity-H, -M, and -L (high, medium, and low, respectively). The first one was characterized by increased immune and stromal infiltration, low tumor purity, low stemness, as well as intratumor heterogeneity, genomic stability, and favorable prognosis in contrast to the immunity-L subtype [120]. These findings seem to support our obtained results. Yoshihara et al. suggested that in HNSCC, tumor purity is correlated with mutation rates, which is especially interesting while taking into account higher silent and non-silent mutation rates discovered by us in a group of individuals with decreased levels of miR-154-5p [47]. They also implied that in some low-purity neoplasms, reduction in the T > A substitutions indicates an impact of the tumor microenvironment on mutational processes or that mutation types can alter the stromal and immune infiltrations in tumors [47]. Furthermore, the above study suggested that the stromal expression pattern could overlap with the mesenchymal phenotype of tumors, which, in addition to the strong correlation with tumor purity, could result in incorrect classification of an increased presence of tumor-associated stroma as an EMT process [47]. Nonetheless, our knowledge of the miR-154-5p involvement in the abovementioned transition, along with the data obtained during this research, excludes the possibility of the aforementioned misinterpretation.
The Immunity-H subtype is associated with a higher rate of HPV infections in comparison to the Immunity-L subtype (40% vs. 22%) [120]. It has been proven that HPV-positive patients with oropharyngeal squamous cell carcinoma (OPSCC) who are current smokers or have tobacco use history tend to have a dysregulated ncRNA expression landscape, including downregulation of miR-154-5p, and unfavorable treatment outcomes [121]. A study by Huang et al. indicated that smokers and lung cancer patients also manifest with low levels of miR-154 mature strands. Significant differences between these two groups of individuals and controls suggest the miR-154-5p diagnostic potential and imply an important role in the biology of cigarette smoke-induced lung cancer [122]. On the other hand, analysis of the miR-154-3p levels in plasma samples in groups of healthy smokers, individuals with lung granuloma and lung adenocarcinoma showed its overexpression in both types of patients. Those significant differences suggest that this molecule could help discriminate adenocarcinoma from lung granuloma in the future [123]. Interestingly, HNSCC patients with high molecular smoking signatures have an elevated number of mutations and decreased T cell infiltration, which is associated with local immunosuppression, low levels of cytotoxicity, and poor survival [109].
The broad network of miR-154 interactions includes many molecular pathways essential for tumor development and progression. Further research to explore the role of this molecule, as well as its diagnostic and therapeutic potential, could yield results relevant to the quality and life expectancy of HNSCC patients.
In conclusion, our results indicate that miR-154 plays an essential role in HNSCC development and progression, presumably through its influence on the Epithelial-to-Mesenchymal transition process and the regulation of phenotype of both cancer and immune cells. miR-154-5p targets the genes involved in the ESCRT, cell cycle, and viral replication, which are connected with the EMT process in other cancers as well. miR-154 has a potential to be used as a biomarker describing clinical, molecular, and immunological features of HNSCC patients. Moreover, the implementation of miR-154 in diagnosis and therapy might lead to the progress in the discovery of modern neoplasm treatment methods. However, it should be noted that the above data were obtained from in silico analyses and require further validation. miR-154 is a molecule with a tremendous medical potential whose exploration may bring significant improvement in understanding HNSCC, and thus more effective treatment development.

Supplementary Materials

The following are available online at https://www.mdpi.com/article/10.3390/biomedicines9121894/s1, Table S1: List of processes based on the GSEA analysis of MSigDB gene sets enriched in HNSCC patients with lower and higher levels of miR-154-5p in all localization as well as depending on the localization in oral cavity, larynx or pharynx, Table S2: Correlation between miR-154-5p and 24 genes selected based on miRNA targets with score, function and interactions between targets using the GeneMANIA tool.

Author Contributions

Conceptualization: J.K.-M., T.K., P.S. and K.L.; methodology: W.T., J.K.-M., D.B., T.K. and P.S.; investigation: A.P., S.S., D.B., W.T., J.K.-M. and T.K.; data curation: D.B., W.T., J.K.-M. and P.S.; writing—original draft preparation: A.P., S.S., D.B., W.T., J.K.-M. and T.K.; writing—review and editing: D.B., W.T., J.K.-M., T.K., U.K., P.S. and K.L.; visualization: D.B., W.T., J.K.-M. and T.K.; supervision: T.K., U.K., and K.L.; W.T. and J.K.-M. contributed equally to this work. All authors have read and agreed to the published version of the manuscript.

Funding

This work was supported by Poznan University of Medical Sciences, scientific and educational activity of the Chair of Medical Biotechnology, Department of Cancer Immunology, and by the Greater Poland Cancer Center, Research and Implementation Unit and Laboratory of Cancer Genetics.

Institutional Review Board Statement

The study was based on the analysis of freely available datasets and did not need any ethics committee’s approval and does not violate the rights of other persons or institutions.

Informed Consent Statement

Not applicable. This study used the data from TCGA, which are freely available and do not violate any rights of people or institutions.

Data Availability Statement

All the data are available online with common access. The data analyzed during this study are available from the corresponding author on reasonable request.

Acknowledgments

Analysis for this publication was partially made during the class “Analysis of Experimental Data” performed at the Chair of Medical Biotechnology, Department of Cancer Immunology, Poznan University of Medical Sciences, during the hard for all COVID-19 pandemic time in 2019/2020. T.K. acknowledges all the students for hard work during the class and the “online” time spent preparing this manuscript.

Conflicts of Interest

All authors read and approved the final manuscript. The authors declare that there is no conflict of interest regarding the publication of this paper.

References

  1. Marur, S.; Forastiere, A.A. Head and neck cancer: Changing epidemiology, diagnosis, and treatment. Mayo Clin. Proc. 2008, 83, 489–501. [Google Scholar] [CrossRef]
  2. Kolenda, T.; Guglas, K.; Ryś, M.; Bogaczyńska, M.; Teresiak, A.; Bliźniak, R.; Łasińska, I.; Mackiewicz, J.; Lamperska, K.M. Biological role of long non-coding RNA in head and neck cancers. Rep. Pract. Oncol. Radiother. 2017, 22, 378–388. [Google Scholar] [CrossRef] [PubMed]
  3. Lubov, J.; Maschietto, M.; Ibrahim, I.; Mlynarek, A.; Hier, M.; Kowalski, L.P.; Alaoui-Jamali, M.A.; Da Silva, S.D. Meta-analysis of microRNAs expression in head and neck cancer: Uncovering association with outcome and mechanisms. Oncotarget 2017, 8, 55511–55524. [Google Scholar] [CrossRef] [Green Version]
  4. Dok, R.; Nuyts, S. HPV Positive Head and Neck Cancers: Molecular Pathogenesis and Evolving Treatment Strategies. Cancers 2016, 8, 41. [Google Scholar] [CrossRef] [Green Version]
  5. Jou, A.; Hess, J. Epidemiology and Molecular Biology of Head and Neck Cancer. Oncol. Res. Treat. 2017, 40, 328–332. [Google Scholar] [CrossRef] [PubMed]
  6. van Kempen, P.M.W.; Noorlag, R.; Braunius, W.W.; Stegeman, I.; Willems, S.M.; Grolman, W. Differences in methylation profiles between HPV-positive and HPV-negative oropharynx squamous cell carcinoma: A systematic review. Epigenetics 2014, 9, 194–203. [Google Scholar] [CrossRef] [Green Version]
  7. Dahiya, K.; Dhankhar, R. Updated overview of current biomarkers in head and neck carcinoma. World J. Methodol. 2016, 6, 77–86. [Google Scholar] [CrossRef] [PubMed]
  8. Kalia, M. Personalized oncology: Recent advances and future challenges. Metabolism 2013, 62 (Suppl. 1), S11–S14. [Google Scholar] [CrossRef] [PubMed]
  9. Fassan, M. Molecular diagnostics in pathology time for a next-generation pathologist? Arch. Pathol. Lab. Med. 2018, 142, 313–320. [Google Scholar] [CrossRef] [PubMed] [Green Version]
  10. Xiao, M.; Liu, L.; Zhang, S.; Yang, X.; Wang, Y. Cancer stem cell biomarkers for head and neck squamous cell carcinoma: A bioinformatic analysis. Oncol. Rep. 2018, 40, 3843–3851. [Google Scholar] [CrossRef] [Green Version]
  11. Su, N.; Wang, Y.; Qian, M.; Deng, M. Combinatorial regulation of transcription factors and microRNAs. BMC Syst. Biol. 2010, 4, 150. [Google Scholar] [CrossRef] [PubMed] [Green Version]
  12. Nagadia, R.; Pandit, P.; Coman, W.B.; Cooper-White, J.; Punyadeera, C. miRNAs in head and neck cancer revisited. Cell. Oncol. 2013, 36, 1–7. [Google Scholar] [CrossRef] [PubMed]
  13. Irani, S. miRNAs Signature in Head and Neck Squamous Cell Carcinoma Metastasis: A Literature Review. J. Dent. (Shiraz Iran.) 2016, 17, 71–83. [Google Scholar]
  14. Carron, J.; Msc, C.T.; Silva, J.K.; Bsc, G.S.R.Q.; Ortega, M.M.; Lima, C.S.P.; Lourenço, G.J. microRNAs deregulation in head and neck squamous cell carcinoma. Head Neck 2021, 43, 645–667. [Google Scholar] [CrossRef]
  15. Ghafouri-Fard, S.; Gholipour, M.; Taheri, M.; Farsani, Z.S. MicroRNA profile in the squamous cell carcinoma: Prognostic and diagnostic roles. Heliyon 2020, 6, e05436. [Google Scholar] [CrossRef] [PubMed]
  16. Emmett, S.; Whiteman, D.C.; Panizza, B.J.; Antonsson, A. An Update on Cellular MicroRNA Expression in Human Papillomavirus-Associated Head and Neck Squamous Cell Carcinoma. Oncology 2018, 95, 193–201. [Google Scholar] [CrossRef]
  17. Kolenda, T.; Teresiak, A.; Kapałczyńska, M.; Przybyła, W.; Zajączkowska, M.; Bliźniak, R.; Lamperska, K. let-7d and miR-18a as biomarkers of head and neck cancers. Lett. Oncol. Sci. 2015, 12, 37–47. [Google Scholar]
  18. Wang, J.; Fang, Y.; Liu, Y.-F.; Wang, X.; Wang, R.-Y.; Meng, Z.-D. miR-154 inhibits cells proliferation and metastasis in melanoma by targeting AURKA and serves as a novel prognostic indicator. Eur. Rev. Med. Pharmacol. Sci. 2019, 23, 4275–4284. [Google Scholar]
  19. Wang, L.; Wu, L.; Wu, J. Downregulation of miR-154 in human glioma and its clinicopathological and prognostic significance. J. Int. Med. Res. 2016, 44, 994–1001. [Google Scholar] [CrossRef] [Green Version]
  20. Liu, S.; Yang, Y.; Chen, L.; Liu, D.; Dong, H. MicroRNA-154 functions as a tumor suppressor in non-small cell lung cancer through directly targeting B-cell-specific Moloney murine leukemia virus insertion site 1. Oncol. Lett. 2018, 15, 10098–10104. [Google Scholar] [CrossRef] [Green Version]
  21. Qin, C.; Zhao, Y.; Gong, C.; Yang, Z. MicroRNA-154/ADAM9 axis inhibits the proliferation, migration and invasion of breast cancer cells. Oncol. Lett. 2017, 14, 6969–6975. [Google Scholar] [CrossRef] [PubMed]
  22. Zhao, X.; Ji, Z.; Xie, Y.; Liu, G.; Li, H. MicroRNA-154 as a prognostic factor in bladder cancer inhibits cellular malignancy by targeting RSF1 and RUNX2. Oncol. Rep. 2017, 38, 2727–2734. [Google Scholar] [CrossRef] [PubMed] [Green Version]
  23. Qiao, W.; Cao, N.; Yang, L. MicroRNA-154 inhibits the growth and metastasis of gastric cancer cells by directly targeting MTDH. Oncol. Lett. 2017, 14, 3268–3274. [Google Scholar] [CrossRef] [Green Version]
  24. Niu, J.-T.; Zhang, L.-J.; Huang, Y.-W.; Li, C.; Jiang, N.; Niu, Y.-J. miR-154 inhibits the growth of laryngeal squamous cell carcinoma by targeting GALNT7. Biochem. Cell Biol. 2018, 96, 752–760. [Google Scholar] [CrossRef] [PubMed]
  25. Lin, C.; Li, Z.; Chen, P.; Quan, J.; Pan, X.; Zhao, L.; Zhou, L.; Lai, Y.; He, T.; Xu, W.; et al. Oncogene miR-154-5p regulates cellular function and acts as a molecular marker with poor prognosis in renal cell carcinoma. Life Sci. 2018, 209, 481–489. [Google Scholar] [CrossRef] [PubMed]
  26. Chen, H.-Q.; Gao, D. Inhibitory effect of microRNA-154 targeting WHSC1 on cell proliferation of human skin squamous cell carcinoma through mediating the P53 signaling pathway. Int. J. Biochem. Cell Biol. 2018, 100, 22–29. [Google Scholar] [CrossRef]
  27. Jiang, L.; Huang, Q.; Zhang, S.; Zhang, Q.; Chang, J.; Qiu, X.; Wang, E. Hsa-miR-125a-3p and hsa-miR-125a-5p are downregulated in non-small cell lung cancer and have inverse effects on invasion and migration of lung cancer cells. BMC Cancer 2010, 10, 318. [Google Scholar] [CrossRef] [Green Version]
  28. Almeida, M.I.; Nicoloso, M.S.; Zeng, L.; Ivan, C.; Spizzo, R.; Gafà, R.; Xiao, L.; Zhang, X.; Vannini, I.; Fanini, F.; et al. Strand-Specific miR-28-5p and miR-28-3p Have Distinct Effects in Colorectal Cancer Cells. Gastroenterology 2012, 142, 886–896.e9. [Google Scholar] [CrossRef] [Green Version]
  29. Mitra, R.; Adams, C.M.; Jiang, W.; Greenawalt, E.; Eischen, C.M. Pan-cancer analysis reveals cooperativity of both strands of microRNA that regulate tumorigenesis and patient survival. Nat. Commun. 2020, 11, 968. [Google Scholar] [CrossRef] [Green Version]
  30. Zhang, Z.; Pi, J.; Zou, D.; Wang, X.; Xu, J.; Yu, S.; Zhang, T.; Li, F.; Zhang, X.; Zhao, H.; et al. microRNA arm-imbalance in part from complementary targets mediated decay promotes gastric cancer progression. Nat. Commun. 2019, 10, 4397. [Google Scholar] [CrossRef] [Green Version]
  31. Gao, J.; Aksoy, B.A.; Dogrusoz, U.; Dresdner, G.; Gross, B.; Sumer, S.O.; Sun, Y.; Jacobsen, A.; Sinha, R.; Larsson, E.; et al. Integrative Analysis of Complex Cancer Genomics and Clinical Profiles Using the cBioPortal. Sci. Signal. 2013, 6, pl1. [Google Scholar] [CrossRef] [PubMed] [Green Version]
  32. Chandrashekar, D.S.; Bashel, B.; Balasubramanya, S.A.H.; Creighton, C.J.; Ponce-Rodriguez, I.; Chakravarthi, B.V.S.K.; Varambally, S. UALCAN: A portal for facilitating tumor subgroup gene expression and survival analyses. Neoplasia 2017, 19, 649–658. [Google Scholar] [CrossRef] [PubMed]
  33. Goldman, M.; Craft, B.; Hastie, M.; Repečka, K.; Kamath, A.; McDade, F.; Kamath, A.; Banerjee, A.; Luo, Y.; Rogers, D.; et al. The UCSC Xena platform for public and private cancer genomics data visualization and interpretation. bioRxiv 2019, 326470. [Google Scholar] [CrossRef] [Green Version]
  34. Severino, P.; Brüggemann, H.; Andreghetto, F.M.; Camps, C.; Klingbeil, M.D.F.G.; De Pereira, W.O.; Soares, R.M.; Moyses, R.; Wünsch-Filho, V.; Mathor, M.B.; et al. MicroRNA expression profile in head and neck cancer: HOX-cluster embedded microRNA-196a and microRNA-10b dysregulation implicated in cell proliferation. BMC Cancer 2013, 13, 533. [Google Scholar] [CrossRef] [PubMed]
  35. Holt, J.; Walter, V.; Yin, X.; Marron, D.; Wilkerson, M.D.; Choi, H.Y.; Zhao, X.; Jo, H.; Hayes, D.N.; Ko, Y.H. Integrative analysis of microRNAs identifies clinically relevant epithelial and stromal subtypes of head and neck squamous cell carcinoma. Clin. Cancer Res. 2021, 27, 831–842. [Google Scholar] [CrossRef] [PubMed]
  36. Thorsson, V.; Gibbs, D.L.; Brown, S.D.; Wolf, D.; Bortone, D.S.; Ou Yang, T.-H.; Porta-Pardo, E.; Gao, G.F.; Plaisier, C.L.; Eddy, J.A.; et al. The Immune Landscape of Cancer. Immunity 2018, 48, 812–830.e14. [Google Scholar] [CrossRef] [Green Version]
  37. Subramanian, A.; Tamayo, P.; Mootha, V.K.; Mukherjee, S.; Ebert, B.L.; Gillette, M.A.; Paulovich, A.; Pomeroy, S.L.; Golub, T.R.; Lander, E.S.; et al. Gene set enrichment analysis: A knowledge-based approach for interpreting genome-wide expression profiles. Proc. Natl. Acad. Sci. USA 2005, 102, 15545–15550. [Google Scholar] [CrossRef] [Green Version]
  38. Miranda, K.C.; Huynh, T.; Tay, Y.; Ang, Y.-S.; Tam, W.L.; Thomson, A.M.; Lim, B.; Rigoutsos, I. A Pattern-Based Method for the Identification of MicroRNA Binding Sites and Their Corresponding Heteroduplexes. Cell 2006, 126, 1203–1217. [Google Scholar] [CrossRef] [Green Version]
  39. Vejnar, C.; Zdobnov, E.M. miRmap: Comprehensive prediction of microRNA target repression strength. Nucleic Acids Res. 2012, 40, 11673–11683. [Google Scholar] [CrossRef]
  40. Paraskevopoulou, M.D.; Georgakilas, G.; Kostoulas, N.; Vlachos, I.S.; Vergoulis, T.; Reczko, M.; Filippidis, C.; Dalamagas, T.; Hatzigeorgiou, A.G. DIANA-microT web server v5.0: Service integration into miRNA functional analysis workflows. Nucleic Acids Res. 2013, 41, W169–W173. [Google Scholar] [CrossRef] [Green Version]
  41. Reczko, M.; Maragkakis, M.; Alexiou, P.; Grosse, I.; Hatzigeorgiou, A.G. Functional microRNA targets in protein coding sequences. Bioinformatics 2012, 28, 771–776. [Google Scholar] [CrossRef]
  42. Wong, N.; Wang, X. miRDB: An online resource for microRNA target prediction and functional annotations. Nucleic Acids Res. 2015, 43, D146–D152. [Google Scholar] [CrossRef]
  43. Liu, W.; Wang, X. Prediction of functional microRNA targets by integrative modeling of microRNA binding and target expression data. Genome Biol. 2019, 20, 18. [Google Scholar] [CrossRef] [PubMed]
  44. Agarwal, V.; Bell, G.W.; Nam, J.-W.; Bartel, D.P. Predicting effective microRNA target sites in mammalian mRNAs. eLife 2015, 4, e05005. [Google Scholar] [CrossRef]
  45. Warde-Farley, D.; Donaldson, S.L.; Comes, O.; Zuberi, K.; Badrawi, R.; Chao, P.; Franz, M.; Grouios, C.; Kazi, F.; Lopes, C.T.; et al. The GeneMANIA prediction server: Biological network integration for gene prioritization and predicting gene function. Nucleic Acids Res. 2010, 38, W214–W220. [Google Scholar] [CrossRef] [PubMed]
  46. Tang, Z.; Kang, B.; Li, C.; Chen, T.; Zhang, Z. GEPIA2: An enhanced web server for large-scale expression profiling and interactive analysis. Nucleic Acids Res. 2019, 47, W556–W560. [Google Scholar] [CrossRef] [Green Version]
  47. Yoshihara, K.; Shahmoradgoli, M.; Martínez, E.; Vegesna, R.; Kim, H.; Torres-Garcia, W.; Trevino, V.; Shen, H.; Laird, P.W.; Levine, D.A.; et al. Inferring tumour purity and stromal and immune cell admixture from expression data. Nat. Commun. 2013, 4, 2612. [Google Scholar] [CrossRef] [PubMed]
  48. Eddy, J.A.; Thorsson, V.; Lamb, A.E.; Gibbs, D.L.; Heimann, C.; Yu, J.X.; Chung, V.; Chae, Y.; Dang, K.; Vincent, B.G.; et al. CRI iAtlas: An interactive portal for immuno-oncology research. F1000Research 2020, 9, 1028. [Google Scholar] [CrossRef]
  49. Cohen, N.; Fedewa, S.; Chen, A.Y. Epidemiology and Demographics of the Head and Neck Cancer Population. Oral Maxillofac. Surg. Clin. N. Am. 2018, 30, 381–395. [Google Scholar] [CrossRef]
  50. Wu, T.-S.; Lin, B.-R.; Chang, H.-H. Radio Resistance Mechanisms of Cancers: An Overview and Future Perspectives. Biol. Med. 2015, S2, 002. [Google Scholar] [CrossRef] [Green Version]
  51. Pendleton, K.P.; Grandis, J.R. Cisplatin-Based Chemotherapy Options for Recurrent and/or Metastatic Squamous Cell Cancer of the Head and Neck. Clin. Med. Insights Ther. 2013, 5, CMT.S10409. [Google Scholar] [CrossRef] [Green Version]
  52. Łasińska, I.; Kolenda, T.; Teresiak, A.; Lamperska, K.M.; Galus, Ł.; Mackiewicz, J. Immunotherapy in Patients with Recurrent and Metastatic Squamous Cell Carcinoma of the Head and Neck. Anticancer Agents Med. Chem. 2019, 19, 290–303. [Google Scholar] [CrossRef]
  53. Pai, S.I.; Westra, W.H. Molecular Pathology of Head and Neck Cancer: Implications for Diagnosis, Prognosis, and Treatment. Annu. Rev. Pathol. Mech. Dis. 2009, 4, 49–70. [Google Scholar] [CrossRef] [PubMed] [Green Version]
  54. Deshpande, A.M.; Wong, D.T. Molecular mechanisms of head and neck cancer. Expert Rev. Anticancer. Ther. 2008, 8, 799–809. [Google Scholar] [CrossRef] [PubMed] [Green Version]
  55. Kolenda, T.; Przybyła, W.; Kapałczyńska, M.; Teresiak, A.; Zajączkowska, M.; Bliźniak, R.; Lamperska, K.M. Tumor microenvironment—Unknown niche with powerful therapeutic potential. Rep. Pract. Oncol. Radiother. 2018, 23, 143–153. [Google Scholar] [CrossRef] [PubMed]
  56. Zhi, X.; Lamperska, K.; Golusinski, P.; Schork, N.J.; Luczewski, L.; Kolenda, T.; Golusiński, W.; Masternak, M.M. Gene expression analysis of head and neck squamous cell carcinoma survival and recurrence. Oncotarget 2014, 6, 547–555. [Google Scholar] [CrossRef]
  57. Lamperska, K.M.; Kozlowski, P.; Kolenda, T.; Teresiak, A.; Blizniak, R.; Przybyla, W.; Masternak, M.M.; Golusinski, P.; Golusinski, W. Unpredictable changes of selected miRNA in expression profile of HNSCC. Cancer Biomark. 2016, 16, 55–64. [Google Scholar] [CrossRef] [PubMed]
  58. Lamperska, K.M.; Kolenda, T.; Teresiak, A.; Kowalik, A.; Kruszyna-Mochalska, M.; Jackowiak, W.; Bliźniak, R.; Przybyła, W.; Kapałczyńska, M.; Kozlowski, P. Different levels of let-7d expression modulate response of FaDu cells to irradiation and chemotherapeutics. PLoS ONE 2017, 12, e0180265. [Google Scholar] [CrossRef] [PubMed]
  59. Kolenda, T.; Guglas, K.; Teresiak, A.; Bliźniak, R.; Lamperska, K. Low let-7d and high miR-205 expression levels positively influence HNSCC patient outcome. J. Biomed. Sci. 2019, 26, 17. [Google Scholar] [CrossRef]
  60. Kolenda, T.; Kopczyńska, M.; Guglas, K.; Teresiak, A.; Bliźniak, R.; Łasińska, I.; Mackiewicz, J.; Lamperska, K. EGOT lncRNA in head and neck squamous cell carcinomas. Pol. J. Pathol. 2018, 69, 356–365. [Google Scholar] [CrossRef] [PubMed]
  61. Kolenda, T.; Guglas, K.; Kopczyńska, M.; Teresiak, A.; Bliźniak, R.; Mackiewicz, A.; Lamperska, K.; Mackiewicz, J. Oncogenic Role of ZFAS1 lncRNA in Head and Neck Squamous Cell Carcinomas. Cells 2019, 8, 366. [Google Scholar] [CrossRef] [Green Version]
  62. Chen, J.; Ma, C.; Zhang, Y.; Pei, S.; Du, M.; Zhang, Y.; Qian, L.-X.; Wang, J.; Yin, L.; He, X. miR-154-5p Suppresses Cell Invasion and Migration Through Inhibiting KIF14 in Nasopharyngeal Carcinoma. OncoTargets Ther. 2020, 13, 2235–2246. [Google Scholar] [CrossRef] [Green Version]
  63. Lin, X.; Yang, Z.; Zhang, P.; Shao, G. miR-154 suppresses non-small cell lung cancer growth in vitro and in vivo. Oncol. Rep. 2015, 33, 3053–3060. [Google Scholar] [CrossRef] [PubMed] [Green Version]
  64. Vojtechova, Z.; Sabol, I.; Salakova, M.; Smahelova, J.; Zavadil, J.; Turek, L.; Grega, M.; Klozar, J.; Prochazka, B.; Tachezy, R. Comparison of the miRNA profiles in HPV-positive and HPV-negative tonsillar tumors and a model system of human keratinocyte clones. BMC Cancer 2016, 16, 382. [Google Scholar] [CrossRef] [PubMed] [Green Version]
  65. Peta, E.; Sinigaglia, A.; Masi, G.; Di Camillo, B.; Grassi, A.; Trevisan, M.; Messa, L.; Loregian, A.; Manfrin, E.; Brunelli, M.; et al. HPV16 E6 and E7 upregulate the histone lysine demethylase KDM2B through the c-MYC/miR-146a-5p axys. Oncogene 2018, 37, 1654–1668. [Google Scholar] [CrossRef]
  66. Zhao, W.; Liu, Y.; Zhang, L.; Ding, L.; Li, Y.; Zhang, H.; Wang, T.; Hao, M. MicroRNA-154-5p regulates the HPV16 E7-pRb pathway in Cervical Carcinogenesis by targeting CUL2. J. Cancer 2020, 11, 5379–5389. [Google Scholar] [CrossRef] [PubMed]
  67. Svoronos, A.A.; Engelman, D.M.; Slack, F.J. OncomiR or Tumor Suppressor? The Duplicity of MicroRNAs in Cancer. Cancer Res. 2016, 76, 3666–3670. [Google Scholar] [CrossRef] [PubMed] [Green Version]
  68. Kent, L.N.; Leone, G. The broken cycle: E2F dysfunction in cancer. Nat. Rev. Cancer 2019, 19, 326–338. [Google Scholar] [CrossRef]
  69. Emmrich, S.; Pützer, B.M. Checks and balances: E2F-microRNA crosstalk in cancer control. Cell Cycle 2010, 9, 2555–2567. [Google Scholar] [CrossRef]
  70. Xu, H.; Fei, D.; Zong, S.; Fan, Z. MicroRNA-154 inhibits growth and invasion of breast cancer cells through targeting E2F5. Am. J. Transl. Res. 2016, 8, 2620–2630. [Google Scholar] [PubMed]
  71. Stark, G.R.; Taylor, W.R. Analyzing the G2/M checkpoint. In Checkpoint Controls and Cancer; Methods in Molecular Biology™; Humana Press: Totowa, NJ, USA, 2004; Volume 280, pp. 51–82. [Google Scholar] [CrossRef]
  72. Löbrich, M.; Jeggo, P.A. The impact of a negligent G2/M checkpoint on genomic instability and cancer induction. Nat. Rev. Cancer 2007, 7, 861–869. [Google Scholar] [CrossRef] [PubMed]
  73. Liu, T.; Liu, L.; Liu, M.; Du, R.; Dang, Y.; Bai, M.; Zhang, L.; Ma, F.; Yang, X.; Ning, X.; et al. MicroRNA-493 targets STMN-1 and promotes hypoxia-induced epithelial cell cycle arrest in G2/M and renal fibrosis. FASEB J. 2019, 33, 1565–1577. [Google Scholar] [CrossRef]
  74. Jenkins, R.H.; Davies, L.C.; Taylor, P.R.; Akiyama, H.; Cumbes, B.; Beltrami, C.; Carrington, C.P.; Phillips, A.O.; Bowen, T.; Fraser, D.J. miR-192 induces G2/M growth arrest in aristolochic acid nephropathy. Am. J. Pathol. 2014, 184, 996–1009. [Google Scholar] [CrossRef] [PubMed]
  75. Dai, Y.; Lin, X.; Xu, W.; Lin, X.; Huang, Q.; Shi, L.; Pan, Y.; Zhang, Y.; Zhu, Y.; Li, C.; et al. miR-210-3p protects endometriotic cells from oxidative stress-induced cell cycle arrest by targeting BARD1. Cell Death Dis. 2019, 10, 144. [Google Scholar] [CrossRef] [PubMed] [Green Version]
  76. Barbie, D.A.; Tamayo, P.; Boehm, J.; Kim, S.Y.; Moody, S.E.; Dunn, I.F.; Schinzel, A.C.; Sandy, P.; Meylan, E.; Scholl, C.; et al. Systematic RNA interference reveals that oncogenic KRAS-driven cancers require TBK1. Nat. Cell Biol. 2009, 462, 108–112. [Google Scholar] [CrossRef] [PubMed]
  77. Gururajan, M.; Josson, S.; Chu, G.C.-Y.; Lu, C.-L.; Lu, Y.-T.; Haga, C.L.; Zhau, H.E.; Liu, C.; Lichterman, J.; Duan, P.; et al. miR-154* and miR-379 in the DLK1-DIO3 MicroRNA Mega-Cluster Regulate Epithelial to Mesenchymal Transition and Bone Metastasis of Prostate Cancer. Clin. Cancer Res. 2014, 20, 6559–6569. [Google Scholar] [CrossRef] [Green Version]
  78. Josson, S.; Chung, L.W.K.; Gururajan, M. MicroRNAs and prostate cancer. Adv. Exp. Med. Biol. 2015, 889, 105–118. [Google Scholar]
  79. Zhang, X.; Huang, Z.; Hu, Y.; Liu, L. Knockdown of Myosin 6 inhibits proliferation of oral squamous cell carcinoma cells. J. Oral Pathol. Med. 2016, 45, 740–745. [Google Scholar] [CrossRef]
  80. Lei, C.; Du, F.; Sun, L.; Li, T.; Li, T.; Min, Y.; Nie, A.; Wang, X.; Geng, L.; Lu, Y.; et al. miR-143 and miR-145 inhibit gastric cancer cell migration and metastasis by suppressing MYO6. Cell Death Dis. 2017, 8, e3101. [Google Scholar] [CrossRef] [Green Version]
  81. Murata, M.; Ito, T.; Tanaka, Y.; Yamamura, K.; Furue, K.; Furue, M. OVOL2-Mediated ZEB1 Downregulation May Prevent Promotion of Actinic Keratosis to Cutaneous Squamous Cell Carcinoma. J. Clin. Med. 2020, 9, 618. [Google Scholar] [CrossRef] [Green Version]
  82. Roca, H.; Hernandez, J.; Weidner, S.; McEachin, R.C.; Fuller, D.; Sud, S.; Schumann, T.; Wilkinson, J.E.; Zaslavsky, A.; Li, H.; et al. Transcription Factors OVOL1 and OVOL2 Induce the Mesenchymal to Epithelial Transition in Human Cancer. PLoS ONE 2013, 8, e76773. [Google Scholar] [CrossRef]
  83. Jia, D.; Jolly, M.K.; Boareto, M.; Parsana, P.; Mooney, S.M.; Pienta, K.J.; Levine, H.; Ben-Jacob, E. OVOL guides the epithelial-hybrid-mesenchymal transition. Oncotarget 2015, 6, 15436–15448. [Google Scholar] [CrossRef] [PubMed] [Green Version]
  84. Nath, D.; Li, X.; Mondragon, C.; Post, D.; Chen, M.; White, J.R.; Hryniewicz-Jankowska, A.; Caza, T.; Kuznetsov, V.A.; Hehnly, H.; et al. Abi1 loss drives prostate tumorigenesis through activation of EMT and non-canonical WNT signaling. Cell Commun. Signal. 2019, 17, 120. [Google Scholar] [CrossRef] [Green Version]
  85. Qi, Y.; Liu, J.; Chao, J.; Scheuerman, M.P.; Rahimi, S.A.; Lee, L.Y.; Li, S. PTEN suppresses epithelial–mesenchymal transition and cancer stem cell activity by downregulating Abi1. Sci. Rep. 2020, 10, 12685. [Google Scholar] [CrossRef] [PubMed]
  86. Fang, D.; Chen, H.; Zhu, J.Y.; Wang, W.; Teng, Y.; Ding, H.F.; Jing, Q.; Su, S.B.; Huang, S. Epithelial-Mesenchymal Transition of Ovarian Cancer Cells Is Sustained by Rac1 through Simultaneous Activation of MEK1/2 and Src Signaling Pathways. Oncogene 2017, 36, 1546–1558. [Google Scholar] [CrossRef] [PubMed] [Green Version]
  87. Roshan, V.G.D.; Sinto, M.S.; Vargees, B.T.; Kannan, S. Loss of CDKN2A and CDKN2B expression is associated with disease recurrence in oral cancer. J. Oral Maxillofac. Pathol. 2019, 23, 82–89. [Google Scholar] [CrossRef]
  88. Li, B.; Li, A.; You, Z.; Xu, J.; Zhu, S. Epigenetic silencing of CDKN1A and CDKN2B by SNHG1 promotes the cell cycle, migration and epithelial-mesenchymal transition progression of hepatocellular carcinoma. Cell Death Dis. 2020, 11, 823. [Google Scholar] [CrossRef]
  89. Weiße, J.; Rosemann, J.; Krauspe, V.; Kappler, M.; Eckert, A.W.; Haemmerle, M.; Gutschner, T. RNA-Binding Proteins as Regulators of Migration, Invasion and Metastasis in Oral Squamous Cell Carcinoma. Int. J. Mol. Sci. 2020, 21, 6835. [Google Scholar] [CrossRef]
  90. Ishii, H.; Saitoh, M.; Sakamoto, K.; Kondo, T.; Katoh, R.; Tanaka, S.; Motizuki, M.; Masuyama, K.; Miyazawa, K. Epithelial Splicing Regulatory Proteins 1 (ESRP1) and 2 (ESRP2) Suppress Cancer Cell Motility via Different Mechanisms. J. Biol. Chem. 2014, 289, 27386–27399. [Google Scholar] [CrossRef] [Green Version]
  91. Zhong, Q.; Fang, Y.; Lai, Q.; Wang, S.; He, C.; Li, A.; Liu, S.; Yan, Q. CPEB3 inhibits epithelial-mesenchymal transition by disrupting the crosstalk between colorectal cancer cells and tumor-associated macrophages via IL-6R/STAT3 signaling. J. Exp. Clin. Cancer Res. 2020, 39, 132. [Google Scholar] [CrossRef]
  92. Zhang, Y.; Yu, R.; Li, L. LINC00641 hinders the progression of cervical cancer by targeting miR-378a-3p/CPEB3. J. Gene Med. 2020, 22, e3212. [Google Scholar] [CrossRef] [PubMed]
  93. Tang, H.; Han, X.; Feng, Y.; Hao, Y. linc00968 inhibits the tumorigenesis and metastasis of lung adenocarcinoma via serving as a ceRNA against miR-9-5p and increasing CPEB3. Aging 2020, 12, 22582–22598. [Google Scholar] [CrossRef]
  94. Wu, L.; Zhao, N.; Zhou, Z.; Chen, J.; Han, S.; Zhang, X.; Bao, H.; Yuan, W.; Shu, X. PLAGL2 promotes the proliferation and migration of gastric cancer cells via USP37-mediated deubiquitination of Snail1. Theranostics 2021, 11, 700–714. [Google Scholar] [CrossRef]
  95. Wu, L.; Zhou, Z.; Han, S.; Chen, J.; Liu, Z.; Zhang, X.; Yuan, W.; Ji, J.; Shu, X. PLAGL2 promotes epithelial–mesenchymal transition and mediates colorectal cancer metastasis via β-catenin-dependent regulation of ZEB1. Br. J. Cancer 2020, 122, 578–589. [Google Scholar] [CrossRef] [PubMed] [Green Version]
  96. Wang, L.; Sun, L.; Liu, R.; Mo, H.; Niu, Y.; Chen, T.; Wang, Y.; Han, S.; Tu, K.; Liu, Q. Long non-coding RNA MAPKAPK5-AS1/PLAGL2/HIF-1α signaling loop promotes hepatocellular carcinoma progression. J. Exp. Clin. Cancer Res. 2021, 40, 72. [Google Scholar] [CrossRef] [PubMed]
  97. Wu, Q.; Zhang, B.; Li, B.; Cao, X.; Chen, X.; Xue, Q. PTBP3 promotes migration of non-small cell lung cancer through regulating E-cadherin in EMT signaling pathway. Cancer Cell Int. 2020, 20, 172. [Google Scholar] [CrossRef]
  98. Hou, P.; Li, L.; Chen, F.; Chen, Y.; Liu, H.; Li, J.; Bai, J.; Zheng, J. PTBP3-Mediated Regulation of ZEB1 mRNA Stability Promotes Epithelial–Mesenchymal Transition in Breast Cancer. Cancer Res. 2018, 78, 387–398. [Google Scholar] [CrossRef] [Green Version]
  99. Zhao, L.; Chi, W.; Cao, H.; Cui, W.; Meng, W.; Guo, W.; Wang, B. Screening and clinical significance of tumor markers in head and neck squamous cell carcinoma through bioinformatics analysis. Mol. Med. Rep. 2018, 19, 143–154. [Google Scholar] [CrossRef] [Green Version]
  100. Saloura, V.; Vougiouklakis, T.; Sievers, C.; Burkitt, K.; Nakamura, Y.; Hager, G.; van Waes, C. The role of protein methyltransferases as potential novel therapeutic targets in squamous cell carcinoma of the head and neck. Oral Oncol. 2018, 81, 100–108. [Google Scholar] [CrossRef]
  101. Gameiro, S.F.; Ghasemi, F.; Zeng, P.Y.F.; Mundi, N.; Howlett, C.J.; Plantinga, P.; Barrett, J.W.; Nichols, A.C.; Mymryk, J.S. Low expression of NSD1, NSD2, and NSD3 define a subset of human papillomavirus-positive oral squamous carcinomas with unfavorable prognosis. Infect. Agents Cancer 2021, 16, 13. [Google Scholar] [CrossRef] [PubMed]
  102. Saloura, V.; Cho, H.-S.; Kiyotani, K.; Alachkar, H.; Zuo, Z.; Nakakido, M.; Tsunoda, T.; Seiwert, T.; Lingen, M.; Licht, J.; et al. WHSC1 Promotes Oncogenesis through Regulation of NIMA-Related Kinase-7 in Squamous Cell Carcinoma of the Head and Neck. Mol. Cancer Res. 2014, 13, 293–304. [Google Scholar] [CrossRef] [PubMed] [Green Version]
  103. Chen, R.; Chen, Y.; Zhao, W.; Fang, C.; Zhou, W.; Yang, X.; Ji, M. The Role of Methyltransferase NSD2 as a Potential Oncogene in Human Solid Tumors. OncoTargets Ther. 2020, 13, 6837–6846. [Google Scholar] [CrossRef] [PubMed]
  104. Gong, Z.; Zhang, J.; Guo, W. Tumor purity as a prognosis and immunotherapy relevant feature in gastric cancer. Cancer Med. 2020, 9, 9052–9063. [Google Scholar] [CrossRef] [PubMed]
  105. Kemi, N.; Eskuri, M.; Kauppila, J.H. Tumour-stroma ratio and 5-year mortality in gastric adenocarcinoma: A systematic review and meta-analysis. Sci. Rep. 2019, 9, 16018. [Google Scholar] [CrossRef] [Green Version]
  106. Mao, Y.; Feng, Q.; Zheng, P.; Yang, L.; Liu, T.; Xu, Y.; Zhu, D.; Chang, W.; Ji, M.; Ren, L.; et al. Low tumor purity is associated with poor prognosis, heavy mutation burden, and intense immune phenotype in colon cancer. Cancer Manag. Res. 2018, 10, 3569–3577. [Google Scholar] [CrossRef] [Green Version]
  107. Zhang, C.; Cheng, W.; Ren, X.; Wang, Z.; Liu, X.; Li, G.; Han, S.; Jiang, T.; Wu, A. Tumor Purity as an Underlying Key Factor in Glioma. Clin. Cancer Res. 2017, 23, 6279–6291. [Google Scholar] [CrossRef] [Green Version]
  108. Anderson, N.M.; Simon, M.C. The tumor microenvironment. Curr. Biol. CB 2020, 30, R921–R925. [Google Scholar] [CrossRef]
  109. Mandal, R.; Şenbabaoğlu, Y.; Desrichard, A.; Havel, J.J.; Dalin, M.G.; Riaz, N.; Lee, K.-W.; Ganly, I.; Hakimi, A.A.; Chan, T.A.; et al. The head and neck cancer immune landscape and its immunotherapeutic implications. JCI Insight 2016, 1, e89829. [Google Scholar] [CrossRef] [Green Version]
  110. Balermpas, P.; Michel, Y.; Wagenblast, J.; Seitz, O.; Weiss, C.; Rödel, F.; Rödel, C.; Fokas, E. Tumour-infiltrating lymphocytes predict response to definitive chemoradiotherapy in head and neck cancer. Br. J. Cancer 2013, 110, 501–509. [Google Scholar] [CrossRef]
  111. Kong, C.S.; Narasimhan, B.; Cao, H.; Kwok, S.; Erickson, J.P.; Koong, A.; Pourmand, N.; Le, Q.-T. The Relationship Between Human Papillomavirus Status and Other Molecular Prognostic Markers in Head and Neck Squamous Cell Carcinomas. Int. J. Radiat. Oncol. 2009, 74, 553–561. [Google Scholar] [CrossRef] [Green Version]
  112. Ba, D.W.; Light, E.; Thomas, D.; Worden, F.; Prince, M.; Urba, S.; Chepeha, D.; Kumar, B.; Cordell, K.; Eisbruch, A.; et al. Infiltrating lymphocytes and human papillomavirus-16-associated oropharyngeal cancer. Laryngoscope 2012, 122, 121–127. [Google Scholar] [CrossRef] [Green Version]
  113. da Silva, V.L.; Fonseca, A.F.; Fonseca, M.; da Silva, T.E.; Coelho, A.C.; Kroll, J.E.; de Souza, J.; Stransky, B.; de Souza, G.A.; de Souza, S.J. Genome-wide identification of cancer/testis genes and their association with prognosis in a pan-cancer analysis. Oncotarget 2017, 8, 92966–92977. [Google Scholar] [CrossRef]
  114. Simpson, A.J.G.; Caballero, O.L.; Jungbluth, A.; Chen, Y.-T.; Old, L.J. Cancer/testis antigens, gametogenesis and cancer. Nat. Rev. Cancer 2005, 5, 615–625. [Google Scholar] [CrossRef] [PubMed]
  115. Kumar, A.T.; Knops, A.; Swendseid, B.; Martinez-Outschoom, U.; Harshyne, L.; Philp, N.; Rodeck, U.; Luginbuhl, A.; Cognetti, D.; Johnson, J.; et al. Prognostic Significance of Tumor-Associated Macrophage Content in Head and Neck Squamous Cell Carcinoma: A Meta-Analysis. Front. Oncol. 2019, 9, 656. [Google Scholar] [CrossRef]
  116. She, L.; Qin, Y.; Wang, J.; Liu, C.; Zhu, G.; Li, G.; Wei, M.; Chen, C.; Liu, G.; Zhang, D.; et al. Tumor-associated macrophages derived CCL18 promotes metastasis in squamous cell carcinoma of the head and neck. Cancer Cell Int. 2018, 18, 120. [Google Scholar] [CrossRef]
  117. Sica, A.; Mantovani, A. Macrophage plasticity and polarization: In vivo veritas. J. Clin. Investig. 2012, 122, 787–795. [Google Scholar] [CrossRef] [PubMed]
  118. Ferrante, C.J.; Leibovich, S.J. Regulation of Macrophage Polarization and Wound Healing. Adv. Wound Care 2012, 1, 10–16. [Google Scholar] [CrossRef] [Green Version]
  119. Ellisen, L.W. A wound-healing program is hijacked to promote cancer metastasis. J. Exp. Med. 2017, 214, 2813–2815. [Google Scholar] [CrossRef]
  120. Song, D.; Lyu, H.; Feng, Q.; Luo, J.; Li, L.; Wang, X. Subtyping of head and neck squamous cell cancers based on immune signatures. Int. Immunopharmacol. 2021, 99, 108007. [Google Scholar] [CrossRef]
  121. House, R.; Majumder, M.; Janakiraman, H.; Ogretmen, B.; Kato, M.; Erkul, E.; Hill, E.; Atkinson, C.; Barth, J.; Day, T.A.; et al. Smoking-induced control of miR-133a-3p alters the expression of EGFR and HuR in HPV-infected oropharyngeal cancer. PLoS ONE 2018, 13, e0205077. [Google Scholar] [CrossRef] [Green Version]
  122. Huang, J.; Wu, J.; Li, Y.; Li, X.; Yang, T.; Yang, Q.; Jiang, Y. Deregulation of Serum MicroRNA Expression Is Associated with Cigarette Smoking and Lung Cancer. BioMed Res. Int. 2014, 2014, 364316. [Google Scholar] [CrossRef] [PubMed]
  123. Cazzoli, R.; Buttitta, F.; DI Nicola, M.; Malatesta, S.; Marchetti, A.; Rom, W.; Pass, H.I. microRNAs Derived from Circulating Exosomes as Noninvasive Biomarkers for Screening and Diagnosing Lung Cancer. J. Thorac. Oncol. 2013, 8, 1156–1162. [Google Scholar] [CrossRef] [PubMed] [Green Version]
Figure 1. The expression level of miR-154-5p and miR-154-3p in the TCGA patients: (A) in the whole group of the HNSCC cancer (n = 497) and normal (n = 44) samples (unpaired analysis, graphs from the Encori database, modified) and (B) in the paired cancer and adjacent normal samples (n = 43); (C) ROC analysis of the paired cancer and adjacent normal samples (n = 43); (D) expression of miR-154-5p and miR-154-3p depending on HNSCC localization in the oral cavity (n = 323 for miR-154-5p; n = 316 for miR-154-3p), larynx (n = 117 for miR-154-5p; n = 116 for miR-154-3p), and pharynx (n = 80 for miR-154-5p; n = 80 for miR-154-3p), and (E) expression of miR-154-5p and miR-154-3p depending on the TCGA molecular subtype of HNSCC: atypical (n = 55), basal (n = 71 for miR-154-5p; n = 68 for miR-154-3p), classical (n = 44), or mesenchymal (n = 64 for miR-154-5p; n = 65 for miR-154-3p). The graphs show the mean expression and boxes and whiskers with the minimum to maximum values, or the 5–95 percentile; AUC—area under the ROC (receiver operating characteristic) curve, CI—confidence interval; p < 0.05 considered as significant, ns—not significant, * p < 0.05; ** p ≤ 0.01, *** p ≤ 0.001, **** p ≤ 0.0001.
Biomedicines 09 01894 g001
Figure 2. Expression levels of miR-154-5p and miR-154-3p in the HNSCC patients from GEO depending on sample type, stages of cancer, and histological differentiation based on datasets (A) GSE31277 (n = 16) and (B) GSE144711 (n = 88). The graphs show the mean expression and boxes and whiskers with the minimum to maximum values; p < 0.05 considered as significant, ns—not significant, * p < 0.05; ** p ≤ 0.01.
Biomedicines 09 01894 g002
Figure 3. DFS and OS of the HNSCC patients depending on the miR-154-5p (A) or miR-154-3p (B) expression levels; low and high subgroups of patients divided based on the mean expression; p1—log-rank (Mantel-Cox) test, p2—Gehan–Breslow-Wilcoxon test; p < 0.05 considered as significant.
Biomedicines 09 01894 g003
Figure 4. GSEA of the MSigDB gene sets enriched in the HNSCC patients with a higher expression level of miR-154-5p (A) and a higher expression level of miR-154-3p (B) in all the anatomical subsites together as well as distinguished specifically into the oral cavity, larynx, or pharynx. Only the gene sets with nominal p < 0.05 were presented; NES—normalized enrichment score, FDR q-value—false discovery rate, SIZE—number of enriched genes in a specified process.
Biomedicines 09 01894 g004
Figure 5. miR-154-5p targets. (A) correlation between miR-154-5p and the 24 genes selected based on the miRNA target prediction databases; only the significant (p < 0.05) genes were indicated. (B) Network of interactions and functions between the miR-154-5p targets selected using the GeneMANIA tool. (C) DFS and OS of the HNSCC patients depending on the expression level of the miR-154-5p targets. Data from the gene expression profiling interactive analysis (GEPIA 2) portal; curves (darker lines) with 95% CI (lighter lines); high and low expression level subgroups of patients divided based on the quartile of expression level; n—number of cases in each subgroup; p—log-rank test, HR—hazard ratio; CI—confidence interval; p < 0.05 considered as significant.
Biomedicines 09 01894 g005
Figure 6. Immunological profile of the HNSCC patients depending on the expression level of miR-154-5p and miR-154-3p. Assessment of tumor purity and the presence of infiltrating stromal/immune cells in tumor tissues with the ESTIMATE, immune, and stromal scores (A); prediction of the lymphocyte infiltration signature score (B); estimation of differences of lymphocytes, neutrophils, eosinophils, mast cells, dendritic cells, and macrophages, as well as fractions of specific subpopulations of T cells, B cells, and macrophages (C); t-test, p < 0.05 considered as significant; ns—not significant, * p < 0.05, ** p ≤ 0.01, *** p ≤ 0.001.
Biomedicines 09 01894 g006
Figure 7. Immunological characteristics including the estimated CTA score, TGF beta response, SNV neoantigens, and wound healing (A) and the level of silent and non-silent mutations, as well as homologous recombination defects (B) depending on high and low expression of miR-154-5p and miR-154-3p in the HNSCC patients; t-test, p < 0.05 considered as significant; ns—not significant, * p < 0.05, ** p ≤ 0.01, *** p ≤ 0.001.
Biomedicines 09 01894 g007
Figure 8. Assessment of the BCR and TCR Shannon (A), evenness (B), and richness (C) parameters depending on the expression level of miR-154-5p and miR-154-3p in the HNSCC patients; t-test, ns—not significant, p < 0.05 considered as significant; * p < 0.05, ** p ≤ 0.01.
Biomedicines 09 01894 g008
Table 1. The expression levels of miR-154-5p and miR-154-3p depended on the clinicopathological parameters in all the localizations of HNSCC; t-test or Mann–Whitney U test; p < 0.05 considered as significant and bolded.
ParameterGroupmiR-154-5pmiR-154-3p
CasesMean ± SEMpCasesMean ± SEMp
Age≤ 60n = 2501.919 ± 0.86430.2086n = 2471.491 ± 0.79100.2127
> 61n = 2692.013 ± 0.8272n = 2641.582 ± 0.8511
GenderFemalen = 1471.950 ± 0.77290.7350n = 431.490 ± 0.72260.3860
Malen = 3731.978 ± 0.8747n = 3691.560 ± 0.8606
AlcoholYesn = 3371.959 ± 0.82850.9619n = 3311.539 ± 0.84370.8766
Non = 1731.962 ± 0.8560n = 1711.527 ± 0.7874
SmokingNo/exn = 2031.925 ± 0.83070.2880n = 2011.529 ± 0.80280.8000
Yesn = 3022.006 ± 0.8551n = 2961.549 ± 0.8442
Cancer stageI + IIn = 1252.145 ± 0.80020.0077n = 1231.625 ± 0.72440.1674
III + IVn = 3821.913 ± 0.8548n = 3761.510 ± 0.8291
T-stageT1 + T2n = 1892.001 ± 0.83690.5924n = 1891.511 ± 0.74060.5106
T3 + T4n = 3161.959 ± 0.8497n = 3081.560 ± 0.8428
N-stageN0n = 2522.071 ± 0.84260.0066n = 2451.623 ± 0.80860.0208
N1 + N2 + N3n = 2481.866 ± 0.8409n = 2461.455 ± 0.7938
GradeG1 + G2n = 3701.913 ± 0.82470.0017n = 3611.507 ± 0.77550.0589
G3 + G4n = 1262.182 ± 0.8299n = 1271.667 ± 0.9413
Perineural invasionPositiven = 1712.090 ± 0.78190.0777n = 1691.682 ± 0.83590.1173
Negativen = 1921.936 ± 0.8610n = 1881.538 ± 0.8889
Lymph node neck dissectionPositiven = 4161.986 ± 0.83950.4054n = 4071.564 ± 0.82720.2810
Negativen = 1021.908 ± 0.8814n = 1021.466 ± 0.8081
HPV p16 statusPositiven = 381.492 ± 0.97840.0102n = 361.208 ± 0.75660.0277
Negativen = 651.943 ± 0.7552n = 651.534 ± 0.6708
Publisher’s Note: MDPI stays neutral with regard to jurisdictional claims in published maps and institutional affiliations.

