Abstract
Background: the general lifespan has been prolonged greatly during the past century, and the incidence of age-associated diseases, including neurodegenerative ones, has increased as well. However, modelling of age-related pathologies is mostly conducted on adult rodents. We studied morphofunctional changes in the brain and peripheral blood of adult Wistar rats in comparison with old Wistar rats to determine age-related physiological changes and differences in adaptive reactions to AlCl3 exposure. Methods: the work was performed on adult and old male Wistar rats. The animals consumed a 100 mg/kg solution of AlCl3 each day for 60 days. Morphological changes of neurons and microglia, mRNA expression levels of pro-inflammatory and anti-inflammatory cytokines, microglia activation markers, amyloid-related proteins, and hallmarks of cellular senescence, monocyte, and lymphocyte subpopulations in the peripheral blood were examined. Results: old rats showed increasing hyperchromic neurons in the hippocampus; activation of microglia; upregulation of pro-inflammatory cytokines and cellular senescence markers; downregulation of anti-inflammatory cytokines; and Hif-1a and a decrease in B-cells and monocyte in peripheral blood. Conclusion: compared to young animals, aged rats respond to aluminum exposure with a severe decline of most cells’ function and irreversible neuronal loss. Regarding all reported data, neurodegeneration modelling and investigating of factors capable of accelerating or preventing it should be performed in experimental work on aged animals.
1. Introduction
Due to massive improvements in health care during the past century, the world’s population is growing—and aging. This leads to an increasing number of age-related diseases, including ones leading to dementia. Dementia is the most prevalent cause of disability globally [1] and is the outcome of various diseases, including neurodegenerative ones such as Alzheimer’s disease (AD). There were more than 55 million patients with dementia worldwide in 2019 [1] and, if this trend continues, there will be more than 150 million of them by 2050. This is a colossal burden not only for patients, their families, and healthcare and social workers. It is also a huge economic load on most countries, with an annual global cost of more than USD 1.3 trillion for treatment and social support [1]. Such great costs associated with neurodegenerative diseases and dementia at its terminal stage, especially caused by AD development, could be caused by an absence of any effective treatment so far. The FDA’s approved drugs can only faintly and briefly alleviate the symptoms.
There is still no consensus on the initial mechanisms of AD pathogenesis. Recent data showed that it is quite a complex process, not limited by amyloid deposits alone [2]. In the third part of a clinical trial of Lecanemab, an amyloid-antibody based drug, the drug showed rather low efficacy [3]. The impact of inflammaging, also known as systemic age-related chronic low-grade inflammation, is one of the hypotheses with the greatest potential to be investigated. It is a manifestation of senescence-associated secretory phenotype (SASP) which is expressed by senescent cells of aged organisms [4]. Inflammaging is one of the risk factors for the development of age-related diseases such as atherosclerosis, type 2 diabetes mellitus (T2DM), metabolic syndrome, etc. At the same time, these very pathological conditions, as well some others, like major depressive disorder [5], contribute to enhancing of its pro-inflammatory background.
The sporadic or late onset form of AD begins to manifest with mild cognitive impairment in people of age >60–65 years [6], which make it a part of the age-related pathologies group. The modeling of these pathologies, however, is still being conducted mostly on adult rodents, whereas experiments on old animals can provide more relevant data due to the presence of inflammaging. Furthermore, lots of studies are being performed on various lines of transgenic mice, which now seem not precisely relevant. The pathological processes of these mice do not exactly correspond with ones leading to neurodegeneration in humans. Within the wide variations of AD animal models, there are those based on exposure to aluminum compounds. Al3+ ions are capable of increasing the production of reactive oxygen species (ROS). ROS are involved in mitochondrial and DNA damage as well as in the promotion of the production of pro-inflammatory mediators and the establishment of a hypoxic condition [7,8]. All these events are typical for aging as well. Hence, the purpose of this work was to study morphofunctional changes of the brain and peripheral blood in adult Wistar rats in comparison with old Wistar rats to determine age-related physiological changes and differences in adaptive reactions to AlCl3 exposure.
2. Material and Methods
2.1. Animals
The work was performed on adult (n = 20, 3 months old) and old (n = 20, 24 months old) male Wistar rats. Animals were divided randomly into two experimental groups of adult (Adult-AlCl3) and old (Old-AlCl3) rats, and two control groups of adult (Adult-C) and old (Old-C) rats, comprising 10 animals each. Animals were kept in plastic cages (60 cm × 38 cm × 18.5 cm) in social groups of five; each animal was permitted free access to food and water. The temperature in the vivarium room was maintained within 18–22 °C, and air humidity was 50–65%. The study was approved by the Bioethical Commission of the Avtsyn Research Institute of Human Morphology of Petrovsky National Research Centre of Surgery (Protocol №36 (12) 28 March 2022). All experimental work involving animals was performed according to directive 2010/63/EU of the European Parliament and of the Council of the EU on the protection of animals used for scientific purposes (Strasbourg, 22 September 2010).
2.2. Neurodegeneration Modelling
Adult and old rats of both experimental groups consumed aluminum chloride (AlCl3) in a dosage of 100 mg/kg per day for 60 days with drinking water, as described previously [9]. Rats of both control groups consumed regular drinking water.
2.3. Cognitive Function Evaluation
Evaluation of cognitive function and, in particular, short-term memory consistency, was performed on day 0 (before consumption of AlCl3 began) and day 56 of the experiment using the Morris water maze (MWM) test as previously described [10]. Briefly, the Morris labyrinth was a grey-walled pool 150 cm in diameter and 60 cm of height, filled with water to a 40 cm height. The water temperature was 22 ± 2 °C. A round platform made of clear plastic (8 cm in diameter) was placed 1.5–2 cm below the water surface in the center of one of the pool quadrants. The pool was placed in a room with permanent spatial landmarks, and all test sessions were conducted under natural lightening. Animals were trained for one session per day for 2 continuous days. During the acquisition trials, rats were placed in the water from eight different points at approximately the same distance from the platform and each other on the one semicircle of the pool. After reaching the platform, the animal remained sitting on it for 15 s; then, the animal was placed in a separate cage for 60 s. Rats that did not find the platform within 60 s were gently guided towards it and left on it for 15 s as well. In each trial, the time required for every animal to reach the platform was recorded.
2.4. Samples Obtained and Histological Preparations
On the 61st day of the experiment, samples of peripheral blood were obtained under Zoletil (Vibrac Sante Animale, France) anesthesia; then, animals were euthanized by overdose (15 mg/kg) of Zoletil. The whole brains were fixed in 10% buffered formalin (BioVitrum, Saint-Petersburg, Russia) for 24 h, then dissected at the level of 6.0 mm posterior relative to bregma (each sample was 5 mm thick) [11]. After that, the specimens were dehydrated with ethanol of increasing concentration, cleared with xylene, infiltrated with a histological wax, and embedded in paraffin blocks for further slicing (5 µm thick).
2.5. Morphological Study
For morphological study, histological sections of brains were stained according to Nissl’s method. The absolute number of neurons in the standard area of the visual field (25,000 μm2) and the relative number of hyperchromic and morphologically altered neurons were evaluated on these sections in zones CA1, CA3, and in the dentate gyrus of the hippocampus. Images were captured using the Leica microscope (DM 2500 Leica Microsystems, Germany) on magnification ×400.
2.6. Immunohistochemical Study
For ICH-P study, frontal histological sections of brains (6.0 mm posterior relative to bregma) were prepared as previously described [12]. Then, they were stained with rabbit primary antibodies Iba1 (1:100; P4C288Ra01, Cloud Clone) + secondary HRP Donkey-anti-Rabbit antibody (1:500; 416,035, Novex Life Technologies) with additional hematoxylin staining. Images were captured using the Leica microscope (DM 2500 Leica Microsystems) on magnification ×1600.
2.7. qPCR-RT Study
The expression of mRNA was assayed by real-time qPCR in tissue fragments of the prefrontal cortex, preserved in IntactRNA solution (Eurogen, Russia), and stored at −20 °C until studied. The performed analysis included the detection and evaluation of expression levels of pro-inflammatory cytokines (Il-6, Il-18, and Tnf-α), anti-inflammatory cytokines (Il-10 and Tgf-β), microglia M1 (iNos) and M2 (Cd163) activation markers, amyloid-related proteins (App and Bace1), and markers of cellular senescence (Mmp9, Hif-1a, p16, and SA-β-galactosidase). The measured mRNA expression levels, relative to the expression level of the gene Gapdh as a reference [13], were determined using qPCRmix-HS SYBR (Eurogen, Russia) with fluorescent intercalating dye SYBR Green I. Amplification, detection, and digital analysis of fluorescence levels in real time was performed on DT-96 Real-Time PCR Cycler (DNA-Technology JSC, Moscow, Russia) in standard mode at 95 °C for 5 min followed by 95 °C for 15 s, 62 °C for 10 s + reading, and 72 °C for 20 s ×45. All the primers’ sequences were picked up precisely for rat species by on-line soft Primer-BLAST (Appendix A).
2.8. Flow Cytometry
The relative numbers of lymphocyte subpopulations and monocyte in peripheral blood were counted using flow cytometry (Beckman Coulter, CA, USA). The following antibodies (eBioscience, San Diego, CA, USA; all anti-rat) were used for immune phenotypic analysis: CD3+-PE for examination of general T-lymphocyte population percentage; CD3+-PE + CD4+-FITC for CD3+CD4+ T-helpers; CD3+-PE + CD8-PE-Cy5 for CD3+CD8+ for T-cytotoxic cells; CD45R-FITC for CD45R+ B-cells; CD43-PE for CD43+ monocyte. Erythrocytes were lysed using the OptiLyse C solution (eBioscience, San Diego, CA, USA).
2.9. Statistical Analysis
The results were analyzed by Statistica 8.0 software (StatSoft, Inc., Tulsa, OK, USA). The normality of data distribution was checked by using the Kolmogorov–Smirnov test. The Kruskal–Wallis test and, post hoc, the Dunn test were used to establish the reliability of differences between groups by median. p < 0.05 was considered as statistically significant.
3. Results
3.1. Short-Term Memory Evaluation
During the acquisition trials performed before the beginning of the experiment (day 0), Old-C rats took 1.5-fold more time to reach the platform in MWM than Adult-C ones. But there was no difference between these groups when the test was carried out on the 56th day of the experiment. Adult-AlCl3 rats required 1.8-fold more time to perform the task after 2 months of AlCl3 treatment, in comparison to the time required before treatment began (Figure 1).

Figure 1.
Time (s) required to reach the platform during acquisition trials for adult and old Wistar rats of control and experimental groups on day 0 and day 56 of the experiment. Adult-C 0—adult rats control group (n = 8), the trial on day 0 of the experiment; Adult-C 56—adult rats control group (n = 8), the trial on day 56 of the experiment; Adult-AlCl3 0—adult rats that consumed AlCl3 (n = 8), the trial on day 0 of the experiment; Adult-AlCl3 56—adult rats that consumed AlCl3 (n = 8), the trial on day 56 of the experiment; Old-C 0—old rats control group (n = 8), the trial on day 0 of the experiment; Old-C 56—old rats control group (n = 8), the trial on day 56 of the experiment; Old-AlCl3 0—old rats that consumed AlCl3 (n = 8), the trial on day 0 of the experiment; Old-AlCl3 56—old rats that consumed AlCl3 (n = 8), the trial on day 56 of the experiment. The data displayed as: line—median, box—25–75 quartiles, whiskers—nonoutlier range; *—p < 0.05. The Kruskal–Wallis test was used for multiple comparisons.
3.2. The Percentage of Hyperchromic Neurons
The absolute numbers of neurons in zones CA1, CA3, and in the dentate gyrus of the hippocampus were nearly the same in all four groups of animals, whereas the relative numbers of altered hyperchromic neurons differed significantly among them. Old-C animals demonstrated a 3.5 times higher percentage of neurons in the CA1 hippocampal zone compared with Adult-C rats. This tended to increase in the CA3 zone and the dentate gyrus, but the difference between these data was statistically insignificant. Comparing adult animals, the hyperchromic neurons’ percentage was 4.1-fold higher in Adult-AlCl3 rats than in Adult-C rats, but only, as well, in the CA1 zone of the hippocampus. Meanwhile, Old-AlCl3 rats showed a 2.2-fold higher number of hyperchromic neurons in the CA3 hippocampal zone and a 2.8-fold higher number in the dentate gyrus compared with the Adult-AlCl3 group (Figure 2 and Figure 3).


Figure 2.
CA1 (A,C,E,G) and CA3 (B,D,F,H) zones of the hippocampus in rats of Adult-C group (A,B), Adult-AlCl3 group (C,D), Old-C group (E,F), and Old-AlCl3 group (G,H). Nissl’s staining, ×400.

Figure 3.
The percentage of hyperchromic neurons in zones CA1, CA3, and in the dentate gyrus of the hippocampus in adult and old Wistar rats of control and experimental groups. HN—hyperchromic neurons; Adult-C—adult rats control group (n = 8); Adult-AlCl3—adult rats that consumed AlCl3 (n = 8); Old-C—old rats control group (n = 8); Old-AlCl3—old rats that consumed AlCl3 (n = 8). The data displayed as: line—median, box—25–75 quartiles, whiskers—nonoutlier range; *—p < 0.05. The Kruskal–Wallis test was used for multiple comparisons.
3.3. Morphological Features of Microglia
Identified by ICH staining with anti-Iba1 antibody, the vast majority of microglial cells in the Adult-C group had a regular size of about 15–30 µm and thin, moderately ramified processes, which are features of the resting functional state. Compared with Adult-C rats’ microglial cells, those in the Old-C group had an increased size (>30 µm) and spheroidal, swollen, hypertrophic, beaded, and tortuous processes. In the Adult-AlCl3 group, microglia had the same morphological features as in the corresponding Adult-C group. At the same time, there were microglia of an increased size (>30 µm) concurrent with beaded, tortuous, and fragmented but not thickened processes in Old-AlCl3 rats, which distinguished them from both Adult-AlCl3 and Old-C group rats (Figure 4).

Figure 4.
Morphological characteristics of microglia cells with thin and short processes in both Adult-C (A) and Adult-AlCl3 (B) groups; enlarged microglia with spheroidal swelling, hypertrophic, beaded, and tortuous processes in Old-C rats (C); and microglia of an increased size with beaded, tortuous, and fragmented but not thickened processes in Old-AlCl3 rats (D). Iba-1 antibody + HRP secondary antibody IHC and hematoxylin staining, ×1600. Adult-C—adult rats control group (n = 8); Adult-AlCl3—adult rats that consumed AlCl3 (n = 8); Old-C—old rats control group (n = 8); Old-AlCl3—old rats that consumed AlCl3 (n = 8).
3.4. qPCR-RT Examination of the Prefrontal Cortex
3.4.1. Pro-inflammatory Markers
The result of qPCR-RT of the prefrontal cortex tissue fragments showed that the pro-inflammatory cytokine Il-18 expression level was higher in Old-C rats than in Adult-C ones by 74 fold. Notably, it was quite low and almost the same in both Adult-C and Adult-AlCl3 groups. But it also was higher, by 22 times, in Old-AlCl3 rats compared to Adult-AlCl3 rats. Compared with the Old-C group, there was a tendency for Il-18 expression to decrease in the Old-AlCl3 group, although a statistically significant difference was not observed.
The level of Tnf-α expression was 2-fold higher in Old-C animals in comparison with Adult-C rats. Due to aluminum exposure, it increased 1.8-fold in Adult-AlCl3 rats compared with Adult-C ones, whereas it was measured at the same level in Old-AlCl3 rats as in both Adult-AlCl3 and Old-C groups (Figure 5).
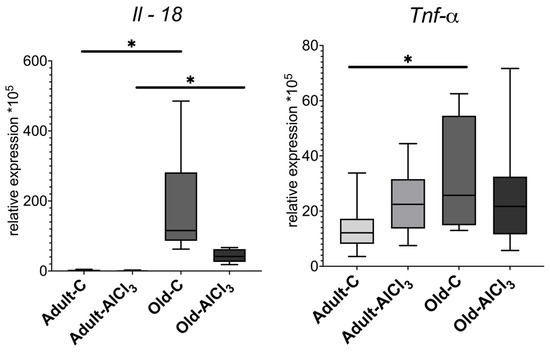
Figure 5.
Mrna expression levels of Il-18 and Tnf-α in the prefrontal cortex of adult and old Wistar rats in control and experimental groups. Adult-C—adult rats control group (n = 7); Adult-AlCl3—adult rats that consumed AlCl3 (n = 8); Old-C—old rats control group (n = 8) Old-AlCl3—old rats that consumed AlCl3 (n = 8). The data displayed as: line—median, box—25–75 quartiles, whiskers—nonoutlier range; *—p < 0.05. The Kruskal–Wallis test was used for multiple comparisons.
3.4.2. Anti-Inflammatory Markers
Unlike Adult-C rats, Old-C ones did not demonstrate a detectable expression level of anti-inflammatory cytokine Il-10 at all. The Adult-AlCl3 group showed a decrease in its expression level by 3.1 times in comparison with the Adult-C group, whilst no Il-10 expression level was observed in the Old-AlCl3 group or in the Old-C group.
The expression level of Tgf-β, which is another marker of anti-inflammatory response, was 7.25 times less in the Old-C group compared with the Adult-C one. Also, compared with Adult-C rats, its expression level was downregulated notably in Adult-AlCl3 animals, although a statistically significant difference was not confirmed. The Old-AlCl3 group demonstrated a similar tendency of changing Tgf-β expression; as in the case of Il-10 expression, its level was the same as that in the Old-C group (Figure 6).
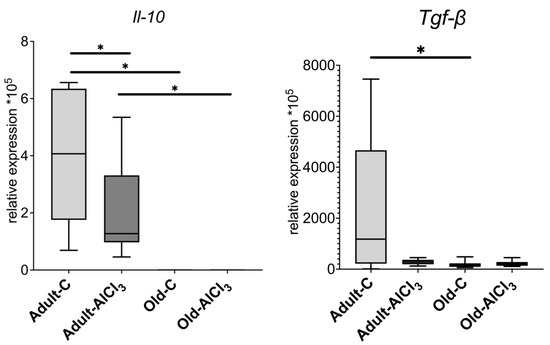
Figure 6.
mRNA expression levels of Il-10 and Tgf-β in the prefrontal cortex of adult and old Wistar rats in control and experimental groups. Adult-C—adult rats control group (n = 7); Adult-AlCl3—adult rats that consumed AlCl3 (n = 8); Old-C—old rats control group (n = 8); Old-AlCl3—old rats that consumed AlCl3 (n = 8). The data displayed as: line—median, box—25–75 quartiles, whiskers—nonoutlier range; *—p < 0.05. The Kruskal–Wallis test was used for multiple comparisons.
3.4.3. Microglia Activation Markers
The expression level of iNos, which is a pro-inflammatory cytokine and one of the markers of microglia activated towards M1 state, was 5.3-fold higher in Old-C rats in comparison with Adult-C ones. No difference of it was observed in the Adult-AlCl3 group compared with the Adult-C group. Likewise, the statistical difference of the iNos expression level in Old-AlCl3 animals relative to both Adult-AlCl3 and Old-C groups was unreliable.
Being a marker of M2 activated microglia, Cd163 demonstrated a similar tendency as iNos, regarding changes in its expression level, and was upregulated by 8.5 times in Old-C animals relative to Adult-C ones. In Adult-AlCl3 rats, its expression level also slightly increased in comparison with Adult-C ones, with statistical difference unconfirmed. Notably, unlike the iNos expression level, the CD163 level demonstrated down-regulation in Old-AlCl3 rats relative to both Adult-AlCl3 and Old-C groups; similarly, a statistical difference was unconfirmed.
Notably, the M1/M2 ratio calculated from the iNos/Cd163 data of corresponding animals was 11-fold higher in the Old-C group in comparison with that of Adult-C rodents. Also, compared with Adult-C animals, this index was similar to the Adult-AlCl3 group. For Old-AlCl3 rats, this ratio declined by 5.5 times relative to Old-C rats but remained at the same level as that in the Adult-AlCl3 group (Figure 7).
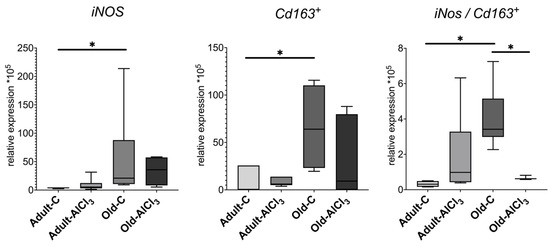
Figure 7.
mRNA expression levels of iNos and Cd163+ and M1/M2 (iNos/Cd163+) ratio in the prefrontal cortex in adult and old Wistar rats of control and experimental groups. Adult-C—adult rats control group (n = 7); Adult-AlCl3—adult rats that consumed AlCl3 (n = 8); Old-C—old rats control group (n = 6); Old-AlCl3—old rats that consumed AlCl3 (n = 5); The data displayed as: line—median, box—25–75 quartiles, whiskers—nonoutlier range; *—p < 0.05. The Kruskal–Wallis test was used for multiple comparisons.
3.4.4. Amyloid-Related Proteins
Amyloid precursor protein (App) expression remained almost the same in Old-C rats compared with Adult-C ones, and no difference was observed between Adult-C and Adult-AlCl3 groups. However, the App expression level was 1.9 times less in the Old-AlCl3 group than in the Old-C one; this difference was not observed in the Adult-AlCl3 group.
Like App, Beta-site APP-cleaving enzyme 1 (Bace1) expression changed in a similar way when comparing Adult-C rats and Old-C rats as well as Adult-C and Adult-AlCl3 animals. However, it demonstrated significant downregulation in the Old-AlCl3 group relative to both the Old-C (2 times less) and the Adult-AlCl3 (1.7 times less) ones (Figure 8).

Figure 8.
mRNA expression levels in App and Bace1 in the prefrontal cortex of adult and old Wistar rats of control and experimental groups. Adult-C—adult rats control group (n = 7); Adult-AlCl3—adult rats that consumed AlCl3 (n = 8); Old-C—old rats control group (n = 8); Old-AlCl3—old rats that consumed AlCl3 (n = 8); The data displayed as: line—median, box—25–75 quartiles, whiskers—nonoutlier range; *—p < 0.05. The Kruskal–Wallis test was used for multiple comparisons.
3.4.5. Cellular Senescence Markers
Cyclin-dependent kinase inhibitor 2A, or p16 INK4a (p16), is a SASP marker, and its level of expression was upregulated by 10 times in Old-C rats in comparison with Adult-C ones. Relative to the Adult-C group, its level of expression remained the same in the Adult-AlCl3 group. The level of p16 expression was the same in the Old-AlCl3 group as in the Old-C group.
The senescence-associated beta-galactosidase (Sa-β-gal) level of expression increased by 1.5 times in Old-C rats compared with Adult-C ones, whereas it did not change in the Adult-AlCl3 group relative to the Adult-C one. Old-AlCl3 rats showed the same Sa-β-gal expression level as both Old-C and Adult-AlCl3 animals.
The expression level of matrix metalloprotease 9 (Mmp9), which is a marker of both M2 microglia activation and SASP, was 3-fold more in the Old-C group than in Adult-C rodents. In Adult-AlCl3 rats, it remained the same as in Adult-C ones.
Hypoxia-inducible factor 1-alpha (Hif-1a) demonstrates the presence of a hypoxic condition and always appears alongside inflammation. Its expression level was 2.7-fold higher in the Adult-C group than in the Old-C one. In Adult-AlCl3 rats, it demonstrated a steady tendency of downregulation in comparison with Adult-C ones, with statistical difference unconfirmed. Old-AlCl3 rats showed the same level of it as those in both Adult-AlCl3 and Old-C groups (Figure 9).
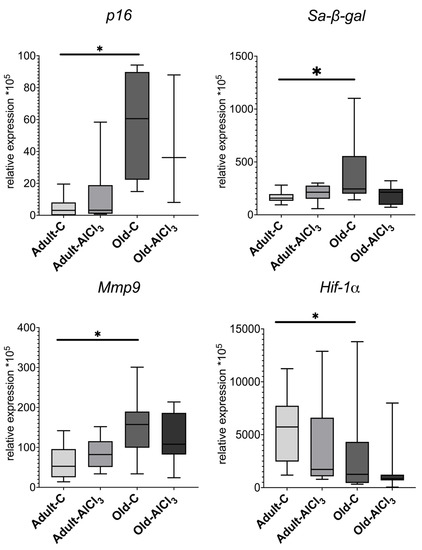
Figure 9.
mRNA expression levels of p16, Sa-β-gal, Mmp9, and Hif-1α in the prefrontal cortex in adult and old Wistar rats of control and experimental groups. Adult-C—adult rats control group (n = 5); Adult-AlCl3—adult rats that consumed AlCl3 (n = 6); Old-C—old rats control group (n = 8); Old-AlCl3—old rats that consumed AlCl3 (n = 5); The data displayed as: line—median, box—25–75 quartiles, whiskers—nonoutlier range; *—p < 0.05. The Kruskal–Wallis test was used for multiple comparisons.
3.5. The Relative Numbers of Lymphocytes and Monocyte in Peripheral Blood
Additionally, immune phenotypic analysis of monocyte and lymphocyte subpopulations was performed to estimate the impact of aging and/or AlCl3 treatment on the number of various immune cells in peripheral blood. Flow cytometry data did not demonstrate any statistically significant differences in the percentage of the general lymphocyte population (CD3+), including CD3+CD4+ T-helpers and CD3+CD8+ T-cytotoxic cells, among all observed groups (Table 1).

Table 1.
Relative number (%) of lymphocyte subpopulations in peripheral blood of adult and old Wistar rats of control and experimental groups (Me (25;75%)).
Meanwhile, the relative number of CD45R+ B-cells decreased 1.8 times in the Old-C group compared with the Adult-C one. In Adult-AlCl3 rats, it remained unchanged relative to Adult-C ones. At the same time, in the Old-AlCl3 group, it demonstrated a decrease of 2.6 times in comparison with the Adult-AlCl3 group, remaining at the same number as in the Old-C group.
Likewise, the percentage of CD43+ monocyte was almost 5.5-fold higher in Adult-C rats in comparison with Old-C ones. No difference in this percentage, nor in the percentage of CD45R+ B-cells, was observed between Adult-C and Adult-AlCl3 groups. Old-AlCl3 animals showed a pronounced decline, of 5.2 times, compared with Adult-AlCl3 rats; no difference was observed in comparison with Old-C rats (Figure 10).
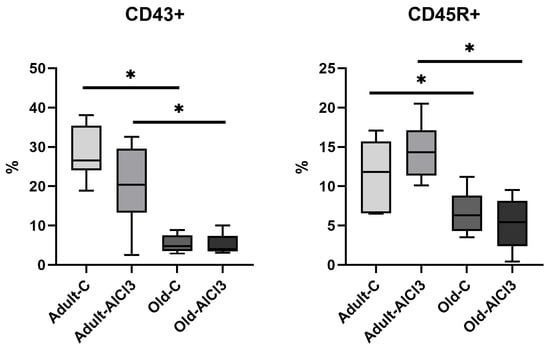
Figure 10.
The percentage of CD45R+ B-cells and CD43+ monocyte in peripheral blood of adult and old Wistar rats of control and experimental groups. Adult-C—adult rats control group (n = 8); Adult-AlCl3—adult rats that consumed AlCl3 (n = 8); Old-C—old rats control group (n = 8); Old-AlCl3—old rats that consumed AlCl3 (n = 8). The data displayed as: line—median, box—25–75 quartiles, whiskers—nonoutlier range; *—p < 0.05. The Kruskal–Wallis test was used for multiple comparisons.
Hence, we observed a great deal of change among groups due to aging and neurodegeneration modelling (Figure 11). Comparing with the Adult-C group, Old-C rats showed (1) an increase in altered hyperchromic neurons’ percentage in CA3 and in the dentate gyrus of the hippocampus; (2) an alteration of microglia morphology and a shift in microglia from resting to activated states, both M1 and M2; (3) an upregulation of mRNA expression levels of pro-inflammatory cytokines (Il-18 and Tnf-a), markers of microglial activation (iNos and Cd163) with M1-type predominance, and cellular senescence markers (p16, Sa-β-gal, and Mmp9); (4) a downregulation of anti-inflammatory cytokines’ mRNA expression levels (Il-10 and Tgf-β) as well as Hif-1a; and (5) a decrease in the relative numbers of B-cells and monocyte in peripheral blood.

Figure 11.
Morphofunctional changes in brain and peripheral blood in adult and old Wistar rats due to aging and neurodegeneration modelling. Adult-C—adult rats control group, Old-C—old rats control group, Adult-AlCl3—adult rats that consumed AlCl3, Old-AlCl3—old rats that consumed AlCl3, DG—dentate gyrus, TNF-α—tumor necrosis factor α, IL-18—interleukin 18, IL10—interleukin 10, TGF-β—transforming growth factor β, iNOS—inducible nitric oxide synthase, M1/M2 ratio—ratio of mRNA expression of markers for M1-type activated microglia to M2-type activated microglia, MMP9—matrix metallopeptidase 9, p16—cyclin-dependent kinase inhibitor 2A, Sa-β-gal—senescence-associated-β-galactosidase, HIF-1α—hypoxia-inducible factor 1α, APP—amyloid precursor protein, BACE1—β-Site APP-cleaving enzyme 1.
With exposure to AlCl3, Adult-AlCl3 rats demonstrated an increase in the percentage of hyperchromic neurons in the CA1 zone of the hippocampus alongside short-term memory decline, moderate upregulation of the Tnf-α expression level, and downregulation of the Il-10 expression level.
At the same time, Old-AlCl3 animals displayed the greatest percentage of altered hyperchromic neurons, downregulation of App and Bace1 mRNA expression, an alteration of microglia morphology to the dystrophic type, and a decline of M1/M2-activated microglia ratio.
4. Discussion
4.1. Morphofunctional Changes in Brain and Peripheral Blood of Wistar Rats Due to Aging
One of the main features of aging is cellular senescence manifesting in the increasing number of SASP-expressed cells. According to our data, old Wistar rats of the control group displayed this feature in the same way as it was observed in humans [14].
Our data obtained by MWM performance demonstrated a decline of short-term memory functions in old control animals relative to adult ones before the experiment began, although aged rats demonstrated escape latency similar to adult animals during the second session of trials. Apparently, aging affects the rat population highly heterogeneously, just as it does in humans, and we observed a high variability in the intertrial and interindividual results among all the animals, as colleagues did before [15]. This made statistical analysis and the interpretation of results quite a challenging task. However, it seems like multistage and highly interconnected memory-related processes tend to readjust with aging to sustain their efficacy [16], and some animals manage this better than other [17]. This could be correlated with the prevalence of lesions in the hippocampal region.
We observed a notable increase in the percentage of altered hyperchromic neurons in the hippocampus of old control rats compared with adult ones. Recent data confirm an increase in the relative number of hyperchromic neurons in aged rats in comparison with adult animals without any external exposure due to aging itself [18]. In our work, we counted mostly morphologically altered neurons of lesser size and polygonal, shrunken and wrinkled shape. Apparently, the protein biosynthesis in such neurons was switched to providing for the needs of their own mostly, which is required for their survival in unfavorable conditions. However, due to the subsequent decrease in protein synthesis for export to synaptic terminals, these neurons’ activity and interconnections will inevitably fade [19]. The fate of hyperchromic neurons (recovery of functions or death) depends on the ongoing conditions as well as on the brain region. Ooigawa et al. reported lower survival rates of hyperchromic neurons in the hippocampus compared with those in the neocortex of rats that underwent traumatic brain injury [20]. Shrinkage of hyperchromic neurons probably demonstrates the degeneration and atrophy caused by the long-term persistence of unfavorable conditions, which could be regarded as a pathological state preceding cell death [21]. This should be interpreted as a severe pathological change, more permanent than not, with the persistence of particularly deleterious conditions. Hence, this shrinkage could be caused by the development of inflammaging, which is an unfavorable condition indeed. The upregulation of various pro-inflammatory cytokines and senescence biomarkers due to SASP expression contributes to the ROS production escalating, which is most harmful to mitochondria. With these “cell engines” damaged, it becomes even harder for neurons to maintain themselves properly in such an inauspicious environment, which leads to their maladaptation and eventual loss of functions.
Another factor which might contribute to neuronal dysfunction and, in particular, synaptic dysfunction, is microglia alteration. Our data of microglial morphology changing in old rats compared with adult ones are consistent with recent results obtained from humans. It was observed that identical changes of microglia appeared in healthy humans due to aging [12]. According to recent discoveries, microglia, which are resident immune cells in the CNS, might play a pivotal role in AD initiation and development [2]. Cellular senescence manifesting with SASP is responsible for the continuing increase in pro-inflammatory mediators’ production which, among other reasons, contributes to microglia activation and further establishes a vicious cycle of the disease [22]. It is also worth noting that microglial cells as well as all other types of cells, including immune ones, undergo the process of cellular senescence themselves [23], which additionally affects their features and disrupts their function. Shahidehpour et al. described similar age-related changes in microglia morphology, observed in healthy elderly people, as hypertrophic [12]. Apparently, long-term persistence of low-grade neuroinflammation made microglia primed for too long, and the microglia eventually become hypertrophic as well as senescent. As we showed, Tnf-α and Il-18 mRNA expression levels rose dramatically in old rats relative to adult animals, which is consistent with previous researches [24]. These pro-inflammatory cytokines are produced mostly by microglia, although astrocytes and neurons are capable of secreting IL-18 as well [25], and perform essential pleiotropic effects under physiological conditions [25,26]. Although aging is also a type of physiological state, the more the lifespan is prolonged, the higher the number of SASP-expressing cells becomes. The imbalance that emerges between pro-inflammatory and anti-inflammatory mediators leads to the manifestation of age-related diseases [27]. This impact of inflammaging could also make microglia cells less susceptible to external signals, including anti-inflammatory mediators, and abate their immune surveillance and clearance functions.
Whereas the expression levels of pro-inflammatory mediators rose significantly in aged rats relative to adult animals, the levels of Il-10 and Tgf-β demonstrated exactly the opposite. Like cytokines such as TNF-α and IL-18, they are involved in various integrative processes as well. So, IL-10 is able to inhibit the production of pro-inflammatory cytokines, e.g., TNF-α, ROS generation, microglia activation, and antigen presentation, by reducing the expression of the major histocompatibility complex class II (MHC II). It is also capable of enhancing B-cells’ proliferation and antibody production [28] and regulating neurogenesis [29] and production of anti-inflammatory mediators, mostly by glial cells, including TGF-β [30]. As for TGF-β itself, its pleiotropic impact includes the regulation of the differentiation of the resident cells of the CNS, in both the developing and adult brain [31], as well as synaptogenesis and synaptic transmission [32]. Apparently, it also has a neuroprotective effect, particularly against ischemia/hypoxia, and could be produced by both glial cells and neurons under such inauspicious conditions [33]. As an anti-inflammatory cytokine in the first place, TGF-β protects against collateral damages caused by the immune system. Furthermore, TGF-β is a prominent immune suppressor that inhibits the proliferation, differentiation, activation, and effector functions of immune cells, including microglia. Since microglia are a major source of TGF-β1 in the CNS, they might execute an auto-inhibitory control in this way [34]. All mentioned benevolent features of these cytokines occur under physiological conditions, whereas their permanent high level of expression due to cellular senescence and inflammaging [27,35] development becomes another deleterious factor [36]. A possible reason for why we registered no expression of Il-10 and a dramatically decreased level of expression of Tgf-β is, on the one hand, the critical lack of cells’ energy supplies and switching metabolic processes in “power saving mode”, which could be inferred based on altered morphology of neurons.
On the other hand, when discussing microglia, the absent or lower levels of Il-10 and Tgf-β expression could be a consequence of the activated state of the microglia, mostly M1. It is generally accepted that the CNS resident immune cells have “resting” and activated states. Microglia activation, as well as macrophage activation, leads cells to a pro-inflammatory M1 or anti-inflammatory M2 polarization state. There is also a continuum of different intermediate phenotypes between M1 and M2, and microglia can shift from one state to another depending on microenvironment condition changes [37]. So, it was not a surprise to observe the presence of a small percentage of both M1 and M2 microglia cells in healthy adult rodents. At the same time, there was a significant rise of iNos and Cd163 expression levels, as well as an increase in the M1/M2 ratio and in the expression of pro-inflammatory cytokines, in old rats relative to adult ones. These data confirm the presence of a higher number of activated immune cells with M1 predominance caused by aging itself due to the development of SASP expression. Being both activated and senescent, these microglial cells not only fail in their clearance and immune surveillance functions, but also participate in the consistent aggravation of already existing SASP-established neuroinflammation.
According to our qPCR-RT data, aged but conditionally healthy rats have the same level of App and Bace1 expression as healthy adult ones. APP is an integral membrane receptor widely distributed in most tissues. In the CNS, it has an impact on synaptogenesis and neuroplasticity processes. BACE1 is one of the secretases involved in its metabolism via the amyloidogenic pathway, but, according to recent studies, it also has a pivotal role in synaptic transmission, plasticity, and long-term potentiation vital for memory-related processes [38]. For decades, Aβ was regarded as the main culprit of AD, the most prevalent among neurodegenerative diseases. Apparently, however, the etiology and pathogenesis of AD are rather complicated, with various integral processes involved such as oxidative stress, microglial activation, inflammaging, etc. [22]. Aβ plagues are, indeed, the hallmark of the AD or Alzheimer’s continuum, but according to acting clinical guidelines, it is strictly a morphological diagnosis; AD as an organic disorder could exist in elderly people without any clinical manifestations [39]. There is a critical lack of data obtained from aged, non-transgenic rodents concerning changes in App and Bace1 expression and subsequent protein biosynthesis. Therefore, we may only speculate that aging alone is probably not enough to disturb this precise part of neuronal metabolism and lead to the initiation of degeneration. Unlike laboratory rats, most people of advanced age have various diseases, including age-related diseases such as atherosclerosis, arterial hypertension, metabolic syndrome/obesity, T2DM, etc. All these pathological conditions are capable of enhancing the background of inflammaging. This confirms the multiplicity of mechanisms that initiate the processes of neurodegeneration [27]. In addition, it also provides evidence that most popular transgenic models of AD, the main feature of which is excessive APP production, do not provide a description of the disease development as it occurs in humans. The abnormally intensive APP synthesis in these mice causes the deposition of Aβ plagues in their brains and eventual cognitive impairments. However, these are both nonspecific clinical syndromes and an end point in the complex chain of previous physiological and pathological events. In this regard, Aβ or BACE1 inhibitor-based treatment could be considered only as a symptomatic therapy; mechanisms of initiation, lasting, developing, and triggering of the clinical manifestation of neurodegeneration cannot be extrapolated from transgenic mice to humans.
Aside from the aforementioned markers, we also observed a notable increase in p16, Sa-β-gal, and Mmp9 mRNA expression levels and a downregulation of Hif-1α. As mentioned before, aging itself is a kind of physiological condition. It is inevitable that aging will appear as cellular senescence. In the first place, it is a means to prevent the development of tumors. With advanced aged, pro-oncogenes’ upregulation, anti-oncogenes’ downregulation, and irreparable accumulated DNA damage not only induce apoptosis, but also enhance the pace of cellular senescence to achieve this purpose. Although SASP manifestation is highly heterogeneous depending on tissue types, external stresses, and internal pathological processes [40], p16 and Sa-β-gal are regarded as its most universal markers [41]. p16 acts as a main inhibitor of several cyclin-dependent kinases (CDK) and arrests the cell cycle by blocking downstream processes and, therefore, the G1-S phase transition [35]. Occurrences such as the accumulation of DNA damage or the escalation of ROS production could promote its activation [42]. At the same time, Sa-β-gal is lysosomal β-galactosidase only in senescent cells. It is a less sensitive marker than p16 and a consequence of upstream processes leading to senescence rather than its substantive influencer [41,43]; however, it remains reliable evidence for the presence of SASP-expressed cells. Upregulation of these markers in aged animals was an expected find. MMP9 is a type IV collagenase involved in degradation of most structural elements of the extracellular matrix, which leads to both physiological and pathophysiological tissue remodeling. It is also one of the most common SASP components. Its expression could be upregulated by ROS both directly and indirectly through NF-κB pathway activation, which could happen due to an increase in Tnf-a as well [44]. In the CNS, microglia and macrophages migrated from peripheral blood are the main source of its production [45], and their activated state due to inflammaging is a reasonable explanation for Mmp9 upregulation.
HIF-1α is a heterodimeric transcription factor mediating the adaptive response of mammalian cells to hypoxia. The higher its level, the more vulnerable cells will be to hypoxic conditions. Although HIF-1α is not considered as a marker of cellular senescence, apparently, its expression and accumulation in tissues is related with the stage of ontogenesis. Ndubuizu et al. reported a decline in HIF-1α protein, although not in mRNA expression, in the brain of aged Fischer 344 rats [46]. Colleagues from our department showed that Hif-1α was significantly lower in the liver of newborn and prepubertal male Wistar rats compared with adult ones, which confirms its fluctuation during the lifespan [47]. According to our recent yet unpublished data, its level of expression decreased notably in old male Wistar rats relative to adult ones. Hif-1α downregulation registered in old rats is probably another feature of adaptation adjustment due to aging, although further investigations in this regard are necessary.
Additionally, we observed a reduction of CD43+ monocyte and CD45R+ B-cells’ relative numbers in the peripheral blood of Old-C rats in comparison with Adult-C ones. A recent study investigating the impact of aging on lymphopoiesis in both humans and mice revealed a correlation between the rising production of TNF-α by peripheral B-cells and the inhibition of B-cell lymphopoiesis in the bone marrow [48]. Meanwhile, Snodgrass et al. detected a decrease in the circulating monocyte pool due to aging in humans [49]. This could happen due to the abating of monocytopoiesis in bone marrow as well as B-cells’ or cells’ destruction caused by inflammaging’s pro-inflammatory background; but it also could be explained by an intensification of monocyte migration to different tissues, including brain parenchyma, since inflammaging is a system condition involving the whole organism. It also could participate in an increase in Tnf-α, Il-18, and Mmp9 expression levels in samples of brain tissue, since these cytokines themselves are involved in BBB integrity violation and the stimulation of monocyte chemotaxis, which form another loop in the vicious cycle of pathological processes.
4.2. Morphofunctional Changes in Brain and Peripheral Blood of Adult Wistar Rats with AlCl3-Induced Neurodegeneration
There are various transgenic and non-transgenic models of neurodegeneration, including Al3+ ions’ use. These ions are capable of increasing ROS production, which is involved in mitochondrial and DNA damage, promotion of pro-inflammatory mediators’ expression and secretion, and the development of a hypoxic condition. AlCl3-based models of AD, including those using a 100 mg/kg oral dosage, are described widely in the literature [50], and all these researches were conducted on adult rats and mice. Our task was to observe and evaluate distinctions in the reactions of adult and old rodents to the same external exposure.
We observed a significant increase in the escape latency during MWM acquisition trials in adult rats that had chronically consumed AlCl3 relative to control littermates, as previously reported [51], as well as the most notable damage in the CA1 zone of the hippocampus compared with CA3 and the dentate gyrus of adult rats of the control and experimental groups. This probably could be explained by the difference of susceptibility of hippocampal regions to hypoxia, which enhances inflammation and ROS activity increase mediated by Al3+. Apparently, CA1 neurons are more vulnerable to hypoxia and oxygen-glucose deprivation (ODG) than CA3 and DG [52], probably due to their higher activity [53]. CA1 is responsible for mediating the association with the temporal cortex and is capable of maintaining short-term memories, whilst CA3 is mostly involved in processes establishing rapid spatial and contextual memory [52]. Such function distinction makes CA1 neurons both more essential and energy dependent, which means they are more vulnerable to hypoxia. Notably, a similar change of neural density was observed in AD patients compared with healthy age-matched elderly people—it was the most severe in CA1 among the CA1-CA4 regions [54].
Relative to control littermates, adult rats that consumed AlCl3 demonstrated a statistically significant upregulation of Tnf-α expression, although not Il-18 expression, as was reported earlier [55]. Since Al3+ is a strong promoter of ROS production enhancement, it inevitably leads to glial cell response and activation, with a subsequent increase in these mediators’ secretion. However, an increase in the absolute number of microglia or in the activated microglia percentage was not observed, which might explain such mild upregulation of pro-inflammatory cytokines. The statistically significant but moderate downregulation of Il-10, but not of Tgf-β, could also be a downstream event driven by just a faint shift of activated microglia continuum to the M1 state, as revealed by the M1/M2 ratio in the adult rats experimental group. Interestingly, both TNF-α and IL-18 might upregulate App and Bace1 expression, including via the activation of the Nf-κB pathway [56], but the Tnf-α increase registered in rats of the experimental group was probably not adequately pronounced to impact these proteins’ metabolism.
Despite the ability of Al3+ to promote enhanced ROS production, which leads to oxidative stress and DNA damage, chronic exposure to Al3+ did not cause a notable increase in any cellular senescence markers. This possibly means that adult rats’ cells possess enough energy resources for adaptation to inauspicious environmental conditions and proper performance of their functions and self-maintenance, including DNA reparation.
With exposure to AlCl3, Adult-AlCl3 rats demonstrated a tendency to demonstrate a decrease in CD43+ monocyte percentage and an increase in CD45R+ B-cell percentage, although it was statistically insignificant. Regarding the aforementioned Tnf-α expression level increase, it could probably display a tendency for monocyte migration to the CNS. Considering that the data imply that an increase in TNF-α impacts negatively on B-lymphocytes proliferation [48,57], the increase seems more like an adaptive recruitment of B-cells from the spleen rather than an intensification of lymphopoiesis in the bone marrow.
4.3. Morphofunctional Changes in Brain and Peripheral Blood of Old Wistar Rats with AlCl3-Induced Neurodegeneration
All pathological processes described for old control rats are also valid for old animals that consumed AlCl3. These processes demonstrated the highest percentage of altered hyperchromic neurons, which was statistically significant in CA3 and DG relative to the adult rats’ experimental group. The tendency for it to increase appeared to apply to the old rats control group as well, although it was statistically insignificant. Since the pro-inflammatory background of inflammaging persisted in these animals before the beginning of the experiment, additional damaging impact of AlCl3 likely aggravated mitochondrial dysfunction, which led to severe energy shortage and neuronal loss.
Unlike in both Adult-AlCl3 and Old-C groups, microglia cells displayed signs of dystrophy in AlCl3–treated old rats instead of activation or hypertrophy features. It is highly likely that this is evidence of their maladaptation due to the harmful impact of AlCl3 and due to a critical shortage of self-maintenance resources, in the same way as it occurs in neurons. Such cells are unable to produce adequate amounts of proteins essential for proper functioning, as proved by qPCR-RT data, including the downregulation of Cd163 and the decline in the M1/M2 ratio.
The expression level of Il-18 was significantly higher in Old-AlCl3 rats in comparison with Adult-AlCl3 ones and tended to decline when compared with old control animals, whereas Tnf-α expression remained unchanged relative to both these groups. This could probably be related to neuronal and glial functions and activity decline due to the deleterious impact of AlCl3, on the one hand, and, on the other, due to peripheral monocyte migration to the CNS. Highly pronounced downregulation of both Il-10 and Tgf-β might be caused by the same events as well.
Our data confirm that App and Bace1 expression levels and, therefore, these proteins’ subsequent biosynthesis, decrease greatly as neurodegeneration progresses. This probably demonstrates the advanced stage of this detrimental process, when neurons are no longer capable of producing APP and BACE1 to form new synapses or maintain deteriorating ones.
Expression levels of cellular senescence markers likely remained unchanged in AlCl3-treated old rats because, due to aging itself, they reached the threshold of their upregulation.
Old-AlCl3 animals showed a significant decrease in both CD43+ monocyte’ and CD45R+ B-cells’ relative numbers in comparison with those in Adult-AlCl3 rats. At the same time, these levels remained the same as those in the Old-C group. Apparently, AlCl3 did not affect these peripheral immune cells’ destruction, proliferation, or migration, and their lesser percentage occurred due to aging before the beginning of the experiment. Since the pro-inflammatory background already persisted in old animals, and AlCl3 consumption did not cause its further development but a decrease in cytokine expression due to cell dystrophy and death, there were no microenvironmental conditions to change these immune cells’ percentage anyhow.
5. Conclusions
There are many clear and essential differences between adult and old rats’ physiological states. Unlike adult animals, old animals have the background of inflammaging as an aggravating factor alongside energy resource shortage caused by aging itself. Considering this, aged rats respond differently to aluminum exposure compared to young animals. Instead of adaptation to inauspicious conditions, they display a severe decline of most cells’ function and irreversible neuronal loss. Regarding all reported data, neurodegeneration modelling and investigation of the factors capable of accelerating or preventing this degeneration should be performed in experimental work on aged animals.
Author Contributions
Conceptualization, A.V.S. and A.M.K.; methodology, A.M.K.; validation, A.V.S., E.A.M. (Ekaterina Alexandrovna Miroshnichenko) and A.M.K.; formal analysis, A.V.S., I.S.T. and A.M.K.; investigation, A.V.S., E.A.M. (Ekaterina Alexandrovna Miroshnichenko), E.A.M. (Ekaterina Andreevna Melnikova), I.S.T. and A.M.K.; resources, A.M.K.; data curation, A.V.S., E.A.M. (Ekaterina Alexandrovna Miroshnichenko) and A.M.K.; writing—original draft preparation, A.V.S. and A.M.K.; writing—review and editing, A.V.S., E.A.M. (Ekaterina Alexandrovna Miroshnichenko), E.A.M. (Ekaterina Andreevna Melnikova), I.S.T. and A.M.K.; visualization, A.V.S., E.A.M. (Ekaterina Andreevna Melnikova) and I.S.T.; supervision, A.M.K.; project administration, A.M.K.; funding acquisition, A.M.K. All authors have read and agreed to the published version of the manuscript.
Funding
Ministry of Health of the Russian Federation: Number of state registration of research, development, and technological work for civil purposes—122030200530-6.
Institutional Review Board Statement
The study was conducted according to the guidelines of the Declaration of Helsinki and approved by Avtsyn Research Institute of Human Morphology of Petrovsky National Research Centre of Surgery (Protocol №36 (12) 28 March 2022).
Informed Consent Statement
Not applicable.
Data Availability Statement
Not applicable.
Conflicts of Interest
The authors declare no conflict of interest.
Abbreviations
| Adult-AlCl3 | adult rats that consumed AlCl3 |
| Adult-C | adult rats control group |
| AlCl3 | aluminum chloride |
| APP | amyloid precursor protein |
| BACE1 | β-Site APP-cleaving enzyme 1 |
| BBB | blood–brain barrier |
| DG | dentate gyrus |
| CNS | central nervous system |
| GAPDH | glyceraldehyde 3-phosphate dehydrogenase |
| HIF-1α | hypoxia-inducible factor 1α |
| HRP | horseradish peroxidase |
| Iba1 | ionized calcium binding adaptor molecule 1 |
| ICH-P | Immunohistochemistry-paraffin protocol |
| IL-10 | interleukin 10 |
| IL-18 | interleukin 18 |
| iNOS | inducible nitric oxide synthase |
| MMP9 | matrix metallopeptidase 9 |
| MWM | Morris water maze |
| NF-κB | nuclear factor kappa-light-chain-enhancer of activated B cells |
| ODG | oxygen-glucose deprivation |
| Old-AlCl3 | old rats that consumed AlCl3 |
| Old-C | old rats control group |
| p16 | cyclin-dependent kinase inhibitor 2A |
| qPCR-RT | quantitative polymerase chain reaction, real-time regime |
| ROS | reactive oxygen species |
| Sa-β-gal | senescence-associated β-galactosidase |
| SASP | senescence-associated secretory phenotype |
| TGF-β | transforming growth factor β |
| TNF-α | tumor necrosis factor α |
Appendix A
Table A1.
qPCR-RT primers sequences used (all selected precisely for each rat species).
Table A1.
qPCR-RT primers sequences used (all selected precisely for each rat species).
| Primer | Forward Sequence | Reverse Sequence |
|---|---|---|
| GAPDH | GCGAGATCCCGCTAACATCA | CCCTTCCACGATGCCAAAGT |
| IL-18 | GACAAAAGAAACCCGCCTG | ACATCCTTCCATCCTTCACAG |
| TNF-a | CCACCACGCTCTTCTGTCTA | GCTACGGGCTTGTCACTCG |
| IL-10 | GCCCAGAAATCAAGGAGCAT | TGAGTGTCACGTAGGCTTCTA |
| TGF-β | CCGCAACAACGCAATCTATG | AGCCCTGTATTCCGTCTCCTT |
| iNOS | CGCTGGTTTGAAACTTCTCAG | GGCAAGCCATGTCTGTGAC |
| CD163 | TCTTGTGGACTCTGAAGCGA | TCTTAAATGCCAACCCGAGG |
| APP | TGGATGATCTCCAACCGTG | CGTCGACAGGCTCAACTTC |
| BACE1 | GGGCAGTAGTAATTTTGCAGT | TTCGGAGGTCTCGGTATGT |
| p16 | GTACCCCGATACAGGTGATG | GGTGCAGTACTACCAGAGTG |
| Sa-β-Gal | CTTCCGGATACCCCGATTCT | AGGGCACGTACGTCTGGAT |
| MMP9 | ATGGTTTCTGCCCCAGTGAG | CACCAGCGATAACCATCCGA |
| HIF-1a | TCACAGTCGGACAACCTCAC | TGCTGCAGTAACGTTCCAATTC |
References
- WHO. Dementia. 2021. Available online: https://www.who.int/publications/i/item/9789241550543 (accessed on 19 June 2023).
- Streit, W.J.; Braak, H.; Del Tredici, K.; Leyh, J.; Lier, J.; Khoshbouei, H.; Eisenlöffel, C.; Müller, W.; Bechmann, I. Microglial Activation Occurs Late During Preclinical Alzheimer’s Disease. Glia 2018, 66, 2550–2562. [Google Scholar] [CrossRef]
- van Dyck, C.H.; Swanson, C.J.; Aisen, P.; Bateman, R.J.; Chen, C.; Gee, M.; Kanekiyo, M.; Li, D.; Reyderman, L.; Cohen, S.; et al. Lecanemab in Early Alzheimer’s Disease. N. Engl. J. Med. 2023, 388, 9–21. [Google Scholar] [CrossRef] [PubMed]
- Franceschi, C.; Campisi, J. Chronic Inflammation (Inflammaging) and Its Potential Contribution to Age-Associated Diseases. J. Gerontol. A Ser. Biol. Sci. Med. Sci. 2014, 69 (Suppl. S1), S4–S9. [Google Scholar] [CrossRef] [PubMed]
- Dafsari, F.S.; Jessen, F. Depression—An underrecognized target for prevention of dementia in Alzheimer’s disease. Transl. Psychiatry 2020, 10, 160. [Google Scholar] [CrossRef] [PubMed]
- Alzheimer’s Disease Facts and Figures. Alzheimers Dement. 2022, 18, 700–789.
- Willhite, C.C.; Karyakina, N.A.; Yokel, R.A.; Yenugadhati, N.; Wisniewski, T.M.; Arnold, I.M.; Momoli, F.; Krewski, D. Systematic review of potential health risks posed by pharmaceutical, occupational and consumer exposures to metallic and nanoscale aluminum, aluminum oxides, aluminum hydroxide and its soluble salts. Crit. Rev. Toxicol. 2014, 44, 1–80. [Google Scholar] [CrossRef]
- Hesamian, M.S.; Eskandari, N. Potential Role of Trace Elements (Al, Cu, Zn, and Se) in Multiple Sclerosis Physiopathology. Neuroimmunomodulation 2020, 27, 163–177. [Google Scholar] [CrossRef]
- Firdaus, Z.; Kumar, D.; Singh, S.K.; Singh, T.D. Centella asiatica Alleviates AlCl3-induced Cognitive Impairment, Oxidative Stress, and Neurodegeneration by Modulating Cholinergic Activity and Oxidative Burden in Rat Brain. Biol. Trace Elem. Res. 2022, 200, 5115–5126. [Google Scholar] [CrossRef]
- Abramova, O.; Zorkina, Y.; Syunyakov, T.; Zubkov, E.; Ushakova, V.; Silantyev, A.; Soloveva, K.; Gurina, O.; Majouga, A.; Morozova, A.; et al. Brain Metabolic Profile after Intranasal vs. Intraperitoneal Clomipramine Treatment in Rats with Ultrasound Model of Depression. Int. J. Mol. Sci. 2021, 22, 9598. [Google Scholar] [CrossRef]
- Paxinos, G.; Watson, C.R.; Emson, P.C. Ache-Stained Horizontal Sections of the Rat Brain in Stereotaxic Coordinates. J. Neurosci. Methods 1980, 3, 129–149. [Google Scholar] [CrossRef]
- Shahidehpour, R.K.; Higdon, R.E.; Crawford, N.G.; Neltner, J.H.; Ighodaro, E.T.; Patel, E.; Price, D.; Nelson, P.T.; Bachstetter, A.D. Dystrophic microglia are associated with neurodegenerative disease and not healthy aging in the human brain. Neurobiol. Aging 2021, 99, 19–27. [Google Scholar] [CrossRef] [PubMed]
- Chen, J.; Rider, D.A.; Ruan, R. Identification of Valid Housekeeping Genes and Antioxidant Enzyme Gene Expression Change in the Aging Rat Liver. J. Gerontol. Ser. A 2006, 61, 20–27. [Google Scholar] [CrossRef] [PubMed]
- Franceschi, C.; Bonafè, M.; Valensin, S.; Olivieri, F.; De Luca, M.; Ottaviani, E.; De Benedictis, G. Inflammaging. An Evolutionary Perspective on Immunosenescence. Ann. N. Y. Acad. Sci. 2000, 908, 244–254. [Google Scholar] [CrossRef] [PubMed]
- Villarreal-Silva, E.E.; González-Navarro, A.R.; Salazar-Ybarra, R.A.; Quiroga-García, O.; Cruz-Elizondo, M.A.D.J.; García-García, A.; Rodríguez-Rocha, H.; Morales-Gómez, J.A.; Quiroga-Garza, A.; Elizondo-Omaña, R.E.; et al. Aged rats learn Morris Water maze using non-spatial search strategies evidenced by a parameter-based algorithm. Transl. Neurosci. 2022, 13, 134–144. [Google Scholar] [CrossRef] [PubMed]
- Gil-Mohapel, J.; Brocardo, P.S.; Choquette, W.; Gothard, R.; Simpson, J.M.; Christie, B.R. Hippocampal Neurogenesis Levels Predict WATERMAZE Search Strategies in the Aging Brain. PLoS ONE 2013, 8, e75125. [Google Scholar] [CrossRef]
- Burger, C.; López, M.C.; Feller, J.A.; Baker, H.V.; Muzyczka, N.; Mandel, R.J. Changes in transcription within the CA1 field of the hippocampus are associated with age-related spatial learning impairments. Neurobiol. Learn. Mem. 2007, 87, 21–41. [Google Scholar] [CrossRef]
- Ekova, M.; Smirnov, A.V.; Tyurenkov, I.N. Interrelation Structural and Functional Alterations in the Dentate Gyrus of Rats with Aging. Alzheimer’s Dement. 2021, 17, e052607. [Google Scholar]
- Zimatkin, S.M.; Bon’, E.I. Dark Neurons of the Brain. Neurosci. Behav. Physiol. 2018, 48, 908–912. [Google Scholar] [CrossRef]
- Ooigawa, H.; Nawashiro, H.; Fukui, S.; Otani, N.; Osumi, A.; Toyooka, T.; Shima, K. The fate of Nissl-stained dark neurons following traumatic brain injury in rats: Difference between neocortex and hippocampus regarding survival rate. Acta Neuropathol. 2006, 112, 471–481. [Google Scholar] [CrossRef]
- Korzhevskii, D.E. Neurodegeneration and Assessment of the Response of Nerve Cells to Damage. In Molecular Neuromorphology; SpetsLit.: Saint-Petersburg, Russia, 2015; p. 110. [Google Scholar]
- Streit, W.J.; Khoshbouei, H.; Bechmann, I. The Role of Microglia in Sporadic Alzheimer’s Disease. J. Alzheimer’s Dis. 2021, 79, 961–968. [Google Scholar] [CrossRef]
- Harry, G.J. Microglia during development and aging. Pharmacol. Ther. 2013, 139, 313–326. [Google Scholar] [CrossRef] [PubMed]
- Campuzano, O.; Castillo-Ruiz, M.M.; Acarin, L.; Castellano, B.; Gonzalez, B. Increased Levels of Pro-inflammatory Cyto-kines in the Aged Rat Brain Attenuate Injury-Induced Cytokine Response after Excitotoxic Damage. J. Neurosci. Res. 2009, 87, 2484–2497. [Google Scholar] [CrossRef] [PubMed]
- Ojala, J.O.; Sutinen, E.M. The Role of Interleukin-18, Oxidative Stress and Metabolic Syndrome in Alzheimer’s Disease. J. Clin. Med. 2017, 6, 55. [Google Scholar] [CrossRef] [PubMed]
- Lecca, D.; Jung, Y.J.; Scerba, M.T.; Hwang, I.; Kim, Y.K.; Kim, S.; Modrow, S.; Tweedie, D.; Hsueh, S.; Liu, D.; et al. Role of chronic neuroinflammation in neuroplasticity and cognitive function: A hypothesis. Alzheimer’s Dement. 2022, 18, 2327–2340. [Google Scholar] [CrossRef]
- Kosyreva, A.M.; Sentyabreva, A.V.; Tsvetkov, I.S.; Makarova, O.V. Alzheimer’s Disease and Inflammaging. Brain Sci. 2022, 12, 1237. [Google Scholar] [CrossRef] [PubMed]
- Porro, C.; Cianciulli, A.; Panaro, M.A. The Regulatory Role of IL-10 in Neurodegenerative Diseases. Biomolecules 2020, 10, 1017. [Google Scholar] [CrossRef]
- Pereira, L.; Font-Nieves, M.; Haute, C.V.D.; Baekelandt, V.; Planas, A.M.; Pozas, E. IL-10 regulates adult neurogenesis by modulating ERK and STAT3 activity. Front. Cell. Neurosci. 2015, 9, 57. [Google Scholar] [CrossRef]
- Norden, D.M.; Fenn, A.M.; Dugan, A.; Godbout, J.P. TGFβ produced by IL-10 redirected astrocytes attenuates microglial activation. Glia 2014, 62, 881–895. [Google Scholar] [CrossRef]
- Vogel, T.; Ahrens, S.; Büttner, N.; Krieglstein, K. Transforming Growth Factor Beta Promotes Neuronal Cell Fate of Mouse Cortical and Hippocampal Progenitors in Vitro and in Vivo: Identification of Nedd9 as an Essential Signaling Component. Cereb. Cortex 2010, 20, 661–671. [Google Scholar] [CrossRef]
- Fukushima, T.; Liu, R.Y.; Byrne, J.H. Transforming Growth Factor-Beta2 Modulates Synaptic Efficacy and Plasticity and In-duces Phosphorylation of Creb in Hippocampal Neurons. Hippocampus 2007, 17, 5–9. [Google Scholar] [CrossRef]
- Wu, Z.; Hayashi, Y.; Zhang, J.; Nakanishi, H. Involvement of Prostaglandin E2 Released from Leptomeningeal Cells in In-creased Expression of Transforming Growth Factor-Beta in Glial Cells and Cortical Neurons During Systemic Inflammation. J. Neurosci. Res. 2007, 85, 184–192. [Google Scholar] [CrossRef] [PubMed]
- Lenzlinger, P.M.; Morganti-Kossmann, M.C.; Laurer, H.L.; McIntosh, T.K. The Duality of the Inflammatory Response to Traumatic Brain Injury. Mol. Neurobiol. 2001, 24, 169–181. [Google Scholar] [CrossRef] [PubMed]
- Tominaga, K.; Suzuki, H.I. TGF-β Signaling in Cellular Senescence and Aging-Related Pathology. Int. J. Mol. Sci. 2019, 20, 5002. [Google Scholar] [CrossRef] [PubMed]
- Sanchez-Molina, P.; Almolda, B.; Giménez-Llort, L.; González, B.; Castellano, B. Chronic Il-10 Overproduction Disrupts Microglia-Neuron Dialogue Similar to Aging, Resulting in Impaired Hippocampal Neurogenesis and Spatial Memory. Brain Behav. Immun. 2022, 101, 231–245. [Google Scholar] [CrossRef] [PubMed]
- Guo, S.; Wang, H.; Yin, Y. Microglia Polarization from M1 to M2 in Neurodegenerative Diseases. Front. Aging Neurosci. 2022, 14, 815347. [Google Scholar] [CrossRef]
- Das, B.; Singh, N.; Yao, A.Y.; Zhou, J.; He, W.; Hu, X.; Yan, R. BACE1 controls synaptic function through modulating release of synaptic vesicles. Mol. Psychiatry 2021, 26, 6394–6410. [Google Scholar] [CrossRef]
- Jack, C.R., Jr.; Bennett, D.A.; Blennow, K.; Carrillo, M.C.; Dunn, B.; Haeberlein, S.B.; Holtzman, D.M.; Jagust, W.; Jessen, F.; Karlawish, J.; et al. Nia-Aa Research Framework: Toward a Biological Definition of Alzheimer’s Disease. Alzheimer’s Dement. 2018, 14, 535–562. [Google Scholar] [CrossRef]
- Hernandez-Segura, A.; de Jong, T.V.; Melov, S.; Guryev, V.; Campisi, J.; Demaria, M. Unmasking Transcriptional Hetero-geneity in Senescent Cells. Curr. Biol. 2017, 27, 2652–2660. [Google Scholar] [CrossRef]
- Huang, W.; Hickson, L.J.; Eirin, A.; Kirkland, J.L.; Lerman, L.O. Cellular Senescence: The Good, the Bad and the Unknown. Nat. Rev. Nephrol. 2022, 18, 611–627. [Google Scholar] [CrossRef]
- Rayess, H.; Wang, M.B.; Srivatsan, E.S. Cellular senescence and tumor suppressor gene p16. Int. J. Cancer 2012, 130, 1715–1725. [Google Scholar] [CrossRef]
- Lee, B.Y.; Han, J.A.; Im, J.S.; Morrone, A.; Johung, K.; Goodwin, E.C.; Kleijer, W.J.; DiMaio, D.; Hwang, E.S. Senescence-Associated Beta-Galactosidase Is Lysosomal Beta-Galactosidase. Aging Cell 2006, 5, 187–195. [Google Scholar] [CrossRef] [PubMed]
- Yabluchanskiy, A.; Ma, Y.; Iyer, R.P.; Hall, M.E.; Lindsey, M.L. Matrix Metalloproteinase-9: Many Shades of Function in Cardiovascular Disease. Physiology 2013, 28, 391–403. [Google Scholar] [CrossRef]
- Fang, L.; Du, X.-J.; Gao, X.-M.; Dart, A.M. Activation of peripheral blood mononuclear cells and extracellular matrix and inflammatory gene profile in acute myocardial infarction. Clin. Sci. 2010, 119, 175–183. [Google Scholar] [CrossRef]
- Ndubuizu, O.I.; Chavez, J.C.; LaManna, J.C. Increased Prolyl 4-Hydroxylase Expression and Differential Regulation of Hy-poxia-Inducible Factors in the Aged Rat Brain. Am. J. Physiol. Regul. Integr. Comp. Physiol. 2009, 297, R158–R165. [Google Scholar] [CrossRef] [PubMed]
- Dzhalilova, D.; Kosyreva, A.; Vishnyakova, P.; Zolotova, N.; Tsvetkov, I.; Mkhitarov, V.; Mikhailova, L.; Kakturskiy, L.; Makarova, O. Age-related differences in hypoxia-associated genes and cytokine profile in male Wistar rats. Heliyon 2021, 7, e08085. [Google Scholar] [CrossRef] [PubMed]
- Dowery, R.; Benhamou, D.; Benchetrit, E.; Harel, O.; Nevelsky, A.; Zisman-Rozen, S.; Braun-Moscovici, Y.; Balbir-Gurman, A.; Avivi, I.; Shechter, A.; et al. Peripheral B Cells Repress B-Cell Regeneration in Aging through a Tnf-A/Igfbp-1/Igf-1 Immune-Endocrine Axis. Blood 2021, 138, 1817–1829. [Google Scholar] [CrossRef]
- Snodgrass, R.G.; Jiang, X.; Stephensen, C.B. Monocyte subsets display age-dependent alterations at fasting and undergo non-age-dependent changes following consumption of a meal. Immun. Ageing 2022, 19, 41. [Google Scholar] [CrossRef]
- Liu, Y.Q.; Xin, T.R.; Liang, J.J.; Wang, W.M.; Zhang, Y.Y. Memory Performance, Brain Excitatory Amino Acid and Acetyl-cholinesterase Activity of Chronically Aluminum Exposed Mice in Response to Soy Isoflavones Treatment. Phytother. Res. 2010, 24, 1451–1456. [Google Scholar] [CrossRef]
- Gupta, G.; Chellappan, D.K.; Agarwal, M.; Ashwathanarayana, M.; Nammi, S.; Pabreja, K.; Dua, K. Pharmacological Evaluation of the Recuperative Effect of Morusin against Aluminium Trichloride (Alcl3)-Induced Memory Impairment in Rats. Cent. Nerv. Syst. Agents Med. Chem. 2017, 17, 196–200. [Google Scholar] [CrossRef]
- Lana, D.; Ugolini, F.; Giovannini, M.G. An Overview on the Differential Interplay among Neurons–Astrocytes–Microglia in CA1 and CA3 Hippocampus in Hypoxia/Ischemia. Front. Cell. Neurosci. 2020, 14, 585833. [Google Scholar] [CrossRef]
- Mizuseki, K.; Royer, S.; Diba, K.; Buzsáki, G. Activity dynamics and behavioral correlates of CA3 and CA1 hippocampal pyramidal neurons. Hippocampus 2012, 22, 1659–1680. [Google Scholar] [CrossRef] [PubMed]
- Padurariu, M.; Ciobica, A.; Mavroudis, I.; Fotiou, D.; Baloyannis, S. Hippocampal Neuronal Loss in the CA1 and CA3 Areas of Alzheimer’s Disease Patients. Psychiatr Danub. 2012, 24, 152–158. [Google Scholar] [PubMed]
- Nafea, M.; Elharoun, M.; Abd-Alhaseeb, M.M.; Helmy, M.W. Leflunomide Abrogates Neuroinflammatory Changes in a Rat Model of Alzheimer’s Disease: The Role of Tnf-A/Nf-Κb/Il-1β Axis Inhibition. Naunyn Schmiedeberg’s Arch. Pharmacol. 2023, 396, 485–498. [Google Scholar] [CrossRef]
- Lahiri, D.K.; Chen, D.; Vivien, D.; Ge, Y.W.; Greig, N.H.; Rogers, J.T. Role of Cytokines in the Gene Expression of Amyloid Beta-Protein Precursor: Identification of a 5′-Utr-Binding Nuclear Factor and Its Implications in Alzheimer’s Disease. J. Alzheimer’s Dis. 2003, 5, 81–90. [Google Scholar] [CrossRef] [PubMed]
- She, Y.; Wang, N.; Chen, C.; Zhu, Y.; Xia, S.; Hu, C.; Li, Y. Effects of Aluminum on Immune Functions of Cultured Splenic T and B Lymphocytes in Rats. Biol. Trace Elem. Res. 2011, 147, 246–250. [Google Scholar] [CrossRef] [PubMed]
Disclaimer/Publisher’s Note: The statements, opinions and data contained in all publications are solely those of the individual author(s) and contributor(s) and not of MDPI and/or the editor(s). MDPI and/or the editor(s) disclaim responsibility for any injury to people or property resulting from any ideas, methods, instructions or products referred to in the content. |
© 2023 by the authors. Licensee MDPI, Basel, Switzerland. This article is an open access article distributed under the terms and conditions of the Creative Commons Attribution (CC BY) license (https://creativecommons.org/licenses/by/4.0/).