Abstract
The detection of ammonia is an important issue for a lot of applications: leak detection in industry, agriculture, cooling systems, and medical diagnosis (breath biomarker for non-invasive diagnostic of renal disease). Among the possible sensing technologies, chemosensors based on conducting polymers show interesting characteristics. Polypyrrole (PPy) is well known for its sensitivity to ammonia. In the present work, PPy was synthesized by vapor phase polymerization (VPP) and treated with three different reductants. The ammonia sensing performance was investigated. The response of sodium sulfite Na2SO3 treated PPy was found to be much more pronounced when exposed to ammonia, it was twice as high as the grown PPy. A response of 15% at 500 ppb was obtained with an excellent selectivity towards ammonia compared to ethanol, acetone, and isopropanol. The role of chemical reduction of PPy in ammonia gas sensing was studied using different methods such as Fourier-transform infrared (FTIR) spectroscopy, scanning electron microscopy (SEM) and ultra-violet, visible, near-infrared (UV–Vis–NIR) spectroscopy.
1. Introduction
Nowadays, sensor-based technology is witnessing a major and exciting development. Besides the classical applications in leak detection, development in artificial intelligence paves the road for emerging applications such as electronic noses for health applications [1,2,3,4,5,6,7]. These electronic noses are used to detect relevant volatile biomarkers present in the breath. Each disease is associated with a specific volatile organic compounds’ composition in the breath, known as the breathprint. Consequently, its analysis allows for noninvasive diagnosis and improves telemedicine in general [1,2,3,4,5,6,7]. Ammonia is one of the inorganic volatile compounds in the human breath and is known to be a relevant biomarker for early detection of renal disease and asthma. About 0.15 to 1.8 ppm ammonia is exhaled by a normal healthy person while patients with extreme renal disorders or ulcers exhale above 0.8 ppm to 14 ppm [8,9,10,11].
Among the possible sensor technologies, semiconductor gas sensors offer interesting characteristics that make them very suitable for the integration in electronic noses: high sensitivity, simple signal, small size.
The sensor consists of an insulating substrate fitted with a pair of interdigitated electrodes covered with a sensitive layer made of a sensitive semiconductor that can interact with the target gas. The gas adsorbing on the surface can exchange electrons with the semiconductor if the interaction is strong enough. This exchange leads to a reversible surface doping modifying the charge carrier concentration in the semiconductor and, as a consequence, its conductivity. Thanks to the adsorption equilibria, the sensitive layer conductivity is a function of the gas concentration to be detected [8,9,10,11,12,13,14,15].
Most available sensors are based on metal oxide semiconductors that operate at high temperatures, above 150 °C. This is because the surface reactions need to be activated and are slow at room temperature. It requires then a complex technology for sensor design (need for a high temperature resisting substrate and an integrated heater), temperature regulation and additional power consumption that currently slows down the development of such state-of-the-art devices [12,13,14,15]. Conductive polymer-based sensors represent in that framework a valuable alternative to metal oxide sensors in volatile biomarkers sensing. These conductive polymer-based sensors operate at room temperature which simplifies integration (high-temperature resisting materials for substrate not mandatory, no heater), decreases the power consumption and reduces the fabrication cost. Moreover, their excellent flexibility and easy formability made them more versatile widening the scope of application to flexible technology [8,9,10,16,17,18,19,20,21].
Polypyrrole (PPy) has been widely and successfully used in the literature as an ammonia and volatile organic compounds (VOC) sensing material [8,9,10,18,19,20,21,22,23,24,25,26,27,28,29]. For instance, Kwon et al. prepared PPy nanoparticles by chemical oxidation polymerization. These nanoparticles were deposited by spin-coating on gold interdigitated electrodes. The chemiresistive sensor obtained was able to detect 5 ppm of ammonia in less than 1 s [19]. Piraux et al. developed a sensor made of a PPy nanotube network using a porous polycarbonate template during the electropolymerization [20]. Their sensor was able to detect 1 ppm of ammonia. PPy has also been associated with graphene and carbon nanotubes [8,24,25,26] to improve ammonia adsorption or with metal oxide semiconductors such as ZnO, TiO2 or SnO2 to enhance the response [26,27,28]. All these attempts focus on the lack of sensitivity in the responses of PPy based sensors compared to metal oxide-based ones. A major challenge is to increase its response to ammonia. In brief, the response of PPy to ammonia is explained as follows: PPy is a p-type semiconductor and upon reaction with electron-donating ammonia, PPy is reduced leading to a decrease in the hole concentration and in turn to an increase of its resistivity [29,30,31]. Mostly, PPy is synthesized by oxidation methods leading to a quite conductive polymer. If the polymer is very conductive, the effect of the gases is weak as the number of charges “withdrawn” by the adsorbed gas can be negligible in comparison with the total amount of charges. This leads to a weak change in conductivity. On the other hand, if no holes are present in PPy, no interaction with ammonia takes place and no response can be observed. That is why a trade-off has to be found. The relationship between oxidation level and conductivity was recently reported by Crispin et al. They highlighted that the conductivity versus oxidation level has an S-shaped feature for poly(3,4-ethylenedioxythiophene) (PEDOT) [32]. The same characteristic was also reported by dedoped PPy by Andreeva et al. [33]. Therefore, a similar dedoping provoked by ammonia would lead to different electric conductivity variations depending on the oxidation level of the polymer prior to exposure to ammonia. Controlling the oxidation level of the polymer prior to exposition to ammonia may be a route to enhance PPy response.
Several technics have been used to synthesize PPy, wet chemical oxidative methods [18,19,23,25], electrochemical polymerization [8,9,20,24,31] and vapor phase polymerization (VPP) [21,34,35,36]. VPP is a simple and effective solvent-free process that allows the formation of high-quality polymer chains on insulating substrates. Its compatibility with large scale manufacturing makes it an attractive choice for industry [21,34,35,36].
In this study, we investigate an innovative method to increase PPy response by tuning the doping level of PPy by chemical reduction of the polymer. We doubled the sensing performance of the PPy sensor. A low-cost method for PPy synthesis, VPP, was used. We then controlled PPy doping by chemical reduction of the polymer. The polymer dedoping was followed in situ by UV–Vis–NIR spectroscopy. Sensing tests with ammonia were performed.
2. Materials and Methods
The oxidant solution CLEVIOS C-B 54 V2, 52.5% iron tosylate dispersed in n-butanol was purchased from Heraeus (Germany). Triblock copolymer poly(ethylene glycol-propylene glycol-ethylene glycol) or PEG-PPG-PEG (Mw = 5800 g/mol) was purchased from Sigma Aldrich Belgium. Pyrrole, sodium thiosulfate pentahydrate Na2S2O3 (5H2O), sodium sulfite Na2SO3 and sodium borohydride NaBH4 were purchased from VWR Belgium. All chemicals were used as received.
2.1. Polypyrrole Synthesis and Reduction
In a typical experiment, oxidant solution consisting of iron tosylate CB52 (12.3 wt%) and PEG-PPG-PEG (23 wt%) in ethanol was spin-coated on the substrate at 1500 rpm. The as-spun films were baked for 30 s at 70 °C. VPP was performed under vacuum in a desiccator. Pyrrole was deposited onto glass substrates at the bottom of the desiccator to ensure pyrrole vaporization. After 5 min, the samples were removed from the desiccator and baked on a hotplate for 2 min at 70 °C. The formed PPy film was washed with ethanol and demineralized water to eliminate unreacted species followed by drying with nitrogen [34,35,36].
Reduction of PPy film was achieved by treating PPy film with Na2S2O3 (5H2O), Na2SO3 and NaBH4. Each reductant (10 wt%) was dissolved in demineralized water. The reduction of the PPy films was achieved by pouring 500 µL of the reducing solution on PPy film for 10 min. The PPy film was then washed in demineralized water and dried in vacuum overnight [37].
2.2. Material Characterization
PPy was coated on a silicon substrate and FTIR was recorded in transmission mode using a Perkin Elmer Spectrum 2000.
PPy reduction was monitored in situ by UV–Vis–NIR absorption with a Perkin Elmer Lambda 19 Spectrometer. PPy coated on a glass substrate was introduced into the reducing solution then 3 spectra were monitored after 1, 5 and 10 min of treatment.
The morphology of the films was observed by field emission scanning electron microscopy (FE-SEM, Hitachi SU8020).
2.3. Preparation of Gas Sensors and Sensing Test
The substrates of sensors were made of alumina coated with interdigitated gold electrodes (C-MAC Micro Technology Company, Ronse, Belgium). These electrodes were screen printed on the alumina substrates and they had a separation of 250 µm. The substrate was washed with isopropanol and pyrrole was directly vapor polymerized on the alumina substrates according to the method explained above. The PPy film was then washed in demineralized water and dried in vacuum overnight.
The gas sensing set up consisted of a bottle of air and a bottle of 100 ppm ammonia diluted in air (Figure 1). The gas flow was kept at 1000 sccm by three mass flow controllers (El-flow, Bronkhorst, Netherlands). The humidity of the sensing test was adjusted by using two different flowmeters. One of them was used for the control of dry air while another one was for the air with 100% humidity. The VOCs were generated by dissolving a certain amount of VOC liquid into DI water according to Henry’s law. The bubbler was put in a water bath to maintain the temperature at 25 °C.
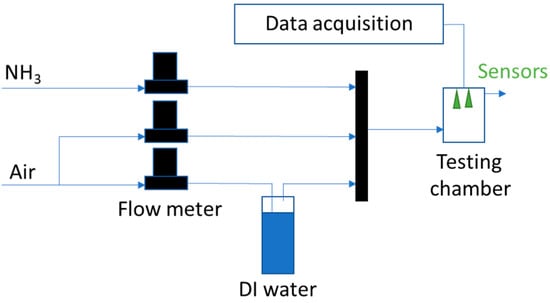
Figure 1.
Schematic of the gas sensing system.
The testing chamber was made from a cylindric PTFE cell with a volume of 184 cm3. Resistances of the sensors were then measured with a Keysight 7200 Digital Multimeter.
The response of the sensors S was defined as S = (Rg − Ra)/Ra × 100 where Rg and Ra represent the electrical resistances of sensors in the presence of target gas and synthetic air, respectively.
3. Results
3.1. Characterization
FTIR investigations were carried out to confirm the polymerization of the monomer after the synthesis process. PPy film coated on a silicon substrate was analyzed in transmission mode in the range of 4000–400 cm−1 (Figure 2). The spectrum of the bare silicon substrate displays only an absorption at 1100 cm−1, it is almost transparent in the range of the analysis. Typical peaks of PPy can be observed from the FTIR spectrum. The peak at 2928 cm−1 can be assigned to the C-H stretching of the pyrrole ring. We can also observe the C=C stretching at 1550 cm−1, whereas peaks at 1375 and 1175 represent C-H and C-N plane deformation confirming the formation of PPy [30,38,39].
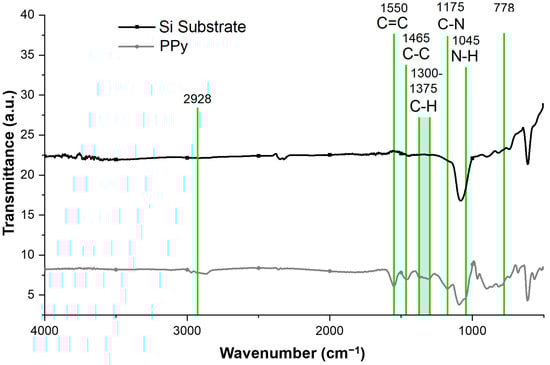
Figure 2.
As grown vapor phase polymerized (VPP) Polypyrrole (PPy) FTIR spectra recorded in transmission mode and FTIR spectra of the silicon substrate reference.
SEM characterization mainly shows that the VPP PPy film is quite smooth and dense. Which is what is generally observed in PEG-PPG-PEG based VPP [34,35,36] (Figure 3).
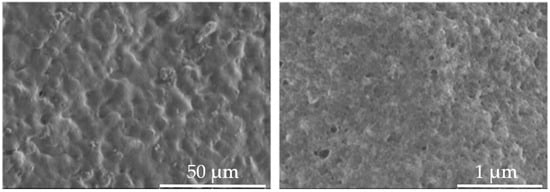
Figure 3.
SEM photo of PPy synthesized from VPP.
In situ monitoring of the optical absorption was performed during the reduction of the PPy film. UV–Vis–NIR absorption spectra were acquired in the spectral range 350–1200 nm on PPy coated under the same conditions on glass. The samples were introduced in reducing solutions, Na2S2O3 (5H2O), Na2SO3 and NaBH4. A 10 wt% solution was prepared in demineralized water then three spectra were monitored after 1, 5 and 10 min of treatment.
It can be noticed in the picture of Figure 4 that after treatment with NaBH4, PPy film undergoes a color change from brown to yellow.
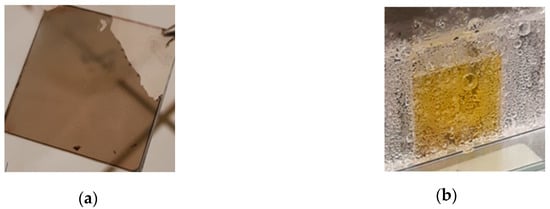
Figure 4.
Photos of PPy: (a) after VPP synthesis and (b) after 10 min of NaBH4 reduction treatment.
Figure 5 displays the UV–Vis–NIR spectra after 10 min of treatment. The normalized absorption spectra of the as grown PPy exhibit a broad absorption band in the NIR and a weaker absorption around 431 nm. The intensity of the NIR absorption decreases dramatically with the strength of the reductant and vanishes completely when PPy is treated with NaBH4. In Table 1, the redox potential of the different reducing agent used is presented.
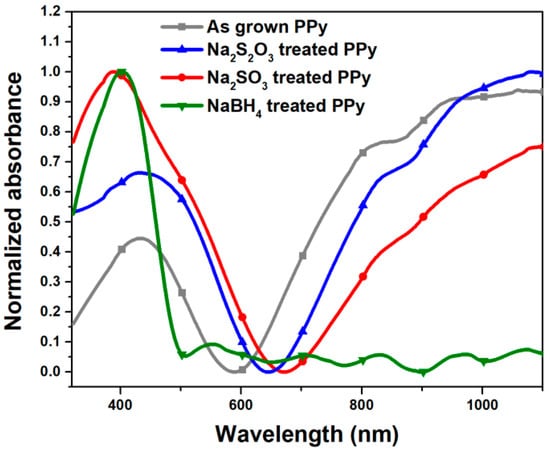
Figure 5.
UV–Vis–NIR spectra of PPy grown by VPP on a glass substrate. Measurements were run during reduction treatments in Na2S2O3, Na2SO3 and NaBH4 10 wt% solution in demineralized water.

Table 1.
Redox potential of Na2S2O3, Na2SO3 and NaBH4 vs. a standard hydrogen electrode (SHE).
On the other hand, the intensity of the absorption peak at 431 nm increases when PPy is treated with Na2S2O3. Na2SO3 treated PPy spectrum displays a broader peak in that region as if there were two contributions one at 388 nm and a shoulder around 473 nm. NaBH4 treated PPy spectra shows a single peak at 388 nm.
Brédas et al. described the band transition that may occur during PPy dedoping [40] according to their early study in the band theory of conductive polymers. They identified different electron transitions, the strong peak at 387 nm (3.2 eV) is assigned to electron transition from the HOMO to the LUMO of the neutral polymer. Additional transition within the bandgap between energetic levels of polaron/bipolaron would be observed at 473 nm (2.6 eV) and is characteristic of electron transitions from the valence band to the antibonding polaron/bipolaron level. The absorption at 884 nm (1.4 eV) is due to an electron transition from bonding to the antibonding polaron/bipolaron state [41,42].
After synthesis, the main optical transition expected is from the bipolaronic band. The bipolaronic band can be seen in the absorption at 884 nm and the near infra-red background absorption. A reduction attempt with Na2S2O3 is not very significant, bipolaronic absorption background is still dominant. While upon PPy reduction with Na2SO3 and NaBH4, significant absorption and color change can be noticed. After the reduction treatment, polaronic and neutral PPy segments increase, consequently contributing to the absorption at 473 nm and 388 nm, which increases. While NIR background is still present with a decrease in the intensity in Na2SO3 treated PPy. In NaBH4 treated PPy, it is eliminated as if bipolarons are inexistent, NaBH4 treated PPy reaches a neutral state. In Na2SO3 treated PPy, bipolarons chains are in minority.
After the reducing treatment of PPy, samples were washed in demineralized water followed by drying with nitrogen. These samples were then analyzed by UV–Vis–NIR Spectroscopy. The same reduction protocol was also performed on PPy coated on a silicon substrate and analyzed by FTIR spectroscopy after the washing step.
A surprising change in absorption spectra can be observed in Figure 6. In Na2SO3, the NIR absorption has increased while polaronic and neutral absorption have decreased. In the case of the spectrum of NaBH4 reduced PPy from the completely absent NIR absorption, a broad and strong IR background absorption is detected. From the FTIR analysis (Figure 7) we can observe that after the washing step, in the Na2S2O3 treated PPy sample, no chemical change occurs. The latter has the same FTIR spectra than the as synthesized PPy. In Na2SO3 treated PPy spectra a slight absorption at 3400 cm−1 assigned to O-H vibration was detected. In NaBH4 treated PPy, strong and broad O-H vibrations are accompanied with C=O around 1600 cm−1 and N=C=O vibration at 2270 cm−1 [30,38]. Thus, reduced PPy may be further oxidized by oxygen molecules present in the air after reduction. PPy was partially destroyed. While this process is negligible in the Na2SO3 treated PPy sample, NaBH4 treated PPy sample is strongly affected.
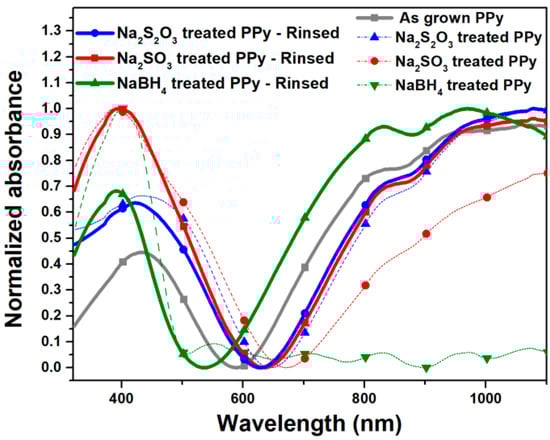
Figure 6.
UV–Vis–NIR spectra of PPy grown by VPP on glass substrate. Measurements were performed after reduction treatments in Na2S2O3, Na2SO3 and NaBH4 10 wt% solution in demineralized water followed by rinsing in demineralized water.
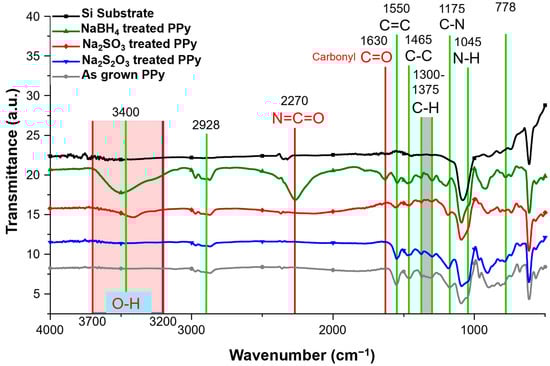
Figure 7.
FTIR spectra of silicon reference substrate and PPy grown by VPP on a silicon substrate; measurements on PPy samples were performed after reduction treatments in Na2S2O3, Na2SO3 and NaBH4 10 wt% solution in demineralized water followed by rinsing in demineralized water.
3.2. Gas Sensing Properties
3.2.1. Comparison of the Reduction Treatments
PPy VPP was performed directly on the gold interdigitated alumina substrate to fabricate sensors. The PPy based sensors were treated with aqueous solutions of the three reducing agents. To study the effect of the dedoping treatment on sensing performance, sensors were exposed to 10, 30 and 50 ppm ammonia gas diluted in air with 50% of humidity. In Figure 8a and Table 2, the evolution of the electrical resistance is presented. Except for the sample treated with NaBH4, all treated PPy sensors have a stable baseline. The unstable baseline of NaBH4 reduced PPy is to be linked with the degradation of the neutral polymer after the rinsing step. According to Table 2, the electric resistance of the sensor follows the reduction strength of the salt used during the treatment. The as grown PPy and Na2S2O3 reduced PPy have almost the same resistance baseline, 12 kOhm and 15 kOhm respectively. Na2S2O3 is too weak to provoke an oxidation level change. The Na2SO3 treated PPy has its baseline at 400 kOhm and the NaBH4 reduced PPy starts at 1.4 MOhm and is not stable. The resistances of all four sensors increase when exposed to ammonia. It is known that ammonia reversibly reduces PPy. Therefore, its electrical resistance increases [29,30,31].
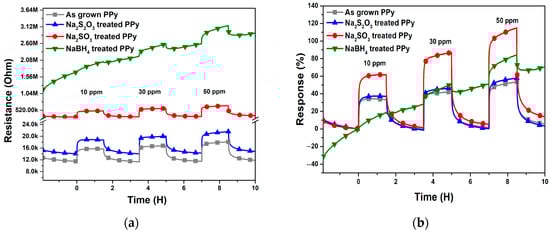
Figure 8.
Ammonia sensing test: (a) electric resistance changes and (b) response of the as grown PPy sensor and PPy sensors after reduction treatments in Na2S2O3, Na2SO3 and NaBH4 10 wt% solution in demineralized water.
Table 2.
Electrical resistances of PPy based sensors and reduced PPy based sensors.
The calculated response is depicted in Figure 8b. The as-grown PPy and Na2S2O3 reduced PPy have almost similar responses towards NH3 exposure. At 50 ppm of NH3, the response of sensors reaches 50%. Whereas Na2SO3 treated PPy displays the best response of 110% for 50 ppm of NH3.
To understand why Na2SO3 treated PPy has the best response, two points must be highlighted. NH3 when reacting with PPy decreases the oxidation level of the polymer and, the conductivity of PPy versus oxidation rate displays an S-shaped feature [33] as depicted in Figure 9.
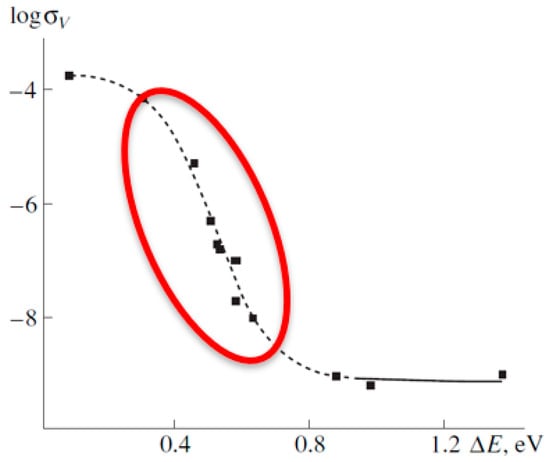
Figure 9.
Conductivity as a function of energy corresponding to the position of the total absorption edge. Reprinted with permission from Springer Nature [33] Copyright 2006.
Therefore, a at high oxidation rate, which corresponds to as grown PPy or the Na2S2O3 reduced PPy state (top left of the curve in Figure 9), ammonia dedoping induces a lower variation in the conductivity i.e., a lower response. A similar result is to be expected at a lower oxidation rate which is the case of NaBH4 reduced PPy (bottom right the curve in Figure 9). At mild oxidation, the case of Na2SO3 treated PPy, around the inflection point, lower ammonia dedoping produces higher variation in the conductivity.
3.2.2. Response to Ammonia of the Na2SO3 Treated PPy
Na2SO3 treated PPy was selected and calibrated from 500 ppb to 50 ppm. Two sensors made from reduced PPy were compared with the as-grown PPy (Figure 10).
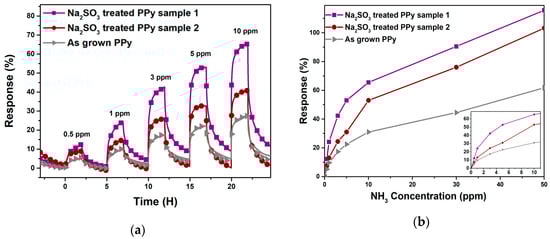
Figure 10.
Ammonia sensing test: (a) Response and (b) calibration curve of as grown PPy sensor and PPy sensors after reduction treatments in Na2SO3 10 wt% solution in demineralized water.
According to Figure 10a, reduced PPy samples have an improved sensing performance than the as grown PPy. The best response to ammonia gas at 500 ppb is 15% and at 50 ppm it is 110% for the reduced PPy based sensor: more than the double of the as grown PPy response. The high response time defined as the time when the response reaches 90% of the maximum (17 min) is related to the morphology of the PPy film. The kinetics are limited by ammonia diffusion. In Figure 10b, the calibration curve, i.e., response vs. concentration is presented. The response is not linear and the slope at lower concentration is very high, giving some room for improvement of the response of the sensor at a very low concentration of NH3. With a response of 15% at 500 ppb, the reduced PPy based sensor may be considered in exhaled breath analysis to detect renal cancer.
As in breath analysis humidity and other interfering gases may play a major role, selectivity and humidity tests were performed to further investigate the sensing performance of Na2SO3 reduced PPy.
Humidity was varied from 20% to 80% (Figure 11). Changes in electric resistance are relatively small for all sensors. To compare the sensor resistance variations with the sensor resistance at 50% relative humidity (Ra − Ra50)/Ra50 were plotted (Figure 11b) where Ra corresponds to the electric resistance measured at a given relative humidity, Ra50 is the electric resistance at the relative humidity of 50%. We can see from Figure 11b that for all sensors, changes in resistance compared to resistance at a relative humidity of 50% are within −5% and +10%. The effect of humidity variation on reduced PPy sensors is relatively small.
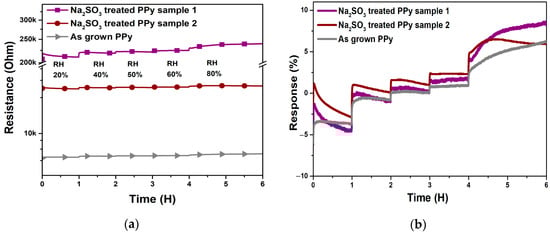
Figure 11.
Humidity test: (a) electric resistance changes and (b) relative response of as grown PPy sensor and PPy sensors after reduction treatments in Na2SO3 10 wt% solution in demineralized water with respect to electric resistance at 50% humidity.
The performance of our sensor has been compared with those of other sensors cited in the literature (Table 3). We can notice that the sensor developed here shows a good response to NH3.
Table 3.
Comparison of performance of various ammonia gas sensors based on PPy materials operating at room temperature.
Selectivity was studied using acetone, ethanol, and isopropanol gas as interferents reported to be also present in exhaled breath [3,51,52]. Figure 12 demonstrates high selectivity toward the tested gas. The response to ammonia exceeds by far that of the other gases.
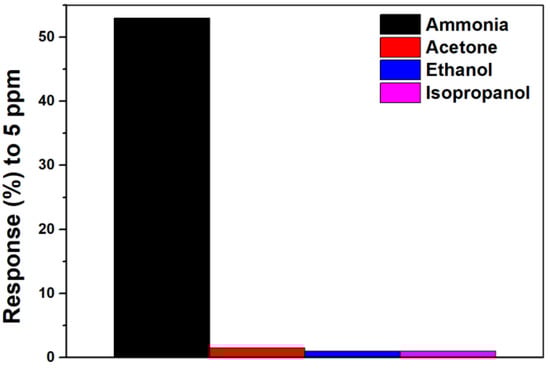
Figure 12.
Selectivity test: Response of PPy sensors after reduction treatments in Na2SO3 10 wt% solution in demineralized water to 5 ppm ammonia, acetone, ethanol, and isopropanol.
4. Conclusions
In this study, PPy synthesized by VPP was successfully used in the fabrication of sensors for ammonia. To increase the response, those PPy films were treated with various reducing agents to dedope them. Prior to exposure to ammonia, in situ UV–Vis–NIR spectroscopy and FTIR analysis were performed to follow the dedoping mechanism. They highlighted that Na2SO3 was the most efficient reducing agent and the gas sensing tests showed that, the response of the sensor could be improved after dedoping with Na2SO3. A response of 15% at 500 ppb of ammonia was obtained. This result is promising considering the requirements for exhaled breath analysis in the detection of renal disorder.
Author Contributions
Conceptualization, A.L., M.D. and D.L.; methodology, A.L., G.C., M.D. and D.L.; validation, M.D., M.-G.O. and D.L.; formal analysis, A.L., G.C. and Y.L.; investigation, A.L., G.C., Y.L., M.D. and D.L.; writing—original draft preparation, A.L. and D.L.; writing—review and Editing, A.L., G.C., Y.L., M.-G.O., M.D. and D.L. All authors have read and agreed to the published version of the manuscript.
Funding
This research received no external funding.
Acknowledgments
The authors wish to thank the European Regional Development Fund (ERDF) and the Walloon Region of Belgium for their financial support through the Interreg V France-Wallonie-Vlaanderen program, under PATHACOV project and the Micro+ project co-funded by the European Regional Development Fund (ERDF) and Wallonia, Belgium (No. 675781-642409).
Conflicts of Interest
The authors declare no conflict of interest.
References
- Peng, G.; Tisch, U.; Adams, O.; Hakim, M.; Shehada, N.; Broza, Y.Y.; Billan, S.; Abdah-Bortnyak, R.; Kuten, A.; Haick, H. Diagnosing lung cancer in exhaled breath using gold nanoparticles. Nat. Nanotechnol. 2009, 4, 669–673. [Google Scholar] [CrossRef] [PubMed]
- Li, W.; Liu, H.; Xie, D.; He, Z.; Pi, X. Lung Cancer Screening Based on Type-different Sensor Arrays. Sci. Rep. 2017, 7, 1969. [Google Scholar] [CrossRef]
- Nakhleh, M.K.; Amal, H.; Jeries, R.; Broza, Y.Y.; Aboud, M.; Gharra, A.; Ivgi, H.; Khatib, S.; Badarneh, S.; Har-Shai, L.; et al. Diagnosis and Classification of 17 Diseases from 1404 Subjects via Pattern Analysis of Exhaled Molecules. ACS Nano 2017, 11, 112–125. [Google Scholar] [CrossRef] [PubMed]
- Tai, H.; Wang, S.; Duan, Z.; Jiang, Y. Evolution of breath analysis based on humidity and gas sensors: Potential and challenges. Sens. Actuators B Chem. 2020, 318, 128104. [Google Scholar] [CrossRef]
- Sachan, A.; Castro, M.; Choudhary, V.; Feller, J.-F. Influence of Water Molecules on the Detection of Volatile Organic Compounds (VOC) Cancer Biomarkers by Nanocomposite Quantum Resistive Vapor Sensors vQRS. Chemosensors 2018, 6, 64. [Google Scholar] [CrossRef]
- Di Natale, C.; Macagnano, A.; Martinelli, E.; Paolesse, R.; D’Arcangelo, G.; Roscioni, C.; Finazzi-Agro, A.; D’Amico, A. Lung cancer identification by the analysis of breath by means of an array of non-selective gas sensors. Biosens. Bioelectron. 2003, 18, 1209–1218. [Google Scholar] [CrossRef]
- Machado, R.F.; Laskowski, D.; Deffenderfer, O.; Burch, T.; Zheng, S.; Mazzone, P.J.; Mekhail, T.; Jennings, C.; Stoller, J.K.; Pyle, J.; et al. Detection of Lung Cancer by Sensor Array Analyses of Exhaled Breath. Am. J. Respir. Crit. Care Med. 2005, 171, 1286–1291. [Google Scholar] [CrossRef]
- Tang, X.; Raskin, J.-P.; Kryvutsa, N.; Hermans, S.; Slobodian, O.; Nazarov, A.N.; Debliquy, M. An ammonia sensor composed of PPy synthesized on reduced graphene oxide by electropolymerization. Sens. Actuators B Chem. 2020, 305, 127423. [Google Scholar] [CrossRef]
- Chartuprayoon, N.; Hangarter, C.M.; Rheem, Y.; Jung, H.; Myung, N.V. Wafer-scale fabrication of single PPy nanoribbon-based ammonia sensor. J. Phys. Chem. C 2010, 114, 11103–11108. [Google Scholar] [CrossRef]
- Dai, M.Z.; Lin, Y.L.; Lin, H.C.; Zan, H.W.; Chang, K.T.; Meng, H.F.; Liao, J.W.; Tsai, M.J.; Cheng, H. Highly sensitive ammonia sensor with organic vertical nanojunctions for noninvasive detection of hepatic injury. Anal. Chem. 2013, 85, 3110–3117. [Google Scholar] [CrossRef]
- Güntner, A.T.; Righettoni, M.; Pratsinis, S.E. Selective sensing of NH3 by Si-doped α-MoO3 for breath analysis. Sens. Actuators B Chem. 2016, 223, 266–273. [Google Scholar] [CrossRef]
- Fomekong, R.L.; Kamta, H.M.T.; Lambi, J.N.; Lahem, D.; Eloy, P.; Debliquy, M.; Delcorte, A. A sub-ppm level formaldehyde gas sensor based on Zn-doped NiO prepared by a co-precipitation route. J. Alloys Compd. 2018, 731, 1188–1196. [Google Scholar] [CrossRef]
- Luo, Y.; Zhang, C.; Zheng, B.; Geng, X.; Debliquy, M. Hydrogen sensors based on noble metal doped metal-oxide semiconductor: A review. Int. J. Hydrog. Energy 2017, 42, 20386–20397. [Google Scholar] [CrossRef]
- Fomekong, R.L.; Lahem, D.; Debliquy, M.; Yunus, S.; Ngolui, J.L.; Delcorte, A. Ni0.9Zn0.1O/ZnO nanocomposite prepared by malonate coprecipitation route for gas sensing. Sens. Actuators B Chem 2016, 231, 520–528. [Google Scholar] [CrossRef]
- Boudiba, A.; Roussel, P.; Zhang, C.; Olivier, M.-G.; Snyders, R.; Debliquy, M. Sensing mechanism of hydrogen sensors based on palladium-loaded tungsten oxide (Pd–WO3). Sens. Actuators B Chem. 2013, 187, 84–93. [Google Scholar] [CrossRef]
- Yang, P.; Lv, D.; Shen, W.; Wu, T.; Yang, Y.; Zhao, Y.; Tan, R.; Song, W. Porous flexible polyaniline/polyvinylidene fluoride composite film for trace-level NH3 detection at room temperature. Mater. Lett. 2020, 271, 127798. [Google Scholar] [CrossRef]
- Zhang, Y.; Zhang, J.; Jiang, Y.; Duan, Z.; Liu, B.; Zhao, Q.; Wang, S.; Yuan, Z.; Tai, H. Ultrasensitive flexible NH3 gas sensor based on polyaniline/SrGe4O9 nanocomposite with ppt-level detection ability at room temperature. Sens. Actuators B Chem. 2020, 319, 128293. [Google Scholar] [CrossRef]
- Hwang, B.-Y.; Du, W.X.; Lee, H.-J.; Kang, S.; Takada, M.; Kim, J.-Y. Stretchable and High-performance Sensor films Based on Nanocomposite of Polypyrrole/SWCNT/Silver Nanowire. Nanomaterials 2020, 10, 696. [Google Scholar] [CrossRef]
- Kwon, O.S.; Hong, J.-Y.; Park, S.J.; Jang, Y.; Jang, J. Resistive Gas Sensors Based on Precisely Size-Controlled PPy Nanoparticles: Effects of Particle Size and Deposition Method. J. Phys. Chem. C 2010, 114, 18874–18879. [Google Scholar] [CrossRef]
- Piraux, L.; Antohe, V.-A.; Ferain, E.; Lahem, D. Self-supported three-dimensionally interconnected PPy nanotubes and nanowires for highly sensitive chemiresistive gas sensing. RSC Adv. 2016, 6, 21808–21813. [Google Scholar] [CrossRef]
- Majumdar, S.; Sarmah, K.; Mahanta, D. A Simple Route to Prepare PPy-Coated Filter Papers via Vapor Phase Polymerization and Their Gas Sensing Application. ACS Appl. Polym. Mater. 2020, 2, 1933–1942. [Google Scholar] [CrossRef]
- Kwon, O.S.; Park, S.J.; Yoon, H.; Jang, J. Highly sensitive and selective chemiresistive sensors based on multidimensional PPy nanotubes. Chem. Commun. 2012, 48, 10526–10528. [Google Scholar] [CrossRef] [PubMed]
- Joshi, A.; Gangal, S.A.; Gupta, S.K. Ammonia sensing properties of polypyrrole thin films at room temperature. Sens. Actuators B Chem. 2011, 156, 938–942. [Google Scholar] [CrossRef]
- Tang, X.; Lahem, D.; Raskin, J.-P.; Gérard, P.; Geng, X.; André, N.; Debliquy, M. A Fast and Room-Temperature Operation Ammonia Sensor Based on Compound of Graphene with PPy. IEEE Sens. J. 2018, 18, 9088–9096. [Google Scholar] [CrossRef]
- Yang, X.; Li, L.; Zhao, Y. Ag/AgCl-decorated PPy nanotubes and their sensory properties. Synth. Met. 2010, 160, 1822–1825. [Google Scholar] [CrossRef]
- Xiang, C.; Jiang, D.; Zou, Y.; Chu, H.; Qiu, S.; Zhang, H.; Fen, X.; Lixian, S.; Zheng, L. Ammonia sensor based on PPy–graphene nanocomposite decorated with titania nanoparticles. Ceram. Int. 2015, 41, 6432–6438. [Google Scholar] [CrossRef]
- Joulazadeh, M.; Navarchian, A.H. Ammonia detection of one-dimensional nano-structured PPy/metal oxide nanocomposites sensors. Synth. Met. 2015, 210, 404–411. [Google Scholar] [CrossRef]
- Tang, X.; Raskin, J.-P.; Lahem, D.; Krumpmann, A.; Decroly, A.; Debliquy, M. A Formaldehyde Sensor Based on Molecularly-Imprinted Polymer on a TiO2 Nanotube Array. Sensors 2017, 17, 675. [Google Scholar] [CrossRef]
- Zhang, L.; Meng, F.; Chen, Y.; Liu, J.; Sun, Y.; Luo, T.; Li, M.; Liu, J. A novel ammonia sensor based on high density, small diameter PPy nanowire arrays. Sens. Actuators B Chem. 2009, 142, 204–209. [Google Scholar] [CrossRef]
- Gustafsson, G.; Lundström, I.; Liedberg, B.; Wu, C.R.; Inganäs, O.; Wennerström, O. The interaction between ammonia and poly(pyrrole). Synth. Met. 1989, 31, 163–179. [Google Scholar] [CrossRef]
- Carquigny, S.; Sanchez, J.-B.; Berger, F.; Lakard, B.; Lallemand, F. Ammonia gas sensor based on electrosynthesized PPy films. Talanta 2009, 78, 199–206. [Google Scholar] [CrossRef] [PubMed]
- Bubnova, O.; Khan, Z.U.; Malti, A.; Braun, S.; Fahlman, M.; Berggren, M.; Crispin, X. Optimization of the thermoelectric figure of merit in the conducting polymer poly(3,4-ethylenedioxythiophene). Nat. Mater. 2011, 10, 429–433. [Google Scholar] [CrossRef]
- Andreeva, O.A.; Burkova, L.A.; Smirnov, M.A.; El, G.K. Correlation between IR Spectra and Electric Conductivity of Polyethylene—PPy Composites 1. Polym. Sci. Ser. B 2006, 48, 331–334. [Google Scholar] [CrossRef]
- Brooke, R.; Fabretto, M.; Hojati-Talemi, P.; Murphy, P.; Evans, D. Evidence for “bottom up” growth during vapor phase polymerization of conducting polymers. Polymer 2014, 55, 3458–3460. [Google Scholar] [CrossRef]
- Khan, Z.U.; Bubnova, O.; Jafari, M.J.; Brooke, R.; Liu, X.; Gabrielsson, R.; Ederth, T.; Evans, D.R.; Andreasen, J.W.; Fahlman, M.; et al. Acido-basic control of the thermoelectric properties of poly(3,4-ethylenedioxythiophene)tosylate (PEDOT-Tos) thin films. J. Mater. Chem. C 2015, 3, 10616–10623. [Google Scholar] [CrossRef] [PubMed]
- Edberg, J.; Iandolo, D.; Brooke, R.; Liu, X.; Musumeci, C.; Andreasen, J.W.; Simon, D.T.; Evans, D.; Engquist, I.; Berggren, M. Patterning and Conductivity Modulation of Conductive Polymers by UV Light Exposure. Adv. Funct. Mater. 2016, 26, 6950–6960. [Google Scholar] [CrossRef]
- Massonnet, N.; Carella, A.; Jaudouin, O.; Rannou, P. Improvement of the Seebeck coefficient of PEDOT: PSS by chemical reduction combined with a novel method for its transfer using free-standing. J. Mater. Chem. C 2014, 2, 1278–1283. [Google Scholar] [CrossRef]
- Tabačiarová, J.; Mičušík, M.; Fedorko, P.; Omastová, M. Study of PPy aging by XPS, FTIR and conductivity measurements. Polym. Degrad. Stab. 2015, 120, 392–401. [Google Scholar] [CrossRef]
- Chougule, M. Synthesis and Characterization of Polypyrrole (PPy) Thin Films. Soft Nanosci. Lett. 2011, 1, 6–10. [Google Scholar] [CrossRef]
- Brédas, J.L.; Scott, J.C.; Yakushi, K.; Street, G.B. Polarons and bipolarons in PPy: Evolution of the band structure and optical spectrum upon doping. Phys. Rev. B 1984, 30, 1023–1025. [Google Scholar] [CrossRef]
- Yakushi, K.; Lauchlan, L.J.; Clarke, T.C.; Street, G.B. Optical study of PPy perchlorate. J. Chem. Phys. 1983, 79, 4774–4778. [Google Scholar] [CrossRef]
- Kepas, A.; Grzeszczuk, M.; Kvarnstrom, C.; Lindfors, T.; Ivaska, A. UV-Vis and Raman Spectroelectrochemistry of Electrodeposited PPy in Hexafluorophosphate. Pol. J. Chem. 2007, 81, 2207. [Google Scholar]
- Hamouma, O.; Kaur, N.; Oukil, D.; Mahajan, A.; Chehimi, M.M. Paper strips coated with polypyrrole-wrapped carbon nanotube composites for chemi-resistive gas sensing. Synth. Met. 2019, 258, 116223. [Google Scholar] [CrossRef]
- Wang, C.; Lei, S.; Li, X.; Guo, S.; Cui, P.; Wei, X.; Liu, W.; Liu, H. A Reduced GO-Graphene Hybrid Gas Sensor for Ultra-Low Concentration Ammonia Detection. Sensors 2018, 18, 3147. [Google Scholar] [CrossRef]
- Patois, T.; Sanchez, J.-B.; Berger, F.; Rauch, J.-Y.; Fievet, P.; Lakard, B. Ammonia gas sensors based on polypyrrole films: Influence of electrodeposition parameters. Sens. Actuators B Chem. 2012, 171–172, 431–439. [Google Scholar] [CrossRef]
- Tiwari, D.C.; Atri, P.; Sharma, R. Sensitive detection of ammonia by reduced graphene oxide/polypyrrole nanocomposites. Synth. Met. 2015, 203, 228–234. [Google Scholar] [CrossRef]
- Shen, W.-C.; Shih, P.-J.; Tsai, Y.-C.; Hsu, C.-C.; Dai, C.-L. Low-Concentration Ammonia Gas Sensors Manufactured Using the CMOS–MEMS Technique. Micromachines 2020, 11, 92. [Google Scholar] [CrossRef]
- Hu, N.; Yang, Z.; Wang, Y.; Zhang, L.; Wang, Y.; Huang, X.; Wei, H.; Wei, L.; Zhang, Y. Ultrafast and sensitive room temperature NH3 gas sensors based on chemically reduced graphene oxide. Nanotechnology 2013, 25, 25502. [Google Scholar] [CrossRef]
- Zhang, D.; Wu, Z.; Zong, X.; Zhang, Y. Fabrication of polypyrrole/Zn2SnO4 nanofilm for ultra-highly sensitive ammonia sensing application. Sens. Actuators B Chem. 2018, 274, 575–586. [Google Scholar] [CrossRef]
- Qin, Y.; Zhang, B.; Zhang, Z. Combination of PPy with three-dimensional rGO to construct bioinspired nanocomposite for NH3-sensing enhancement. Org. Electron. 2019, 70, 240–245. [Google Scholar] [CrossRef]
- Wu, K.; Luo, Y.; Li, Y.; Zhang, C. Synthesis and acetone sensing properties of ZnFe2O4/rGO gas sensors. Beilstein J. Nanotechnol. 2019, 10, 2516–2526. [Google Scholar] [CrossRef] [PubMed]
- Davies, S.; Spanel, P.; Smith, D. Quantitative analysis of ammonia on the breath of patients in end-stage renal failure. Kidney Int. 1997, 52, 223–228. [Google Scholar] [CrossRef] [PubMed]
© 2020 by the authors. Licensee MDPI, Basel, Switzerland. This article is an open access article distributed under the terms and conditions of the Creative Commons Attribution (CC BY) license (http://creativecommons.org/licenses/by/4.0/).