Abstract
We present a methodology that enhances the analytical performance of organic electrochemical transistors (OECTs) by continuously cycling the devices through gate potential sweeps during sensing experiments. This continuous cycling methodology (CCM) enables real-time acquisition of full transfer curves, allowing simultaneous monitoring of multiple characteristic parameters. We show that the simultaneous temporal evolution of several OECT response parameters (threshold voltage (VTH), maximum transconductance (gmax), and maximum transconductance potential (VG,gmax)) provides highly sensitive descriptors for detecting pH changes and macromolecule adsorption on OECTs based on polyaniline (PANI) and poly(3,4-ethylenedioxythiophene) (PEDOT) channels. Moreover, the method allows reconstruction of IDS–t (drain–source current vs. time) profiles at any selected gate potential, enabling the identification of optimal gate voltage (VG) values for maximizing sensitivity. This represents a substantial improvement over traditional measurements at fixed VG, which may suffer from reduced sensitivity and parasitic reactions associated with gate polarization. Moreover, the expanded set of parameters obtained with the CCM provides deeper insight into the physicochemical processes occurring at both gate and channel electrodes. We demonstrate its applicability in monitoring polyelectrolyte and enzyme adsorption, and detecting urea and glucose through enzyme-mediated reactions. Owing to its versatility and the richness of the information it provides, the CCM constitutes a significant advance for the development and optimization of OECT-based sensing platforms.
1. Introduction
Among the wide range of analytical techniques currently available for the detection and quantification of substances in different types of samples, electrochemical sensors offer several advantages [1,2]. These include rapid, real-time responses, straightforward miniaturization, simple digitalization, ease of fabrication and scalability, and low cost, among others [3,4,5,6,7]. However, in many cases, the signals obtained from traditional electrochemical transduction methods (potentiometry, amperometric measurements, potential scanning techniques, etc.) are not sufficiently sensitive. As a result, strategies that amplify the signals are required in order to develop sensors capable of detecting analytes at low concentrations or in complex samples that must be diluted to minimize interfering species or appreciable matrix effects [8,9]. One of the most extensively developed approaches in recent years to increase the sensitivity of electrochemical sensors is based on field-effect transistors (FETs).
Basically, these transistors consist of a channel made of a conducting or semiconducting material connected to two terminals (source, S, and drain, D), together with a third electrode (gate, G) that is used to generate an electric field over the conducting channel (or to modulate its intensity) [8,10]. In the case that the channel is an electroactive polymer (organic electrochemical transistors, OECTs) [11,12,13], changes in the gate potential lead to modifications in the redox state of the film, which are also accompanied by variations in the concentration of ions within the film (mixed ionic–electronic conduction [14,15]). Then, a wide range of physicochemical phenomena can be exploited for sensing purposes [10,12]. On one hand, sensing may occur from the interaction of the target analyte with the gate electrode through redox processes, local pH changes, or specific binding events that alter the surface potential or capacitance of the gate–electrolyte interface [16,17,18,19]. On the other hand, transduction phenomena may also arise from the responsiveness of the channel to the analyte [20]. For instance, the presence of certain ions or molecules [21], or interaction with macromolecules [22], can modify the redox state of the film, its charge density, or the impedance of the channel–solution interface [13]. All these phenomena can ultimately be detected as variations in the conductivity of the film under gate modulation [23] and have been employed for the development of OECT-based devices with biomedical and bioanalytical applications [11,12,13], such as metabolite detection (e.g., glucose, lactate, and urea) [19,24,25], ion [26] and pH sensing [27], protein biomarkers [28], and enzyme-based biosensing platforms [29,30], particularly in point-of-care and wearable technologies [18,19,26,31].
Regardless of the specific transduction mechanism operating in the detection of a target analyte, the analytical response of the transistor is typically obtained from the changes in the transfer characteristic curves of the OECT in the presence of the analyte. The transfer curve is obtain by recording the drain–source current (IDS) as a function of the gate potential (VG), at a constant drain–source potential (VDS) [32]. These IDS–VG curves are generally sigmoidal and can be characterized by several parameters, such as the maximum current; the threshold potential (VTH), required to initiate the polymer oxidation; the rate of change in current with the gate potential, which is often quantified by the transconductance (g); and the maximum transconductance value (gmax), which occurs at the inflection point of the IDS–VG curve. Because changes generally occur across the entire IDS–VG curve, variations in channel conductivity can be monitored through the evolution of several characteristic parameters [33], and therefore the transistor response may be defined in multiple ways.
One of the most common approaches is to monitor IDS at a constant gate potential—often chosen near the maximum transconductance point [26]. In this case, the current is recorded as a function of time or analyte concentration [19,25]. However, this strategy overlooks valuable information contained in other characteristic parameters, which is crucial for understanding the physicochemical processes underlying the sensing event and for optimizing OECT performance and measurement conditions.
In this context, we present a method based on the continuous acquisition of IDS–VG curves, which allows the temporal evolution of all characteristic parameters to be extracted and even enables the reconstruction of chronoamperometric curves (IDS vs. t) at any selected gate potential. This makes it possible to perform a simultaneous analysis of all parameters related to sensing events, whether they arise from ion intercalation, interaction of macromolecules or proteins with the conducting channel, or the functional response of biosensors based on enzymatic activity in the presence of a target analyte. In this work, sensing experiments are used as illustrative case studies to demonstrate the advantages of this continuous cycling methodology (CCM), rather than as application-optimized sensing systems. As we demonstrate here, this method allows post hoc selection of the parameters that best capture each process, enabling increased sensitivity through higher-amplitude responses or complementary analyses based on the simultaneous evolution of parameters that reflect different physicochemical aspects of the system.
2. Materials and Methods
2.1. Reagents
Polyallylamine hydrochloride (PAH, Mw ≈ 58 kDa), 3,4 ethylenedioxythiophene (EDOT), aniline (ANI), poly (sodium 4-styrene sulfonate) (PSS) (Mw 70 kDa), and urea (99%) were acquired from Sigma Aldrich (St. Louis, MO, USA). Pyridine (99%) was obtained from Biopack (Buenos Aires, Argentina). Iron (III) p-toluenesulfonate (38–42% in n-butanol) was purchased from Heraeus (Hanau, Germany). Glucose oxidase (GOx, from aspergillus Niger) and urease (from Canavalia ensiformis, Jack Bean, 200 KU) were obtained from Calzyme (from Aspergillus Niger: Lote#67-8-18 As, Tulelake, CA, USA). Potassium chloride (KCl), n-butanol (99.4%), glucose, potassium hydroxide (KOH), sulfuric acid (H2SO4), sodium hydroxide (NaOH) and hydrochloric acid (HCl) were purchased from Anedra (Los Troncos del Talar, Buenos Aires, Argentina).
2.2. OECTs Preparation
The polymeric films were prepared on interdigitated electrodes (IDEs) (Micrux ED-IDE1-Au, 10/10 µm electrode/gap). PEDOT-PAH films were synthesized by chemical polymerization as described in previous reports [29,30]. In summary, 5 µL of EDOT was mixed with 381 µL of an oxidant solution (prepared by mixing 220 µL of butanol, 16.5 µL of pyridine, and 715 µL of Fe (III) p-toluenesulfonate), 1862 µL of butanol, and 80 µL of a PAH solution (200 µL of ultrapure H2O, containing 75 mg for polyelectrolytes analysis and 40 mg for the remaining measurements) [34]. The mixture was deposited onto IDEs using a spin coater (1 min of spin time, 1000 rpm of rotation rate, and 500 rpm s−1 of acceleration), and the polymerization was carried out at 70 °C. Finally, the OECTs were washed with distilled water and dried with air. The material produced in this synthesis has been previously characterized by AFM [29] and XPS, Raman, and UV–visible spectroscopies [21]. Films obtained by this spin-coating procedure are about 100 nm thick, as determined by AFM [34].
PANI-based OECTs were prepared by electrochemical synthesis directly on the interdigitated electrodes. To this end, a 0.5 M aniline (previously distilled) in 1 M H2SO4 solution was introduced into a conventional three-electrode cell, using the IDE as working electrode, a Pt wire as the counter electrode, and a commercial Ag/AgCl electrode as the reference. Aniline polymerization was achieved by cycling the potential between −200 and 750 mV at 50 mV s−1. The film was grown until it was thick enough to connect the drain and source terminals of the interdigitated electrodes (around 15 cycles were required).
2.3. Adsorption on Polymeric Films
The studied macromolecules, PSS and enzymes (urease and GOx), were electrostatically adsorbed on the polymeric films under flow conditions. First, the electrolyte (KCl) was injected, followed by the macromolecule of interest, and finally the transistor was rinsed with KCl solution. All the solutions were injected at a flow rate of 30 μL min−1 for approximately 30 min for enzymes and 40 min for PSS.
2.4. SPR
Surface plasmon resonance (SPR) was performed using an SPR Navi 210 A (BioNavis Ltd., Tampere, Finland) and SPR gold (Au) substrates. PEDOT-PAH polymeric films were synthesized on SPR substrates by following the protocol used to modify the IDEs. Angular scans were recorded with a 785 nm laser during solution injection at a flow rate of 15 µL min−1. The following solutions were sequentially injected: 0.1 M KCl, 0.1 mg mL−1 PSS in 0.1 M KCl, and finally a rinsing step with KCl. For enzyme adsorption, solutions of 10 mM KCl, followed by 1 mg mL−1 of enzyme in 10 mM KCl, and finally 10 mM KCl were injected.
2.5. Electrochemical Measurements
The electrochemical measurements were performed with a TEQ bipotentiostat. Static and flow experiments were performed in a Micrux Technologies cell. Static assays were performed with a Ag/AgCl reference electrode (3 M KCl) as the external gate (Figure 1A), while flow experiments were carried out with a Ag/AgCl wire.
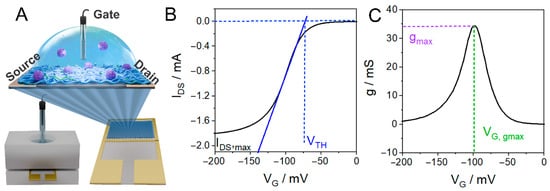
Figure 1.
(A) Scheme of the cell and the interdigitated electrodes employed for the measurements shown in this work. (B) Transfer curve of a PANI-based OECT and representation of the determination of the threshold voltage, VTH, determined as the VG at which the extrapolated linear fit (solid line) intersects IDS = 0 (the dashed lines are guides for the eye). (C) Derivative of the transfer curve and representation of the determination of the maximum transconductance value, gmax, and the maximum transconductance potential, VG,gmax.
For transfer curves, the drain–source current (IDS) was registered while the gate potential (VG) was cyclically swept by performing a triangular modulation of the gate voltage at a fixed sweep rate (10 mV s−1 or 20 mV s−1) within defined voltage limits, typically corresponding to the on (oxidized polymer, IDS = IDS,max, where IDS,max is the maximum drain–source current) and off (reduced polymer, IDS ≈ 0) states of the transistor (Figure S1), under a constant drain–source potential (VDS) of −50 mV. Since the electrochemical window varies among devices, the VG limits were selected individually for each OECT.
2.6. Data Curation
In order to simplify and systematize the determination of OECT characteristic parameters, Python 3.11 programming was employed to perform data analysis. In particular, the numpy, scipy, and pandas libraries were used to process and organize the data.
3. Results and Discussion
In the following sections, we present a stepwise demonstration of the continuous cycling methodology (CCM) and its application to OECT-based sensing. First, we define the characteristic OECT parameters extracted from continuously recorded transfer curves and describe how they are determined (Section 3.1). Next, we analyze the limitations of conventional fixed gate measurements and introduce the CCM as a strategy to overcome these constraints (Section 3.2). The methodology is then applied to progressively more complex scenarios, including polyelectrolyte adsorption, enzyme immobilization, and enzymatic biosensing (Section 3.3, Section 3.4 and Section 3.5), before finally addressing the monitoring of faster processes through reduced potential windows (Section 3.6).
3.1. OECT Characteristic Parameters Determination
This section introduces the OECT characteristic parameters that will be used throughout the manuscript to analyze sensing experiments using the CCM and illustrates how these parameters are extracted from continuously recorded transfer curves. The determination of the OECT characteristic parameters will be illustrated from the transfer curves obtained with a PANI channel that was continuously cycled by sweeping the gate potential (VG) at a low scan rate (v = 10 mV s−1) in 1 M HCl. In Figure 1B, a typical IDS vs. VG curve or transfer curve is shown, whereas Figure 1C shows the first derivative of the transfer curve, which represents the transconductance of the channel [10].
g = dIDS/dVG
Three different parameters are usually determined from transfer curves to characterize the OECT response. The first, the threshold voltage (VTH), represents the minimum gate voltage required to oxidize the polymer (and inject charge carriers). According to the Bernards–Malliaras model for OECT operation, the drain current in the linear regime (low VDS values) is as follows [35]:
where W, L, and d, are the channel width, length, and thickness, respectively, μ is the charge carrier mobility, and C* is the volumetric capacitance. Due to the low drain bias used in this work (VDS = −50 mV), the transistors operate in the linear regime. Consequently, based on the former equation, VTH can be operationally defined as the gate voltage at which the extrapolated linear fit of IDS versus VG intersects IDS = 0 [36,37], as depicted in Figure 1B. In OECTs, the threshold voltage is often treated as an operational parameter rather than a fixed material constant, as it can be tuned through material design or gate/electrochemical conditions [36,38].
IDS = (Wd/L) μC*(VG − VTH) VDS
On the other hand, the maximum transconductance, gmax, and the gate potential at which the transconductance is maximum, VG,gmax, can be determined from the first derivative, as shown in Figure 1C. The latter represents the potential at which the current has the maximum response to changes in the applied gate potential and therefore corresponds to the VG value at which the OECT signal in terms of IDS has the greatest sensitivity to changes in the effective gate voltage.
It is common to represent the time evolution of IDS at a fixed gate voltage; this representation corresponds to the IDS–t (drain–source current vs. time) profiles. As shown in this work, time-dependent profiles can be directly measured by recording IDS at a constant VG or reconstructed from continuously acquired transfer curves. In both cases, IDS evolves from an initial steady state value in the (analyte-free) electrolyte, IDS,0, to a final steady state or plateau value after a perturbation or analyte injection. We define ΔIcorr as the baseline-subtracted change in the drain–source current from the initial condition (Figure S1). When this parameter is normalized by IDS,0, the percent change is represented as follows:
ΔIcorr% = 100 × ΔIcorr/IDS,0
The baseline-corrected signal eventually reaches a steady state value, ΔI, which can be quantified as a percent change,
ΔI% = 100 × ΔI/IDS,0
The same procedure employed for the determination of ΔIcorr, ΔI, and ΔI% from IDS was employed for the determination of the analogous parameters ΔVTH,corr, ΔVTH, Δgmax,corr, Δgmax%, and ΔVG,gmax,corr from VTH, gmax, and VG,gmax, respectively.
All the parameters mentioned provide complementary and partially independent descriptors of the OECT response. In the following section, we examine how relying on a single parameter measured at a fixed gate potential can obscure relevant information during sensing experiments, thereby motivating the introduction of the continuous cycling methodology.
First, it is necessary to clarify that transfer curves can be acquired by sweeping the gate potential in either direction, and the resulting responses are not necessarily identical. Owing to the complex processes that couple ionic and electronic charge transport, electroactive polymers often exhibit a certain degree of hysteresis in their redox response. This hysteresis manifests as differences between transfer curves acquired under opposite sweep directions and can also depend on the sweep rate, as will be explored in the following section.
In general, transfer curves can be acquired by sweeping the gate potential in either the turn-off or the turn-on direction of the transistor. In this work, when the gate potential is swept in the positive direction, electrochemical reduction in the polymer is induced, driving it into its insulating state, which is consistent with the OFF state of the transistor. We refer to these transfer curves as “off” curves. Conversely, when transfer curves are acquired while decreasing the gate potential, the polymer is driven into its oxidized, conductive state, and the OECT operates in the ON state. These curves are therefore referred to as “on” curves (Figure 2A).
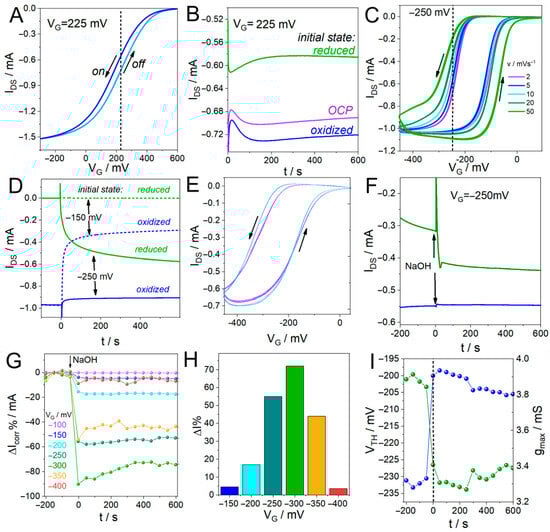
Figure 2.
(A) Transfer curve of a PEDOT-PAH-based OECT in 0.1 M KCl at 10 mV s−1 (the arrows show the direction of the scan) and (B) IDS time evolution at VG = 225 mV obtained from three different initial states. (C) PANI-based OECT transfer curves at different scan rates and (D) IDS response at two fixed VG values: −250 mV (solid lines) and −150 mV (dashed lines). (E) Transfer curves of a PANI film in 1 M HCl before (blue) and after (purple) the addition of NaOH. (F) Time-dependent IDS response of a PANI OECT upon NaOH addition at VG = −250 mV. (G) Reconstructed IDS vs. time response obtained with the CMM for different VG values using the transfer curves shown in (E), and (H) IDS percent changes as a function of VG. (I) Time evolution of the VTH and gmax parameters obtained from the transfer curves shown in (E).
3.2. Limitations of Traditional OECT Measurements and Introduction to Continuous Cycling Methodology (CCM)
In this section, we critically analyze the limitations of traditional fixed gate OECT measurements and use representative examples to illustrate why continuous access to the full transfer characteristics is essential for reliable sensing.
When using OECT-based technology for the development of biosensing devices, determining and controlling the characteristic parameters g, VTH and VG,gmax, is critical. In particular, the focus is on obtaining transistors with high values of g (high sensitivity to VG modulation) [23,39] and low values of VG,gmax and VTH to avoid polymer degradation or parasitic electrochemical reactions [40,41]. To this end, much attention has been paid to the design of channel and gate materials with optimized properties that also allow the incorporation of biomolecules in non-denaturing environments [10,42,43]. Then, the challenge lies in transducing the biochemical events occurring at the channel or gate surface of the OECT into reproducible electrical signals. In many cases, the detection mechanism is based on changes in the interfacial potential due to the adsorption of macromolecules through biorecognition events [44] or changes in external solution properties such as pH, ionic strength, or counterions flux generated by biochemical reactions [29]. In all cases, these changes in the physicochemical properties of the gate or channel electrodes lead to changes in the OECT characteristic parameters that can be used as electric signals to monitor sensing events [45].
However, the evolution in time of these parameters during detection measurements is not commonly used to follow the process in real time. In fact, in many works, the measurement of the transfer curves and the determination of VTH, VG,gmax, or g parameters are evaluated before the sensing event occurs and, in some cases, after analyte addition, but real-time monitoring of these parameters during the interaction of the analyte with the OECT is not usually performed. Instead, the detection signal is obtained by measuring the variation in IDS at a constant VG [24,46,47,48,49]. Although this methodology has been successfully employed for the detection of several analytes, it misses out relevant information and may present limitations and associated issues. In this section, we will illustrate some of these issues and explore the potential of the continuous cycling methodology proposed here to overcome them by using the response of OECTs based on two of the most widely employed conducting polymers in the construction of electrochemical devices: poly(3,4-ethylenedioxythiophene) (PEDOT) [50] and polyaniline (PANI) [27,51,52,53].
In the first place, choosing a constant VG to perform current monitoring is not trivial. On one hand, the applied VG must lie within a potential range of high transconductance. However, determining the optimal value of VG to perform the measurement is not easy since, for transistors based on organic channel materials, the relationship between the output current of the device and the applied potential depends on several factors. For instance, the electrochemical response of polymers may have associated hysteresis, as observed for the case of PEDOT-PAH films in Figure 2A [54]. That is, even when sweeping at low rates, the “off” (sweep from −300 to 600 mV) and “on” (sweep from 600 to −300 mV) curves have different responses. For this reason, when applying a constant gate potential, the obtained IDS will depend on the previous state of the polymer. In this regard, the response of a PEDOT-PAH transistor depends on the gate voltage sweep rate (v), with the transfer curves shifting towards more positive gate potentials as v increases, which is characteristic of mixed-conduction polymer systems (Figure S2). For v values lower than 20 mV s−1, the “off” curve (corresponding to the reduction process) shows the same profile independently of the scan rate, meaning that below 20 mV s−1 the change in the applied potential is slow enough to allow the polymer to reach equilibrium and that no associated diffusion phenomena deform the electrochemical response. However, the “on” curve shifts with scan rate towards lower gate values due to other phenomena that may be associated with restructuring of the polymer chains, generating hysteresis in the current response, even at very low values of v. As a consequence, the current signal at a given gate potential depends on the initial state of the polymer. Figure 2B shows the IDS response of a PEDOT-PAH transistor measured at the same VG value (VG = 225 mV), obtained from different initial states of the polymer: off-limit (fully reduced), on-limit (fully oxidized), and open circuit potential (OCP). It can be observed that the changes in the output current depends on the initial state of the polymer, even when they were measured at the same constant gate potential.
This effect is even more notorious for PANI-based OECTs, for which the hysteresis in the response yields a difference of 150 mV between the “on” and “off” curves even at very low scan rates, such as 2 mV s−1 (Figure 2C). In this case, the initial state of the polymer has a very important role in the current response of the transistor. In Figure 2D, IDS measured at a constant VG is shown, where differences in output current depending on the initial state of the polymer can be seen. In this experiment, initial gate potentials of 100 mV or −450 mV were applied for 3 min, to fully reduce or oxidize the polymer, respectively. Next, VG = −250 mV was set, obtaining an output current of −0.57 mA when the initial potential was 100 mV and −0.90 mA, when the initial potential was −450 mV. This means that if the polymer is initially oxidized, applying a constant value of −250 mV yields the polymer in a completely “on” state with low transconductance. Therefore, a sensing event occurring in the gate electrode that generates a shift in the transfer curve will not have a significant effect on the output current. On the contrary, if the polymer is initially reduced, applying VG of −250 mV will place the polymer in a state of high transconductance, yielding high sensitivity towards analyte detection. A similar effect, but in the opposite direction, occurs at VG = −150 mV. When the polymer is initially oxidized, applying VG of −150 mV generates a state of high transconductance in the polymer (IDS = −0.3 mA), whereas if the polymer is initially reduced, the current is practically null and a sensing event will not be detected. Then, to choose a proper potential to monitor a sensing event, a very thorough study of the polymer behavior and precise control of its redox state before initiating the measurement is required, and even then, any change in the external media or modification of the polymer surface may change the result.
To show how this may affect a sensing experiment, we monitored the change in the signal of a PANI-based OECT upon the addition of NaOH. Changes in the external pH generate changes in the current response of the OECT, since the electrochemical response of PANI strongly depends on the pH. This is the case for many organic composites employed as channel materials in the construction of OECTs and is often harnessed to monitor sensing events involving enzymatic reactions that generate acidic or basic products [29,30]. In Figure 2E, the IDS vs. VG profiles of a PANI-based OECT are shown before (blue) and after (purple) the addition of NaOH. A shift in the transfer curves to higher VG and a decrease in the maximum current, IDS,max, can be observed. Next, we chose a VG potential in the high transconductance region to monitor changes in solution pH using the traditional chronoamperometric methodology and to evaluate the influence of the initial state of the polymer on the resulting signal. To this end, initial potentials of 100 mV or −450 mV were applied for 3 min and then changed to −250 mV while IDS was recorded. Next, NaOH solution was injected to change the solution pH (25 µL of a 20% p/V NaOH were added to a total cell volume of 600 µL of 1 M HCl solution). In Figure 2F, a marked increase in the current can be observed when NaOH solution was added, as a consequence of the shift in the transfer curve to higher VG values, when the polymer was initially fully reduced. However, for the experiment performed with the polymer initially oxidized, no appreciable change in the current was observed with the addition of NaOH. The same experiment was performed at −150 mV, where the opposite behavior was found: when the initial state of the polymer was fully oxidized, a marked change in the current was observed upon NaOH solution addition. On the contrary, if the initial state was fully reduced, a very small current was observed, and no changes due to pH change were detected (Figure S3). These results show the complexity of selecting an appropriate VG value to perform a detection measurement and the different variables that may affect the result.
In this context, the CCM proposed here allows this issue to be overcome while also providing more information about the processes occurring in the OECT. In this method, the entire transfer curves are continuously recorded during the sensing experiment; therefore, changes in IDS are registered at all VG values within the potential range of the transfer curve. Then, the IDS as a function of time profiles can be reconstructed at each VG, allowing selection of the value that yields the greatest amplitude of current change from both the “on” and “off” curves (Figure S4). In Figure 2G,H, the changes in current, ΔIcorr% and ΔI%, respectively, are shown for the “on” curves (“off” curves are shown in Figure S5; details of the baseline subtraction procedure in Section S1). It can be observed that the amplitude of the current change upon the addition of NaOH depends on the VG analyzed. Then, the potential value that has the highest sensitivity can be selected. In addition, the evolution in time of other parameters can be obtained from the shifts in the transfer curves and their derivatives (Figures S6 and S7). Figure 2I shows the changes in VTH and gmax, demonstrating that these parameters can also be employed to monitor a sensing event. Moreover, reconstruction of the IDS vs. time profiles from the “off” curves shows that the change in current has different behaviors depending on the potential region analyzed (Figure S5). For the potential range VG > −150 mV, there is an increase in current (in absolute value) with the addition of NaOH, while for VG values below −200 mV, a decrease in signal is observed. This can be explained by taking into account two features of the electrochemical response of the polymer. On one hand, there is a well-known change in the PANI redox potential with increasing pH [55], which leads to a shift in the transfer curves to higher gate potential values. On the other hand, as pH increases, there is a decrease in PANI conductivity, resulting in reduced transconductance and maximum current values. Because of these coupled phenomena, there is an intersection of the transfer curves that yields different behaviors of the current depending on the potential region analyzed. These results emphasize the relevance of having access to the entire transfer curves and of monitoring the evolution of different parameters to understand the phenomena causing the signal in the transistor. Accordingly, direct quantitative benchmarking against state-of-the-art OECT sensors operating at fixed gate potentials is not straightforward, as the CCM fundamentally changes the way sensitivity and response metrics are defined and extracted.
Another problem that arises from measuring at a constant VG value is that polarization of the channel and gate electrodes can lead to parasitic reactions, generating a component associated with these processes in the OECT signal. As a result, the time required to achieve the stabilization of the device response, as well as the presence of drift in the transistor signal, depends on the VG employed.
As an example, the evolution of the signal of a PEDOT-PAH transistor during the first 20 min after applying a constant VG depends on the applied potential (Figure S8). However, sweeping the gate potential between the on and off states avoids polarization, thereby preventing parasitic reactions that add non-desirable components into the device signal. Then, the time required to stabilize the output signal does not vary significantly with the VG value chosen to monitor the evolution of the current; that is, both the time required to reach stabilization and the drift in the signal are independent of the chosen potential.
Moreover, analysis of other parameters, such as the threshold voltage, can help elucidate the origin of the drift in a measurement and, in some cases, mitigate its effect. For instance, drifts often originate from polymer degradation processes or their detachment from the substrate. In such cases, the OECT current progressively decreases, but separating this contribution from current changes due to an actual sensing event can be a challenge. In this regard, monitoring the threshold voltage can be more appropriate (Figure S8). In the following sections, we show how this strategy can be harnessed to detect the presence of an analyte through monitoring VTH under conditions in which the current does not show a clear response.
Taken together, these results demonstrate the relevance of determining different OECT parameters and the potential of monitoring them to improve the performance of OECTs in biosensing measurements. We believe that having all this data available for each experiment is a key factor towards improving reproducibility and achieving a better understanding of the physicochemical processes that take place during detection events. In the following sections, we will show examples of the application of CCM for the detection of different analytes, ranging from monitoring the adsorption of polyelectrolytes and enzymes on polymeric substrates to the biosensing of glucose and urea through biocatalytic reactions.
3.3. CCM Applied to Polyelectrolyte Adsorption Monitoring with OECTs
We now apply the CCM to the monitoring of polyelectrolyte adsorption as a first application example, using this well-characterized system to illustrate how different OECT parameters capture complementary aspects of the adsorption process. In this regard, we monitor the adsorption of poly-styrenesulfonate (PSS), used as a model polyanion, on the PEDOT-PAH channel surface through analysis of the different parameters mentioned above. Adsorption of this macromolecule onto the PEDOT-PAH surface has been previously studied and is driven by electrostatic interactions between negatively charged PSS and positively charged channel surface endowed by the amino groups of polyallylamine [22,44].
To this end, the OECT IDS response was recorded while the gate potential was swept between −200 mV and 600 mV in 0.1 M KCl at 20 mV s−1 under flow conditions. Then, a 1 mg mL−1 PSS solution in 0.1 M KCl was injected for 40 min and then rinsed with KCl. Figure 3A shows the change in transfer response for the “off” curves (on curves are shown in Figure S9). A shift in the curves to higher gate values is observed. This effect is also evident in Figure 3B, which shows the transconductance vs. VG for the transfer curves in Figure 3A. Then, the VTH was calculated from each curve and plotted as a function vs. time, as can be seen in Figure 3C. A rapid increase in VTH is observed as the charged macromolecule is deposited. The increase in the gate potential required to oxidize the polymer when PSS is adsorbed is related to the incorporation of a negative dopant into the PEDOT-PAH matrix, which stabilizes the positive carriers of the polymer. This effect can also be monitored by following the increase in VG,gmax (Figure S10). In addition, Figure 3D shows gmax values as a function of time, revealing a decrease in this parameter as PSS is deposited on the surface. Next, we continued with the reconstruction of IDS vs. time profiles usually used to monitor these processes at different constant VG values. In this case, the IDS time evolution at different potentials also depends on the selected VG (Figure S11). However, some interesting information arises from the comparison of current changes across different VG. Figure 3E shows the changes in current at each VG value obtained by subtracting a linear baseline corresponding to the current before the injection, ΔIcorr, and Figure 3F shows the total current change after returning to the KCl solution, which is the typically used analytical parameter in OECTs (these results were obtained using the “off” curves; the ones obtained with the “on” curves are shown in Figure S12). The maximum amplitude of the change in the signal is observed at the potential corresponding to the maximum transconductance of the polymer (380 mV). However, it is interesting to note that a different result is obtained when analyzing the relative changes in the current or normalized current response, ΔI%, which is the ratio between the current change upon analyte addition and the initial current value before the injection. This parameter is often employed to compare the performance of different transistors [47] and does not necessarily have the greatest amplitude in the VG,gmax. In fact, in the case of PSS adsorption on the PEDOT-PAH-based OECT, the magnitude of the relative current changes increases with VG, reaching values of 66% at VG = 660 mV, compared with a 24% change at VG,gmax (Figure S12). These differences depend on each specific system and are not easy to predict; therefore, having all data available allows the selection of the optimal potential to perform the analysis, obtain the signal with the greatest amplitude, and have fair comparison between different devices.
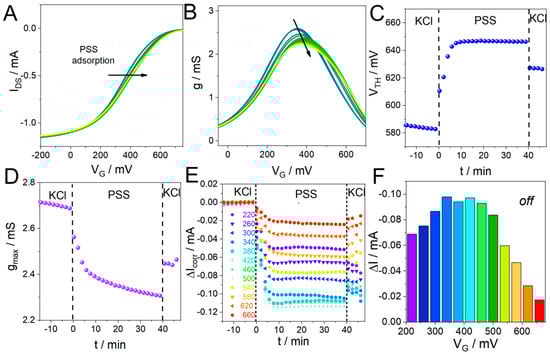
Figure 3.
(A) Shift in the PEDOT-PAH transfer curves during PSS adsorption (the arrow shows the direction of the shift to higher VG values). (B) g vs. VG curves obtained by deriving the transfer curves in (A). (C) VTH and (D) gmax time evolution obtained from the curves in (A) and (B), respectively. (E) ΔIcorr time evolution during PSS deposition at different VG values, and (F) representation of the current changes as a function of VG. All shown data were obtained from the “off” curves, see SI for the analysis of the “on” curves (Figure S12).
In addition, we compared the OECT response obtained with the CCM with SPR results to evaluate the influence of the methodology in the kinetic profile of the reconstructed curves. To this end, a PEDOT-PAH modified Au-SPR substrate was employed to follow changes in the sensorgram during the injection of 0.1 mg mL−1 PSS in 0.1 M KCl solution (the same conditions as those employed for the OECT measurements). The kinetic profiles, in terms of both the relative change in the threshold potential and IDS at VG = 380 mV, correlate well with the SPR temporal response (Figure S13), which proves that the CCM allows precise time monitoring of the processes.
3.4. CCM Applied to Enzyme Adsorption Monitoring with OECTs
In this section, enzyme adsorption is investigated using urease and glucose oxidase as representative and practically relevant model systems. Urea and glucose were selected as clinically relevant biomarkers widely used in biomedical diagnostics, while urease and glucose oxidase are well-established enzymes in OECT-based sensing platforms [29,30,44]. In this context, the continuous cycling methodology (CCM) enables the monitoring of both enzyme immobilization and subsequent catalytic activity through the simultaneous analysis of multiple OECT parameters. The anchoring of urease and glucose oxidase on PEDOT-PAH OECTs has been previously studied [29,30,44]. These enzymes are negatively charged in aqueous media at pH 7.4; therefore, due to electrostatic interactions, they are adsorbed onto the protonated polymeric surface. In previous works, we have shown the capability of OECTs to monitor protein deposition on PEDOT-PAH films through changes in the current signal of the device. Here, we report monitoring of the adsorption of urease and glucose oxidase on the OECT channel by following the time evolution of VTH, VG,gmax, and gmax, showing the advantages of this analysis methodology.
Integration of urease onto PEDOT-PAH films was performed similarly to polyelectrolyte adsorption. Briefly, under flow conditions, a solution of 10 mM KCl was injected, and IDS was recorded while the potential was swept between 0 and 800 mV at 10 mV s−1. Then, 1 mg mL−1 urease in 10 mM KCl was injected for 32 min, followed by rinsing with 10 mM KCl. Figure 4 shows the time evolution of gmax, VTH, and VG,gmax. These parameters were obtained from both “on” and “off” transfer curves. Transfer curves recorded before and after enzyme deposition show a clear shift toward lower gate potentials (Figure S14). This variation is also reflected in the time evolution of gmax, VTH, and VG,gmax, as shown in Figure 4A–C. In previous works, such behavior has been attributed to changes in impedance at the polymer/electrolyte interface due to enzyme attachment on the channel surface [30]. Overall, it is interesting to note that all studied parameters are suitable for monitoring the enzyme integration process.
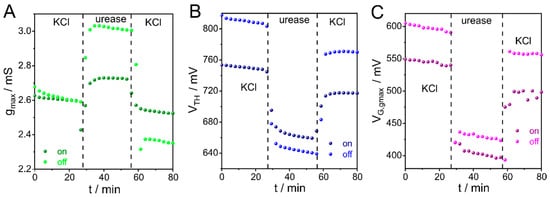
Figure 4.
Time evolution of the (A) gmax, (B) VTH, and (C) VG,gmax during urease adsorption. VDS = −50 mV, pH 7.4.
A similar analysis was performed using glucose oxidase (GOx) instead of urease. In this case, the enzyme injection lasted 29 min, and the behavior of the parameters was opposite to that observed for urease incorporation. In particular, the increase in the conductivity of the channel due to the anchoring of GOx was attributed to stabilization of the positive charge carriers of the polymer by the negative charges of the enzyme, similarly to the behavior observed for PSS adsorption [44], corroborating the capability of this strategy for monitoring enzyme integration (Figure S15).
Likewise, a similar approach to that shown above for PSS was applied to compare the OECT response with the SPR signal during urease deposition. In this case, a PEDOT-PAH-modified Au-SPR substrate was employed to follow changes in the sensorgram during injection of 1 mg mL−1 of the enzyme in 10 mM KCl solution. In all cases, the reconstructed kinetic profiles in terms of VTH, VG,gmax, and gmax exhibited a notable correspondence with the SPR sensorgram (Figure S14), verifying the capability of the CCM to monitor adsorption processes over time with high precision.
3.5. CCM Applied to the Biosensing of Catalytic Reaction with OECTs
Having established the applicability of the CCM to adsorption monitoring, we next demonstrate its use in enzyme-mediated biosensing, where chemical reactions at the channel surface dynamically modify the OECT response. Urease catalyzes the hydrolysis of urea into ammonia and carbon dioxide, yielding an increase in local pH. The catalytic response of enzyme-adsorbed PEDOT-PAH OECTs is shown in this section. For urea detection, the urease-modified OECT mentioned above was exposed to increasing concentrations of urea, ranging from 100 µM to 5 mM in 10 mM KCl at pH 7.4 under flow conditions. Transfer curves recorded between 0 and 850 mV at 10 mV s−1 exhibited a shift toward higher gate potentials (Figure S16). As a result, there is an increase in VTH and VG,gmax parameters (Figure 5A,B). In previous works, it was stated that the shift toward higher gate potentials upon pH increase arises from the deprotonation of PAH amino groups, leading to stabilization of PEDOT channel positive charge carriers [30]. Moreover, the process can be monitored as an increase in gmax, as shown in Figure 5C.
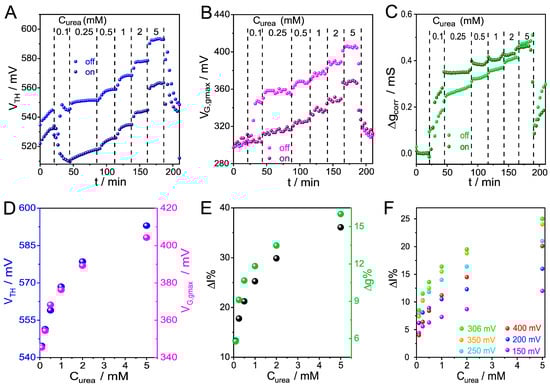
Figure 5.
Time evolution of (A) VTH, (B) VG,gmax, and (C) Δgmax,corr during injection of increasing concentrations of urea. (D) VTH and VG,gmax as functions of concentration. (E) Percent change in IDS and gmax as function of concentration. (F) Percent change in IDS as function of concentration evaluated at variable VG. VDS = −50 mV, pH 7.4.
Figure 5D presents VTH and VG,gmax as functions of urea concentration, showing increases in these parameters throughout the entire concentration range studied and a good match between the profiles, suggesting that both parameters can be equally employed for urea detection. A similar behavior was observed for ΔI% and Δgmax% parameters (Figure 5E), which represent the relative changes in IDS and gmax, respectively.
As observed for PSS, the time evolution of IDS at different potentials shows that the device output signal depends on the selected VG (Figure S17). From the analysis of ΔIcorr obtained at different VG values, it can be seen that the maximum signal amplitude occurs at the gate potential corresponding to the maximum transconductance of the polymer (306 mV) (Figure 5F). On the other hand, relative changes in the normalized current response ΔIDS % increases with VG, in a similar fashion to that observed during the monitoring of macromolecule adsorption. These results reinforce the importance of considering the complete set of experimental data in order to identify the gate potential that maximizes signal amplitude and ensures consistent and reliable comparison between devices. Unlike conventional fixed-bias OECT measurements, which typically yield a single sensitivity value, the CCM provides a multidimensional description of device response, allowing sensitivity to be optimized a posteriori by selecting the most informative parameters and gate potentials for a given system.
Furthermore, we have also evaluated the enzymatic detection of glucose through the different parameters with a PEDOT-PAH OECT modified with GOx, showing that the CMM can be successfully employed for monitoring this analyte (Figure S18). However, some noteworthy results emerged from an experiment performed with a modified electrode channel that suffered degradation, losing polymeric material during the sensing measurement and therefore decreasing the current signal. In previous works, it was reported that IDS,max is related to polymer thickness [44]. Therefore, in CMM, the decrease in the maximum current during transfer curve acquisition can be attributed to polymeric material degradation. In general, a stable IDS is expected during electrolyte monitoring. However, as the OECT degrades, such stability cannot be achieved.
When this kind of issue appears in a sensing measurement, the IDS shift cannot be clearly associated with either the degradation or the molecular reaction that occurs at the polymeric surface. In the case of glucose sensing, its decomposition into gluconic acid and hydrogen peroxide in the presence of GOx results in a decrease in current, behavior attributed to medium acidification. Therefore, in this case, both the sensing event and the degradation process yield a decrease in the current, and separating one contribution from the other is not possible using only the current signal. In this context, a possible solution is to use parameters that do not strongly depend on the polymer mass to follow the enzymatic reaction. Figure 6 shows the behavior of a PEDOT-PAH OECT that is degrading while glucose detection is being monitored (glucose was injected from 0.5 to 10 mM in 10 mM KCl at pH 7.4). The evolution of the transfer curves (Figure 6A) shows a decrease in IDSmax as the glucose concentration increases, which involves an obstacle for monitoring glucose detection by recording IDS at a constant VG of 300 mV (Figure 6B). Before glucose injection, the IDS decreases over time, and after glucose injection, a stepwise current shift to lower IDS values is observed as the concentration increases up to 5 mM. Then, the IDS continues to decrease; however, no stepwise response is observed upon further increases in concentration. In fact, for values higher than 5 mM, it is not possible to evidence a correlation between current and concentration, and it seems that enzyme saturation has been reached. Otherwise, if we use VTH to follow the glucose detection (Figure 6C), it is possible to sense concentrations beyond 5 mM. This issue can be corroborated by applying baseline subtraction to VTH, yielding a steady state corrected shift (ΔVTH,corr), and to IDS, from which ΔI% was computed. The comparison between the percentage change in current and the change in VTH as function of concentration is shown in Figure 6D. While ΔI% appears to reach a plateau at 5 mM of glucose, ΔVTH,corr continues to increase up to 10 mM glucose.
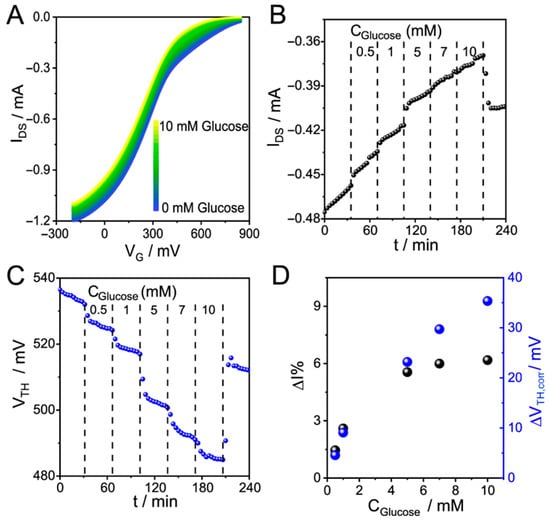
Figure 6.
(A) IDS vs. VG “on” curves for glucose sensing with a GOx-adsorbed PEDOT-PAH OECT in 10 mM KCl, pH 7.4 (B) Time evolution of IDS and (C) VTH. (D) Percent change in IDS and change in VTH as functions of glucose concentration.
In order to quantitatively compare CCM with traditional IDS at constant VG measurements, we performed a glucose sensing experiment using the same transistor under same experimental conditions and applying both methodologies. Specifically, the response of a GOx-modified PEDOT–PAH OECT upon the injection of 5 mM glucose in a 10 mM KCl solution was first recorded by monitoring changes in IDS at VG = VG,gmax, which is presumably close to the most sensitive operating potential. The experiment was then repeated using CCM, allowing the reconstruction of the IDS response at different VG values. An increase in signal amplitude is observed when using CCM at the same gate potential employed in the traditional fixed VG measurement (Figure S19). Moreover, CCM enables the monitoring of other gate–voltage regions that exhibit even larger response amplitudes.
Finally, the repeatability analysis performed for representative sensing experiments further supports the robustness and versatility of the CCM. Repeated measurements carried out at fixed analyte concentrations (glucose and urea) show stable and reproducible responses, with low dispersion in the extracted parameters, confirming that continuous cycling of the gate potential does not introduce detrimental effects on device performance (Figures S20 and S21). On the contrary, CCM enables reliable monitoring of sensing events over successive experiments. Importantly, the availability of the complete set of reconstructed transfer curves allows the gate potential at which the current response is maximized to be selected a posteriori, thereby improving the analytical sensitivity without requiring changes in device architecture or measurement conditions. These results highlight the potential of CCM as a general and robust strategy for OECT-based sensing, providing enhanced sensitivity, reproducibility, and interpretability of the electrical signals. Additionally, in the next section, we address how the methodology can be adapted to monitor faster processes by tailoring the cycling protocol.
3.6. Sensing Rapid Processes with CCM
In previous sections, we showed the capability of the CCM to monitor macromolecule adsorption over time on the OECT channel surface and the good correlation between kinetic profiles obtained by this technique and those obtained by the reference SPR technique. However, when studying the evolution of processes over time, the frequency of data determination is a critical parameter. In this regard, because of the time required to cycle the polymer between the “on” and “off” states, the number of points obtained in the reconstructed curves may be less than desired. In this context, reducing the potential window in which the polymer is cycled can be an easy way to overcome this potential issue. In this section, we prove this concept by reducing the potential range during the detection of glucose. To this end, a GOx-adsorbed PEDOT-PAH OECT was used to monitor a solution of 5 mM glucose in 10 mM KCl. First, complete transfer curves (Figure 7A) were recorded while the solutions were injected (10 mM KCl followed by 5 mM glucose in 10 mM KCl). The potential was swept from −200 (“on” state) to 850 mV (“off” state). Next, using the same OECT, the experiment was repeated by setting the VG limits shown in the orange box, from 350 to 550 mV, under the same conditions as previously used (Figure 7B). The polymer state is not the same when the scan limits change. This issue can be attributed to the doped degree that is reached when it is completely oxidized and then reduced. Since the polymer does not work under the same initial and final conditions, a different time evolution of IDS is expected (Figure S22). Although noticeable variation in IDS is observed, reducing the VG window does not modify the relative change in IDS (see Figure 7C). In both cases, the complete and short scans, a relative IDS shift of around 27% was reached. A noteworthy point is that the short-cycle scan allows tracking the kinetic profile of the biosensing process with significantly higher precision than the complete-cycle scan.
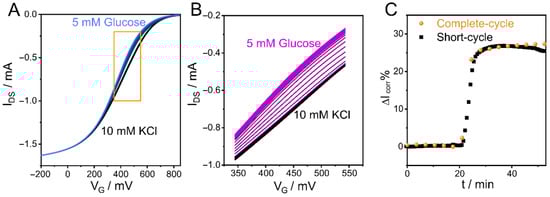
Figure 7.
IDS-VG curves for 5 mM glucose sensing with a GOx-adsorbed PEDOT-PAH OECT in 10 mM KCl, pH 7.4 in (A) complete-cycle scan (black and blue lines correspond to 0 and 5 mM glucose, respectively. The orange box shows the scan window used for short-cycled scan) and (B) short-cycle scan (black and purple lines correspond to 0 and 5 mM glucose, respectively). (C) ΔIcorr% time evolution during glucose sensing with different VG windows, curves reconstructed at VG = 435 mV.
4. Conclusions
A novel methodology for OECT measurements and data analysis designed to improve sensor performance was presented. This methodology is based on continuous cycling of the transistor channel by scanning the gate potential during sensing experiments, enabling monitoring of the processes occurring at the OECT electrodes through multiple parameters simultaneously. It was proven that the time monitoring of VTH, VG,gmax, and gmax parameters can be employed to sense changes in solution pH, as well as macromolecule adsorption on the channel surface, using transistors based on PANI and PEDOT. In addition, reconstruction of IDS profiles as a function of time at constant VG can be performed at multiple VG values, allowing selection of the optimum gate potential for analysis the experiment. This represents a major improvement compared with traditional measurements of IDS at constant VG, since it allows choosing the analysis conditions that yield the greatest sensitivity in the signal response while avoiding the issue of gate polarization that can lead to to parasitic reactions. Importantly, the CCM relies exclusively on standard electrical operation of OECTs and therefore does not introduce additional constraints on device fabrication, stability, or integration compared to conventional sensing approaches. In addition, the extra information provided by determining multiple parameters leads to a better understanding of the physicochemical processes occurring at the gate and channel electrodes. In this work, the CCM was successfully applied to the time monitoring of polyelectrolyte and enzyme adsorption and to the detection of urea and glucose through enzymatic reactions. However, we believe it can be easily extended to other systems of interest, making this methodology a significant contribution to the development of OECT-based devices.
Supplementary Materials
The following supporting information can be downloaded at: https://www.mdpi.com/article/10.3390/chemosensors14010022/s1. Figure S1: Example of baseline subtraction; Figure S2: Transfer curves at different scan rates in a PEDOT-PAH OECT; Figure S3: NaOH sensing with a PANI OECT; Figure S4: Reconstructed time evolution of IDS curves in a PANI OECT at different VG; Figure S5: ΔIcorr as a function of time for the “off” curves in Figure 2C; Figure S6: Transconductance of the PANI OECT obtained by deriving curves in Figure 2C; Figure S7: VTH, gmax, and IDS,max values upon NaOH obtained using CCM from the data in Figure 2E; Figure S8: Current profile of a PEDOT-PAH transistor in KCl during the first 20 min of stabilization; Figure S9: “On” transfer curves and g vs. VG profiles for a PEDOT-PAH-based OECT during PSS deposition; Figure S10: Time evolution of VTH, VG,gmax, and gmax during PSS adsorption; Figure S11: Reconstructed IDS vs. time profiles using CCM at different potentials; Figure S12: ΔIcorr and ΔI% at different VG; Figure S13: Comparison of the performance of SPR and OECT techniques for the monitoring of PSS deposition; Figure S14: Transfer curves and comparison of the performance of SPR and OECT techniques for the monitoring of urease adsorption; Figure S15: Time evolution of VTH, VG,gmax, and gmax during GOx adsorption; Figure S16: Transfer curves for urea sensing; Figure S17: Time evolution of IDS and ΔIDS% for urea sensing; Figure S18: Time evolution of VTH, VG,gmax, and gmax during glucose sensing; Figure S19: Time evolution of the current response with the traditional chronoamperometric method and CCM; Figure S20: Repeatability analysis of the response of a GOx-modified OECT to glucose evaluated using CCM; Figure S21: Repeatability analysis of the response of a urease-modified OECT to urea evaluated using CCM; Figure S22: IDS time evolution during glucose sensing with different VG windows.
Author Contributions
Conceptualization, J.S. and W.A.M.; methodology, J.R.N.R., M.M.-J. and J.S.; formal analysis, J.S.; investigation, J.R.N.R. and M.M.-J.; data curation, J.R.N.R., M.M.-J. and J.S.; writing—original draft preparation, M.M.-J., J.R.N.R. and J.S.; writing—review and editing, O.A., J.S. and W.A.M.; visualization, M.M.-J., J.R.N.R. and J.S.; supervision, J.S. and W.A.M.; project administration, O.A. and W.A.M.; funding acquisition, O.A., W.A.M. and J.S. All authors have read and agreed to the published version of the manuscript.
Funding
This research was funded by the Universidad Nacional de La Plata (PID-X1016), the CONICET (PIP 11220210100209CO and PIBAA 2872021010 0870CO), and the ANPCyT (PICT-2020-02468, PICT-2020-SERIEA-0356, and PICT-2021-GRFTI-00042).
Data Availability Statement
The original contributions presented in this study are included in the article/Supplementary Materials. Further inquiries can be directed to the corresponding authors.
Acknowledgments
M.M.-J. and J.R.N.R. acknowledge scholarships from CONICET. O.A., J.S., and W.A.M. are staff members of CONICET.
Conflicts of Interest
The authors declare no conflicts of interest.
References
- Singh, R.; Gupta, R.; Bansal, D.; Bhateria, R.; Sharma, M. A Review on Recent Trends and Future Developments in Electrochemical Sensing. ACS Omega 2024, 9, 7336–7356. [Google Scholar] [CrossRef]
- Baranwal, J.; Barse, B.; Gatto, G.; Broncova, G.; Kumar, A. Electrochemical Sensors and Their Applications: A Review. Chemosensors 2022, 10, 363. [Google Scholar] [CrossRef]
- Ronkainen, N.J.; Halsall, H.B.; Heineman, W.R. Electrochemical biosensors. Chem. Soc. Rev. 2010, 39, 1747–1763. [Google Scholar] [CrossRef]
- Singh, A.; Sharma, A.; Ahmed, A.; Sundramoorthy, A.K.; Furukawa, H.; Arya, S.; Khosla, A. Recent Advances in Electrochemical Biosensors: Applications, Challenges, and Future Scope. Biosensors 2021, 11, 336. [Google Scholar] [CrossRef]
- Zhu, C.; Yang, G.; Li, H.; Du, D.; Lin, Y. Electrochemical Sensors and Biosensors Based on Nanomaterials and Nanostructures. Anal. Chem. 2015, 87, 230–249. [Google Scholar] [CrossRef] [PubMed]
- Gutiérrez-Capitán, M.; Baldi, A.; Fernández-Sánchez, C. Electrochemical Paper-Based Biosensor Devices for Rapid Detection of Biomarkers. Sensors 2020, 20, 967. [Google Scholar] [CrossRef]
- Noviana, E.; McCord, C.P.; Clark, K.M.; Jang, I.; Henry, C.S. Electrochemical paper-based devices: Sensing approaches and progress toward practical applications. Lab Chip 2020, 20, 9–34. [Google Scholar] [CrossRef] [PubMed]
- Rivnay, J.; Inal, S.; Salleo, A.; Owens, R.M.; Berggren, M.; Malliaras, G.G. Organic electrochemical transistors. Nat. Rev. Mater. 2018, 3, 17086. [Google Scholar] [CrossRef]
- Zeglio, E.; Inganäs, O. Active Materials for Organic Electrochemical Transistors. Adv. Mater. 2018, 30, 1800941. [Google Scholar] [CrossRef]
- Ohayon, D.; Druet, V.; Inal, S. A guide for the characterization of organic electrochemical transistors and channel materials. Chem. Soc. Rev. 2023, 52, 1001–1023. [Google Scholar] [CrossRef]
- Hu, Z.; Hu, Y.; Huang, L.; Zhong, W.; Zhang, J.; Lei, D.; Chen, Y.; Ni, Y.; Liu, Y. Recent Progress in Organic Electrochemical Transistor-Structured Biosensors. Biosensors 2024, 14, 330. [Google Scholar] [CrossRef] [PubMed]
- Lu, Z.; Xu, K.; Xiao, K.; Xu, Q.; Wang, L.; Li, P.; Zhou, J.; Zhao, D.; Bai, L.; Cheng, Y.; et al. Biomolecule sensors based on organic electrochemical transistors. npj Flex. Electron. 2025, 9, 9. [Google Scholar] [CrossRef]
- Liu, H.; Song, J.; Zhao, Z.; Zhao, S.; Tian, Z.; Yan, F. Organic Electrochemical Transistors for Biomarker Detections. Adv. Sci. 2024, 11, e2305347. [Google Scholar] [CrossRef]
- Kukhta, N.A.; Marks, A.; Luscombe, C.K. Molecular Design Strategies toward Improvement of Charge Injection and Ionic Conduction in Organic Mixed Ionic-Electronic Conductors for Organic Electrochemical Transistors. Chem. Rev. 2022, 122, 4325–4355. [Google Scholar] [CrossRef]
- Aftab, S.; Zhou, J.; Cheng, Y.; Zhao, D.; Chen, H.; Huang, W. Functional gate modification for OECT-based sensors. Mater. Today Chem. 2025, 48, 102933. [Google Scholar] [CrossRef]
- Zhao, C.; Yang, J.; Ma, W. Transient Response and Ionic Dynamics in Organic Electrochemical Transistors. Nano-Micro Lett. 2024, 16, 233. [Google Scholar] [CrossRef]
- Yang, J.; Cai, Y.; Zhou, Y.; Zhang, C.; Liang, P.; Zhao, B.; Shao, J.; Fu, N.; Huang, W.; Dong, X. Highly effective thieno [2,3-b]indole-diketopyrrolopyrrole near-infrared photosensitizer for photodynamic/photothermal dual mode therapy. Dyes Pigments 2017, 147, 270–282. [Google Scholar] [CrossRef]
- Zhang, S.S.; Xia, C.; Wang, J.; Chen, S.; Wang, Y.; Zhang, S.S.; Geng, Z.; Tang, K.; Erdem, A.; Zhu, B. Ready-to-Use OECT Biosensor toward Rapid and Real-Time Protein Detection in Complex Biological Environments. ACS Sens. 2025, 10, 3369–3380. [Google Scholar] [CrossRef]
- Currano, L.J.; Sage, F.C.; Hagedon, M.; Hamilton, L.; Patrone, J.; Gerasopoulos, K. Wearable Sensor System for Detection of Lactate in Sweat. Sci. Rep. 2018, 8, 15890. [Google Scholar] [CrossRef]
- He, Y.; Kukhta, N.A.; Marks, A.; Luscombe, C.K. The effect of side chain engineering on conjugated polymers in organic electrochemical transistors for bioelectronic applications. J. Mater. Chem. C 2022, 10, 2314–2332. [Google Scholar] [CrossRef]
- Montero-Jimenez, M.; Lugli-Arroyo, J.; Fenoy, G.E.; Piccinini, E.; Knoll, W.; Marmisollé, W.A.; Azzaroni, O. Transduction of Amine–Phosphate Supramolecular Interactions and Biosensing of Acetylcholine through PEDOT-Polyamine Organic Electrochemical Transistors. ACS Appl. Mater. Interfaces 2023, 16, 61419–61427. [Google Scholar] [CrossRef]
- Fenoy, G.E.; Scotto, J.; Allegretto, J.A.; Piccinini, E.; Cantillo, A.L.; Knoll, W.; Azzaroni, O.; Marmisollé, W.A. Layer-by-Layer Assembly Monitored by PEDOT-Polyamine-Based Organic Electrochemical Transistors. ACS Appl. Electron. Mater. 2022, 4, 5953–5962. [Google Scholar] [CrossRef]
- Khodagholy, D.; Rivnay, J.; Sessolo, M.; Gurfinkel, M.; Leleux, P.; Jimison, L.H.; Stavrinidou, E.; Herve, T.; Sanaur, S.; Owens, R.M.; et al. High transconductance organic electrochemical transistors. Nat. Commun. 2013, 4, 2133. [Google Scholar] [CrossRef] [PubMed]
- Fan, J.; Forero Pico, A.A.; Gupta, M. A functionalization study of aerosol jet printed organic electrochemical transistors (OECTs) for glucose detection. Mater. Adv. 2021, 2, 7445–7455. [Google Scholar] [CrossRef]
- Wang, Y.; Qing, X.; Zhou, Q.; Zhang, Y.; Liu, Q.; Liu, K.; Wang, W.; Li, M.; Lu, Z.; Chen, Y.; et al. The woven fiber organic electrochemical transistors based on polypyrrole nanowires/reduced graphene oxide composites for glucose sensing. Biosens. Bioelectron. 2017, 95, 138–145. [Google Scholar] [CrossRef]
- Keene, S.T.; Fogarty, D.; Cooke, R.; Casadevall, C.D.; Salleo, A.; Parlak, O. Wearable Organic Electrochemical Transistor Patch for Multiplexed Sensing of Calcium and Ammonium Ions from Human Perspiration. Adv. Healthc. Mater. 2019, 8, e1901321. [Google Scholar] [CrossRef]
- Demuru, S.; Kunnel, B.P.; Briand, D. Thin film organic electrochemical transistors based on hybrid PANI/PEDOT:PSS active layers for enhanced pH sensing. Biosens. Bioelectron. X 2021, 7, 100065. [Google Scholar] [CrossRef]
- Decataldo, F.; Grumiro, L.; Marino, M.M.; Faccin, F.; Giovannini, C.; Brandolini, M.; Dirani, G.; Taddei, F.; Lelli, D.; Tessarolo, M.; et al. Fast and real-time electrical transistor assay for quantifying SARS-CoV-2 neutralizing antibodies. Commun. Mater. 2022, 3, 5. [Google Scholar] [CrossRef]
- Montero-Jimenez, M.; Neyra Recky, J.R.; von Bilderling, C.; Scotto, J.; Azzaroni, O.; Marmisollé, W.A. PEDOT: Tosylate-polyamine-based enzymatic organic electrochemical transistors for high-performance glucose biosensing in human urine samples. J. Electroanal. Chem. 2025, 978, 118867. [Google Scholar] [CrossRef]
- Neyra Recky, J.R.; Montero-Jimenez, M.; Scotto, J.; Azzaroni, O.; Marmisollé, W.A. Urea Biosensing through Integration of Urease to the PEDOT-Polyamine Conducting Channels of Organic Electrochemical Transistors: pH-Change-Based Mechanism and Urine Sensing. Chemosensors 2024, 12, 124. [Google Scholar] [CrossRef]
- Tian, Z.; Zhao, Z.; Yan, F. Organic electrochemical transistor in wearable bioelectronics: Profiles, applications, and integration. Wearable Electron. 2024, 1, 1–25. [Google Scholar] [CrossRef]
- Piro, B.; Mattana, G.; Zrig, S.; Anquetin, G.; Battaglini, N.; Capitao, D.; Maurin, A.; Reisberg, S. Fabrication and Use of Organic Electrochemical Transistors for Sensing of Metabolites in Aqueous Media. Appl. Sci. 2018, 8, 928. [Google Scholar] [CrossRef]
- Wang, Y.; Xiong, C.; Qu, H.; Chen, W.; Ma, A.; Zheng, L. Highly sensitive real-time detection of tyrosine based on organic electrochemical transistors with poly-(diallyldimethylammonium chloride), gold nanoparticles and multi-walled carbon nanotubes. J. Electroanal. Chem. 2017, 799, 321–326. [Google Scholar] [CrossRef]
- Fenoy, G.E.; von Bilderling, C.; Knoll, W.; Azzaroni, O.; Marmisollé, W.A. PEDOT:Tosylate-Polyamine-Based Organic Electrochemical Transistors for High-Performance Bioelectronics. Adv. Electron. Mater. 2021, 7, 2100059. [Google Scholar] [CrossRef]
- Rivnay, J.; Leleux, P.; Ferro, M.; Sessolo, M.; Williamson, A.; Koutsouras, D.A.; Khodagholy, D.; Ramuz, M.; Strakosas, X.; Owens, R.M.; et al. High-performance transistors for bioelectronics through tuning of channel thickness. Sci. Adv. 2015, 1, e1400251. [Google Scholar] [CrossRef]
- Doris, S.E.; Pierre, A.; Street, R.A. Dynamic and Tunable Threshold Voltage in Organic Electrochemical Transistors. Adv. Mater. 2018, 30, e1706757. [Google Scholar] [CrossRef]
- Kassahun, G.; Ahmad, N.A.B.; Danzé, F.; Pecastaings, G.; Leyney, M.; Mantione, D.; Salinas, G.; Kuhn, A.; Thuau, D.; Abbas, M. Polymerization-Charge Controlled Threshold Voltage Tunability in Organic Electrochemical Transistors. Adv. Electron. Mater. 2025, 00357, e00357. [Google Scholar] [CrossRef]
- Tan, S.T.M.; Lee, G.; Denti, I.; LeCroy, G.; Rozylowicz, K.; Marks, A.; Griggs, S.; McCulloch, I.; Giovannitti, A.; Salleo, A. Tuning Organic Electrochemical Transistor Threshold Voltage using Chemically Doped Polymer Gates. Adv. Mater. 2022, 34, e2202359. [Google Scholar] [CrossRef]
- Tan, S.T.M.; Keene, S.; Giovannitti, A.; Melianas, A.; Moser, M.; McCulloch, I.; Salleo, A. Operation mechanism of organic electrochemical transistors as redox chemical transducers. J. Mater. Chem. C 2021, 9, 12148–12158. [Google Scholar] [CrossRef]
- Schafer, E.A.; Wu, R.; Meli, D.; Tropp, J.; Moser, M.; McCulloch, I.; Paulsen, B.D.; Rivnay, J. Sources and Mechanism of Degradation in p-Type Thiophene-Based Organic Electrochemical Transistors. ACS Appl. Electron. Mater. 2022, 4, 1391–1404. [Google Scholar] [CrossRef]
- Zhang, S.; Ding, P.; Ruoko, T.; Wu, R.; Stoeckel, M.; Massetti, M.; Liu, T.; Vagin, M.; Meli, D.; Kroon, R.; et al. Toward Stable p-Type Thiophene-Based Organic Electrochemical Transistors. Adv. Funct. Mater. 2023, 33, 1391–1404. [Google Scholar] [CrossRef]
- Wang, Y.; Wustoni, S.; Surgailis, J.; Zhong, Y.; Koklu, A.; Inal, S. Designing organic mixed conductors for electrochemical transistor applications. Nat. Rev. Mater. 2024, 9, 249–265. [Google Scholar] [CrossRef]
- Yu, S.; Ratcliff, E.L. Tuning Organic Electrochemical Transistor (OECT) Transconductance toward Zero Gate Voltage in the Faradaic Mode. ACS Appl. Mater. Interfaces 2021, 13, 50176–50186. [Google Scholar] [CrossRef]
- Montero-Jimenez, M.; Amante, F.L.; Fenoy, G.E.; Scotto, J.; Azzaroni, O.; Marmisolle, W.A. PEDOT-Polyamine-Based Organic Electrochemical Transistors for Monitoring Protein Binding. Biosensors 2023, 13, 288. [Google Scholar] [CrossRef] [PubMed]
- Marks, A.; Griggs, S.; Gasparini, N.; Moser, M. Organic Electrochemical Transistors: An Emerging Technology for Biosensing. Adv. Mater. Interfaces 2022, 9, 2102039. [Google Scholar] [CrossRef]
- Gualandi, I.; Tessarolo, M.; Mariani, F.; Arcangeli, D.; Possanzini, L.; Tonelli, D.; Fraboni, B.; Scavetta, E. Layered Double Hydroxide-Modified Organic Electrochemical Transistor for Glucose and Lactate Biosensing. Sensors 2020, 20, 3453. [Google Scholar] [CrossRef] [PubMed]
- Tang, K.; Turner, C.; Case, L.; Mehrehjedy, A.; He, X.; Miao, W.; Guo, S. Organic Electrochemical Transistor with Molecularly Imprinted Polymer-Modified Gate for the Real-Time Selective Detection of Dopamine. ACS Appl. Polym. Mater. 2022, 4, 2337–2345. [Google Scholar] [CrossRef]
- Liao, C.; Mak, C.; Zhang, M.; Chan, H.L.W.; Yan, F. Flexible Organic Electrochemical Transistors for Highly Selective Enzyme Biosensors and Used for Saliva Testing. Adv. Mater. 2015, 27, 676–681. [Google Scholar] [CrossRef]
- Wang, N.; Yang, A.; Fu, Y.; Li, Y.; Yan, F. Functionalized Organic Thin Film Transistors for Biosensing. Acc. Chem. Res. 2019, 52, 277–287. [Google Scholar] [CrossRef]
- Fenoy, G.E.; Azzaroni, O.; Knoll, W.; Marmisollé, W.A. Functionalization Strategies of PEDOT and PEDOT:PSS Films for Organic Bioelectronics Applications. Chemosensors 2021, 9, 212. [Google Scholar] [CrossRef]
- Shoaie, N.; Daneshpour, M.; Azimzadeh, M.; Mahshid, S.; Khoshfetrat, S.M.; Jahanpeyma, F.; Gholaminejad, A.; Omidfar, K.; Foruzandeh, M. Electrochemical sensors and biosensors based on the use of polyaniline and its nanocomposites: A review on recent advances. Microchim. Acta 2019, 186, 465. [Google Scholar] [CrossRef]
- Wang, Z.; Liu, M.; Zhao, Y.; Chen, Y.; Noureen, B.; Du, L.; Wu, C. Functional Organic Electrochemical Transistor-Based Biosensors for Biomedical Applications. Chemosensors 2024, 12, 236. [Google Scholar] [CrossRef]
- Gao, N.; Yu, J.; Tian, Q.; Shi, J.; Zhang, M.; Chen, S.; Zang, L. Application of pedot:Pss and its composites in electrochemical and electronic chemosensors. Chemosensors 2021, 9, 79. [Google Scholar] [CrossRef]
- Paasch, G.; Scheinert, S.; Herasimovich, A.; Hörselmann, I.; Lindner, T. Characteristics and mechanisms of hysteresis in polymer field-effect transistors. Phys. Status Solidi 2008, 205, 534–548. [Google Scholar] [CrossRef]
- Scotto, J.; Florit, M.I.; Posadas, D. pH dependence of the voltammetric response of Polyaniline. J. Electroanal. Chem. 2017, 785, 14–19. [Google Scholar] [CrossRef]
Disclaimer/Publisher’s Note: The statements, opinions and data contained in all publications are solely those of the individual author(s) and contributor(s) and not of MDPI and/or the editor(s). MDPI and/or the editor(s) disclaim responsibility for any injury to people or property resulting from any ideas, methods, instructions or products referred to in the content. |
© 2026 by the authors. Licensee MDPI, Basel, Switzerland. This article is an open access article distributed under the terms and conditions of the Creative Commons Attribution (CC BY) license.