Abstract
Hexagonal ZnO nanowires were grown using the PLD/VLS technique on a SAW sensor active area for hydrogen sensing. The influence of different carbon and nitrogen surface contaminant concentrations on sensor output was investigated for three active area cases: a few weeks’ exposure to free ambient air contamination, 3 h at 600 °C thermal desorption of carbon, and (room temperature) plasma-activated nitrogen and carbon contamination. Correlations between sensing performance and contamination element concentration were established. To understand the adsorption versus absorption mechanisms, similar studies were further performed on circular ZnO nanowires morphology, which have a different surface-area-to-volume ratio. Comparative results show that, while a 20% carbon surface contamination variation generates a variation of 3–5% in nanostructure hydrogen sorption, nitrogen surface contamination influence depends on nanostructure morphology. Thus, in our comparative studies, for the case of a nanowire hexagonal cross-section a 12% nitrogen surface contamination variation generates a 5–7% increase in hydrogen adsorption and also an increase of 6–8% in hydrogen absorption. Consequently, the catalytic effect of nitrogen could enlarge the linear response of nanowire-based (SAW) sensors over a wider hydrogen concentration range.
1. Introduction
Hydrogen is a key factor for future energy solutions but there are safety-related issues which have to be addressed, due to the flammable nature of hydrogen in the 4–75% concentration range at atmospheric pressure. Thus, detecting hydrogen concentrations between 0.01% and 10% rapidly and accurately is crucial to alert to the formation of dangerous mixtures [1]. Many groups are currently investigating the reliable detection of low concentrations of hydrogen using inexpensive sensors. As an active medium material, ZnO is widely investigated for gas sensors, but the particular case of hydrogen sensors has faced several limitations. For example, earlier devices suffered from insufficient sensitivity at low H2 concentrations and poor selectivity in mixed-gas environments, often necessitating elevated operating temperatures [2]. Recent efforts address these issues by leveraging nanoscale ZnO architectures and material modifications. Furthermore, previous studies have shown that a high surface-area-to-volume ratio is desirable for achieving a high sensitivity, by dramatically increasing the density of reactive sites, improving hydrogen adsorption and sensor response [3], particularly in the case of Surface Acoustic Wave (SAW) sensors [4]. Additionally, defect engineering (e.g., creating oxygen vacancies or other surface or sub-surface defects) and catalytic doping strategies have been shown to enhance performance. Introducing selected dopants (such as Pd or rare-earth elements) into or onto ZnO can promote H2 dissociation and provide additional active sites, yielding higher response and even helping tailor the sensor’s selectivity [3,5]. However, ZnO nanowire surface is easily contaminated under ambient conditions (left in contact with air at room temperature) and, apart from the water vapors (composed of hydrogen and oxygen, both relevant to the hydrogen detection process), the most common element are carbon and nitrogen. Carbon contamination of a surface is known to have a slightly negative impact on hydrogen adsorption, since carbon sites interact weakly with hydrogen molecules and cannot dissociate it on their own [6,7]. On the other hand, studies have shown that the presence of nitrogen in carbon materials such as graphene, carbon nanotubes, or carbon xerogels enhances hydrogen adsorption [8,9,10] by lowering the dissociation energy of the hydrogen molecule [6,11]. Furthermore, the combined effect of metals and N-doped carbon materials on hydrogen sorption has been studied [9,12]. Both ZnO and nitrogen substituted carbon materials can dissociatively adsorb hydrogen, so both surfaces can contribute to hydrogen sorption, and, consequently, to the sensing process.
In order to study and possibly overcome past limitations in ZnO hydrogen sensing, in the present studies we employ two types of ZnO nanowires: one with a tailored hexagonal cross-section and a limited number of crystal defects enabling a dual adsorption–absorption sensing mechanism and another one with cylindrical cross-section single-crystal nanowires with a dominant surface adsorption-based mechanism. Based on SAW sensors with such different ZnO nanostructure morphologies, the present study experimentally investigates the influence of carbon and nitrogen surface contamination of the active surface on hydrogen sensing processes and performance.
2. Materials and Methods
ZnO nanowires were grown by Vapor–Liquid–Solid (VLS) technique (Figure 1b) on a quartz substrate, using laser ablation as a particle source (Figure 1a). Sintered ZnO powder targets were used. The third harmonic (355 nm) of an Nd:YAG pulsed laser with 400 kHz repetition rate was used to ablate the target in an atmosphere of oxygen (1 Pa). Gold was pre-deposited on the quartz substrate. The VLS growth proceeds through the nucleation of nanowires from liquid gold catalyst drops (Figure 1b), formed on the substrate upon heating. Impinging particles from the ablation plume are collected into the gold catalyst and when a critical particle concentration is achieved, ZnO nucleates underneath the catalyst drop, forming a nanowire. This approach is known to provide a reasonable control over the growth morphology [13]. We should, however, emphasize that plasma reflection techniques were also used in order to filter out relatively large particles produced by the laser ablation process, particles which could potentially inhibit the catalyst growing process [13]. Details on this plasma filtering technique have been described elsewhere [14].
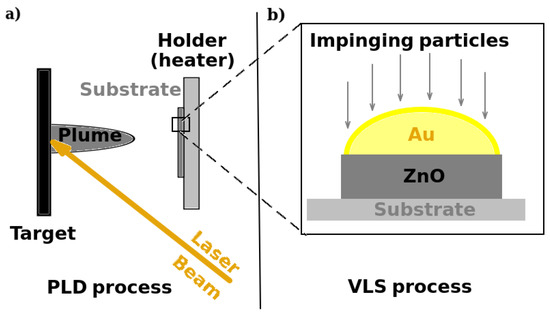
Figure 1.
(a) Pulsed Laser Ablation setup and (b) VLS nanowire growing process.
In order to detect and monitor the hydrogen sorption of the structures, these nanowires were grown on the (quartz) active area of a Surface Acoustic Wave (SAW). Sensor is placed in an ambient controlled atmosphere chamber (with constant temperature and humidity) where a gas controller is regulating hydrogen concentration into the chamber, and a detailed scheme of the sensor measurement setup is presented elsewhere [4]. Theoretical [15] and experimental investigations [16,17] show that the concentration of molecules adsorbed by the sensing film (and, respectively, sorbed mass) is proportional to the resulting frequency shift of the sensor oscillator circuit. At reasonably low gas concentrations (of hydrogen in our case), a SAW sensor should provide a linear response (frequency shift recorded by the frequency counter) with the monitored gas concentration. Thus, the sorbed hydrogen mass (relative) variation could be monitored by simply monitoring the frequency shift of the sensor oscillator circuit.
To monitor influence of surface contamination on sensor sensitivity, measurements of the sensor frequency shift variation with hydrogen concentration were performed in three cases: (i) for a 5-week air-contaminated ZnO grown surface, (ii) after a thermal treatment in air of the surface, and (iii) after treating the surface in hydrogen (cold) plasma. In the first case, the as-deposited samples were stored in ambient condition (and consequently contaminated) for several weeks before measurement was performed. For the second case the sample was heated at 600 °C for about 3 h and then cooled down at room temperature before performing the measurements, to desorb (part of) the contaminants. For the third case, the sample was exposed to a low-temperature plasma jet in Argon/Hydrogen [18], exposure performed at room temperature. Plasma treatments conditions were 100 W RF power, duration 30 min, working pressure at about 7 Pa, ambient gas of Ar/H2 mixture (gases mass flow 100/50 sccm), and a weak air flow. Optical Emission Spectroscopy (OES) investigation has confirmed [19] the excited species of argon, Hβ line of hydrogen and many nitrogen-based species that come from the air presence in our Ar/H2 plasma. Furthermore, in order to confirm the nitrogen lines’ presence, we additionally introduced 5 more sccm of nitrogen in the chamber, and the amplification of nitrogen bands is visible (See Supplementary Materials in Figure S1) by comparing extra nitrogen and treatment condition spectra.
3. Results
An SEM image of the grown nanowire morphology is presented in Figure 2, and the inset shows that the grown nanowires have a hexagonal cross-section. An X-ray diffraction investigation of the sample has shown that ZnO grows along the (001) direction, while no other crystalline structure (beside the Quartz substrate) has been noticed here (Figure 3). Photoluminescence investigations found a peak centered on about 376 nm, slightly below the theoretical one (of ~380 nm), which is suggesting the presence of a limited number of potential structural defects.
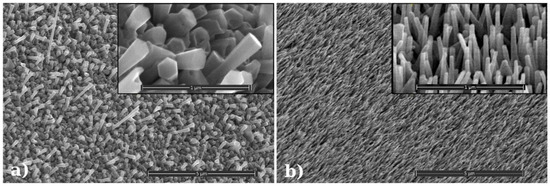
Figure 2.
SEM image of nanowire morphology for (a) hexagonal nanowires and (b) circular nanowires.
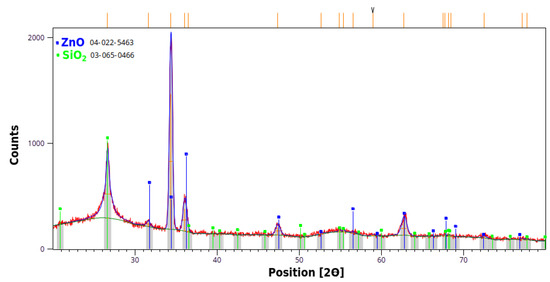
Figure 3.
XRD patterns acquired from the ZnO nanowires on a Quartz substrate (red line) green—diffraction lines assigned to quartz (SiO2); blue—diffraction lines assigned to ZnO.
Frequency shift of the sensor with the hydrogen concentration for the three cases are presented in Figure 4. As it can be seen, while a small improvement of the sensor response (increase of the frequency shift) was obtained after the thermal treatment, a significant improvement (up to 25%) of the sensor response was obtained just after the plasma treatment case. While surface morphology was similar to the original one after both treatments, we focused our investigation on the nanostructure surface treatment-induced changes.
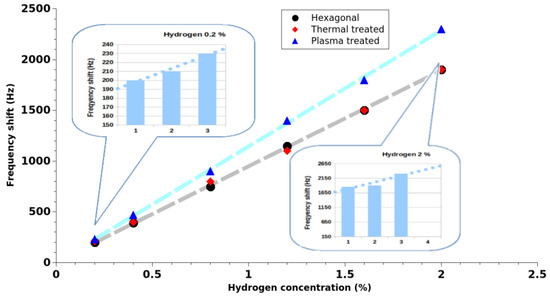
Figure 4.
SAW sensor response with hexagonal nanowire morphology after each surface treatment step.
An X-ray Photoelectron Spectroscopy (XPS) investigation on the active area surface after each detection measurement was performed and the results are presented for such a hexagonal nanowire morphology in Figure 5. The peaks in the survey spectrum correspond to four chemical elements: Zn, O, N, and C. While the Zn and O are the structure elements, C corresponds to contamination from the air and plasma treatment; the presence of nitrogen only on the plasma-treated nanowires can be explained by the reaction between activated nitrogen species and the surface of the nanowires. Hydrogen plasma can activate nitrogen molecules by collisions, leading to their dissociation [20]. The dissociated nitrogen atoms can then react with the adsorbed carbon species or with the ZnO, where they may occupy oxygen lattice positions [21], thus forming the C-N and Zn-N bonds found by XPS analysis. Atomic film surface composition is summarized in Table 1.
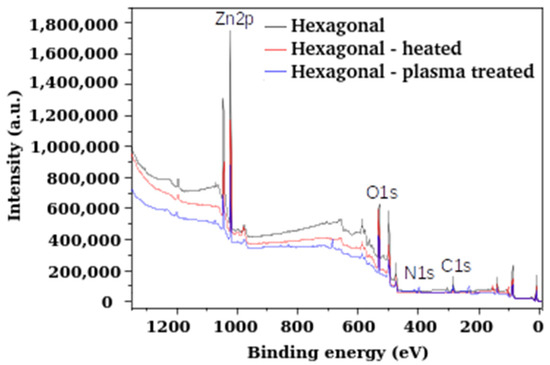
Figure 5.
XPS survey scan results on the hexagonal ZnO nanowires after each surface treatment.

Table 1.
C, O, Zn, and N atomic concentration in hexagonal ZnO nanowire layer according to XPS measurements.
In a more detailed investigation of each element, we could notice that C 1s region could be de-convoluted in four peaks: one located at 284.7 eV and attributed to C in C-C bonds, one at 286 eV attributed to C in C-O bonds, one at 287.2.7 eV attributed to C in C=O bonds, and one at 288.7 eV attributed to C in O-C=O bonds [22]. In Figure 6a, the deconvolution is exemplified for the initial sample. After the thermal treatment, a decrease in carbon species is observed from the C 1s spectra, followed by an increase after the plasma treatment. In the case of the plasma-treated sample, the peaks at 286 eV and 287 eV could be attributed to both C-N and C-O bonds, as the values reported in literature for C-N bonds overlap with those for C-O bonds [9,23]. Thus, C-N content of the sample was estimated from the N 1s deconvolution, while the C-O content was estimated as the difference between the total C-N + C-O content minus the C-N content, and the evolution of chemical states after each treatment is summarized in Figure 6b.
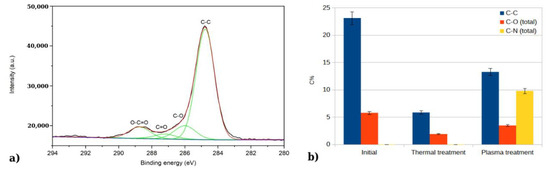
Figure 6.
(a) C1s peak deconvolution for the initial hexagonal morphology ZnO nanowire sample, green line—fitted peaks, red line—overall fit; and (b) summary of the carbon states after each treatment step.
The O 1s spectra has been deconvoluted in three peaks: one at 530.1 eV, attributed to lattice oxygen (oxygen bound to Zn) [24,25], one at 531.4 eV, attributed to adsorbed oxygen or oxygen species, such as carbon oxides, hydroxides [21], or lattice oxygen near stoichiometric defects [26], and one at 532.5 eV, attributed to adsorbed water [27]. Chemical states for the initial sample are presented in Figure 7a. Similar processing of the oxygen peak performed after the treatments are showing that after thermal treatment, there is an increase in the total oxygen present on the surface, (Figure 7b) and the oxygen present as adsorbed species amounts to 54% of the total atomic concentration, compared to the 23% present in the initial sample. Since there is a reduction in carbon content after the thermal treatment, the increase in the adsorbed oxygen species cannot be attributed to carbon oxides, but to an increase in adsorbed oxygen or water vapors. Plasma treatment results in a decrease in adsorbed oxygen species, from 54% to 35% atomic concentration.
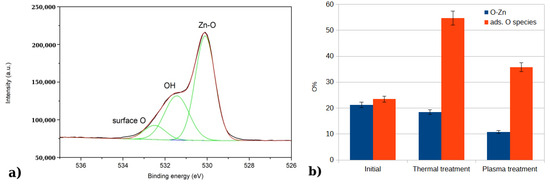
Figure 7.
(a) O1s peak deconvolution for the initial hexagonal morphology ZnO nanowire sample, green line—fitted peaks, red line—overall fit; and (b) summary of the O states after each treatment step.
The N 1s region (Figure 8) is only significantly present in the XPS spectrum of the plasma-treated sample. This region has been fitted with four peaks at 395.9 eV, 397.7 eV and 399.5 eV, and 401 eV corresponding to N in N-Zn bonds [21,26], N in pyridinic N-C bonds, N in pyrrolic N-C bonds, and N in graphitic N-C bonds [6].
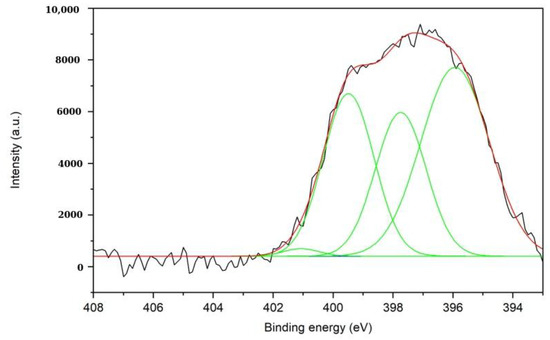
Figure 8.
N1s peak deconvolution for the hexagonal morphology ZnO nanowire sample after plasma treatment, green line—fitted peaks, red line—overall fit.
In order to understand sensor response to different hydrogen concentrations after each treatment, we must consider hydrogen interaction with the surface contaminants. First, hydrogen adsorption on ZnO must be considered. Hydrogen is adsorbed on ZnO at room temperature through dissociation, forming O-H and Zn-H bonds [28,29]. The dissociated hydrogen can then migrate inside the ZnO structure through subsurface diffusion, in interstitial positions or occupying lattice vacancies [30]. Migration of hydrogen inside the ZnO structure is also supported by the high mobility of intersitital hydrogen [31]. Therefore, hydrogen can be both adsorbed and absorbed in ZnO. The sum of adsorbed and absorbed hydrogen creates a positive mass difference that gives rise to a frequency shift of the surface acoustic wave detected by the sensor.
Surface contaminants can cause changes and can even impede the adsorption of hydrogen on ZnO. For example, carbon impurities have a negative influence on hydrogen adsorption since carbon sites are unable to activate the hydrogen molecule towards dissociation on their own [6]. This is because the hydrogen molecule interacts weakly with C-C bonds [7]. This adsorption is weaker than the hydrogen sorption on ZnO, since ZnO can dissociate the hydrogen molecule [32]. This explains the slight increase in frequency shift (correspondent to an increase in hydrogen sorption) after the surface carbon desorption caused by the thermal treatment. When it comes to nitrogen, it has been shown [6,8,10] that the presence of nitrogen in different carbon materials actually enhances hydrogen sorption by lowering the dissociation energy of the hydrogen molecule [6,11]. XPS confirmed the presence of such nitrogen atoms (pyrrolic, pyridinic, and graphitic nitrogen) on the surface of our sensors. Hydrogen molecules activated at the nitrogen sites can further be transferred to the neighboring carbon sites [6]. A general scheme of the adsorption and migration processes of hydrogen on the ZnO surface is presented in Figure 9. The presence of surface nitrogen has a clearly positive impact on the sensitivity of our SAW sensor, as it can be seen in the case of the plasma-treated sensor (Figure 4) with a 12.91% surface nitrogen content (Table 1).
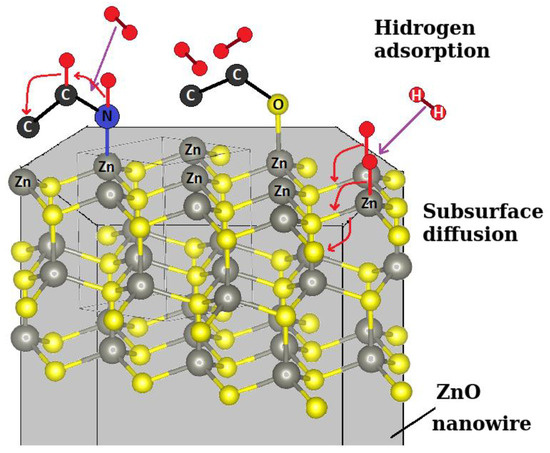
Figure 9.
Hydrogen adsorption and migration into ZnO nanowires. H atoms—red, C atoms—black, N atoms—blue, O atoms—yellow, Zn atoms—grey, red arrows—migration of H atoms.
Now, the question is whether or not we can distinguish between contaminant contribution within analyte adsorption and the absorption process. In order to try to answer this question, by using the same nanowire growing techniques and same SAW sensor-based (relative) evaluation of the hydrogen mass, we have grown a slightly different ZnO nanowire morphology, with a smaller diameter and, respectively, a circular cross-section, in order to compare the contaminant influence on a different surface-to-volume ratio active area surface.
An SEM image of the SAW sensor active layer morphology for a circular morphology is presented in Figure 2b. As one could see, its diameter (between 30 and 60 nm, with an average of 47 nm) is about 6–7 times smaller than the hexagonal ZnO nanowire diameter (between 175 and 236 nm, with an average of 209 nm). Luminescence comparative investigations of both circular and hexagonal structures were also performed using an UV excitation source; a luminescence peak rather identical with the theoretical one (~380 nm—Figure 10 suggests a ‘perfect’ ZnO crystal structure of the circular nanowires, while the hexagonal nanowires had their peak slightly deviated from the theoretical one, showing the presence of some structural defects.
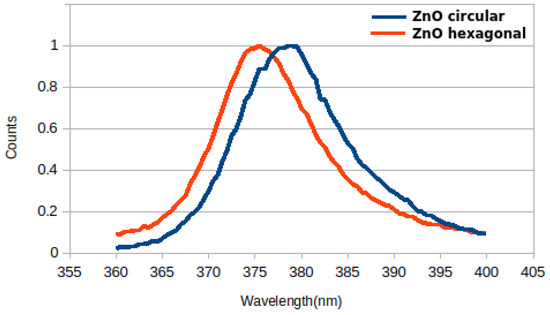
Figure 10.
Comparative normalized luminescence of hexagonal versus circular ZnO nanowires.
Response of the circular ZnO nanowires SAW sensor to different hydrogen concentration after each treatment step (performed in similar conditions with the previous hexagonal sample) is presented in Figure 11. It could be remarked here that sensor response has a clear saturation trend at least for initial and thermally treated cases, similar with previous [4,7] reports. Corroborating the significant increase in nanostructure surface to volume ratio and the increase in the circular nanowire crystallinity, we could roughly consider that the hydrogen sorption process in this case is mostly an adsorption process [4], explaining the saturation trend at relatively low hydrogen concentrations. We have performed XPS surface investigations in a similar way as for the hexagonal nanowire case while focusing our investigations on the carbon and nitrogen states variations after each treatment step.
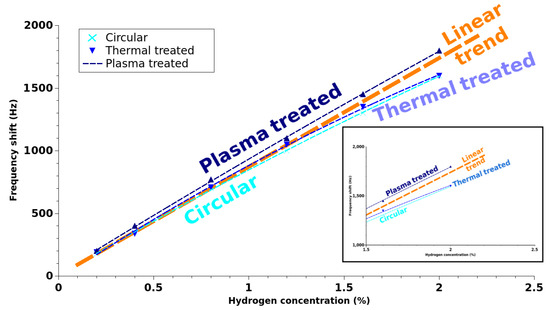
Figure 11.
Circular nanowire SAW sensor response after each surface treatment.
The C 1s region of the ZnO circular nanowire sample presents a similar four peaks structure after deconvolution and it has been assigned the same way as for the hexagonal nanowires. The deconvolution for the untreated sample is presented in Figure 12a. Similarly to the hexagonal nanowires, carbon content decreases on the circular nanowires after thermal treatment, and increases after plasma treatment, as shown by the data obtained through deconvolution in Figure 12b.
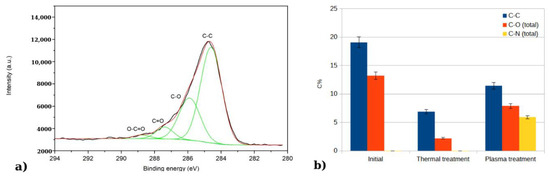
Figure 12.
(a) C1s peak deconvolution for the initial circular morphology ZnO nanowire sample, green line—fitted peaks, red line—overall fit; and (b) summary of the carbon states after each treatment step.
The N 1s region is again significant only in the case of the plasma-treated nanowires, and it has been deconvoluted (Figure 13) into the same four peaks found for the plasma-treated hexagonal nanowires.
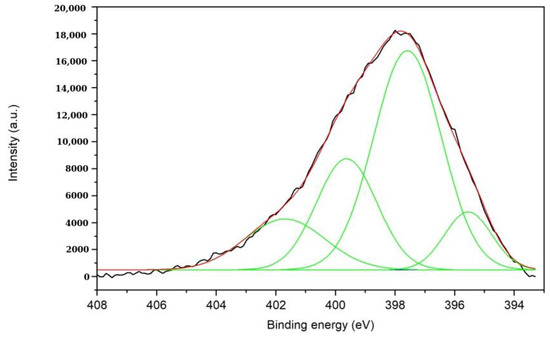
Figure 13.
N1s peak deconvolution for the circular morphology ZnO nanowire sample after plasma treatment, green line—fitted peaks, red line—overall fit.
Elemental concentration variation of the circular ZnO nanowire sample after each treatment is summarized in Table 2. It could be noticed that, after each processing step, circular nanowires have a similar carbon contamination concentration with the hexagonal nanowire. This should correspond to similar carbon desorption (in thermal treatment) and adsorbtion (in plasma treatment) of the two-nanowire morphology. However, a double nitrogen concentration after the plasma treatment has been obtained on the circular nanowire morphology in comparison with the hexagonal one.
Table 2.
C and N concentration in circular ZnO nanowire layer according to XPS measurements.
4. Discussion
By comparing the sensor response for the two morphologies, we should start from the fact that the response of the circular nanowire SAW sensors tends to saturate to rather low hydrogen concentrations (Figure 11), while the hexagonal morphology does not (Figure 4). The hexagonal morphology nanowires have a considerably lower surface to volume ratio change (estimated to about 3000 times) and their structure has a higher potential number of structural defects compared to the circular ones. The higher response of the hexagonal nanowires sensor to hydrogen, along with their larger volume and larger number of structural defects, supports the presence of a hydrogen absorption process into the ZnO structure. Thus, if we approximate hydrogen sorption process of the circular nanowires as an adsorption process, then in the hexagonal case we will have to consider a combination of ‘adsorption’ and ‘absorption’ processes.
The second remark while comparing the sensor responses after different treatments is the fact that carbon presence has a comparable influence for both morphologies: Thus, a 21–23% carbon increase will generate a 3–5% increase of the sorbed hydrogen mass, regardless of the ZnO nanowire morphology section: circular or hexagonal. However, in the case of nitrogen, the influence is different; if for the hexagonal case a 12% increase will produce a 15–25% increase in the hydrogen mass sorption for the circular morphology case, a 24% increase of the nitrogen percent increase will produce just a 11–16% increase in the sorbed hydrogen mass. While approximating the sorption process of the ZnO circular nanowire as adsorption and approximating that the increase of the nitrogen sites will quasi-proportionally increase hydrogen molecules’ splitting probability and consequently the surface adsorption process, we could speculate that from the hexagonal nanowire 15–25% increase of the hydrogen sorbed mass, only about 5–7% will represent the enhancement of the adsorption process while the rest of 6–8% will represent an increase of the absorption process. This idea is supported on one side by the known catalytic effect of nitrogen and the higher potential number of absorption sites considered for the hexagonal structure in comparison with the circular one, and on the other hand is supported by the ‘more linear’ hexagonal nanowire sensor response to high hydrogen concentrations, behavior associated with the absorption process of the bulk (thin film) ZnO materials [4]. Thus, nitrogen catalytic effect might actually be a way of extending the linear response of the ZnO nanowire-based SAW sensor response to higher concentrations of hydrogen and, respectively, the usability of ZnO nanowire-based sensors for a wider analyte concentration range.
The influence of nitrogen and carbon surface contamination on the sensing properties of ZnO-based hydrogen sensors has been widely explored, with previous reports providing insights into both beneficial and detrimental impacts of these contaminants. For instance, controlled nitrogen doping in ZnO was demonstrated to significantly enhance hydrogen detection capabilities due to increased chemical adsorption of hydrogen molecules [33]. Conversely, carbon contamination, frequently encountered as an uncontrolled impurity, generally adsorbs onto the ZnO surface, interfering negatively by reducing the availability of active sites essential for hydrogen sensing [21,34]. Our experimental findings align with these previously reported phenomena and extend the current understanding by highlighting that simultaneous nitrogen and carbon contamination positively affects the hydrogen adsorption and chemisorption processes on ZnO nanowires, leading to increased sensitivity. These results corroborate findings by Zhang et al. [21], which indicated that nitrogen atoms bonded with carbon contaminants combine their effectiveness as active acceptor sites. Thus, controlling the surface purity of ZnO nanostructures is critical for optimizing their performance in hydrogen sensing applications.
5. Conclusions
In conclusion, our experimental study results on the most common air contaminant elements, carbon and nitrogen, on hydrogen sorption into ZnO nanostructures, are suggesting that their combined influence might actually enhance hydrogen sorption into the structure. If carbon has a slight inhibiting effect on the hydrogen adsorption process by its own, nitrogen catalytic effect, shown particularly in the presence of carbon materials, could enhance not only hydrogen adsorption but also the absorption process if the ZnO nanostructure permits it. Thus, such mixed contamination could actually extend the linear response range of the ZnO nanowire-based SAW sensor over a larger concentration range, in particular for hydrogen, by enhancing the absorption process into the structure and potentially having a positive contribution to hydrogen sensing applications.
Supplementary Materials
The following supporting information can be downloaded at: https://www.mdpi.com/article/10.3390/chemosensors13060197/s1, Figure S1: OES spectra of Ar/H2 plasma (black curve) and with additionally nitrogen (red curve) [35]; Figure S2: SEM image of a hexagonal nanowire area heated for 150 minutes at 600°C; Figure S3: SEM image of plasma-treated hexagonal nanowires.
Author Contributions
Conceptualization: A.M., S.V. and C.V.; methodology: C.V. and S.V.; structural and morphological investigations: V.C. and M.D.; sample preparation: R.M., A.M. and S.V.; sensor measurements, C.V.; chemico-physical investigations: V.S., M.B. and C.C.; writing—original draft preparation: A.M.; writing—review and editing, A.M., C.V. and S.V. All authors have read and agreed to the published version of the manuscript.
Funding
We acknowledge funds through a grant of the Romanian Ministry of Education and Research, CNCS-UEFISCDI, PCE 93/2021 and support of National Interest Infrastructure facility IOSIN—CETAL National Institute for Lasers, Plasma and Radiation Physics, Program contract No. 39/2024, Romanian National Core Program LAPLAS VII contract No. 30N/2023.
Institutional Review Board Statement
Not applicable.
Informed Consent Statement
Not applicable.
Data Availability Statement
The data are included in the article.
Conflicts of Interest
The authors declare no conflicts of interest.
References
- Hübert, T.; Boon-Brett, L.; Black, G.; Banach, U. Hydrogen sensors—A review. Sens. Actuators B Chem. 2011, 157, 329–352. [Google Scholar] [CrossRef]
- Lupan, C.; Mishra, A.K.; Wolff, N.; Tarasov, A.; Ursaki, V.V.; Sontea, V.; Shree, S.; Paulowicz, I.; Schuhmann, W.; Polonskyi, O.; et al. Nanosensors Based on a Single ZnO:Eu Nanowire for Hydrogen Gas Sensing. ACS Appl. Mater. Interfaces 2022, 14, 41196–41207. [Google Scholar] [CrossRef] [PubMed]
- Kim, J.-H.; Mirzaei, A.; Kim, H.W.; Kim, S.S. Pd Functionalization on ZnO Nanowires for Enhanced Sensitivity and Selectivity to Hydrogen Gas. Sens. Actuators B Chem. 2019, 297, 126693. [Google Scholar] [CrossRef]
- Marcu, A.; Viespe, C. Laser-Grown ZnO Nanowires for Room-Temperature SAW-Sensor Applications. Sens. Actuators B Chem. 2015, 208, 1–6. [Google Scholar] [CrossRef]
- Prakash, C.; Chaurasiya, R.; Kale, A.J.; Dixit, A. Low-Temperature Highly Robust Hydrogen Sensor Using Pristine ZnO Nanorods with Enhanced Response and Selectivity. ACS Omega 2022, 7, 28206–28216. [Google Scholar] [CrossRef] [PubMed]
- Sankaran, M.; Viswanathan, B. The Role of Heteroatoms in Carbon Nanotubes for Hydrogen Storage. Carbon 2006, 44, 2816–2821. [Google Scholar] [CrossRef]
- Schimmel, H.G.; Kearley, G.J.; Nijkamp, M.G.; Visser, C.T.; de Jong, K.P.; Mulder, F.M. Hydrogen Adsorption in Carbon Nanostructures: Comparison of Nanotubes, Fibers, and Coals. Chem.—A Eur. J. 2003, 9, 4764–4770. [Google Scholar] [CrossRef]
- Zhu, Z.H.; Hatori, H.; Wang, S.B.; Lu, G.Q. Insights into Hydrogen Atom Adsorption on and the Electrochemical Properties of Nitrogen-Substituted Carbon Materials. J. Phys. Chem. B 2005, 109, 16744–16749. [Google Scholar] [CrossRef]
- Parambhath, V.B.; Nagar, R.; Ramaprabhu, S. Effect of Nitrogen Doping on Hydrogen Storage Capacity of Palladium Decorated Graphene. Langmuir 2012, 28, 7826–7833. [Google Scholar] [CrossRef]
- Kang, K.Y.; Lee, B.I.; Lee, J.S. Hydrogen Adsorption on Nitrogen-Doped Carbon Xerogels. Carbon 2009, 47, 1171–1180. [Google Scholar] [CrossRef]
- Zhang, Z.; Cho, K. Ab Initio Study of Hydrogen Interaction with Pure and Nitrogen-Doped Carbon Nanotubes. Phys. Rev. B 2007, 75, 075420. [Google Scholar] [CrossRef]
- Chen, G.; Luo, H.; Qian, W.; Dong, M.; Huang, W.; Dong, C. Metal- and Nitrogen-Codoped Carbon Nanotube Field Emitters for Low-Pressure Hydrogen Sensing. ACS Appl. Nano Mater. 2024, 7, 27264–27274. [Google Scholar] [CrossRef]
- Marcu, A.; Grigoriu, C.; Lungu, C.; Yanagida, T.; Kawai, T. Ablation Particles Parameters Influences on VLS Oxide Nanowire Growing. Phys. E Low-Dimens. Syst. Nanostruct. 2012, 44, 1071–1073. [Google Scholar] [CrossRef]
- Marcu, A.; Grigoriu, C.; Yatsui, K. Particles Interaction with Obstacles in a Pulsed Laser Deposition System. Appl. Surf. Sci. 2005, 248, 466–469. [Google Scholar] [CrossRef]
- Devkota, J.; Ohodnicki, P.R.; Greve, D.W. SAW Sensors for Chemical Vapors and Gases. Sensors 2017, 17, 801. [Google Scholar] [CrossRef]
- Ballantine, D.S.; White, R.M.; Martin, S.J.; Ricco, A.J.; Zellers, E.T.; Frye, G.C.; Wohltjen, H. Acoustic Wave Sensors: Theory, Design and Physico-Chemical Applications; Academic Press: San Diego, CA, USA, 1997. [Google Scholar]
- Mandal, D.; Banerjee, S. Surface Acoustic Wave (SAW) Sensors: Physics, Materials, and Applications. Sensors 2022, 22, 820. [Google Scholar] [CrossRef] [PubMed]
- Vizireanu, S.; Constantinoiu, I.; Satulu, V.; Stoica, S.D.; Viespe, C. High-Sensitivity H2 and CH4 SAW Sensors with Carbon Nanowalls and Improvement in Their Performance after Plasma Treatment. Chemosensors 2023, 11, 566. [Google Scholar] [CrossRef]
- Puliyalil, H.; Filipič, G.; Kovač, J.; Mozetič, M.; Thomas, S.; Cvelbar, U. Tackling Chemical Etching and Its Mechanisms of Polyphenolic Composites in Various Reactive Low Temperature Plasmas. RSC Adv. 2016, 6, 95120–95128. [Google Scholar] [CrossRef]
- Perillo, R.; Chandra, R.; Akkermans, G.R.A.; Vijvers, W.A.J.; Graef, W.A.A.D.; Classen, I.G.J.; van Dijk, J.; de Baar, M.R. Studying the Influence of Nitrogen Seeding in a Detached-like Hydrogen Plasma by Means of Numerical Simulations. Plasma Phys. Control. Fusion 2018, 60, 105004. [Google Scholar] [CrossRef]
- Zhang, H.; Li, W.; Qin, G.; Fang, L.; Ruan, H.; Tan, M.; Wu, F.; Kong, C. Effect of Surface Carbon Contamination on the Chemical States of N-Doped ZnO Thin Films. Appl. Phys. A 2018, 124, 147. [Google Scholar] [CrossRef]
- Chen, X.; Wang, X.; Fang, D. A Review on C1s XPS-Spectra for Some Kinds of Carbon Materials. Full-Nanotub. Carbon Nanostruct. 2020, 28, 1048–1058. [Google Scholar] [CrossRef]
- Lazar, P.; Mach, R.; Otyepka, M. Spectroscopic Fingerprints of Graphitic, Pyrrolic, Pyridinic, and Chemisorbed Nitrogen in N-Doped Graphene. J. Phys. Chem. C 2019, 123, 10695–10702. [Google Scholar] [CrossRef]
- Zhang, J.P.; Zhang, L.D.; Zhu, L.Q.; Zhang, Y.; Liu, M.; Wang, X.J.; He, G. ZnO:N Films Prepared by Annealing Sputtered Zinc Oxynitride Films at Different Temperatures. J. Appl. Phys. 2007, 102, 114903. [Google Scholar] [CrossRef]
- Henderson, J.D.; Payne, B.P.; McIntyre, N.S.; Biesinger, M.C. Enhancing Oxygen Spectra Interpretation by Calculating Oxygen Linked to Adventitious Carbon. Surf. Interface Anal. 2025, 57, 214–220. [Google Scholar] [CrossRef]
- Chen, T.; Liu, S.-Y.; Xie, Q.; Detavernier, C.; Meirhaeghe, R.L.; Qu, X.-P. The Effects of Deposition Temperature and Ambient on the Physical and Electrical Performance of DC-Sputtered n-ZnO/p-Si Heterojunction. Appl. Phys. A 2010, 98, 357–365. [Google Scholar] [CrossRef]
- Ayiania, M.; Smith, M.; Hensley, A.J.; Scudiero, L.; McEwen, J.-S.; Garcia-Perez, M. Deconvoluting the XPS Spectra for Nitrogen-Doped Chars: An Analysis from First Principles. Carbon 2020, 162, 528–544. [Google Scholar] [CrossRef]
- Eischens, R.P.; Pliskin, W.A.; Low, M.J. The infrared spectrum of hydrogen chemisorbed on zinc oxide. J. Catal. 1962, 1, 180–191. [Google Scholar] [CrossRef]
- Kokes, R.J.; Dent, A.L. Hydrogenation and isomerization over zinc oxide. In Advances in Catalysis; Elsevier: Amsterdam, The Netherlands, 1972; pp. 1–50. [Google Scholar]
- Becker, T.; Kunat, M.; Boas, C.; Burghaus, U.; Wöll, C. Interaction of hydrogen with metal oxides: The case of the polar ZnO (0 0 0 1) surface. Surf. Sci. 2001, 486, L502–L506. [Google Scholar] [CrossRef]
- Bang, J.; Chang, K.J. Diffusion and thermal stability of hydrogen in ZnO. Appl. Phys. Lett. 2008, 92, 132109. [Google Scholar] [CrossRef]
- Mun, B.S.; Liu, Z.; Motin, A.; Roy, P.C.; Kim, C.M. In Situ Observation of H2 Dissociation on the ZnO (0001) Surface under High Pressure of Hydrogen Using Ambient-Pressure XPS. Int. J. Hydrogen Energy 2018, 43, 8655–8661. [Google Scholar] [CrossRef]
- Sharma, S.X.; Kumar, A.; Sharma, G.; Naushad, M.; Dwivedi, R.K.; Alothman, Z.A.; Mola, G.T. Enhanced hy-drogen sensing response of nitrogen doped ZnO thin films. Sens. Actuators B Chem. 2019, 290, 29–36. [Google Scholar] [CrossRef]
- D’Mello, M.E.Z.; Dongale, T.D.; Pathan, H.M.; Kim, J.H.; Lokhande, C.D. Influence of metal catalysts and carbon-nitrogen impurities on the hydrogen sensing capabilities of ZnO derived from MOFs. ACS Appl. Mater. Interfaces 2022, 14, 8982–8991. [Google Scholar] [CrossRef]
- Vizireanu, S.; Stoica, S.D.; Luculescu, C.; Nistor, L.C.; Mitu, B.; Dinescu, G. Plasma Techniques for Nanostructured Carbon Materials Synthesis. A Case Study: Carbon Nanowall Growth by Low Pressure Expanding RF Plasma. Plasma Sources Sci. Technol. 2010, 19, 034016. [Google Scholar] [CrossRef]
Disclaimer/Publisher’s Note: The statements, opinions and data contained in all publications are solely those of the individual author(s) and contributor(s) and not of MDPI and/or the editor(s). MDPI and/or the editor(s) disclaim responsibility for any injury to people or property resulting from any ideas, methods, instructions or products referred to in the content. |
© 2025 by the authors. Licensee MDPI, Basel, Switzerland. This article is an open access article distributed under the terms and conditions of the Creative Commons Attribution (CC BY) license (https://creativecommons.org/licenses/by/4.0/).