You are currently viewing a new version of our website. To view the old version click .
Chemosensors
  • Article
  • Open Access

4 November 2025

Enhanced Room Temperature NO2 Detection by Carbon Nanofibers and Single-Walled Carbon Nanotubes: Experimental and Molecular Dynamics

,
,
,
,
,
,
,
,
and
1
Department of Chemistry and Chemical Engineering, Novosibirsk State Technical University, 20 K. Marx Ave., Novosibirsk 630073, Russia
2
Department of Environmental Engineering, College of Ocean Science and Engineering, Korea Maritime and Ocean University, 727 Taejong-ro, Yeongdo-gu, Busan 49112, Republic of Korea
3
Institute of Solid State Chemistry and Mechanochemistry, Siberian Branch of Russian Academy of Science, Kutateladze 18, Novosibirsk 630128, Russia
4
Nikolaev Institute of Inorganic Chemistry, Siberian Branch of Russian Academy of Science, Akad. Lavrent`eva Ave. 3, Novosibirsk 630090, Russia
This article belongs to the Section Applied Chemical Sensors

Abstract

This study explores the development of new room-temperature NO2 sensors utilizing carbon nanofibers (CNFs), single-walled carbon nanotubes (SWCNTs), and their hybrids with reduced graphite oxide (rGO), fabricated via a facile drop casting method with varying concentrations of carbon/ethanol mixtures. The concentration-dependent relation of sensor response to NO2 has been found. Comprehensive characterization techniques, including electron microscopy, Raman spectroscopy, optical microscopy, and X-ray diffraction were employed to analyze the sensing materials. Our results reveal that CNFs exhibit superior sensitivity, reaching −1.32%/ppm at an optimal suspension concentration of 1.5 mg/mL, outperforming SWCNTs. The creation of hybrid composites, specifically CNFs/rGO and SWCNTs/rGO, further enhances sensing performance due to synergistic effects. Molecular dynamics simulations revealed increased adsorption behavior of the CNFs/rGO hybrid sensing material. The fabricated devices, based on all-carbon composites, are effective and energy-efficient platforms for NO2 detection, offering promising solutions for environmental monitoring, the chemical industry, and industrial safety applications.

1. Introduction

The growth of the global industry and automobile fleet increases the emission of harmful gases into the atmosphere [,]. Even low concentrations of these gases have a negative impact on human health, which heightens the need for efficient, fast, and selective detection methods for toxic and fire-hazardous gases [,]. Despite the existence of various physicochemical methods of gas analysis, the development of devices for monitoring environmental and industrial environments remains relevant. One promising direction is the development of gas sensors [,,,,,,].
Gas sensing is one of the potential applications of carbon nanomaterials [,], along with their use in supercapacitors [,,], membranes [,], and metal composites [,], among others. For these materials there are two types of the most common sensors: chemiresistive [] and field-effect transistor [] sensors. Less common types include capacitive (chemicapacitive) sensors [], surface acoustic wave sensors [], optical fiber sensors [], and quartz crystal microbalance sensors []; the application of carbon nanomaterials in these areas has not been sufficiently investigated. The greatest attention is now paid to chemiresistive sensors due to their functionality, low cost, and simplicity.
Traditional semiconductor-based chemiresistive sensors have relatively low sensitivity and require high operating temperatures (above 200–250 °C) [], which consume energy, prevent integration into portable devices (including breath analyzers []), and increase fire and explosion hazards in some specific industrial fields (e.g., mining, chemical technology, etc.). Carbon nanomaterial-based sensors (such as carbon nanotubes, carbon nanofibers, graphene, reduced graphene oxide, etc.) are a promising alternative. Although they are stable in the range of 25–250 °C [], they are more commonly used for room temperature sensing applications [,]. These sensors are usually superior to semiconductor sensors in terms of response rate [] and detection limits, which can reach tens to hundreds of ppb [] in some cases.
The main target gases for such devices are NH3 [,,,,,,,], NO2 [,], CH4 [], H2 [], H2S [,,,], CO2 [], and others. The development of sensors for key hazardous compounds, such as ammonia, hydrocarbons, nitrogen dioxide, and volatile organic compounds is especially promising. Detection of nitrogen dioxide (NO2) is critical because its accumulation in plants is harmful to personnel, and the gas itself causes corrosion of equipment. Therefore, the goal is to create a sensor with maximum sensitivity and response to NO2.
There are a lot of materials used for creation of NO2 gas sensors. Among carbon nanomaterials for NO2 sensors, carbon nanofibers (CNFs) are promising due to their structure and properties [,,,], as well as several advantages: higher yield and lower cost compared to carbon nanotubes (CNTs) and the possibility of obtaining them in the form of granules [,,]. The films of carbon nanomaterials are deposited on sensor substrates via spin coating [,,], drop casting [,], chemical vapor deposition (CVD), and plasma-enhanced chemical vapor deposition (PECVD) [,]. Despite numerous publications devoted to NO2 gas sensors based on carbon nanotubes or carbon nanofibers, the role of the sensing preparation technique in the formation of a wide range of characteristics (response, response time, limit of detection, signal-to-noise ratio) remains unclear. Moreover, issues related to the control of preparation parameters, as well as film thickness and morphology, are of great interest for the enhancement of sensor response. In particular, the issue of concentration-dependent impact during the drop-casting process of creating sensing material on the substrate has not been considered in the existing papers.
This paper is dedicated to investigating the role of the concentration of SWCNTs/ethanol and CNFs/ethanol suspensions during drop-casting deposition of the sensing material. The concentration-dependent NO2 response curves were obtained. The entire set of sensor characteristics, such as response, response time, sensitivity, and signal-to-noise ratio, has been analyzed in terms of the impact of the concentration of carbon nanomaterial suspensions used for drop-casting. An approach to enhancing the sensing behavior of both materials through the creation of hybrids with reduced graphite oxide (rGO) is proposed.

2. Materials and Methods

2.1. Carbon Nanomaterials

NO2 gas sensors were fabricated using two types of carbon nanomaterials: single-walled carbon nanotubes and carbon nanofibers. For the nanotube-based sensors, commercial single-walled carbon nanotubes (SWCNTs) (TUBALL™, OCSiAl Co., Novosibirsk, Russia) with a metal impurity content of less than 1 wt.% were used []. Carbon nanofibers were synthesized via catalytic methane decomposition in a vibrofluidized bed reactor at 550 °C and 1 atm, using a 90%Ni/10%Al2O3 catalyst. The detailed synthesis procedure is described in []. The high concentration of the active component (Ni) resulted in a granulated material (1–5 mm in diameter) composed of intertwined CNFs. The material was preliminarily ground in an agate mortar to achieve a particle size below 100 μm (passing through a sieve of the specified mesh size).
Additionally, to enhance the sensing performance of SWCNTs and CNFs, hybrid materials were fabricated. Reduced graphite oxide was used as a secondary component in the gas sensor preparation. Graphite oxide (GO) was synthesized via modified Hummers’ method [] and subsequently reduced to rGO through heat treatment under the following conditions: heating from room temperature to 350 °C at a rate of 15 K/min, followed by a 55 min holding at 350°C.

2.2. Acid Treatment of SWCNTs

The acid treatment of SWCNTs was necessary to enable sensor fabrication using the drop-casting technique, primarily due to their poor suspension-forming ability in ethanol. Preliminary experiments showed the poor dispersibility of this material in an untreated state. Prior to use, the SWCNTs were treated with 65% HNO3 at 25 °C for 2 h. The samples were then washed with distilled water until reaching pH 6–7, followed by drying in an oven (100 °C, 12 h).
In contrast, CNFs presented no difficulties for sensor creation via drop-casting and there is no any preliminary treatment used.

2.3. Characterization of Carbon Nanomaterials

The morphology of carbon nanomaterial-based films was characterized by scanning electron microscopy (SEM) using an S-3400N electron microscope (Hitachi, Chiyoda City, Japan). The structure of carbon nanomaterials was analyzed by transmission electron microscopy (TEM) with a JEM 2010 electron microscope (JEOL, Tokyo, Japan). The degree of disorder in the carbon nanomaterials was evaluated using Raman spectroscopy (Horiba Jobin Yvon T64000 (HORIBA, Kyoto, Japan), λ = 532 nm laser excitation), determined from the intensity ratio of the D and G bands (I(D)/I(G)) [,]. Specific surface area measurements were performed via low-temperature nitrogen adsorption (77 K) using a NOVA 1000e system (Quantachrome, Boynton Beach, FL, USA). Elemental composition (H, C, O, N, S) was determined using a EURO EA3000 CHNS analyzer (VELP, Usmate Velate, Italy). Atomic force microscopy (AFM) of CNF and SWCNT films was made using a Solver P47H (NT-MDT, Zelenograd, Russia) microscope with NSG-30 cantilever. The maximum area of scanning was 50 × 50 × 2 μm. Optical images of sensing films were obtained by a NM930-R (Nexcope, Ningbo, China) microscope.

2.4. Sensor Fabrication and Gas Sensing Tests

The material was ultrasonicated in ethanol (97% purity, 10 mL). The dispersion time was 80 min for SWCNTs and CNFs. In this paper, the idea was to change the sensing behavior of the materials by means of varying the concentration of carbon nanomaterial in ethanol followed by drop-casting. Ultrasonication of the suspension was carried out in ultrasonic bath U3/200 (RELTEK, Yekaterinburg, Moscow, Russia) with output power of 85 W and frequency of 22 kHz.
Three suspensions with different carbon nanomaterial concentrations (0.75–3.0 mg/mL) in ethanol were prepared using the above-listed technique. Further, the sensors based on hybrid materials were created. For creating CNFs/rGO and SWCNTs/rGO hybrid materials, suspensions containing mixtures of both components in ethanol were prepared with mass ratios of 25–75%. The total composite concentration in ethanol was maintained at 3.0 mg/mL.
The ethanol/carbon nanomaterial mixtures after ultrasonication were deposited using the drop-casting technique onto preliminary heated (80 °C) textolite substrates (1.5 × 1.5 cm) with pre-patterned copper electrodes (1.5 × 0.5 cm). The area of carbon deposition on the substrate was 1 × 1 cm (Figure 1).The carbon film was above the electrodes.
Figure 1. Drop-casting technique for the creation of a carbon film on the substrate.
The fabricated sensors were tested using a two-point measurement technique (Keithley 2401 Source Meter, Solon, OH, USA) placed in a gas cell in a special setup (dynamic type) with data acquisition performed through LabVIEW 2021 software. The experimental setup scheme is shown in Figure 2.
Figure 2. Scheme of setup for sensors testing at room temperature.
The gas sensing measurements employed two stepwise-introduced gases: (1) the analyte gas (0.05% NO2 in air) and (2) the carrier gas (synthetic air: 21 vol.% O2, 79 vol.% N2). Gas concentrations were precisely controlled using mass flow controllers. Initially, the testing chamber was purged with carrier gas at 1000 mL/min for 50 min to establish a stable baseline and remove any adsorbed gas molecules from the material surface. Subsequently, the analyte gas was introduced for 10 min, allowing NO2 adsorption and consequent changes in the sensor’s electrical resistance. This was followed by another 10 min carrier gas purge to initiate desorption. The error of concentration set by mass flow controllers was at the level of ±0.05 ppm (NO2).
Four complete adsorption–desorption cycles were measured at room temperature (25 ± 2 °C), with sensor responses characterized across a NO2 concentration range of 1.5–25 ppm.
The response ∆R/R0 [] of the gas sensors was defined using Equation (1).
R/R0 = (RR0)/R0,
where R represents the sensor resistance to the analyte gas, Ω, and R0 represents the initial sensor resistance in a synthetic air atmosphere, Ω. For clarity, the sensor response ∆R/R0 was shown moduli, but it should be taken into account that it has a negative value due to a lower-resistance sensor in NO2/air mixture compared to R0.
The gas sensors were tested under varying relative humidity conditions (2–75%). The humidity level inside the testing chamber was monitored in real time using an integrated humidity sensor (error was ±0.5%). Relative humidity (φ) was controlled by adjusting the flow rate ratio between dry air and air saturated with water vapor using mass flow controllers (Figure 2). Specifically, dry air and humid air (generated by passing through a water bubbler) were mixed in controlled proportions to achieve the desired φ level. The humidity inside the chamber was controlled with an HIH-4000 (Honeywell, Charlotte, NC, USA) sensor.
Response time (τ) and recovery degree were quantified as key performance metrics. The response time was defined as the duration required for the sensor to reach 90% of its maximum response during the 10 min analyte exposure period [,]. For improved accuracy, only the first NO2 exposure cycle was used for response time calculations. The recovery degree was calculated as the ratio of the final response to the initial response upon carrier gas reintroduction following analyte exposure, again using only the first NO2 exposure cycle for consistency. Sensitivity (in %/ppm) was calculated based on a linear fitting of the obtained data (∆R/R0 vs. NO2 concentration).

2.5. Computational Details

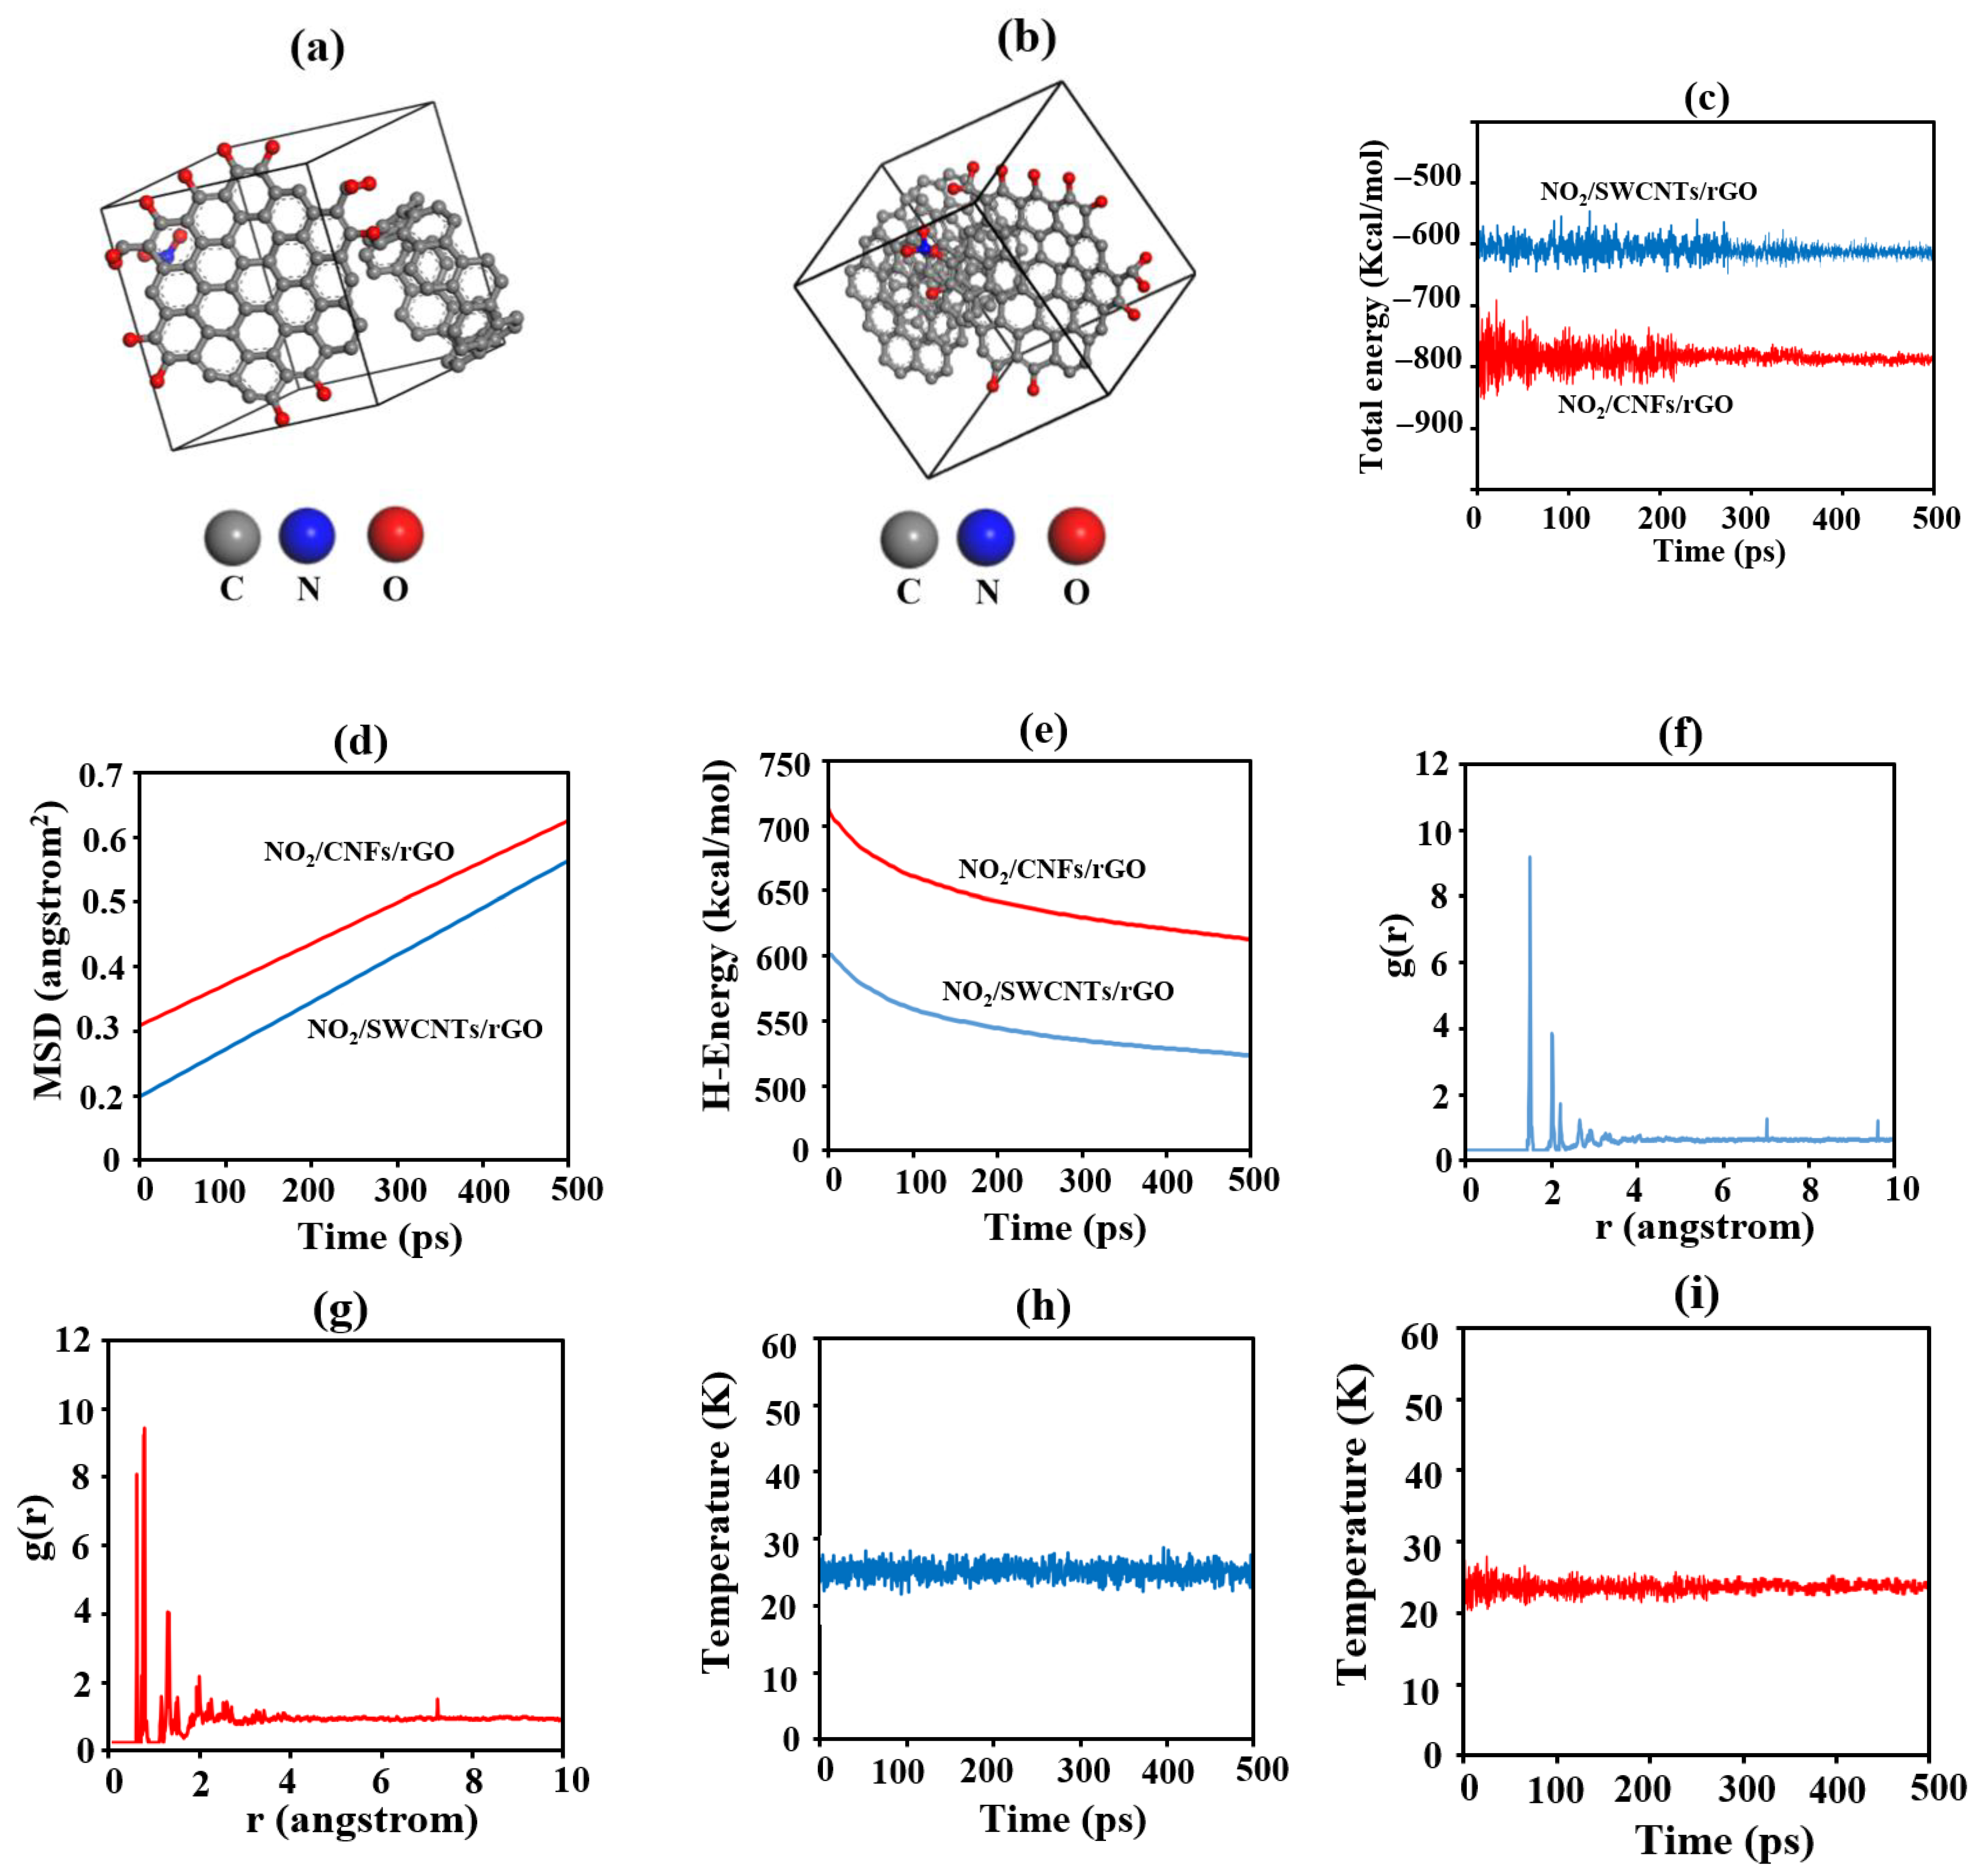
Molecular dynamics simulations were performed to investigate the interaction of NO2 molecules with CNFs/rGO and SWCNTs/rGO complexes. The initial structures of CNFs, SWCNTs, and rGO were constructed using Material Studio 2019, and NO2 molecules were positioned near the surface to allow adsorption studies. The simulations were carried out using the Forcite module with the COMPASS force field to accurately describe intermolecular interactions [,]. A cubic simulation cell was employed, and the systems were equilibrated under the NVT ensemble using the Nose–Hoover thermostat. The total simulation time was set to 500 ps with a time step of 1 fs, and trajectories were collected for analysis. The energy fluctuation curve showed that the system stabilized after ~300 ps, with minimal further changes, indicating that full adsorption equilibrium was achieved and adequately sampled within the simulation time. Various analyses such as energy fluctuation curves, mean square displacement (MSD), radial distribution function (RDF), and temperature fluctuations were calculated to evaluate adsorption behavior and stability.

3. Results and Discussion

3.1. Sensors Based on SWCNTs and CNFs

The main characteristics of SWCNTs and CNFs were given in Table 1.
Table 1. Main characteristics of CNFs and SWCNTs.
The average diameter of the CNFs was 44.9 ± 5.5 nm, which is significantly higher compared to SWCNTs. The length of the CNFs reached several microns. The Ni-catalyst nanoparticles are also shown in Figure 3a, where the fishbone structure is clearly visible. The CNFs are strongly entangled, as the catalytic nanoparticles moved and changed shape during their growth, caused by the formation of dense structures (Figure 3c). It is known that using a Ni-containing catalyst usually produces carbon nanofibers with a fishbone structure due to the shape of the catalyst []. The TEM images of TuballTM SWCNTs are presented in [,].
Figure 3. TEM images of CNFs at various magnifications.
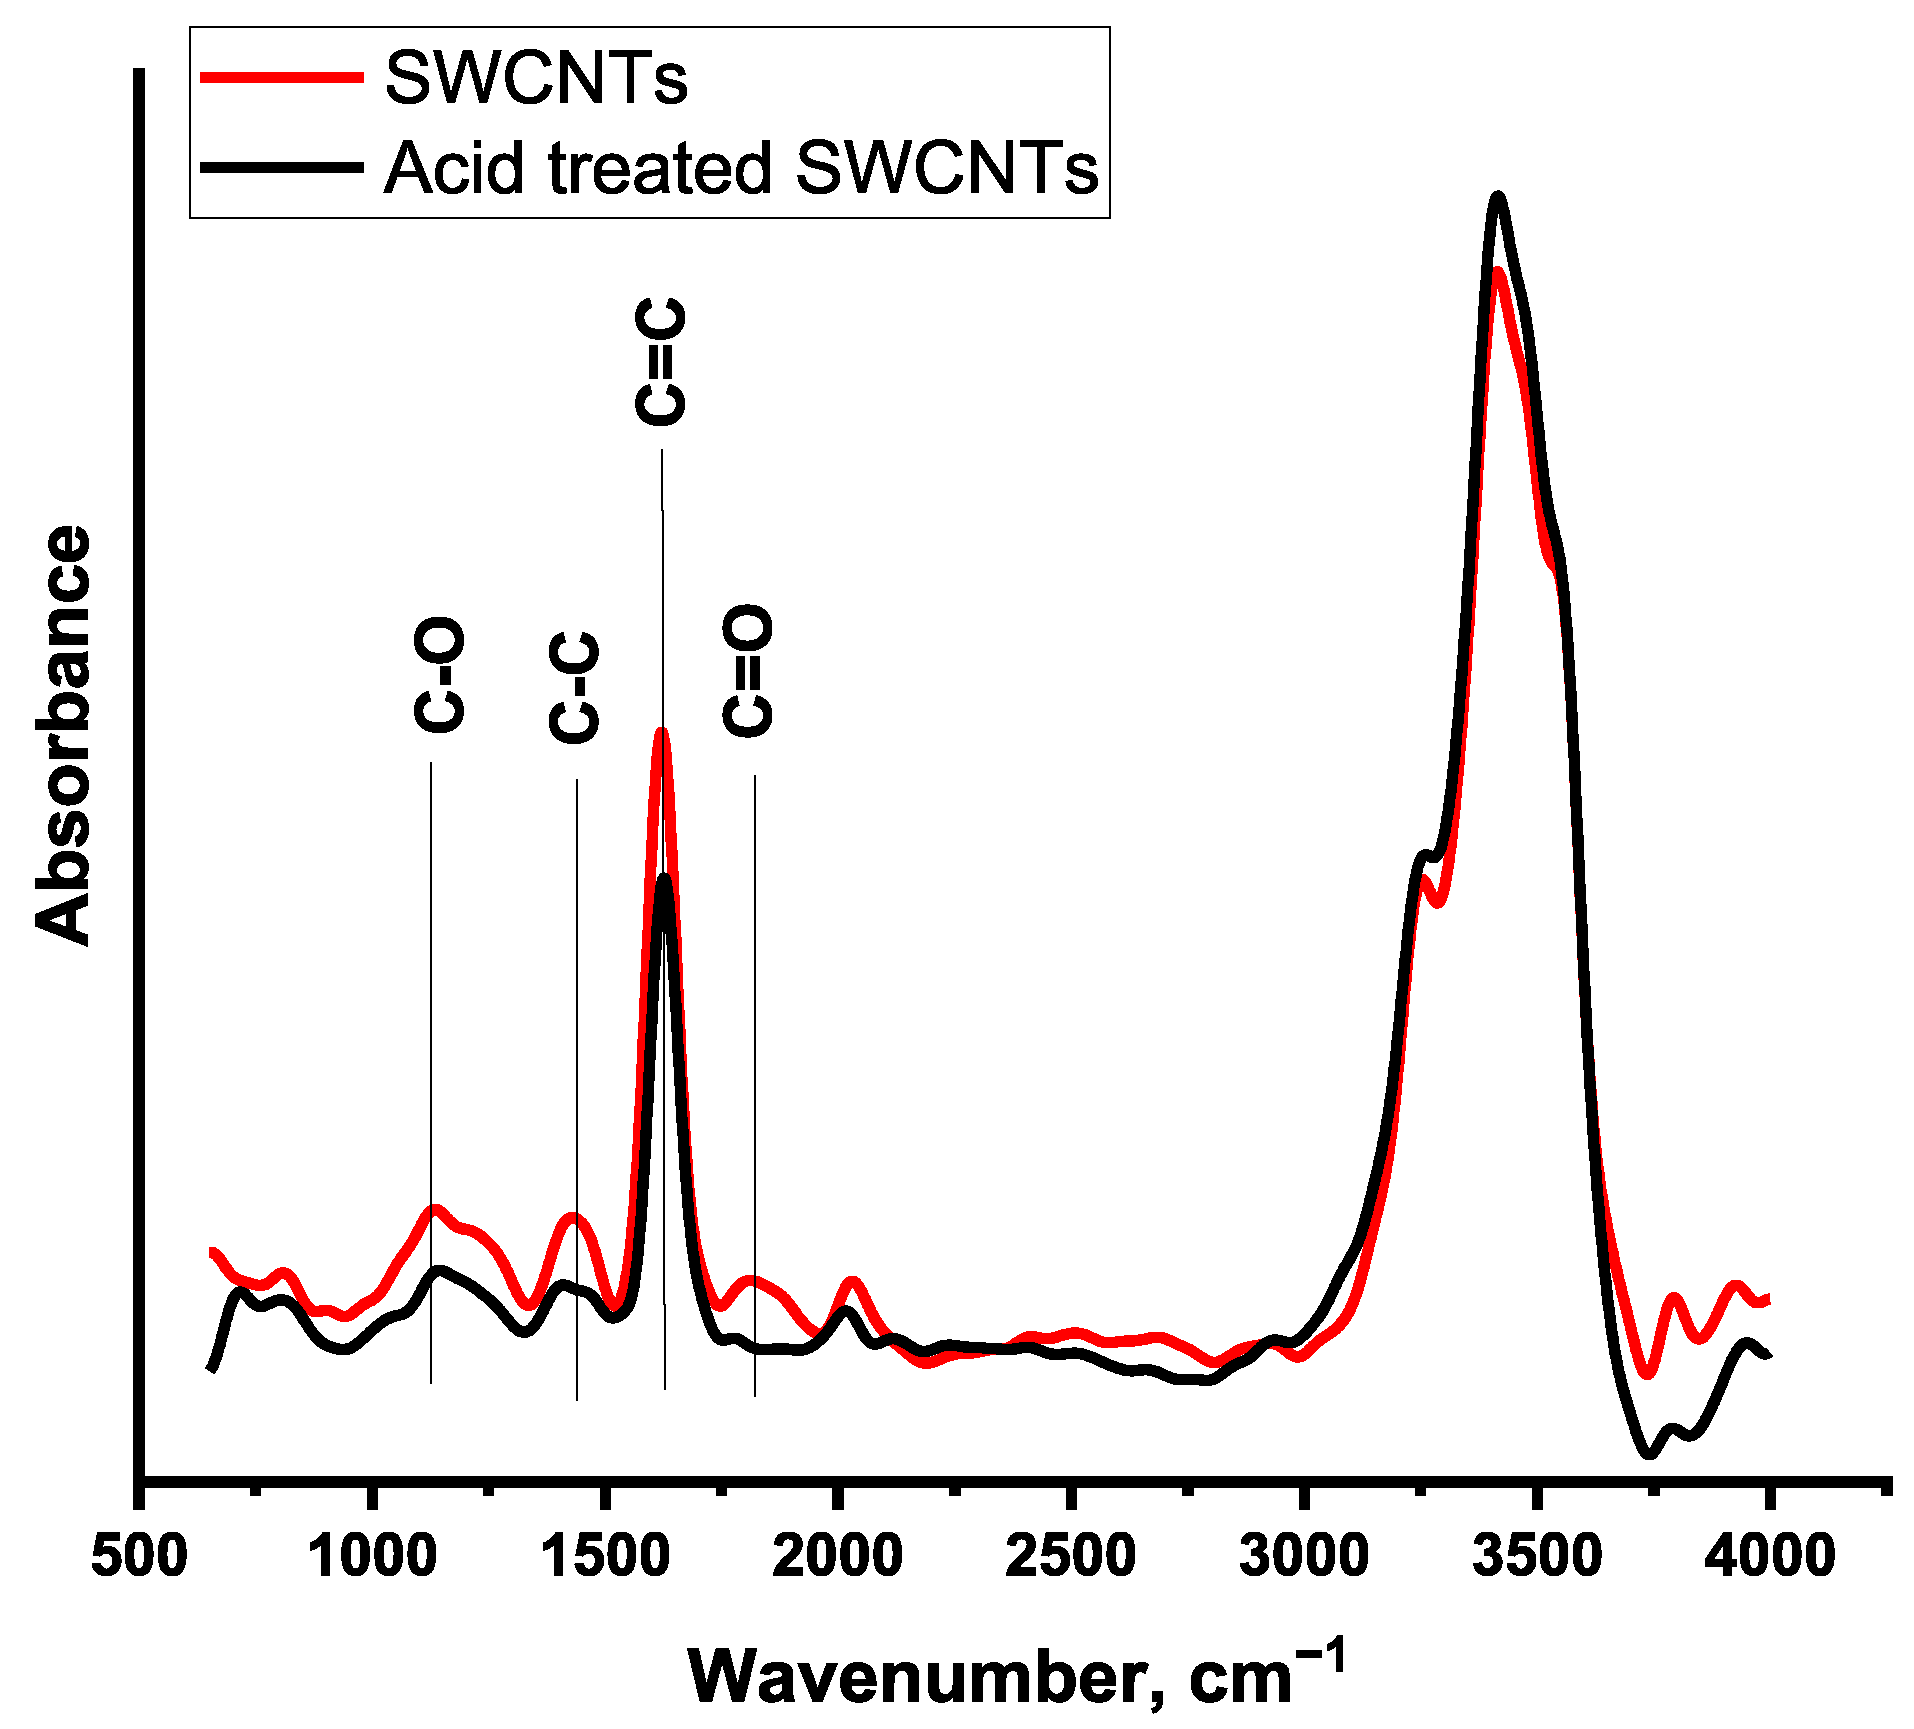
In the early stages of the study, it was found that the use of unmodified SWCNTs in suspension preparation did not lead to the expected result of homogeneous dispersion, which prevented the ability to obtain a high-quality film on the sensor using the drop-casting technique. The most appropriate solution was to use chemical treatment of SWCNTs to increase the oxygen content of the functional groups on their surface, enhancing their hydrophilicity for better dispersion in ethanol. It can be noted that CNFs require no treatment and meet the requirements for obtaining the sensor film. FTIR spectra of untreated and treated samples of SWCNTs are shown below (Figure 4).
Figure 4. FTIR spectra of the untreated SWCNTs and SWCNTs treated with HNO3.
From the FTIR spectra, it can be seen that, in general, the qualitative composition of the two materials is similar. When comparing the treated and untreated SWCNTs, it can be observed that the intensity of many vibrations of O-containing functional groups has increased, indicating that there was an increase in oxygen and nitrogen on the surface. Nitrogen in the untreated SWCNTs may have remained after their purification from the catalyst used by the producer. The main bands are 905 cm−1 (δ(N-H)), 1126 cm−1 (ν(C-O)), 1623 cm−1 (ν(C=C)), 1726 cm−1 (ν(C=O) in aldehydes), 1755 cm−1 (ν(C=O) in carboxyls), 1821 cm−1 (ν(C=O) in anhydrides), and 2800–3250 cm−1 (δ(O-H) in carboxyls) [,]. The oxidation of SWCNTs was confirmed by HCONS analysis (Table 2).
Table 2. The results of HCONS analysis (in wt.%).
HCONS analysis confirmed an increase in the oxygen content of carbon nanotubes. In addition, a small amount of nitrogen and hydrogen was observed, which may be due to the formation of –NO2 or –NH2 groups. An increase in the concentrations of oxygen and hydrogen was detected. Raman spectra of the SWCNTs before and after modification, as well as for CNFs, are presented in Figure S1 in Supplementary Materials and showed the decrease in I(G)/I(D) ratio from 35 to 19 after treatment.
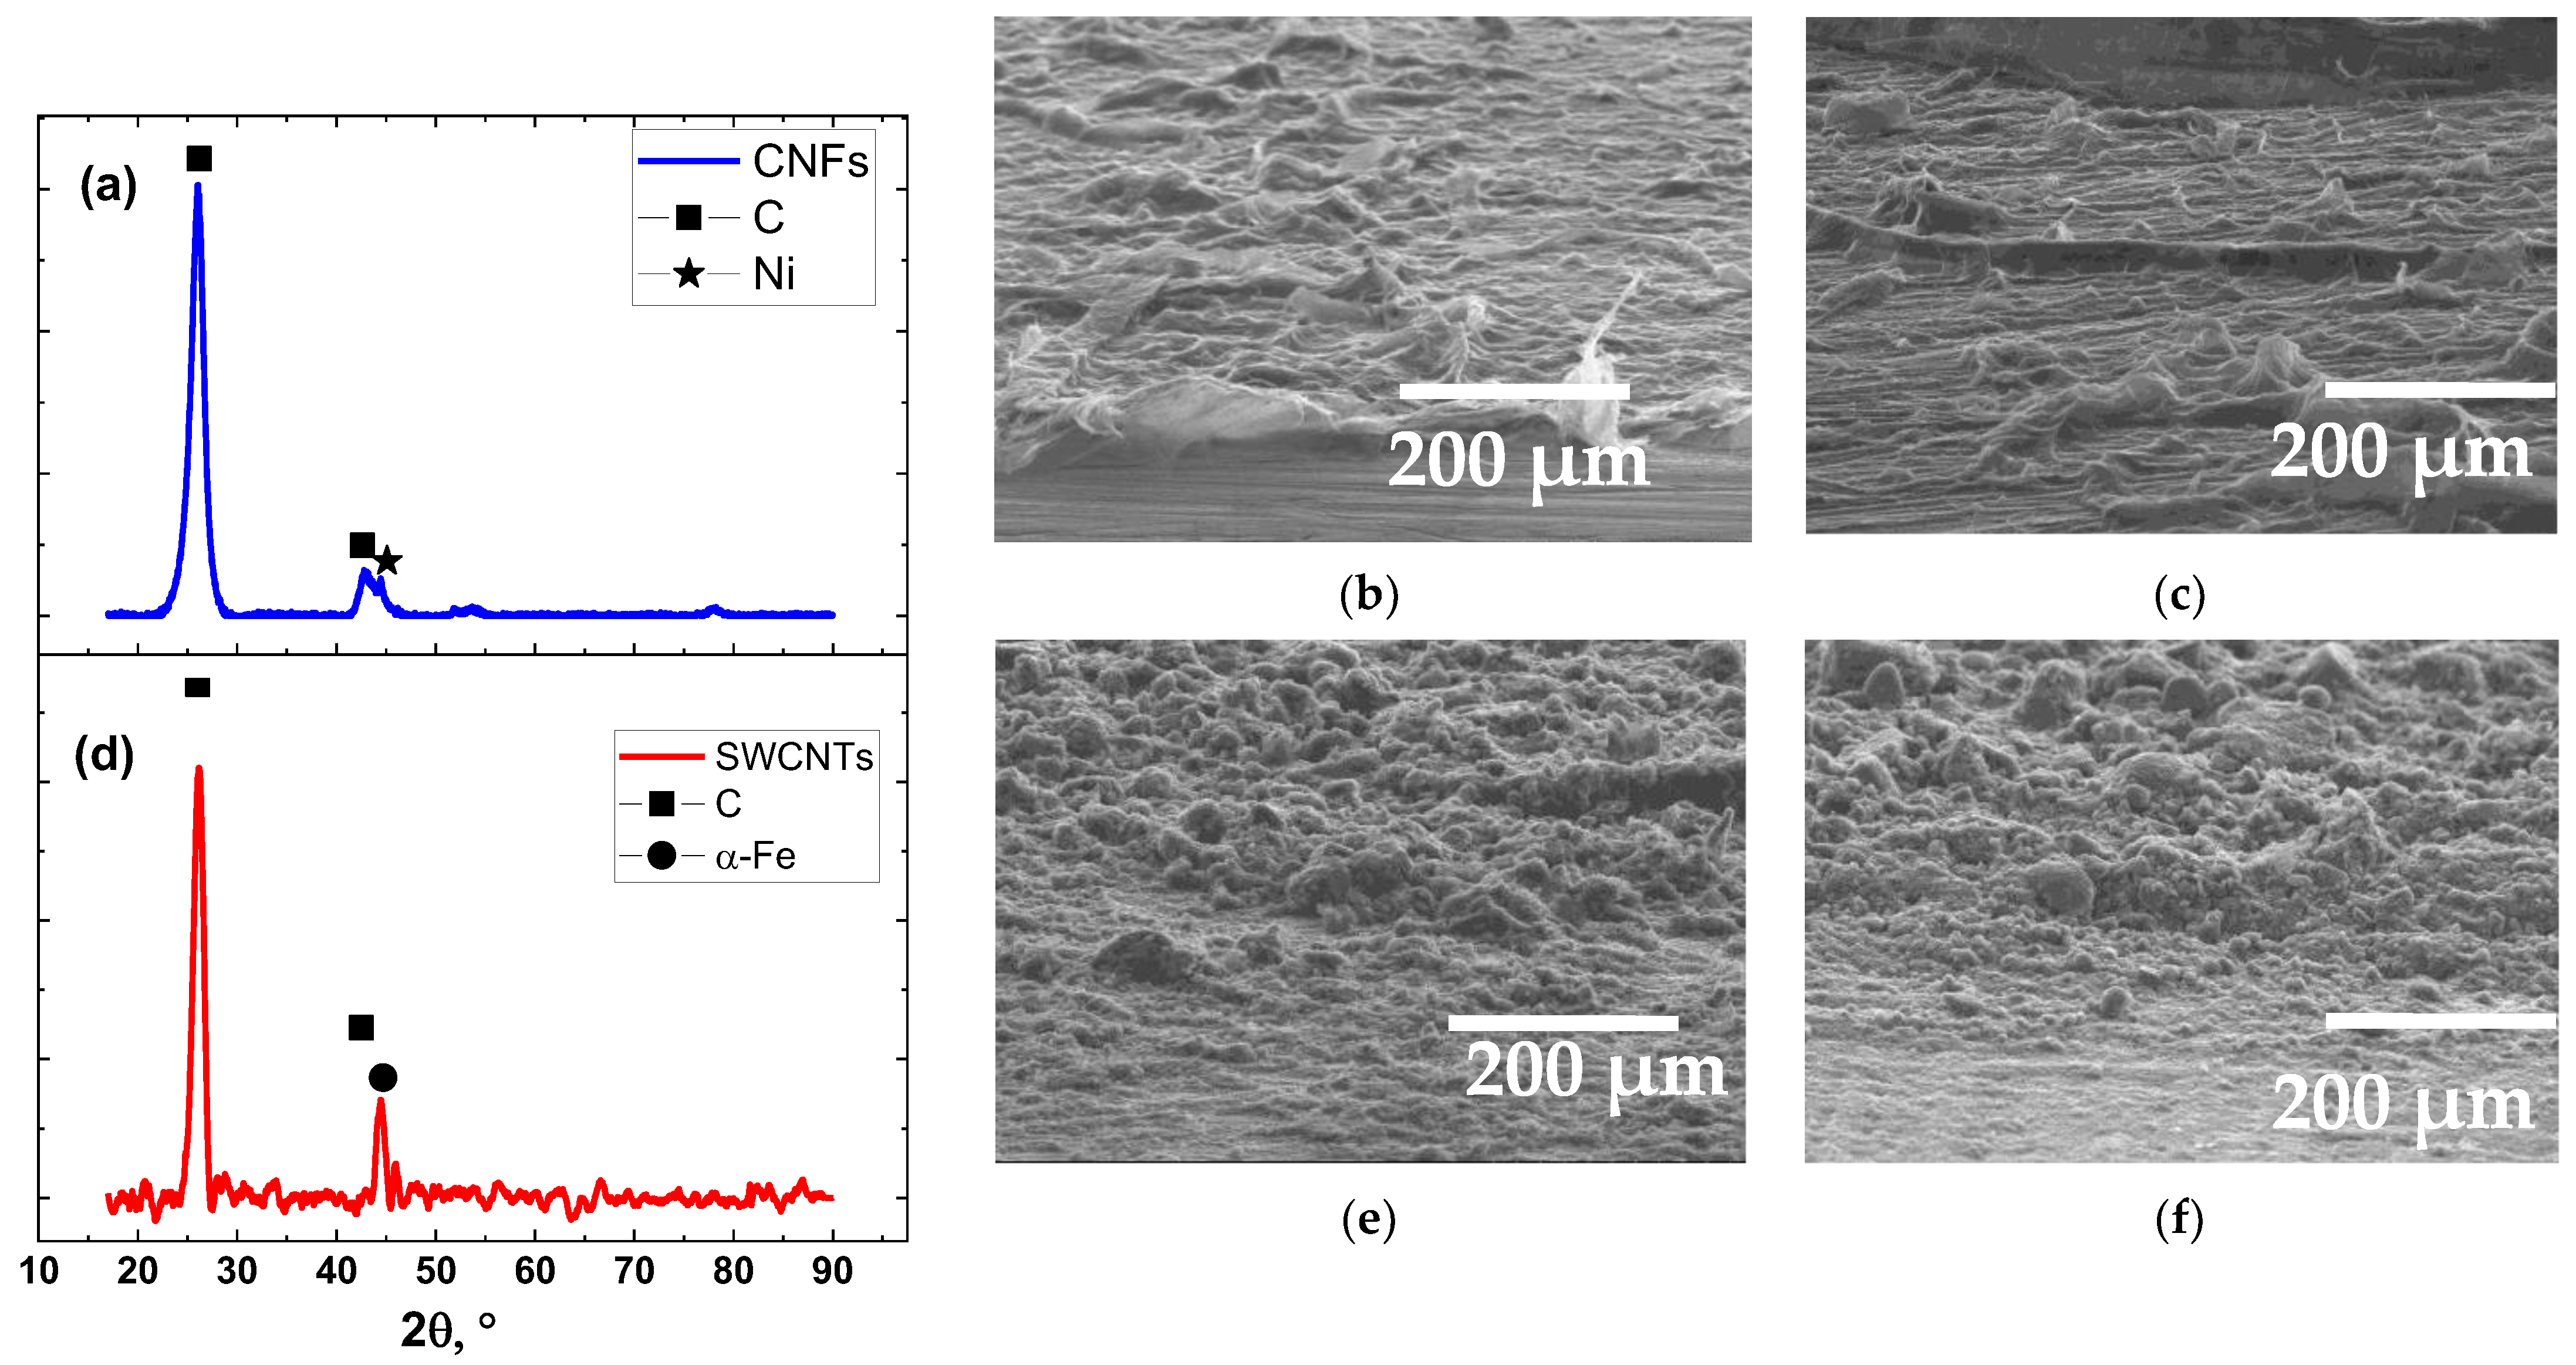
The X-ray diffraction patterns of the samples are presented in Figure 5. The samples are primarily composed of the graphite phase (space group P63/mmc), with a strong (002) reflection that is typical for most carbon nanomaterials []. The carbon nanofibers contained a nickel phase (space group Fm3m), as nickel oxide has been reduced by hydrogen produced during methane decomposition, and the growth of the nanofibers begins on catalytic nickel nanoparticles. The nickel content is low, and reflections associated with the aluminum oxide phase are absent in the samples. The α-Fe phase (2θ = 44°) was detected in the nanotube sample, indicating that the original sample may have been grown on iron nanoparticles. Its amount is insignificant, as the initial data indicate that the mass fraction of metal in the sample does not exceed 1%.
Figure 5. XRD patterns of CNFs (a) and SWCNTs (d) (λ = 0.154 nm, Cu Kα radiation); SEM images of sensing films on the substrate: (b) SWCNTs (1.5 mg/mL); (c) SWCNTs (3 mg/mL); (e) CNFs (1.5 mg/mL); (f) CNFs (3 mg/mL).
Based on SEM images of carbon-based films on the textolite substrate (Figure 5), it can be concluded that SWCNTs were distributed in an uneven layer during the application process, forming a continuous film. The approach to use different concentrations of carbon nanomaterials in ethanol led to the formation of films with similar thicknesses but with varying densities of carbon inclusion through the length of the substrate. This behavior is primarily attributed to the higher film roughness at lower suspension concentrations, which facilitates gas access. Conversely, higher concentrations lead to the blocking of the coating’s inner layers. The surface of sensors based on CNFs is more textured because the size of CNF aggregates is significantly higher compared to SWCNT bungles. From Figure 5b,c,e,f, it is evident that the thickness of the film based on SWCNTs is significantly lower compared to that of CNFs.
AFM images of films are shown in Figure S2, Table S1 (Supplementary Materials). The roughness of films was high enough and exceeded 5–20 μm (limit for microscope). The filamentous morphology of SWCNT-based films is clearly seen in Figure S2a. SWCNTs form the more uniform film compared to CNFs, but at the same concentration of the suspension, CNF-based films seem to be more rough. This fact is in agreement with average film thickness determined in some points of coating (Table S1 in Supplementary Materials).
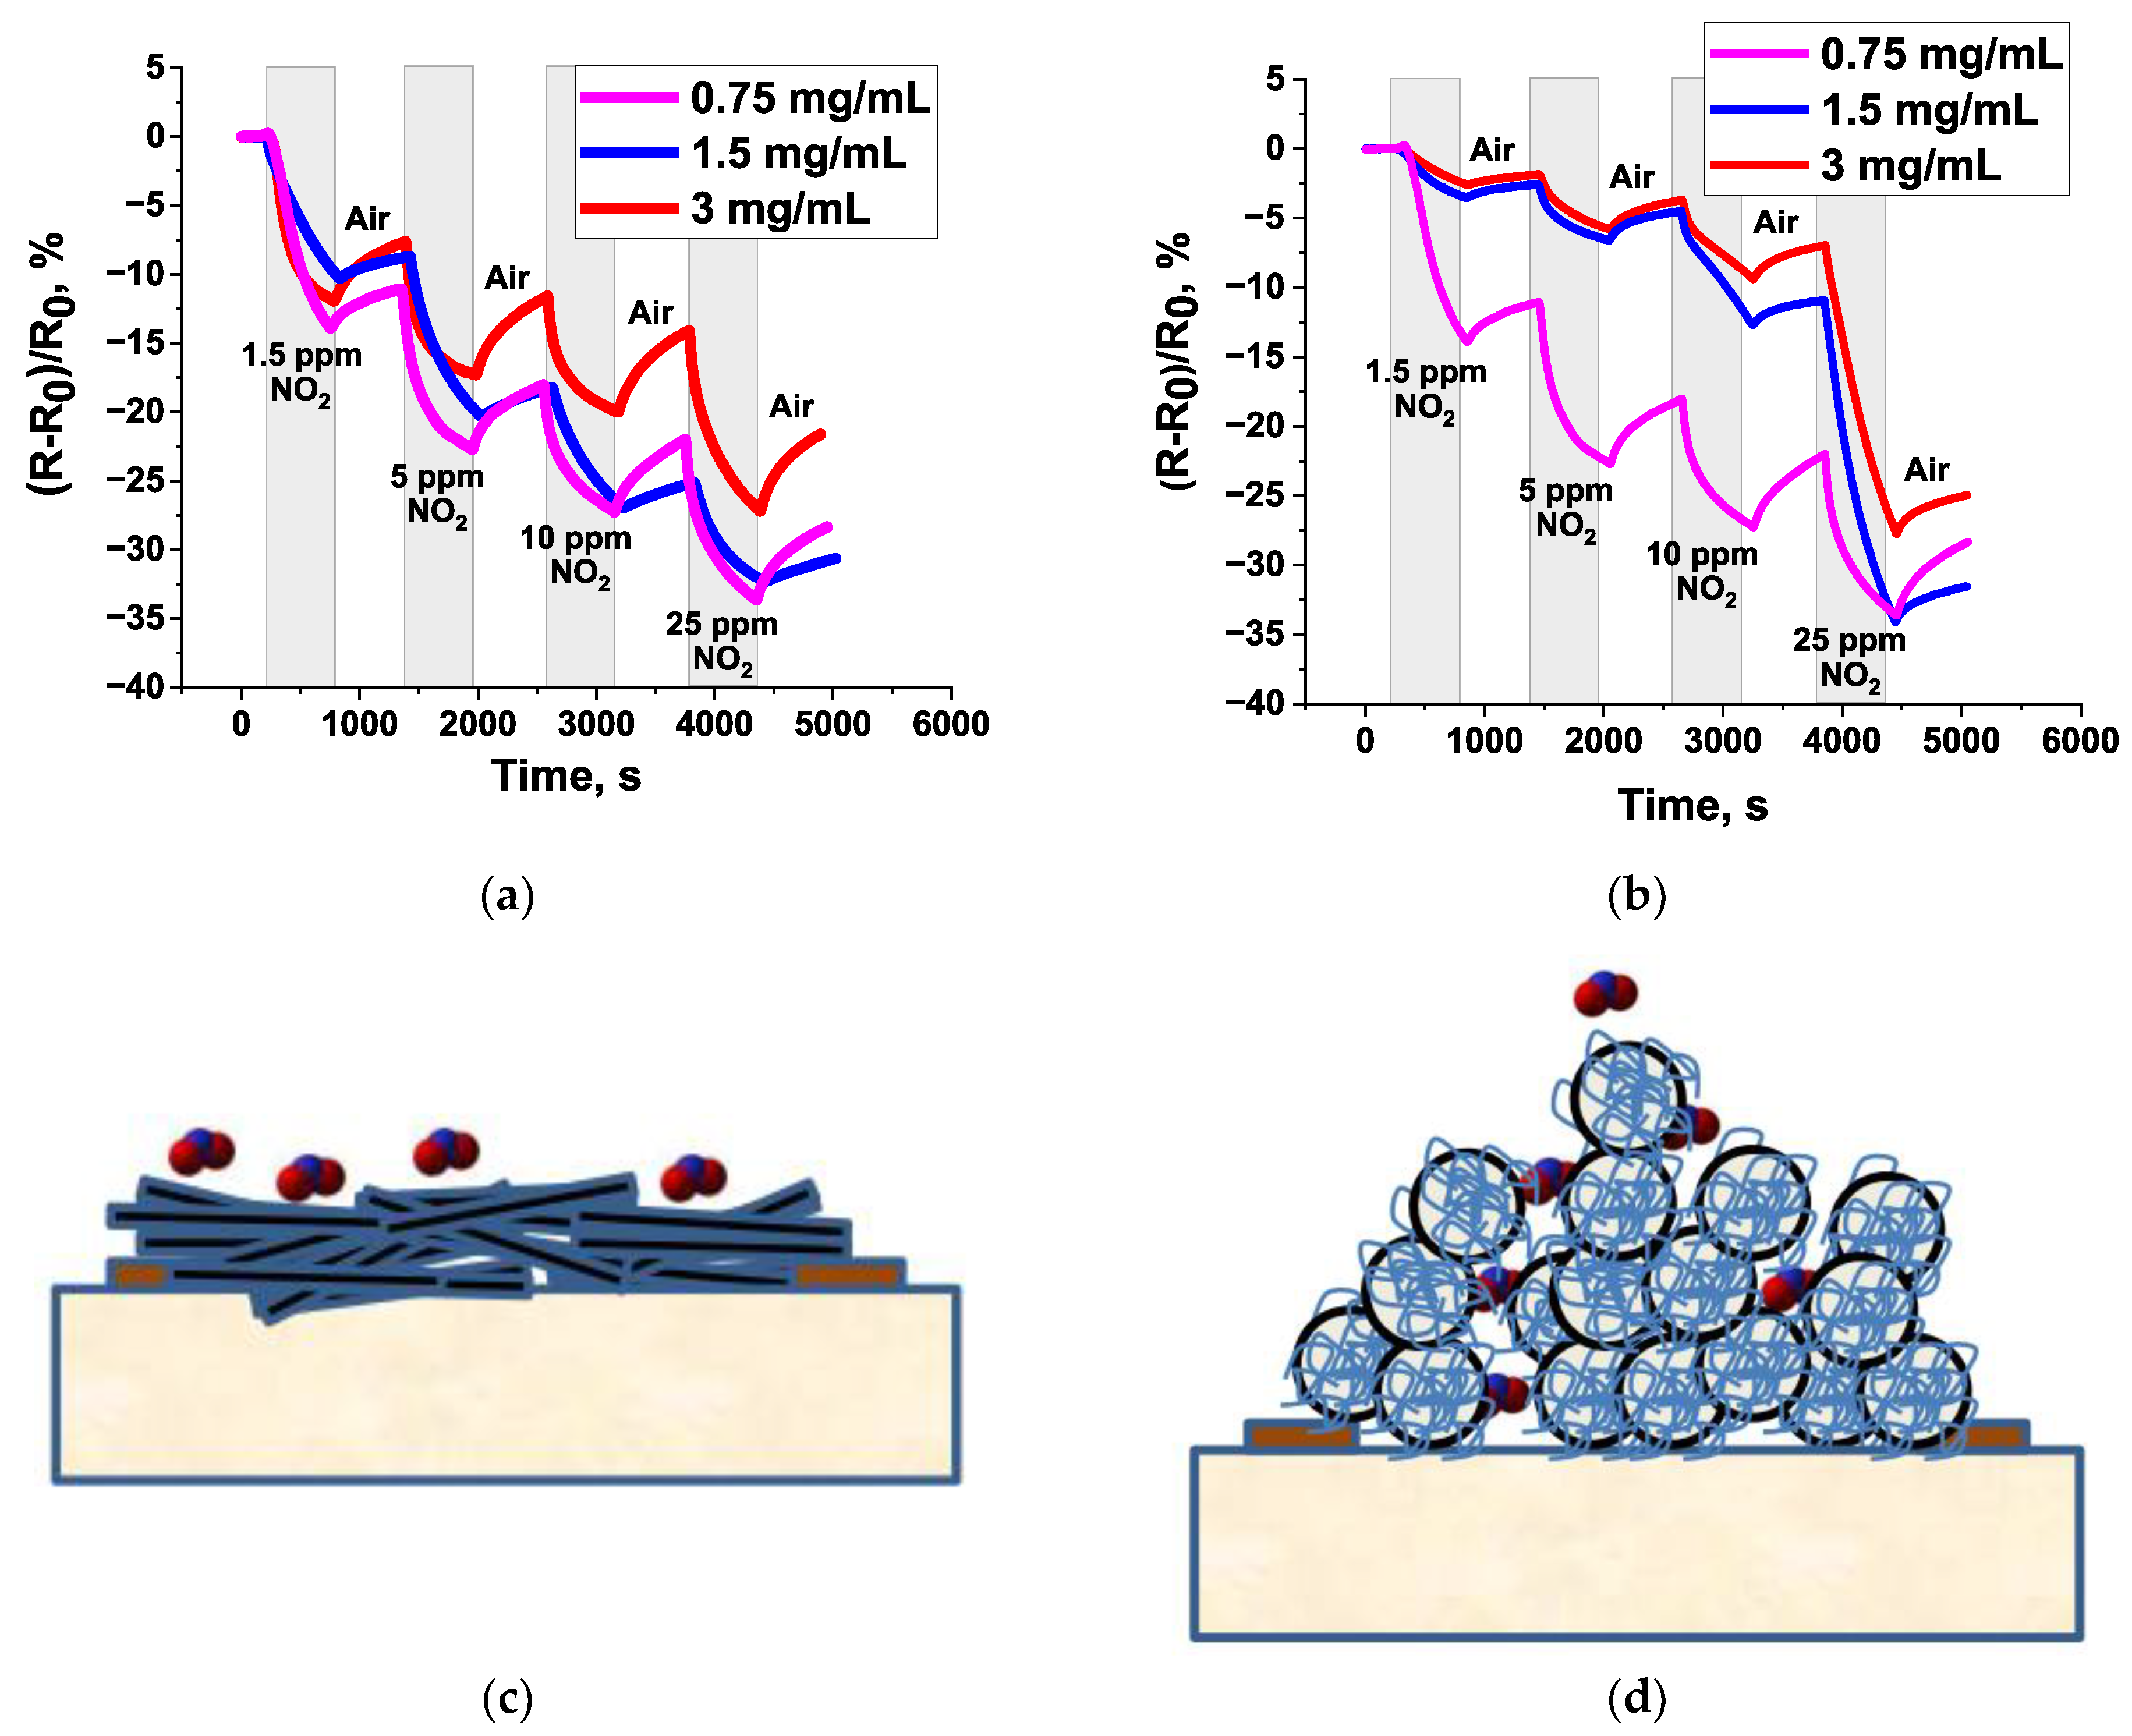
The impact of the concentration of the carbon nanomaterials suspension in ethanol on the sensor response is shown in Figure 6.
Figure 6. Response curves of NO2 sensors based on SWCNTs (a) and CNFs (b) (25 ± 1 °C, φ = 2 ± 0.5%); scheme of organization of SWCNT- (c) and CNF-based (d) films in terms of NO2 molecules interaction with surface layers of sensing material on the substrate with contacts.
It is evident from Figure 6 that the response of the sensors is directly related to the sample weight for the drop-casting technique used for the deposition of the sensing material. The higher concentration of carbon nanomaterial in solvent taken for drop casting, the denser the coating. This fact is in accordance with sensor resistance of CNFs (Table 3); however, the behavior of SWCNTs due to bundle-like morphology shows the non-linear behavior on the concentration of SWCNT/ethanol mixture.
Table 3. Characteristics of NO2 gas sensors based on SWCNTs and CNFs using various concentrations of suspensions.
The highest response is observed for the sensor made from a suspension of SWCNTs in ethanol at 0.75 mg/mL (excluding concentrations below 5 ppm), as well as for CNFs at the same concentration of 0.75 mg/mL. The absolute values of the sensor response for CNF-based films strongly decrease when the concentration exceeds 0.75 mg/mL. This is mainly attributed to the increased roughness of the film at lower suspension concentrations. Conversely, increasing the concentration causes blocking of the inner layers of the coating. This phenomenon is mainly related to the porous nature of the CNF film, which allows adsorption not only on the surface layers (typical for SWCNTs; Figure 6c) but also within the internal structure when in contact with NO2 (Figure 6d).
The sensor characteristics are summarized in Table 3, which shows the response time (τ), recovery degree (n), resistance in air at 25 °C (R0), sensitivity, and signal-to-noise ratio (SNR).
It is known that most carbon nanomaterials act as p-type semiconductor materials due to defects functioning as charge transfer centers []. This is confirmed in Figure 6, which shows the decrease in sensor resistance when in contact with an electron acceptor gas, such as nitrogen dioxide. This occurs because the absorption of the electron acceptor compound on the surface of the sample causes the transfer of electrons from CNFs or SWCNTs, which increases the concentration of holes and enhances conductivity [].
Carbon nanotubes at low concentrations of NO2 behave similarly regardless of the mass of the sample taken. However, as the gas concentration increases, the response becomes inversely proportional to the sample mass. This dependence can be attributed to the different density and porosity of the film, which are determined by the concentration of the suspension. It is worth noting that the film of sensing material is porous, and the issue of the availability of the entire space within this film is not discussed anywhere. Under conditions of low NO2 concentrations, the adsorption of molecules on the sensor surface is unrestricted, and the influence of film density on the overall response mechanism is negligible. However, as the NO2 concentration increases, the adsorbed nitrogen dioxide molecules begin to impede diffusion to the lower layers, leading to a decrease in the response.
As can be seen from Table 3, the SWCNT sample with the maximum concentration (3 mg/mL) showed the fastest response compared to the other samples, which can be attributed to the large number of adsorption centers on the film surface. However, this sample also has the lowest sensitivity. The sensor with a concentration of 1.5 mg/mL exhibited the best sensitivity, which is more than twice that of the other samples. It is worth noting that the sensor resistance changes non-linearly as the concentration of the SWCNT suspension increases. This effect has been reproduced many times and demonstrates the difference between SWCNT- and CNF-based films. The latter showed a decrease in resistance with an increase in concentration. Nevertheless, the CNF-based films exhibited some non-linearity in certain characteristics related to the concentration of the suspension in ethanol, which is typical for sensitivity and recovery degree. The incomplete recovery is due to the chemisorption of NO2 molecules on the surface of the carbon nanomaterials. Moreover, thermodynamic conditions and the macrokinetics of gas adsorption within the testing chamber do not favor the removal of strongly adsorbed molecules, whereas physically adsorbed molecules are easier to remove with airflow. It can be noted that the impact of the baseline (resistance change of the sensor in air atmosphere) was subtracted preliminarily. Nevertheless, the strong interaction of NO2 molecules, along with the exponential kinetics of recovery [], results in a prolonged recovery time until complete desorption is achieved.
Carbon nanofibers showed the best response at the lowest suspension weight, with a threefold increase in resistance change compared to the other samples. The change in sensor resistance aligns with percolation theory [], where an increase in the number of contacts between conductive particles enhances the system’s effective conductivity. The resistance dependence on the concentration of CNFs can be easily described using the linear function (R = a + b × C; where C—concentration of CNFs in suspension, mg/mL; R—sensor resistance, Ω; a = 719 ± 36.66061 Ω, b = −178.66 ± 18.47 Ω × mL/mg) with R2 = 0.989 (Figure S3 in Supplementary Materials). At the same time the SWCNT-based films showed the strongly non-linear behavior of sensor resistance on their concentration in suspension.
The signal-to-noise ratio is a characteristic that is less frequently analyzed in chemiresistive gas sensors. Typically, the resistance of CNF-based films ranged from 191 to 601 Ω, whereas SWCNTs exhibited a lower range of 29 to 155 Ω. However, the SNR of CNFs for the 0.75–1.5 g/mL samples was 4 to 5 times higher than that of SWCNTs. Previous work [] reported that the optimal SNR occurs where film resistivity is lowest, despite fewer defects acting as adsorption sites. In our study, both CNF- and SWCNT-based sensors with low resistance generally exhibited the highest SNR.
Overall, the data presented above showed the concentration-dependent sensor behavior of films based on both CNFs and SWCNTs. However, the degree of this dependence is determined by the type of material. CNFs, with their aggregated structure, are more susceptible to this dependence, whereas the thin, bundle-like SWCNT structures exhibit a strong non-linearity. Nonetheless, we have demonstrated the importance of concentration as a key factor in film-like carbon-based sensors obtained via the drop casting technique for NO2 detection at room temperature.

3.2. Sensors Based on Composites of SWCNTs and CNFs with rGO

It is well recognized that many composite materials exhibit synergistic effects that enhance their overall properties, and carbon nanomaterials are no exception. However, previous section revealed that the SWCNTs and CNFs produce a significant improvement in sensor performance by means of their drop casting technique, but it is necessary to enhance them additionally. The hybrid composites based on two these carbon nanomaterials were created. In order to achieve the synergistic effect in the drop-casted films of SWCNTs and CNFs, the composites (with the second carbon component, namely rGO) with varying compositions ranging from 25% to 75% wt. were prepared at a concentration of 0.75 mg/mL. The primary systems investigated included SWCNTs/rGO and CNFs/rGO. rGO was selected based on its layered, oxygen-saturated surface, which was expected to foster synergistic interactions with SWCNTs. For CNFs, the layered structure was anticipated to promote affinity through layering effects, potentially enhancing sensor properties. Graphite oxide was synthesized via the Hummers method and subsequently reduced in an oven, as detailed in Section 2.1. Following reduction, a material with characterized properties (see Table 4) was obtained, providing a promising platform for studying the influence of structural (and chemical) compatibility on composite sensor performance.
Table 4. Characteristics of the initial GO and rGO.
Based on the results presented in Table 2, we can draw conclusions about the atomic composition of the obtained sample. Compared to the starting material, the amount of oxygen-containing compounds in rGO decreased by 1.5 times. Disorder degree, according to Raman spectroscopy, did not change significantly; however, the C:O ratio grew, which was accompanied by partial reduction.
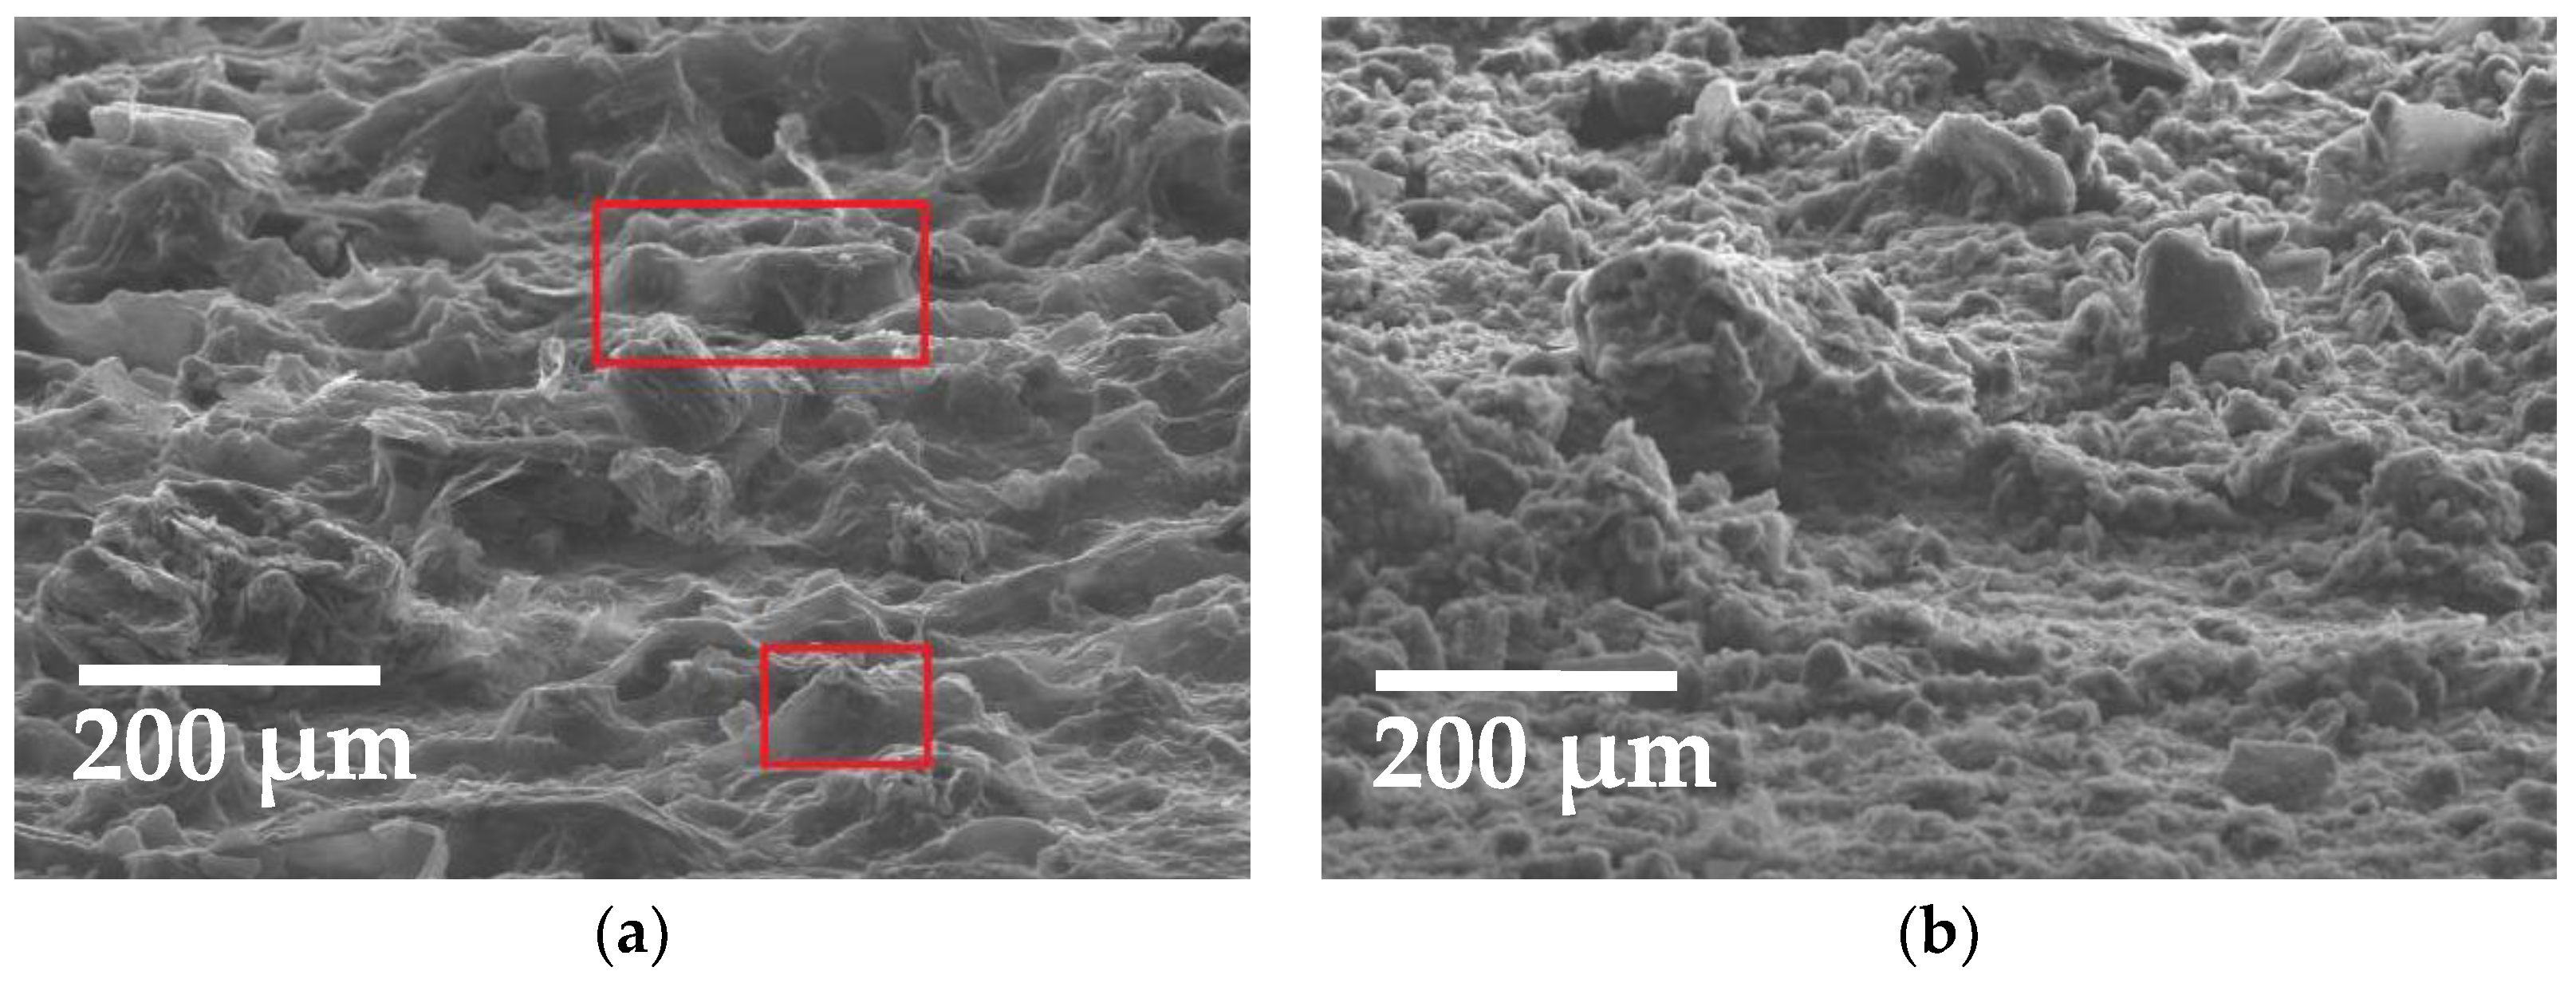
Figure 7 shows SEM images of composite sensors films with rGO (concentration of 50 wt.%).
Figure 7. SEM images of hybrid films: (a) SWCNTs/rGO (1:1 (w/w)); (b) CNFs/rGO (1:1 (w/w)). Red boxes showed the film of SWCNTs on the surface of rGO particles in SWCNTs/rGO system.
Figure 7a shows that rGO particles are visible, enveloped by a thin layer of SWCNTs (marked with red rectangles in Figure 7a). Thus, the film based on SWCNTs with the addition of rGO lost its continuity and homogeneity. The SWCNTs are mainly concentrated on the top of the rGO particles. The CNF-based films, with the addition of rGO, achieved improved homogeneity and contained coarser granules. The CNFs formed a mixture of both rGO and CNF particle inclusions.
The layer thickness also increased by approximately 40–60 μm. Optical microscopy (Figure S4, Supplementary Materials) confirmed that the thickness of SWCNTs/rGO and CNFs/rGO films was significantly greater compared to individual single-component films, reaching 45–110 μm (at the boundary with the copper electrode), whereas the thickness of the latter did not exceed 10 μm.
The decision to enhance the sensor response by creating a hybrid material (comprising all carbon materials as a combination of two components) was initially based on combining SWCNTs and CNFs, but the sensor response was relatively weaker than that of the individual components (Figure S5 in Supplementary Materials). Therefore, it was decided to incorporate a second material with a different morphology (non-filamentous or non-fibrous as for SWCNTs or CNFs) and chemical composition, such as rGO.
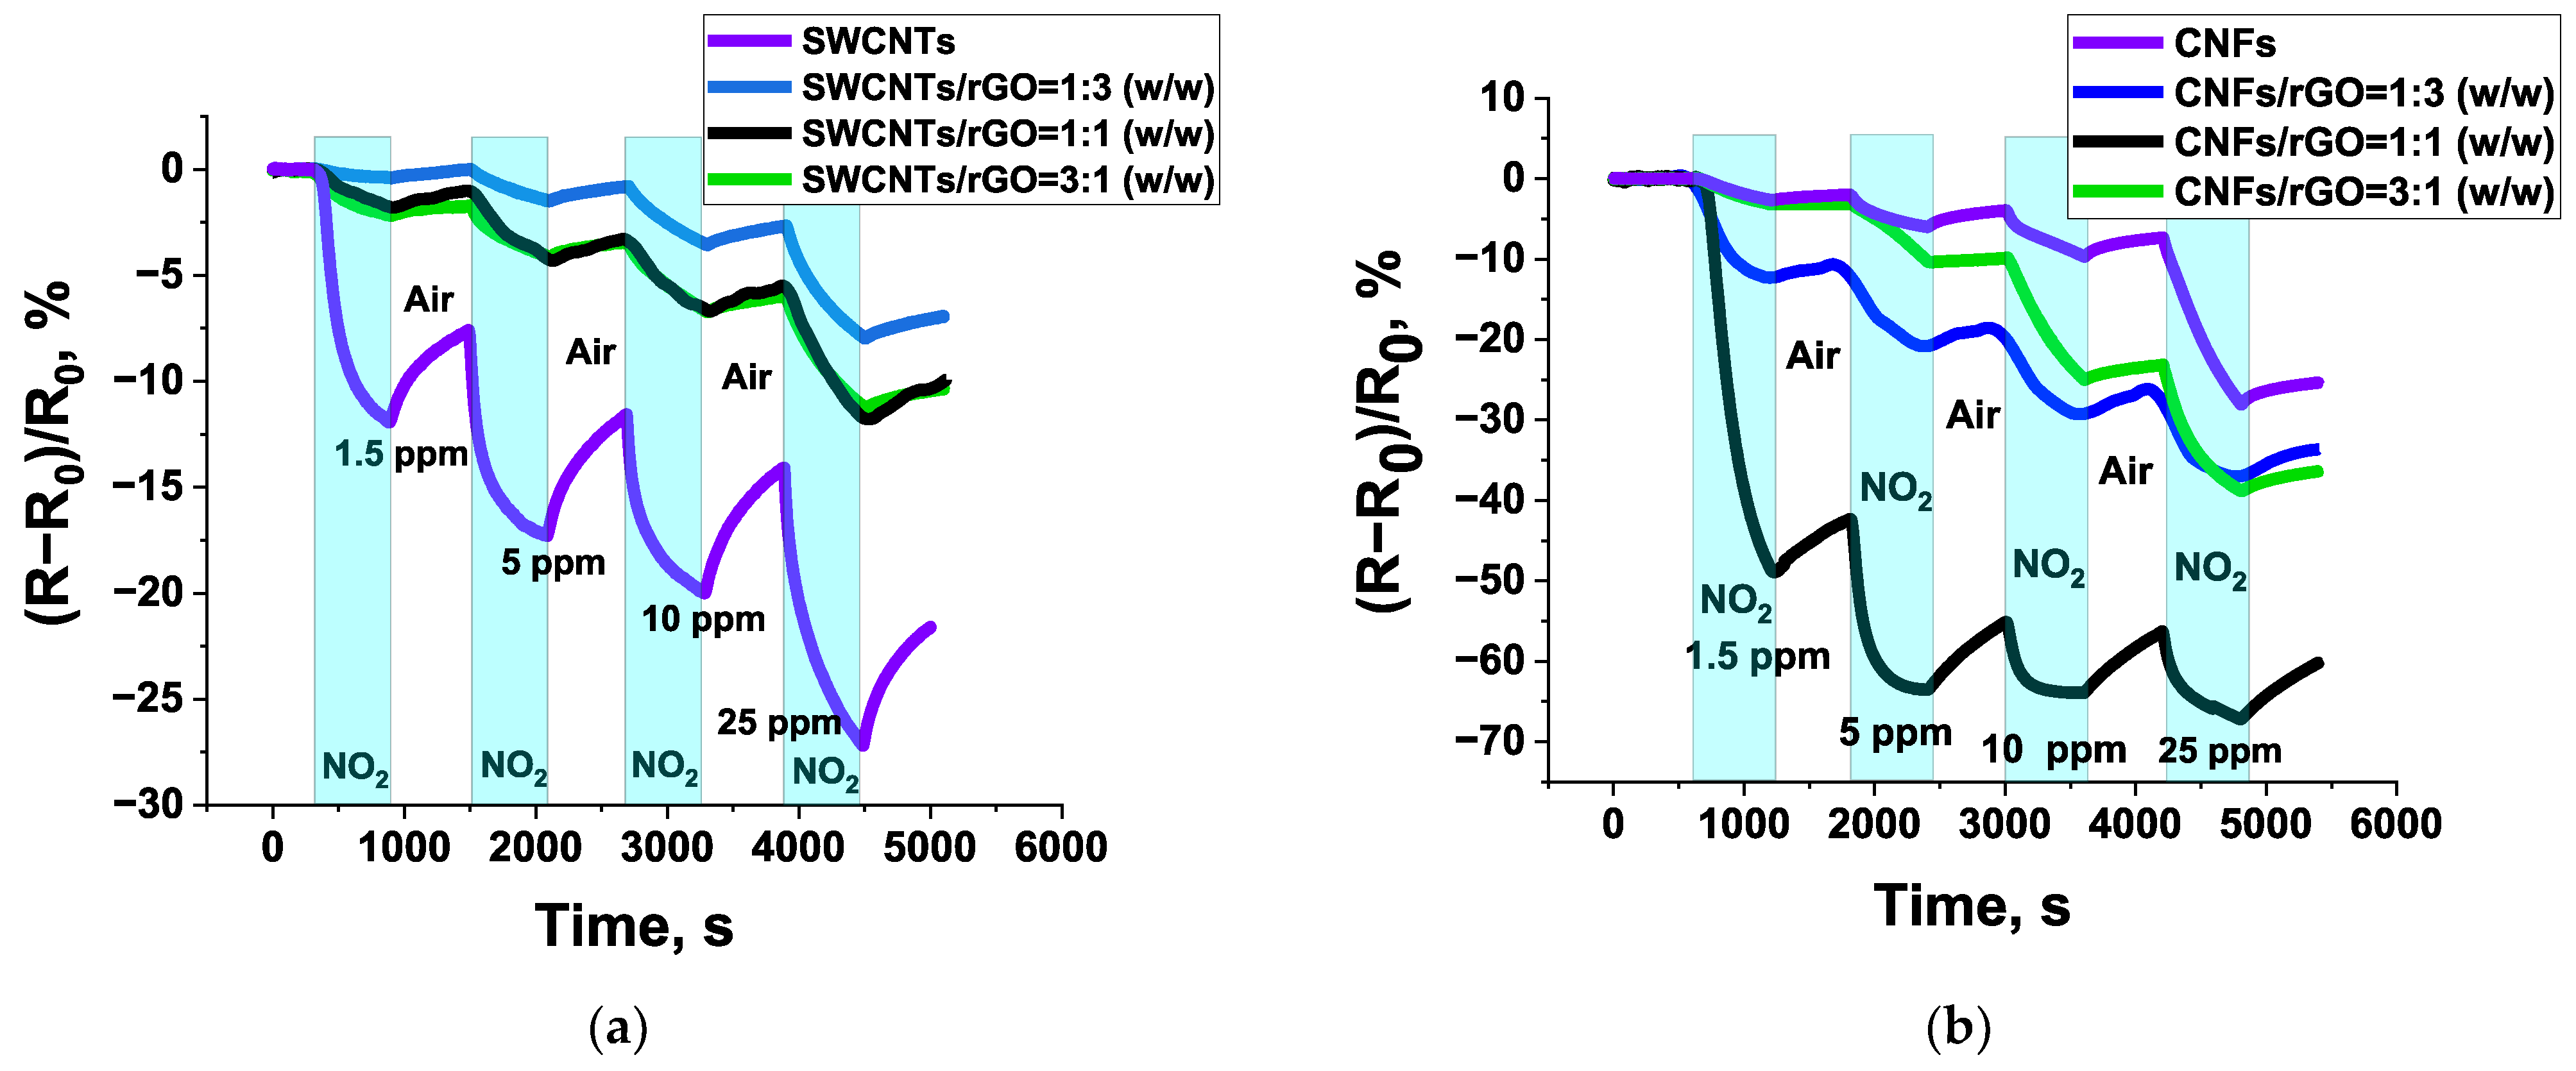
The hybrid sensors were created in order to enhance the sensor characteristics of pristine SWCNT- and CNF-based materials (Figure 8).
Figure 8. Response curves of NO2 sensors based on SWCNTs/rGO (a) and CNFs/rGO (b) hybrids (25 ± 1 °C, RH 2 ± 0.5%).
The detailed analysis of sensing characteristics is given in Table 5.
Table 5. Characteristics of NO2 sensors based on SWCNTs and CNFs obtained by drop casting using different content of the rGO of the composite.
The addition of rGO causes the decrease in sensor response (Figure 8a). The sensor response is also influenced by the component content in the composite. Experimental data show that the composite based on CNFs and rGO exhibits a better response than the sensor based on pure CNFs. Namely, the hybrid material based on CNFs and rGO in a ratio 1:1 showed the extremely high response reaching 49% at 1.5 ppm, which is high enough for all carbon composites. The decrease in rGO concentration below 50 wt.% and above it induced the decrease in ΔR/R0.
In contrast to CNFs/rGO system, the composite based on SWCNTs and rGO showed the deterioration of sensor characteristics among initial SWCNTs. Likely due to the substantial difference in conductivity between SWCNTs and rGO, energy barrier (depleted layer of charge carriers) forms at the contact between these two materials. It can be assumed that the morphology of the films plays an important role. The electronically favorable SWCNTs/rGO composite, with non-uniformly distributed inclusions and a layered structure, exhibits a barrier-like configuration that prevents NO2 adsorption within the inner spaces of the film. Mainly, nanotubes covering rGO particles participate in charge transfer. This explains the decrease in sensitivity with increasing rGO mass fraction in the hybrid material. However, Table 5 shows the increase in sensor recovery and SNR when increasing the fraction of rGO. In CNFs/rGO composite, the growth of the rGO fraction induced the remarkable decrease in response time (more than 80–100 s compared to CNFs) and the subsequent decrease in recovery degree. Unlike SWCNTs/rGO, the CNFs/rGO composite provides a more porous morphology, allowing NO2 to penetrate deeper and increasing the number of active sites available for adsorption.
The SWCNTs/rGO sensors showed a decrease in sensor response compared to the individual SWCNTs. The creation of hybrids in this way was not optimal; however, some hybrids (e.g., SWCNTs/rGO 1:3 wt.) exhibited the lowest response but achieved 100% recovery. Nonetheless, other characteristics, such as sensitivity and response time, were sufficiently low. The original (resistance vs. time) sensing curves are provided for the samples with the highest response at the lowest NO2 concentrations (SWCNTs 0.75 mg/mL and CNFs/rGO 1:1 (w/w)), which are given in Figure S6 in Supplementary Materials.
The additional feature of sensors based on hybrids with rGO is their humidity enhanced response (e.g., SWCNTs/rGO system; Figure S7 in Supplementary Materials). Usually, the contact with NO2 under humid environment induced the decrease in sensor response, whereas for SWCNT-based sensors (both single-component and composite with rGO) the increase in relative humidity led to growth in ΔR/R0. The optimum response was reached at 25–50% humidity. The impact of relative humidity on the CNFs/rGO sensors is opposite (Figure S7, Supplementary Materials), leading to a weakening of the sensor response as humidity increases. From this, it appears that the humidity-enhanced response is primarily related to SWCNTs. The effects of humidity-enhanced response were also reported in [,]. Additionally, the selectivity tests to NO2, NH3, and CH4 at room temperature were carried out (Figure S8, Supplementary Materials), showing the highest response to NO2 among other gases detected for CNFs/rGO sensor. The composite-based sensors showed good stability of sensor response within 14 days (Figure S9, Supplementary Materials), showing the deviation of response within 0.4% and 0.3% related to absolute response value for CNFs/rGO and SWCNTs/rGO systems, respectively.
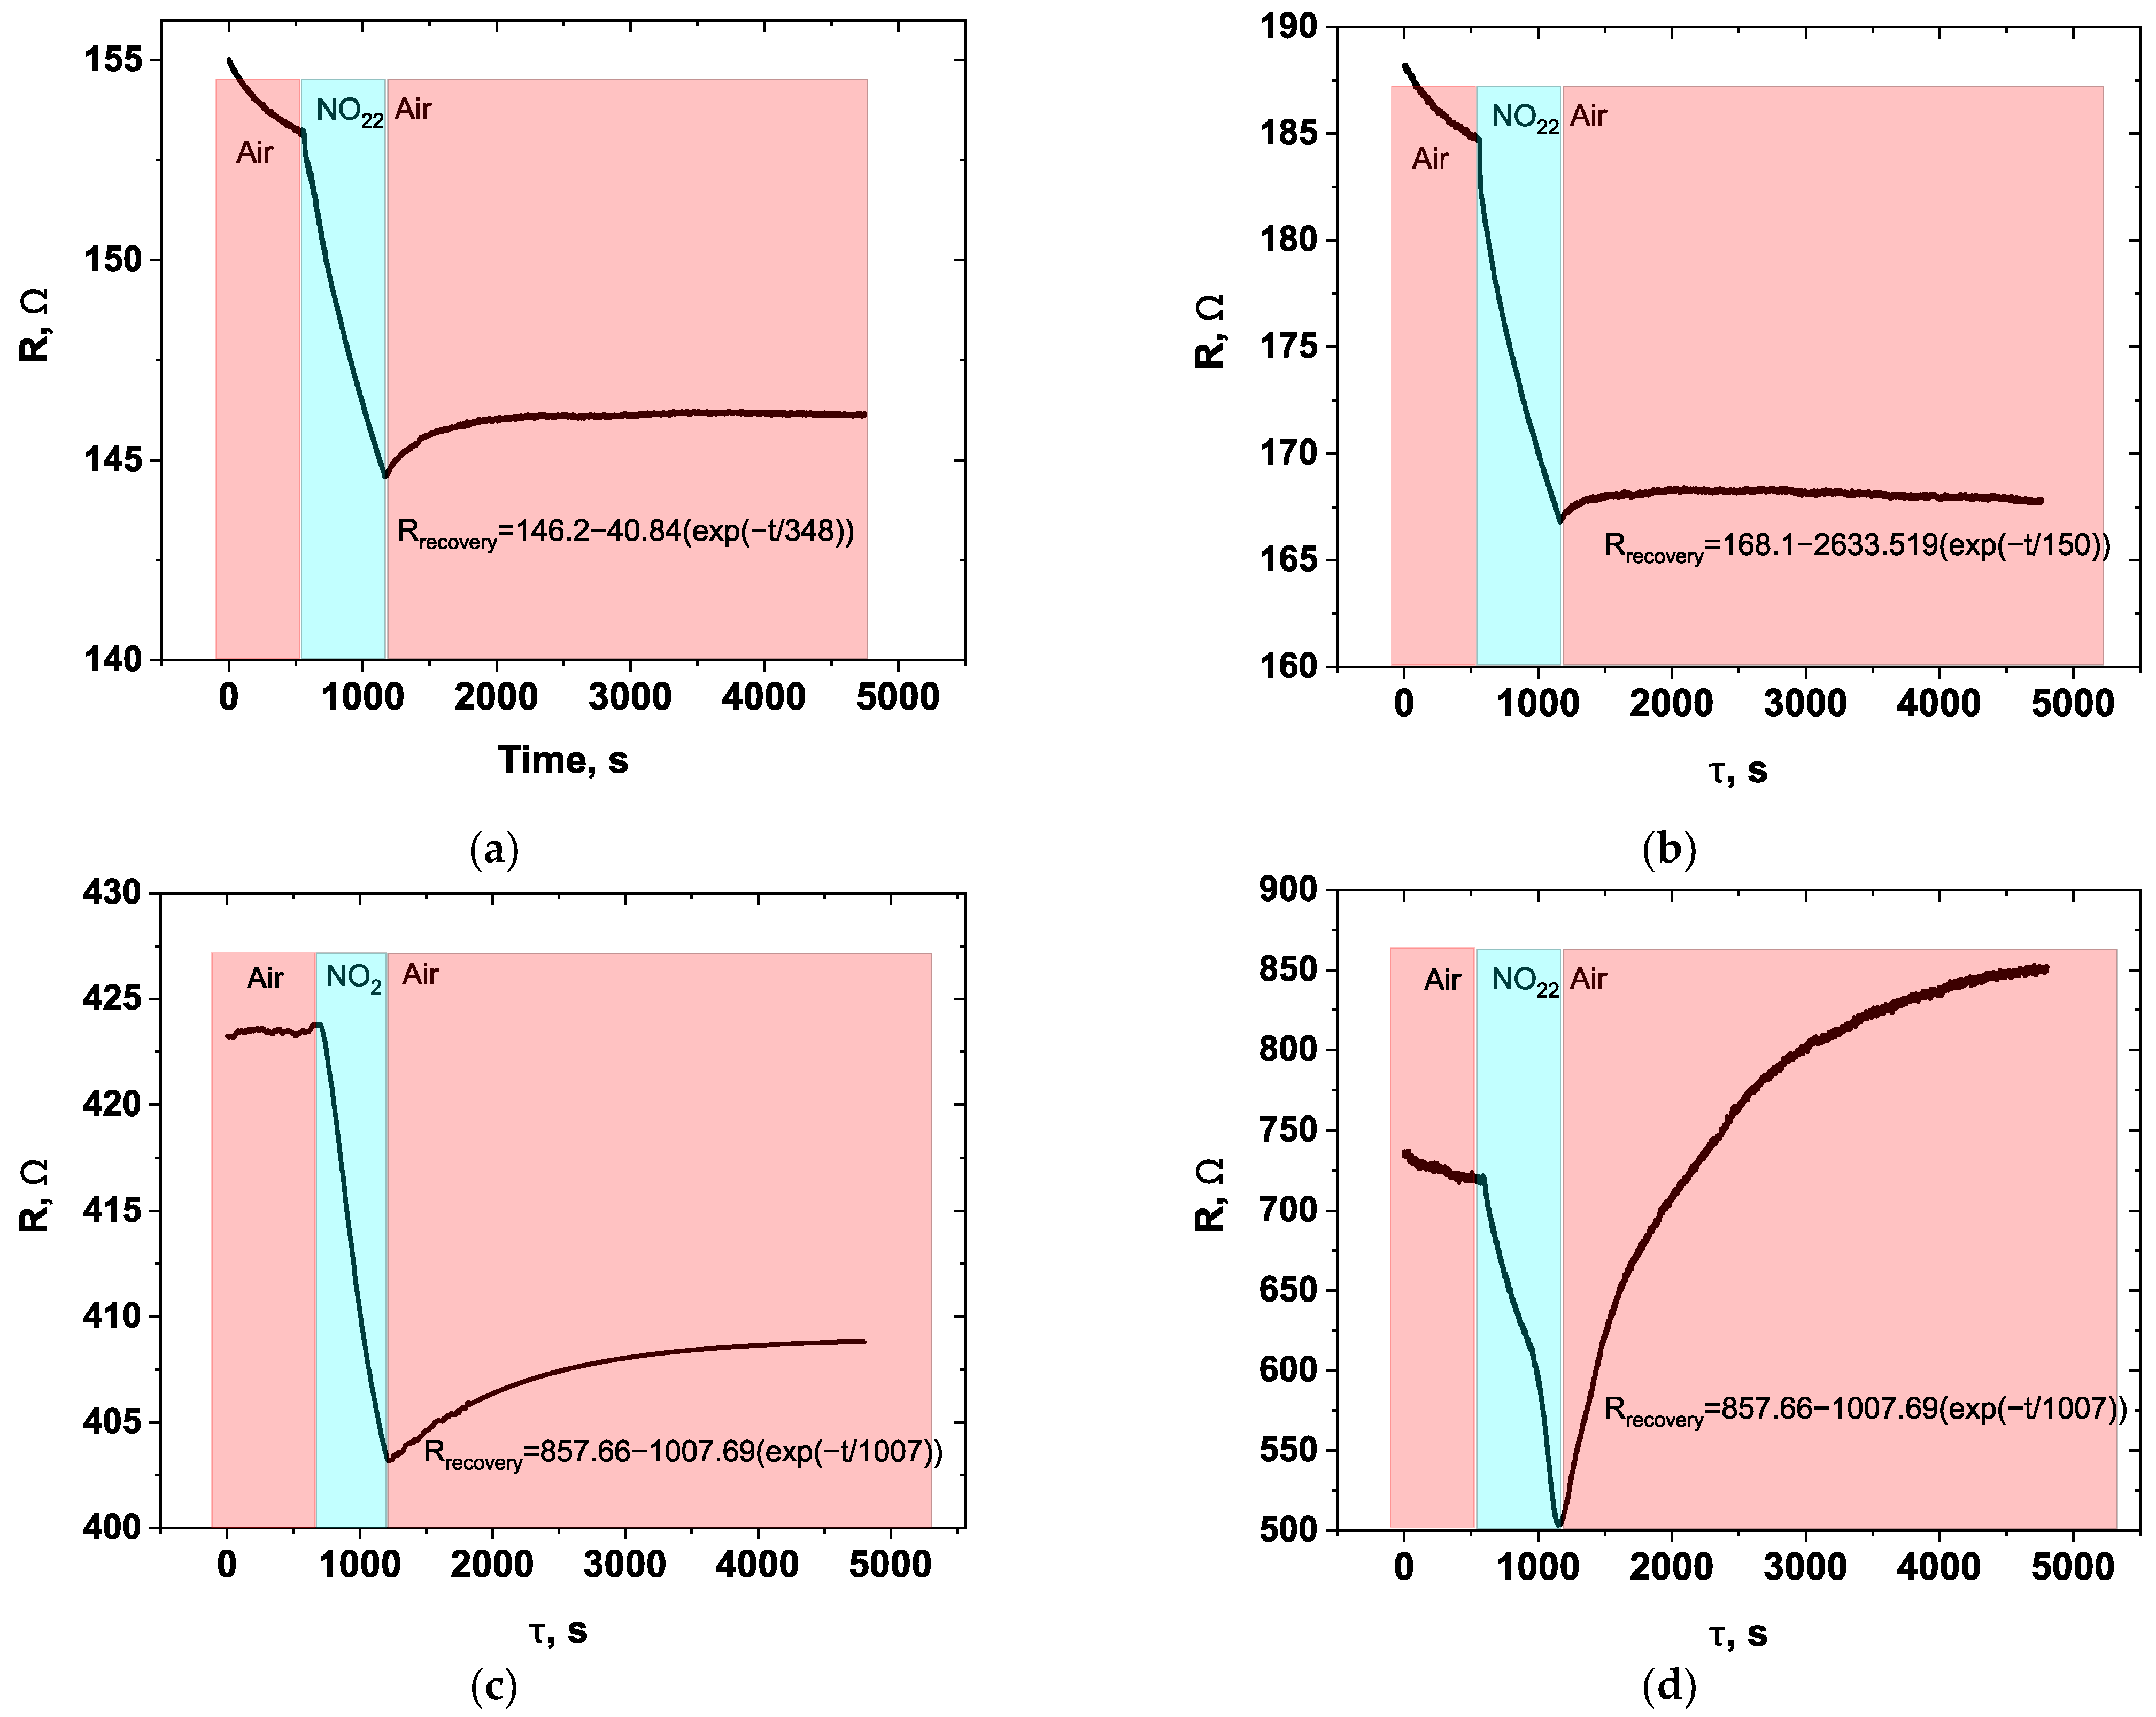
Additionally, an attempt was made to estimate the pristine (resistance vs. time) long-term response curves with long-term recovery for sensors based on SWCNTs, CNFs, and CNFs/rGO composites. The curves are shown in Figure 9. The typical dynamic sensor response curves shown in Figure 6 and Figure 8 were not convenient for determining the recovery time (τrecovery), since a longer duration is needed to complete the recovery, and the impact of the baseline is significant. Therefore, long-term tests were conducted, and the resistance vs. time dependence was obtained. The response region of the curve can be fitted using the kinetic equation R = y0 + A × (exp(−t/τrecovery)) [,]. It can be seen that the time of recovery increases for hybrid composites compared to SWCNTs, even when the sensor response of SWCNTs higher compared to SWCNTs/rGO composites. At the same time, the shortening of the recovery was reached for the hybrid sensor with a relatively lower response, whereas the high-responsive CNFs/rGO system showed slow recovery. Moreover, the CNF-based systems possessed more than two times higher recovery time compared SWCNT-based ones.
Figure 9. Resistance vs. time curve of the (a) SWCNTs (1.5 g/mL), (b) SWCNTs/rGO (1:1 w/w), (c) CNFs (1.5 g/mL), and (d) CNFs/rGO (1:1 w/w) sensors (1.5 ppm NO2, 25 °C, 2% RH).
It can be noted that CNFs/rGO structures form the films with extremely non-linear change in resistance vs. rGO fraction. Table 6 summarizes the performance of other sensors based on carbon nanomaterials and composites.
Table 6. Comparison of response of SWCNTs/rGO and CNFs/rGO sensors with published data.

3.3. Effect of Relative Humidity on the NO2 Sensor Response in Composites

As demonstrated in [,,,,,,], efforts to understand the underlying interaction mechanisms of humidity on the gas sensor response were made more than 15 years ago. However, a universal mechanism applicable to a specific system remains elusive, with explanations largely confined to individual cases that align with established theoretical frameworks. The primary theory involves the formation of a thin water film on the active layer surface []. However, this approach is predominantly applied to explain the behavior of sensors towards electron-donor gases, particularly ammonia. This theory is strongly supported by the Grotthuss mechanism [,], which explains proton transport in liquid media.
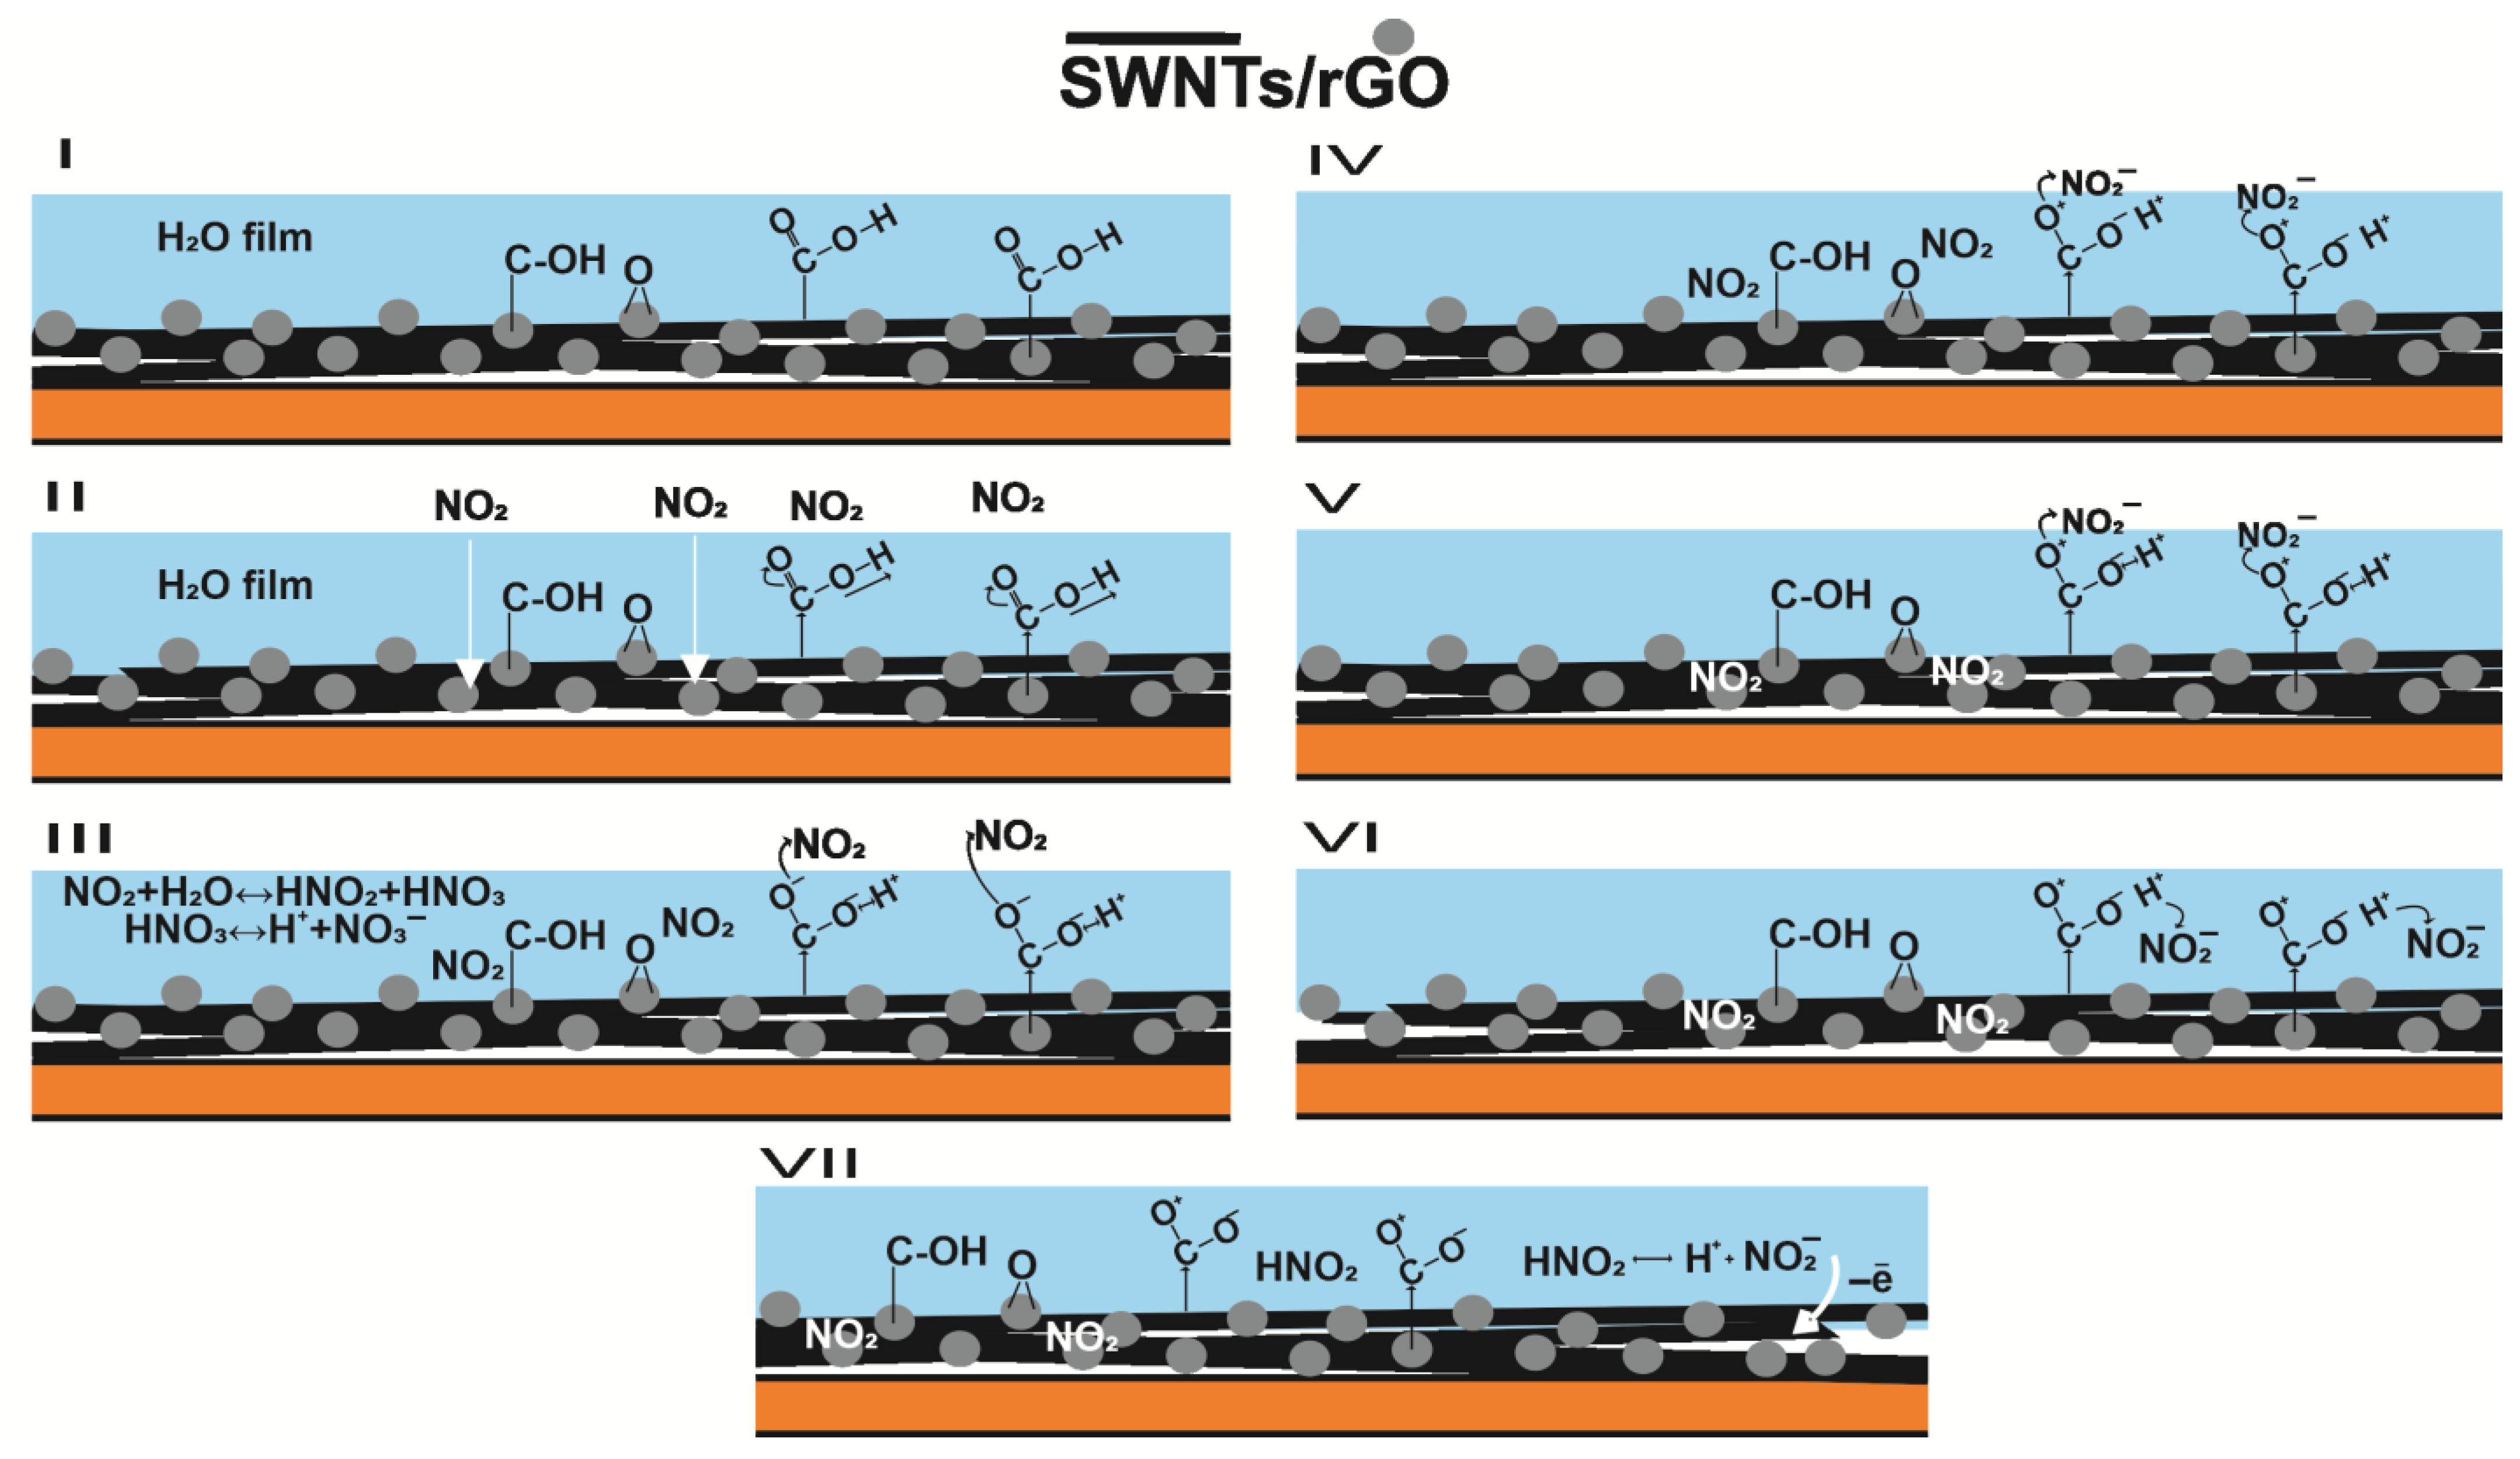
Consequently, given that the constituents of the SWCNTs/rGO composite possess a highly hydrophilic surface due to an abundance of functional groups, e.g., carboxyl groups on the SWCNT’s surface and epoxy/hydroxyl groups on the rGO’s surface, and considering the sensor’s surface morphology is characterized by a dense network of SWCNTs interspersed with rGO particles, it can be postulated that the thickness of liquid film varies with the humidity level supplied to the samples. Let us examine this mechanism using 25% relative humidity as an example. The mechanism of NO2 interaction under humid air with carbon–carbon composites is shown in Figure 10.
Figure 10. Mechanism of NO2 interaction with SWNTs/rGO composites under humid air conditions.
Stage I. Formation of a water film upon contact with humid air with the composite surface (2):
S W N T s r G O + A i r H u m i d i t y S W N T s r G O + H 2 O f i l m
Stage II. Interaction of NO2 with the water film leads to the formation of nitrous and nitric acids via a disproportionation reaction:
2 N O 2 + H 2 O f i l m H N O 2 + H N O 3
In the aqueous film, the dissociation of nitric acid molecules occurs with the release of protons (4):
H N O 3 H + + N O 3
Stages III, IV, V: Non-reacted NO2 molecules diffuse and adsorb onto the composite material surface. They also interact with oxygen-containing groups on the surface of SWCNTs and rGO, leading to an electron density shift and deprotonation of carboxyl groups. NO2 withdraws electron density from the oxygen atom in the double bond, creating a vacancy. Concurrently, dissociation of the carboxyl group into the solution occurs, forming a complex carboxylate ion stabilized by an abundance of protons from the solution, adjacent functional groups from the SWCNTs and rGO surfaces, and NO2 (Equations (5) and (6)):
C O O H C O O + H +
Chemosensors 13 00389 i001
Reactions (4), (5), and (6) generate a significant quantity of protons, which enhance conductivity according to the Grotthuss mechanism [,], thereby reducing resistance and improving the sensor response in a humid environment.
Stage VI: The NO2 interacts with protons released from reactions (4), and (5), forming metastable nitrous acid under the prevailing conditions (7):
H + + N O 2 H N O 2
Stage VII: Nitrous acid decomposes upon approaching the carbon surface (8). Subsequently, upon NO2 adsorption on the surface, an electron is released back into the system (9), followed by stabilization of the carboxyls (10):
H N O 2 H + + N O 2
N O 2 N O 2 ( a d s ) + e
C O + O + e + H + C O O H
As humidity increases, the concentration of NO2, and consequently of nitric and nitrous acids, decreases. The water film thickens and its surface tension changes, hindering NO2 permeation through the aqueous layer. This naturally reduces the potential number of protons in the solution and, correspondingly, diminishes the sensor response at high humidity levels.
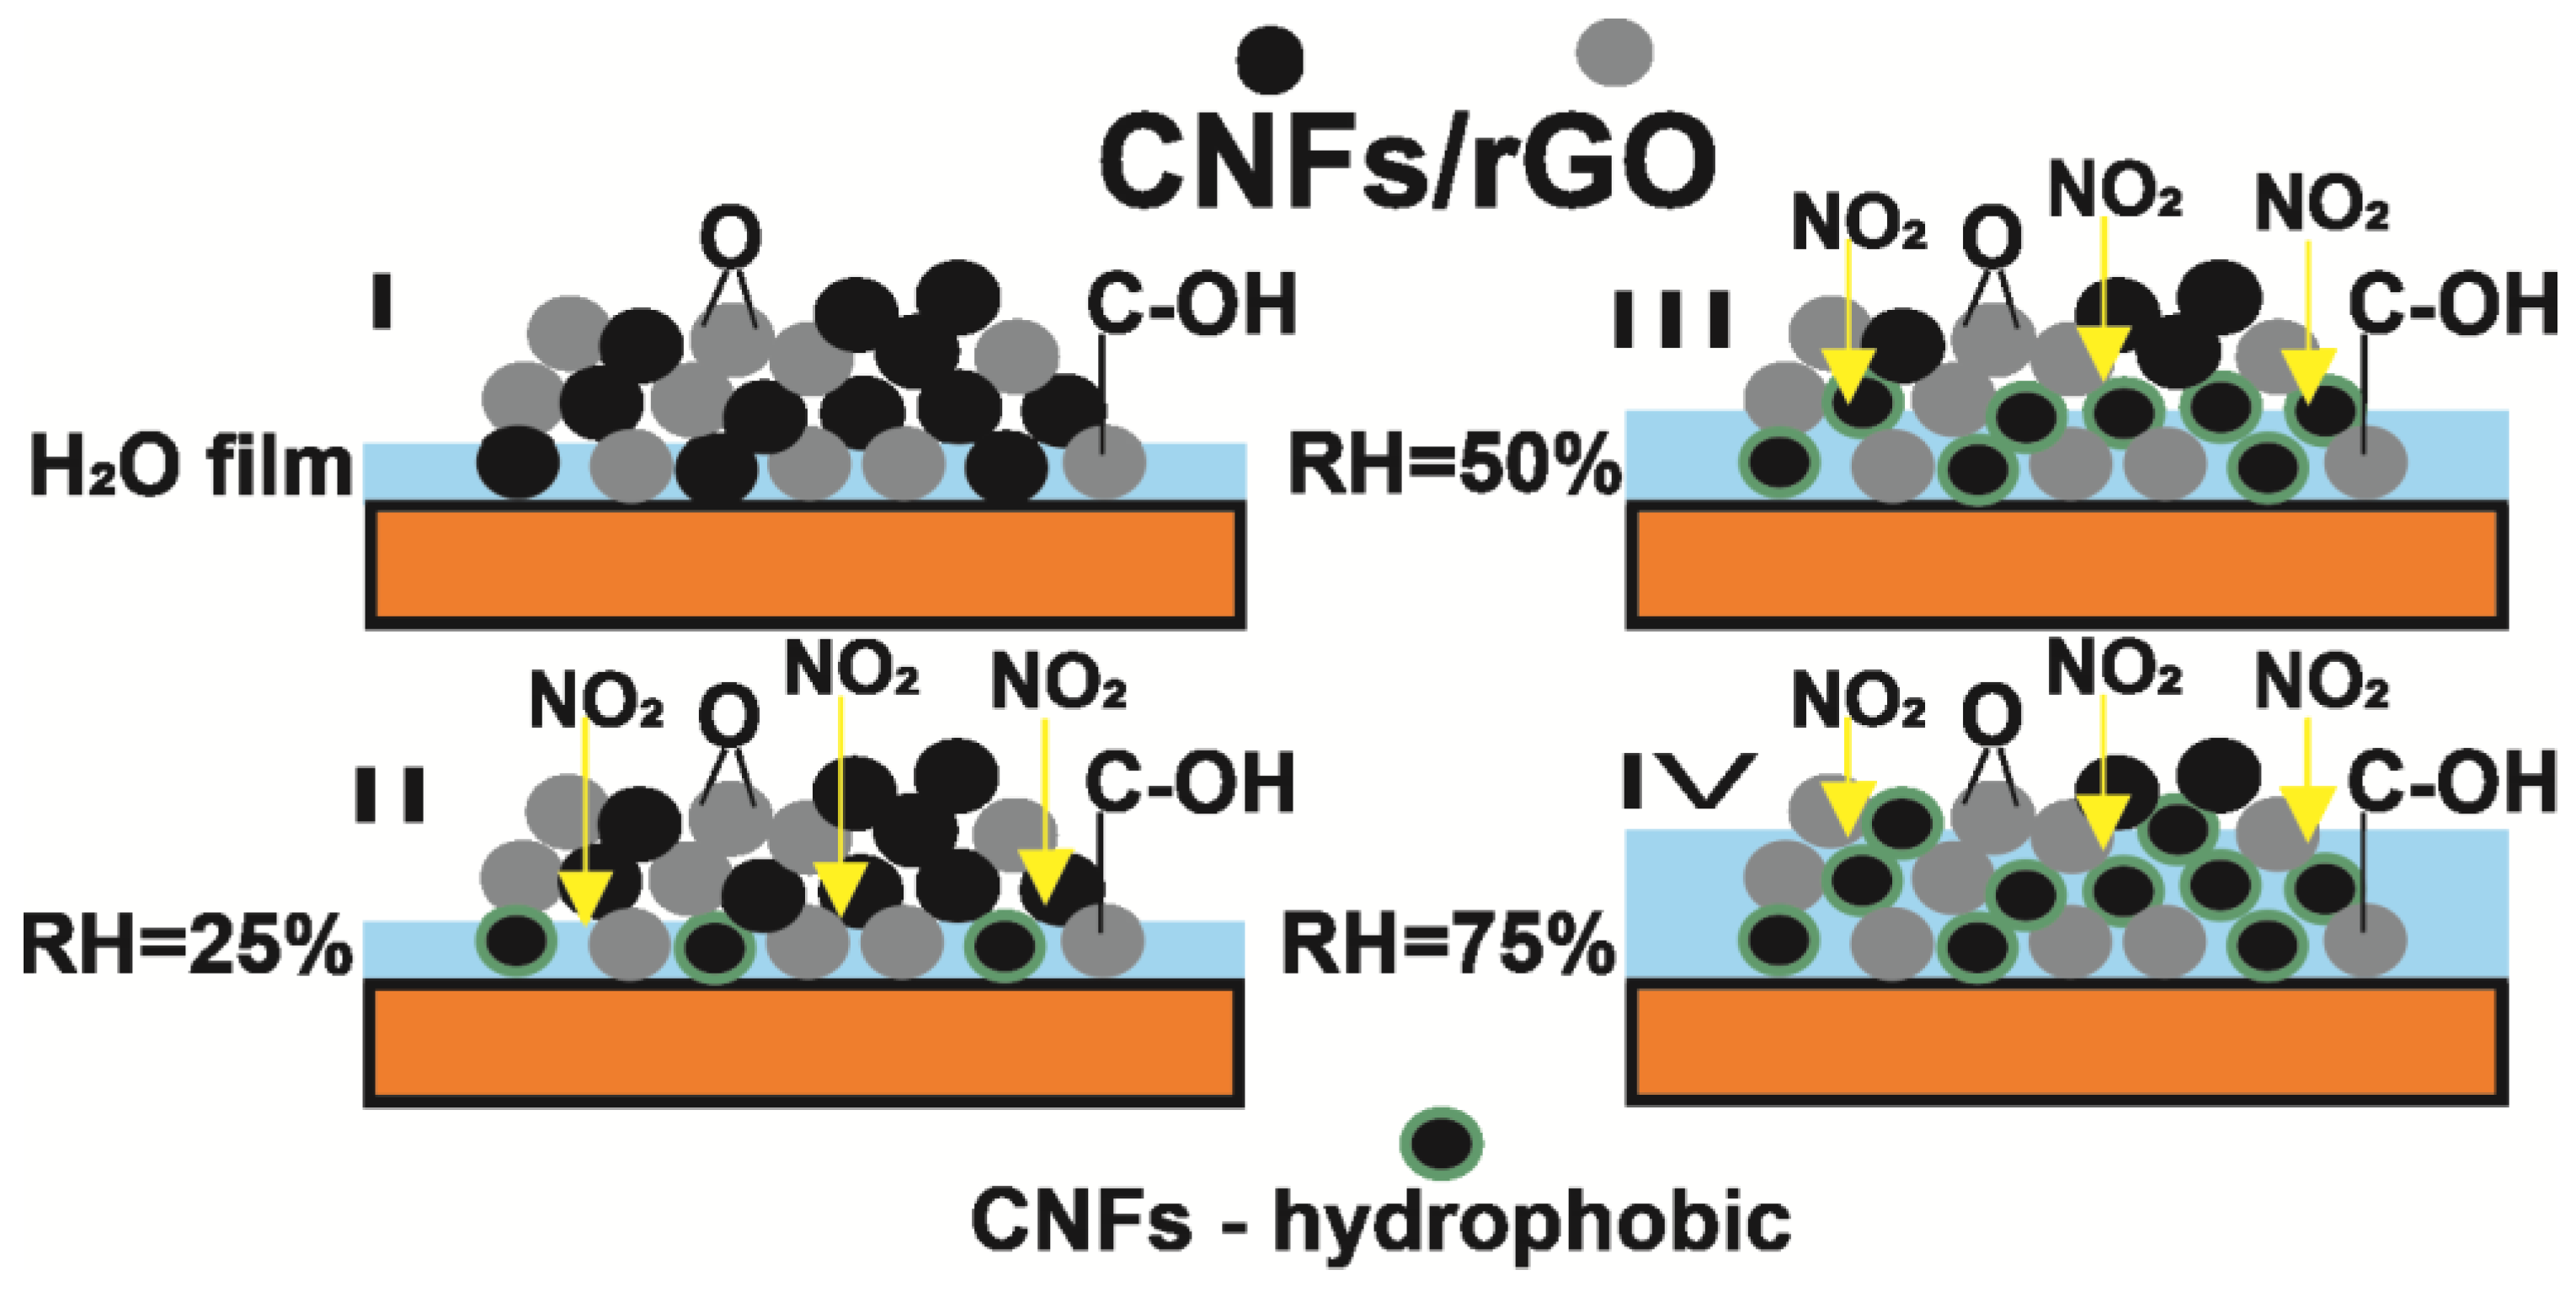
In the case of the CNFs/rGO composite, the number of hydrophilic groups is minimal. The active layer morphology is non-uniform, consisting of numerous granular particles with interstitial void spaces between them. Furthermore, CNFs inherently lack surface functional groups (compared to SWCNTs, which were acid treated). Consequently, the coating structure and weak hydrophilicity prevent the formation of a uniform water film; instead, water “percolates” into the composite inner layers, blocking the active sites of the underlying carbon particles (e.g., aggregates) for NO2. Schematically, the suggested mechanism is shown in Figure 11.
Figure 11. The mechanism of NO2 interaction in humid air with SWNTs/rGO composites.
An increase in humidity leads to a higher concentration of charge carriers, induced by the release of protons (H+) from water. In the air, water vapor and nitrogen dioxide molecules compete for the limited adsorption sites and void spaces on the surface. Under high humidity conditions, water molecules occupy most of these “gaps.” As a result, NO2 molecules have fewer sites for adsorption, and the probability of their interaction with the sensor surface decreases sharply. This directly reduces the magnitude of the response (change in resistance).
The water film occupies the lower layers of the void spaces between the granules of the active material (Figure 11 (I)). When increasing humidity, this film expands (Figure 11 (II–IV)), thereby reducing the exposure of the sensor surface to NO2. The mechanism of NO2 interaction with the composite components in humid air is partially similar, except for the lower proton concentration and pore blockage occurring when increasing humidity.

3.4. Molecular Dynamics Simulations

Figure 12a,b show the NO2/SWCNT/rGO and NO2/CNF/rGO complexes inside the simulation box. The energy fluctuation curve (Figure 12c) demonstrates that the NO2/CNFs/rGO complex exhibits more negative and stable energy compared to the NO2/SWCNTs/rGO complex. This greater stability suggests stronger adsorption interactions between NO2 molecules and the CNFs/rGO surface, which is a critical feature of an efficient gas sensor. Such stability ensures reliable signal generation and consistent sensing performance. The MSD analysis (Figure 12d) reveals that the NO2/CNFs/rGO complex has a higher MSD value (0.6 Å) relative to the NO2/SWCNTs/rGO complex. A higher MSD reflects greater molecular mobility and diffusion of NO2 across the CNFs/rGO surface, thereby increasing the likelihood of gas–surface interactions. These enhanced molecular dynamics contribute to the superior sensitivity of CNFs/rGO as a NO2 sensing material. As depicted in Figure 12e, the Hamiltonian energy (H-energy) of the NO2/CNFs/rGO complex (610 kcal/mol) is considerably higher than that of the NO2/SWCNTs/rGO complex (520 kcal/mol). The higher H-energy indicates stronger binding and interaction strength between NO2 molecules and the CNFs/rGO surface, improving the ability of the sensor to capture and detect gas molecules. This translates into enhanced sensing efficiency. The RDF analysis (Figure 12f,g) further supports these observations, showing shorter interaction distances for the NO2/CNFs/rGO complex compared to the NO2/SWCNTs/rGO complex. Shorter interaction distances reflect tighter adsorption and stronger gas–surface interactions, which are essential for achieving both high sensitivity and selectivity in gas sensing applications. Finally, the temperature fluctuation curve (Figure 12h,i) indicates that the NO2/CNFs/rGO complex maintains greater thermal stability compared to the NO2/SWCNTs/rGO complex. Enhanced thermal stability under fluctuating conditions ensures consistent sensing behavior, further confirming the suitability of CNFs/rGO as a stable and reliable NO2 gas sensor.
Figure 12. (a) NO2/SWCNT/rGO complex and (b) NO2/CNF/rGO complex. (c) Energy fluctuation curve, (d) MSD analysis, and (e) Hamiltonian energy for NO2/CNFs/rGO and NO2/SWCNTs/rGO complexes. RDF analysis for (f) NO2/CNFs/rGO and (g) NO2/SWCNTs/rGO. Temperature fluctuation for (h) NO2/CNFs/rGO and (i) NO2/SWCNTs/rGO.

4. Conclusions

The concentration-dependent sensing behavior was found, confirming that this factor affects the sensor properties and has a significant impact along with sensing material selection. Notably, CNFs at a low suspension concentration (0.75 mg/mL) produced a resistance change three times greater than other samples, owing to the formation of uniform, thin films that facilitate gas access to active sites. While SWCNTs exhibited maximum sensitivity at an optimal concentration of 0.75 mg/mL with −1.68%/ppm, increasing the concentration to 3 mg/mL resulted in faster response times (382 s) and partial recovery. The creation of hybrids based on CNFs with rGO demonstrated remarkable synergistic effects; specifically, CNFs/rGO (1:1 (w/w) ratio) boosted NO2 sensitivity by 50%, reaching an exceptional 49% response. Conversely, SWCNTs/rGO did not show similar improvements, likely due to interfacial energy barriers caused by conductivity mismatches. The comparative analyses of energy fluctuation, MSD, Hamiltonian energy, and RDF clearly demonstrate that CNFs/rGO provides more favorable interaction characteristics with NO2 than SWCNTs/rGO. Overall, our results reveal the layer-dependent sensing behavior of CNF and SWCNT films and showcase the potential of CNFs/rGO hybrids as high-efficiency, energy-saving sensors for industrial and urban NO2 monitoring—an approach with significant implications for chemical engineering, environmental health, and industrial safety.

Supplementary Materials

The following supporting information can be downloaded at https://www.mdpi.com/article/10.3390/chemosensors13110389/s1, Figure S1: Raman spectra of carbon nanomaterials; Figure S2: AFM images of the sensor films on the substrate: (a) SWCNTs 1.5 mg/mL, (b) SWCNTs/rGO 1:1, (c) CNFs 1.5 mg/mL, (d) CNFs/rGO 1:1; Figure S3: Sensor resistance on the concentration of CNFs; Figure S4: Morphology and diagram of films thickness on the boundary with copper electrode (by optical microscopy): SWCNTs, (b) CNFs, (c) SWCNTs/rGO 1:1, (d) CNFs/rGO 1:1; Figure S5: Sensing behavior of SWCNTs/CNFs sensor when contacting with NO2 (at 25 °C); Figure S6: Sensing behavior of sensors to NO2 under humidity impact (at 25 °C): (a) SWCNTs (1.5 mg/mL), (b) SWCNTs/rGO (1:1), (c) CNFs/rGO (1:1); Figure S7: Selectivity tests at room temperature (25 °C, 2% RH); Figure S8: Long-term stability of composite-based sensors under 1.5 ppm NO2 (25 °C, 2% RH); Figure S9: Long-term stability of composite-based sensors under 1.5 ppm NO2 (25°C, 2% RH); Table S1: Thickness of some films based on various carbons (according to AFM).

Author Contributions

Conceptualization, A.G.B., A.D.L., M.K. and A.R.S.; formal analysis, A.D.L. and A.R.S.; investigation, A.D.L., A.R.S., S.A.S., M.K., A.V.U., E.A.M., A.I.B., A.G.B. and D.V.S.; resources, A.D.L., S.A.S., D.I.O., A.V.U., E.A.M., A.I.B. and D.V.S.; data curation, S.A.S., D.I.O., A.V.U., E.A.M., A.I.B. and D.V.S.; writing—original draft preparation, A.G.B., V.G., A.A.S., D.I.O., S.A.S., A.V.U., E.A.M., A.I.B. and D.V.S.; writing—review and editing, A.G.B., S.A.S., D.I.O., A.V.U. V.G., M.K. and A.A.S.; supervision, A.G.B.; project administration, A.G.B.; funding acquisition, A.G.B. All authors have read and agreed to the published version of the manuscript.

Funding

The work (topic of gas sensors) was carried out within the framework of the agreement on the provision of a grant in the form of subsidies from the regional budget of Novosibirsk oblast in accordance with paragraph 4 of Article 78.1 of the Budget Code of the Russian Federation dated 26 October 2023 no. 0000005406995998235121722/no. ML-3, concluded between the Ministry of Science and Innovation Policy of Novosibirsk region and Novosibirsk State Technical University (Sibbionots project).

Institutional Review Board Statement

Not applicable.

Data Availability Statement

Data available on request.

Conflicts of Interest

The authors declare no conflicts of interest.

References

  1. Usmanova, R.M.; Sattarova, N.A.; Boyko, N.N. Influence of Automobiles on Environmental Pollution. IOP Conf. Ser. Mater. Sci. Eng. 2021, 1079, 062040. [Google Scholar] [CrossRef]
  2. Williams, I.D.; Blyth, M. Autogeddon or autoheaven: Environmental and social effects of the automotive industry from launch to present. Sci. Total Environ. 2023, 858, 159987. [Google Scholar] [CrossRef]
  3. Llobet, E. Gas sensors using carbon nanomaterials: A review. Sensors Actuators B Chem. 2013, 179, 32–45. [Google Scholar] [CrossRef]
  4. Onyancha, R.B.; Ukhurebor, K.E.; Aigbe, U.O.; Osibote, O.A.; Kusuma, H.S.; Darmokoesoemo, H.; Balogun, V.A. A systematic review on the detection and monitoring of toxic gases using carbon nanotube-based biosensors. Sens. Bio-Sens. Res. 2021, 34, 100463. [Google Scholar] [CrossRef]
  5. Freddi, S.; Vergari, M.; Pagliara, S.; Sangaletti, L. A Chemiresistor Sensor Array Based on Graphene Nanostructures: From the Detection of Ammonia and Possible Interfering VOCs to Chemometric Analysis. Sensors 2023, 23, 882. [Google Scholar] [CrossRef]
  6. Hejazi, M.A.; Eksik, O.; Taşdelen-Yücedağ, Ç.; Ünlü, C.; Trabzon, L. Carbon-Based Nanomaterials in Gas Sensing Applications; Springer International Publishing: Cham, Switzerland, 2023; Volume 6, ISBN 0123456789. [Google Scholar]
  7. Shahzad, S.; Wang, H.; Li, W.; Sun, Y.; Xie, D.; Ren, T. The Effect of Thin Film Fabrication Techniques on the Performance of rGO Based NO2 Gas Sensors at Room Temperature. Chemosensors 2022, 10, 119. [Google Scholar] [CrossRef]
  8. Fu, L.; Yu, A.M. Carbon nanotubes based thin films: Fabrication, characterization and applications. Rev. Adv. Mater. Sci. 2014, 36, 40–61. [Google Scholar]
  9. Niu, H.; Zhou, H.; Lin, T. 21—Electrospun carbon nanofibers as electrode materials for supercapacitor applications. In Electrospun Polymers and Composites; Dong, Y., Baji, A., Ramakrishna, S., Eds.; Woodhead Publishing Series in Composites Science and Engineering; Woodhead Publishing: Sawston, UK, 2021; pp. 5644–5656. ISBN 978-0-12-819611-3. [Google Scholar]
  10. Zhao, Y.; Huang, B.; Ji, Y.; Yu, Y.; Gao, X.; Zhang, Z.; Fei, H.-F. Porous Carbon Nanofiber Flexible Membranes via a Bottlebrush Copolymer Template for Enhanced High-Performance Supercapacitors. ACS Appl. Mater. Interfaces 2023, 15, 5644–5656. [Google Scholar] [CrossRef]
  11. Wang, Y.; Cui, J.; Qu, Q.; Ma, W.; Li, F.; Du, W.; Liu, K.; Zhang, Q.; He, S.; Huang, C. Free-standing porous carbon nanofiber membranes obtained by one-step carbonization and activation for high-performance supercapacitors. Microporous Mesoporous Mater. 2022, 329, 111545. [Google Scholar] [CrossRef]
  12. Golovakhin, V.; Litvinova, V.I.; Manakhov, A.; Latypova, A.R.; Novgorodtseva, O.N.; Ukhina, A.V.; Ishchenko, A.V.; Al-qasim, A.S.; Maksimovskiy, E.A.; Bannov, A.G. Conductive polymer-multi-walled carbon nanotube composites for gas sensors and supercapacitors. Mater. Today Commun. 2024, 39, 109163. [Google Scholar] [CrossRef]
  13. Golovakhin, V.; Kim, E.Y.; Novgorodtseva, O.N.; Maksimovskiy, E.A.; Ukhina, A.V.; Ishchenko, A.V.; Bannov, A.G. Treatment of Multi-Walled Carbon Nanotubes with Dichromic Acid: Oxidation and Appearance of Intercalation. Membranes 2023, 13, 729. [Google Scholar] [CrossRef]
  14. Vincent, C.; Heintz, J.M.; Silvain, J.F.; Chandra, N. Cu/CNF Nanocomposite Processed By Novel Salt Decomposition Method. Open J. Compos. Mater. 2011, 1, 1–9. [Google Scholar] [CrossRef]
  15. Sharafeldin, I.; Garcia-Rios, S.; Ahmed, N.; Alvarado, M.; Vilanova, X.; Allam, N.K. Metal-decorated carbon nanotubes-based sensor array for simultaneous detection of toxic gases. J. Environ. Chem. Eng. 2021, 9, 104534. [Google Scholar] [CrossRef]
  16. Naganaboina, V.R.; Singh, S.G. Graphene-CeO2 based flexible gas sensor: Monitoring of low ppm CO gas with high selectivity at room temperature. Appl. Surf. Sci. 2021, 563, 150272. [Google Scholar] [CrossRef]
  17. Mäklin, J.; Mustonen, T.; Halonen, N.; Tóth, G.; Kordás, K.; Vähäkangas, J.; Moilanen, H.; Kukovecz, Á.K.; Kónya, Z.; Haspel, H.; et al. Inkjet printed resistive and chemical-FET carbon nanotube gas sensors. Phys. Status Solidi Basic Res. 2008, 245, 2335–2338. [Google Scholar] [CrossRef]
  18. Kim, S.; Lee, K.H.; Lee, J.Y.; Kim, K.K.; Choa, Y.H.; Lim, J.H. Single-Walled Carbon Nanotube-Based Chemi-Capacitive Sensor for Hexane and Ammonia. Electron. Mater. Lett. 2019, 15, 712–719. [Google Scholar] [CrossRef]
  19. Tang, Q.B.; Guo, Y.J.; Tang, Y.L.; Long, G.D.; Wang, J.L.; Li, D.J.; Zu, X.T.; Ma, J.Y.; Wang, L.; Torun, H.; et al. Highly sensitive and selective Love mode surface acoustic wave ammonia sensor based on graphene oxides operated at room temperature. J. Mater. Sci. 2019, 54, 11925–11935. [Google Scholar] [CrossRef]
  20. Yu, C.; Wu, Y.; Liu, X.; Fu, F.; Gong, Y.; Rao, Y.J.; Chen, Y. Miniature fiber-optic NH3 gas sensor based on Pt nanoparticle-incorporated graphene oxide. Sensors Actuators B Chem. 2017, 244, 107–113. [Google Scholar] [CrossRef]
  21. Li, X.; Chen, X.; Yao, Y.; Li, N.; Chen, X. High-stability quartz crystal microbalance ammonia sensor utilizing graphene oxide isolation layer. Sensors Actuators B Chem. 2014, 196, 183–188. [Google Scholar] [CrossRef]
  22. Meyyappan, M. Carbon Nanotube-Based Chemical Sensors. Small 2016, 12, 2118–2129. [Google Scholar] [CrossRef] [PubMed]
  23. Kaloumenou, M.; Skotadis, E.; Lagopati, N.; Efstathopoulos, E.; Tsoukalas, D. Breath Analysis: A Promising Tool for Disease Diagnosis—The Role of Sensors. Sensors 2022, 22, 1238. [Google Scholar] [CrossRef]
  24. Valentini, L.; Armentano, I.; Kenny, J.M.; Cantalini, C.; Lozzi, L.; Santucci, S. Sensors for sub-ppm NO2 gas detection based on carbon nanotube thin films. Appl. Phys. Lett. 2003, 82, 961–963. [Google Scholar] [CrossRef]
  25. Usman, F.; Ghazali, K.H.; Muda, R.; Dennis, J.O.; Ibnaouf, K.H.; Aldaghri, O.A.; Alsadig, A.; Johari, N.H.; Jose, R. Detection of Kidney Complications Relevant Concentrations of Ammonia Gas Using Plasmonic Biosensors: A Review. Chemosensors 2023, 11, 119. [Google Scholar] [CrossRef]
  26. Deng, S.; Tjoa, V.; Fan, H.M.; Tan, H.R.; Sayle, D.C.; Olivo, M.; Mhaisalkar, S.; Wei, J.; Sow, C.H. Reduced graphene oxide conjugated Cu2O nanowire mesocrystals for high-performance NO2 gas sensor. J. Am. Chem. Soc. 2012, 134, 4905–4917. [Google Scholar] [CrossRef] [PubMed]
  27. Mendes, R.G.; Wróbel, P.S.; Bachmatiuk, A.; Sun, J.; Gemming, T.; Liu, Z.; Rümmeli, M.H. Carbon nanostructures as a multi-functional platform for sensing applications. Chemosensors 2018, 6, 60. [Google Scholar] [CrossRef]
  28. Zhang, F.; Yuan, C.; Zhu, J.; Wang, J.; Zhang, X.; Lou, X.W. Flexible films derived from electrospun carbon nanofibers incorporated with Co3O4 hollow nanoparticles as self-supported electrodes for electrochemical capacitors. Adv. Funct. Mater. 2013, 23, 3909–3915. [Google Scholar] [CrossRef]
  29. Randeniya, L.K.; Martin, P.J.; Bendavid, A.; McDonnell, J. Ammonia sensing characteristics of carbon-nanotube yarns decorated with nanocrystalline gold. Carbon 2011, 49, 5265–5270. [Google Scholar] [CrossRef]
  30. Feng, X.; Irle, S.; Witek, H.; Morokuma, K.; Vidic, R.; Borguet, E. Sensitivity of ammonia interaction with single-walled carbon nanotube bundles to the presence of defect sites and functionalities. J. Am. Chem. Soc. 2005, 127, 10533–10538. [Google Scholar] [CrossRef]
  31. Mangu, R.; Rajaputra, S.; Clore, P.; Qian, D.; Andrews, R.; Singh, V.P. Ammonia sensing properties of multiwalled carbon nanotubes embedded in porous alumina templates. Mater. Sci. Eng. B 2010, 174, 2–8. [Google Scholar] [CrossRef]
  32. Rigoni, F.; Tognolini, S.; Borghetti, P.; Drera, G.; Pagliara, S.; Goldoni, A.; Sangaletti, L. Enhancing the sensitivity of chemiresistor gas sensors based on pristine carbon nanotubes to detect low-ppb ammonia concentrations in the environment. Analyst 2013, 138, 7392–7399. [Google Scholar] [CrossRef]
  33. Bekyarova, E.; Davis, M.; Burch, T.; Itkis, M.E.; Zhao, B.; Sunshine, S.; Haddon, R.C. Chemically Functionalized Single-Walled Carbon Nanotubes as Ammonia Sensors. J. Phys. Chem. B 2004, 108, 19717–19720. [Google Scholar] [CrossRef]
  34. Sidek, R.M.; Yusof, F.A.M.; Yasin, F.M.; Wagiran, R.; Ahmadun, F. Electrical response of multi-walled carbon nanotubes to ammonia and carbon dioxide. In Proceedings of the 2010 IEEE International Conference on Semiconductor Electronics, Malacca, Malaysia, 28–30 June 2010; pp. 263–266. [Google Scholar] [CrossRef]
  35. Kombarakkaran, J.; Clewett, C.F.M.; Pietraß, T. Ammonia adsorption on multi-walled carbon nanotubes. Chem. Phys. Lett. 2007, 441, 282–285. [Google Scholar] [CrossRef]
  36. Han, J.-W.W.; Kim, B.; Li, J.; Meyyappan, M. A carbon nanotube based ammonia sensor on cellulose paper. RSC Adv. 2014, 4, 549. [Google Scholar] [CrossRef]
  37. Sharma, A.; Tomar, M.; Gupta, V. Room temperature trace level detection of NO2 gas using SnO2 modified carbon nanotubes based sensor. J. Mater. Chem. 2012, 22, 23608. [Google Scholar] [CrossRef]
  38. Peng, S.; Cho, K.; Qi, P.; Dai, H. Ab initio study of CNT NO2 gas sensor. Chem. Phys. Lett. 2004, 387, 271–276. [Google Scholar] [CrossRef]
  39. Li, X.; Liu, J.; Zhu, C. Various characteristic of Carbon nanotubes film methane Gas sensor. In Proceedings of the 2006 1st IEEE International Conference on Nano/Micro Engineered and Molecular Systems, Zhuhai, China, 18–21 January 2006; IEEE: Piscataway, NJ, USA, 2016; pp. 1453–1456. [Google Scholar]
  40. Lanka, S. Hydrogen and Methane Gas Sensors Synthesis of Multi-Walled Carbon Nanotubes P. Samarasekara. 2009, 47, 361–369. [Google Scholar]
  41. Dai, H.; Xiao, P.; Lou, Q. Application of SnO2/MWCNTs nanocomposite for SF6 decomposition gas sensor. Phys. Status Solidi 2011, 208, 1714–1717. [Google Scholar] [CrossRef]
  42. Li, H.; Zhang, J.; Li, G.; Tan, F.; Liu, R.; Li, R.; Zhang, T.; Jin, H.; Li, Q. Triton assisted fabrication of uniform semiconducting single-walled carbon nanotube networks for highly sensitive gas sensors. Carbon 2014, 66, 369–376. [Google Scholar] [CrossRef]
  43. Mendoza, F.; Hernández, D.M.; Makarov, V.; Febus, E.; Weiner, B.R.; Morell, G. Room temperature gas sensor based on tin dioxide-carbon nanotubes composite films. Sensors Actuators B Chem. 2014, 190, 227–233. [Google Scholar] [CrossRef]
  44. Ong, K.G.; Grimes, C.A. A Carbon Nanotube-based Sensor for CO2 Monitoring. Sensors 2001, 1, 193–205. [Google Scholar] [CrossRef]
  45. Desmaris, V.; Saleem, M.A.; Shafiee, S. Examining carbon nanofibers: Properties, growth, and applications. IEEE Nanotechnol. Mag. 2015, 9, 33–38. [Google Scholar] [CrossRef]
  46. Wang, Z.; Wu, S.; Wang, J.; Yu, A.; Wei, G. Carbon nanofiber-based functional nanomaterials for sensor applications. Nanomaterials 2019, 9, 1045. [Google Scholar] [CrossRef]
  47. Bannov, A.G.; Lapekin, N.I.; Kurmashov, P.B.; Ukhina, A.V.; Manakhov, A. Room-Temperature NO2 Gas Sensors Based on Granulated Carbon Nanofiber Material. Chemosensors 2022, 10, 525. [Google Scholar] [CrossRef]
  48. Shooshtari, M. Gold-decorated vertically aligned carbon nanofibers for high-performance room-temperature ethanol sensing. Microchim. Acta 2025, 192, 517. [Google Scholar] [CrossRef]
  49. Bannov, A.G.; Jašek, O.; Prášek, J.; Buršík, J.; Zajíčková, L. Enhanced ammonia adsorption on directly deposited nanofibrous carbon films. J. Sensors 2018, 2018, 7497619. [Google Scholar] [CrossRef]
  50. Venegas, C.J.; Bollo, S.; Sierra-Rosales, P. Carbon-Based Electrochemical (Bio)sensors for the Detection of Carbendazim: A Review. Micromachines 2023, 14, 1752. [Google Scholar] [CrossRef]
  51. Predtechenskiy, M.R.; Khasin, A.A.; Bezrodny, A.E.; Bobrenok, O.F.; Dubov, D.Y.; Muradyan, V.E.; Saik, V.O.; Smirnov, S.N. New perspectives in SWCNT applications: Tuball SWCNTs. Part 1. Tuball by itself—All you need to know about it. Carbon Trends 2022, 8, 100175. [Google Scholar] [CrossRef]
  52. Bannov, A.G.; Popov, M.V.; Kurmashov, P.B. Thermal analysis of carbon nanomaterials: Advantages and problems of interpretation. J. Therm. Anal. Calorim. 2020, 142, 349–370. [Google Scholar] [CrossRef]
  53. Ferrari, A.C.; Robertson, J. Interpretation of Raman spectra of disordered and amorphous carbon. Phys. Rev. B 2000, 61, 14095–14107. [Google Scholar] [CrossRef]
  54. Ferrari, A.; Robertson, J. Resonant Raman spectroscopy of disordered, amorphous, and diamondlike carbon. Phys. Rev. B 2001, 64, 075414. [Google Scholar] [CrossRef]
  55. Han, D.; Zhai, L.; Gu, F.; Wang, Z. Highly sensitive NO2 gas sensor of ppb-level detection based on In2O3 nanobricks at low temperature. Sensors Actuators B Chem. 2018, 262, 655–663. [Google Scholar] [CrossRef]
  56. Vaghela, C.; Kulkarni, M.; Haram, S.; Karve, M.; Aiyer, R. Biopolymer-Polyaniline Composite for a Wide Range Ammonia Gas Sensor. IEEE Sens. J. 2016, 16, 4318–4325. [Google Scholar] [CrossRef]
  57. Na, W.; Kim, J.; Kim, Y.K.; Kim, S.G.; Jang, J. Fluorination of shape-controlled porous carbon nanoweb layers for ammonia gas sensor application. Carbon 2020, 165, 185–195. [Google Scholar] [CrossRef]
  58. Khajavian, M.; Ismail, S.; Afshari, M. Surface functionalization of the all-triazine C3N3 framework for efficient As5+ adsorption: Experimental, density functional theory, and molecular dynamics. Sep. Purif. Technol. 2025, 373, 133611. [Google Scholar] [CrossRef]
  59. Al-Ostaz, A.; Pal, G.; Mantena, P.R.; Cheng, A. Molecular dynamics simulation of SWCNT–polymer nanocomposite and its constituents. J. Mater. Sci. 2008, 43, 164–173. [Google Scholar] [CrossRef]
  60. Mazo, M.A.; Sanguino, J.; Martín-Gullón, I.; Rubio, J. Formation of carbon nanofibers with Ni catalyst supported on a micro-mesoporous glass. Microporous Mesoporous Mater. 2021, 323, 111168. [Google Scholar] [CrossRef]
  61. Predtechenskiy, M.R.; Khasin, A.A.; Smirnov, S.N.; Bezrodny, A.E.; Bobrenok, O.F.; Dubov, D.Y.; Kosolapov, A.G.; Lyamysheva, E.G.; Muradyan, V.E.; Saik, V.O.; et al. New Perspectives in SWCNT Applications: Tuball SWCNTs. Part 2. New Composite Materials Through Augmentation with Tuball. Carbon Trends 2022, 8, 100176. [Google Scholar] [CrossRef]
  62. Brusko, V.; Khannanov, A.; Rakhmatullin, A.; Dimiev, A.M. Unraveling the infrared spectrum of graphene oxide. Carbon 2024, 229, 119507. [Google Scholar] [CrossRef]
  63. Hsieh, Y.C.; Chou, Y.C.; Lin, C.P.; Hsieh, T.F.; Shu, C.M. Thermal analysis of multi-walled carbon nanotubes by Kissinger’s corrected kinetic equation. Aerosol Air Qual. Res. 2010, 10, 212–218. [Google Scholar] [CrossRef]
  64. Sohn, Y.; Kim, D.G.; Lee, J.H.; Lee, S.; Hwang, I.S.; Lee, S.H.; Yoo, S.J.; Kim, P. Defect-controlled Fe-N-doped carbon nanofiber by ball-milling for oxygen reduction reaction. Korean J. Chem. Eng. 2020, 37, 938–945. [Google Scholar] [CrossRef]
  65. Drewniak, S.; Drewniak, Ł.; Pustelny, T. Mechanisms of NO2 Detection in Hybrid Structures Containing Reduced Graphene Oxide: A Review. Sensors 2022, 22, 5316. [Google Scholar] [CrossRef]
  66. Sysoev, V.I.; Yamaletdinov, R.D.; Plyusnin, P.E.; Okotrub, A.V.; Bulusheva, L.G. Adsorption kinetics of NO2 gas on oxyfluorinated graphene film. Phys. Chem. Chem. Phys. 2023, 25, 2084–2089. [Google Scholar] [CrossRef] [PubMed]
  67. Li, W.; Lefferts, M.J.; Wang, Y.; Lister, A.M.; Forssberg, A.; Chen, R.; Wang, L.; Castell, M.R. Chemiresistive Polymer Percolation Network Gas Sensor Created with a Nanosphere Template. Adv. Mater. Interfaces 2023, 10, 2202042. [Google Scholar] [CrossRef]
  68. Shin, W.; Jung, G.; Hong, S.; Jeong, Y.; Park, J.; Kim, D.; Jang, D.; Kwon, D.; Bae, J.-H.; Park, B.-G.; et al. Proposition of deposition and bias conditions for optimal signal-to-noise-ratio in resistor- and FET-type gas sensors. Nanoscale 2020, 12, 19768–19775. [Google Scholar] [CrossRef] [PubMed]
  69. Li, W.; Wang, L.; Cai, Y.; Pan, P.; Li, J.; Ren, Q.; Xu, J. Enhanced Humidity Sensing Response of SnO2/Silicon Nanopillar Array by UV Irradiation. Sensors 2019, 19, 2141. [Google Scholar] [CrossRef] [PubMed]
  70. Peng, Y.; Zhao, Y.; Yuan, Y.; Meng, W.; Jiang, W.; Wang, X. High-response humidity sensing with graphene oxide/lignosulfonate and laser-induced graphene for respiratory health. RSC Adv. 2025, 15, 11739–11748. [Google Scholar] [CrossRef]
  71. Du, H.; Xie, G.; Su, Y.; Tai, H.; Du, X.; Yu, H.; Zhang, Q. A New Model and Its Application for the Dynamic Response of RGO Resistive Gas Sensor. Sensors 2019, 19, 889. [Google Scholar] [CrossRef]
  72. Piloto, C.; Mirri, F.; Bengio, E.A.; Notarianni, M.; Gupta, B.; Shafiei, M.; Pasquali, M.; Motta, N. Room temperature gas sensing properties of ultrathin carbon nanotube films by surfactant-free dip coating. Sensors Actuators B Chem. 2016, 227, 128–134. [Google Scholar] [CrossRef]
  73. Ma, X.F.; Xie, G.Z.; Su, Y.J.; Du, H.F.; Xie, T.; Jiang, Y.D. Polyvinylpyrrolidone/graphene oxide thin films coated on quartz crystal microbalance electrode for NH3 detection at room temperature. Sci. China Technol. Sci. 2016, 59, 1377–1382. [Google Scholar] [CrossRef]
  74. Pisarkiewicz, T.; Maziarz, W.; Małolepszy, A.; Stobiński, L.; Michoń, D.A.; Szkudlarek, A.; Pisarek, M.; Kanak, J.; Rydosz, A. Nitrogen dioxide sensing using multilayer structure of reduced graphene oxide and α-Fe2O3. Sensors 2021, 21, 1011. [Google Scholar] [CrossRef]
  75. Kumar, S.; Dmitrieva, V.A.; Meng, G.; Evlashin, S.A.; Sukhanova, E.V.; Kvashnin, D.G.; Popov, Z.I.; Bannov, A.G.; Fedorov, F.S.; Nasibulin, A.G. Structured Graphene Oxide/Reduced Graphene Oxide Interfaces for Improved NO2 Sensing. ACS Appl. Nano Mater. 2023, 6, 14083–14093. [Google Scholar] [CrossRef]
  76. Chae, M.; Lee, D.; Kim, H.D. Dynamic Response and Swift Recovery of Filament Heater-Integrated Low-Power Transparent CNT Gas Sensor. Adv. Funct. Mater. 2024, 34, 2405260. [Google Scholar] [CrossRef]
  77. Nasriddinov, A.; Rumyantseva, M.; Konstantinova, E.; Marikutsa, A.; Tokarev, S.; Yaltseva, P.; Fedorova, O.; Gaskov, A. Effect of Humidity on Light-Activated NO and NO2 Gas Sensing by Hybrid Materials. Nanomaterials 2020, 10, 915. [Google Scholar] [CrossRef]
  78. Yan, W.; Worsley, M.A.; Pham, T.; Zettl, A.; Carraro, C.; Maboudian, R. Effects of ambient humidity and temperature on the NO2 sensing characteristics of WS2/graphene aerogel. Appl. Surf. Sci. 2018, 450, 372–379. [Google Scholar] [CrossRef]
  79. Wang, Z.; Xiao, Y.; Cui, X.; Cheng, P.; Wang, B.; Gao, Y.; Li, X.; Yang, T.; Zhang, T.; Lu, G. Humidity-Sensing Properties of Urchinlike CuO Nanostructures Modified by Reduced Graphene Oxide. ACS Appl. Mater. Interfaces 2014, 6, 3888–3895. [Google Scholar] [CrossRef]
  80. Peng, N.; Zhang, Q.; Chow, C.L.; Tan, O.K.; Marzari, N. Sensing Mechanisms for Carbon Nanotube Based NH3 Gas Detection. Nano Lett. 2009, 9, 1626–1630. [Google Scholar] [CrossRef]
  81. Kyokunzire, P.; Zaraket, J.; Teresa, M.; Fierro, V.; Celzard, A. p-/n-type conduction in activated carbon NO2 sensors with enhanced low-concentration sensitivity at room temperature. Carbon 2026, 246, 120891. [Google Scholar] [CrossRef]
  82. Travlou, N.A.; Rodríguez-Castellón, E.; Bandosz, T.J. Sensing of NH3 on heterogeneous nanoporous carbons in the presence of humidity. Carbon 2016, 100, 64–73. [Google Scholar] [CrossRef]
  83. Ogawa, T.; Kamiguchi, K.; Tamaki, T.; Imai, H.; Yamaguchi, T. Differentiating Grotthuss proton conduction mechanisms by nuclear magnetic resonance spectroscopic analysis of frozen samples. Anal. Chem. 2014, 86, 9362–9366. [Google Scholar] [CrossRef]
  84. Yan, X.; Xu, Z.; Yuan, S.; Han, A.; Shen, Y.; Cheng, X.; Liang, Y.; Shen, S.; Zhang, J. Structural and transport properties of ultrathin perfluorosulfonic acid ionomer film in proton exchange membrane fuel cell catalyst layer: A review. J. Power Sources 2022, 536, 231523. [Google Scholar] [CrossRef]
Disclaimer/Publisher’s Note: The statements, opinions and data contained in all publications are solely those of the individual author(s) and contributor(s) and not of MDPI and/or the editor(s). MDPI and/or the editor(s) disclaim responsibility for any injury to people or property resulting from any ideas, methods, instructions or products referred to in the content.

Article Metrics

Citations

Article Access Statistics

Multiple requests from the same IP address are counted as one view.